1. Introduction
Blood pressure levels are being simultaneously affected by multiple internal and external factors that require continuous activity of several regulatory mechanisms to keep its levels within a certain homeostatic range. Among multiple mechanisms that are involved in the regulation of blood pressure, arterial baroreceptor reflex or simply, baroreflex, appears one of the key mechanisms that govern short-term feedback responses to various physical stresses such as exercise, adaptation to the changes in the body position, reactions to drugs, changes in the subject’s mental conditions and so on. The increase of blood pressure is sensed by baroreceptors located in blood vessels that in turn invoke a response by the autonomous nervous system. The response is generally twofold, including the decrease of heart rate and the reduction of the vascular resistance, both leading to the consequent drop of blood pressure. Thus the efficacy of this feedback mechanism largely determines timely and adequate responses to the changes in blood pressure.
Over a long time quantitative assessment of the short-term blood pressure—heart rate feedback regulation efficacy has been limited to the analysis of the baroreflex sensitivity (BRS) defined as the measure of the relative change of the pulse interval (in ms) in response to the change in the systolic blood pressure (in mmHg), altogether measured in (ms/mmHg). Historically, BRS was first measured as the increase in the pulse interval to the pharmacologically induced increase in blood pressure that guaranteed the feedback mechanism activation for a certain time fragment, with the BRS being quantified by the linear regression coefficient of pulse intervals on blood pressure over this time fragment. In the last three decades, several methods to measure BRS from simultaneously recorded spontaneous fluctuations of both pulse intervals and blood pressure without applying any external stimuli have been suggested. The most common time-domain approach, often termed as the sequence method, simply focuses on finding time fragments where both pulse intervals and blood pressure either increase or decrease consecutively and monotonously over several heartbeat cycles, sometimes referred to as baroreflex sequences. Next for each time fragment a linear regression coefficient of pulse intervals on blood pressure is calculated, representing the local BRS estimate [
1,
2]. To improve the accuracy, averaging over several baroreflex sequences is usually performed, at the cost of lower temporal resolution. In contrast, spectral-based methods do not require selection of certain time fragments, instead focusing on the blood pressure—pulse intervals transfer function analysis in a certain frequency band where the coherence between them exceeds a certain threshold [
3,
4,
5]. To overcome the common drawback of both methods, in particular their limited performance under non-stationary conditions such as stress tests, modified methods based on first differences analysis have been suggested [
6]. Combined with the advances of non-invasive blood pressure measurement techniques, these methods made BRS one of the routinely measured parameters both in clinical and ambulatory settings [
7].
BRS has been reported as a highly informative prognostic marker widely applicable in both ambulatory and clinical investigations. In particular, BRS appeared highly predictive of cardiac mortality in post-infarction patients with both reduced ejection fraction [
8] as well as preserved left ventricular function [
9] including those receiving β-blocker treatment [
10] as well as in patients with life-threatening arrhythmias [
11], see also [
12]. BRS impairment has been also reported as an early indicator of autonomic dysfunction and autonomic failure [
13]. In earlier studies, BRS has been shown to exhibit significant changes under exercise as well as postural and other physical stresses [
14,
15,
16,
17], while more recent data indicate that these effects are temporary and after a certain adaptation period the baroreflex exhibits a resetting around new absolute blood pressure and pulse interval values [
18,
19,
20]. However, successful baroreflex resetting has notable exceptions with one such observed recently in diabetes patients with certain complications, particularly with obesity who exhibited significant baroreflex impairment [
21].
While the BRS quantifies explicitly the response of the heart rate to the changes in blood pressure, it does not contain any information whether there was such a response to every significant variation of blood pressure. Time-domain methods simply disregard time intervals without significant changes of heart rate irrelevant to the fact whether there were blood pressure variations, while spectral methods provide characteristics that are averaged over a given frequency band within the entire analysis window. In turn, another alternative method [
22] measures the average heart rate acceleration or deceleration, while not considering whether it occurred in response to significant blood pressure variations or not. Thus, neither of them can guarantee that all blood pressure variations were adequately responded. However, a timely response to the changes in blood pressure is essential for homeostasis, since missing or delayed responses lead to the increased blood pressure variability. In contrast, there is recent evidence that baroreflex activation therapy using implantable devices that stimulates carotid baroreceptors significantly improved the blood pressure control efficacy [
23]. Accordingly, additionally to the measurement of the BRS itself, it is also important to quantify the activation of the feedback mechanism in response to blood pressure variations.
In this paper, we suggest a series of complementary indicators of the blood pressure—heart rate feedback regulation based on their mutual synchronization patterns. Investigation of the physiological signals’ mutual synchronization is widely used in chronobiological studies appearing essential for a deeper understanding of the mechanisms related to the influence of various external factors such as geomagnetic field variations, solar cycles, jetlag or night shifts [
24,
25,
26]. Recent examples include the synchronization analysis of heart rate and respiration during different sleep phases [
27,
28,
29]. While in most cases relation between rhythms with certain quasi-periodic structure is studied, such as breathing cycles modulating heartbeat cycles, we go beyond that and, while following conceptually similar methodology, modify the synchronization analysis methodology to suite the blood pressure—pulse interval analysis that both exhibit rather stochastic behavior, as indicated below. Particular mutual synchronization metrics used here follow a recent study where their performance has been validated using simulated datasets with non-periodic structure and correlation patterns reminiscent to those typically observed in physiological signals [
30].
2. Materials and Methods
2.1. Subjects and Clinical Investigation Protocol
All recordings were obtained at the Almazov National Medical Research Centre in accordance with the ethical standards presented in the Declaration of Helsinki. The study protocol was reviewed and approved by the Ethics Committee of the Almazov National Medical Research Centre (Ref. No. 110, approval date 12 June 2010) before the beginning of the study. All patients and volunteers provided their informed consent in written form prior to their participation in the study.
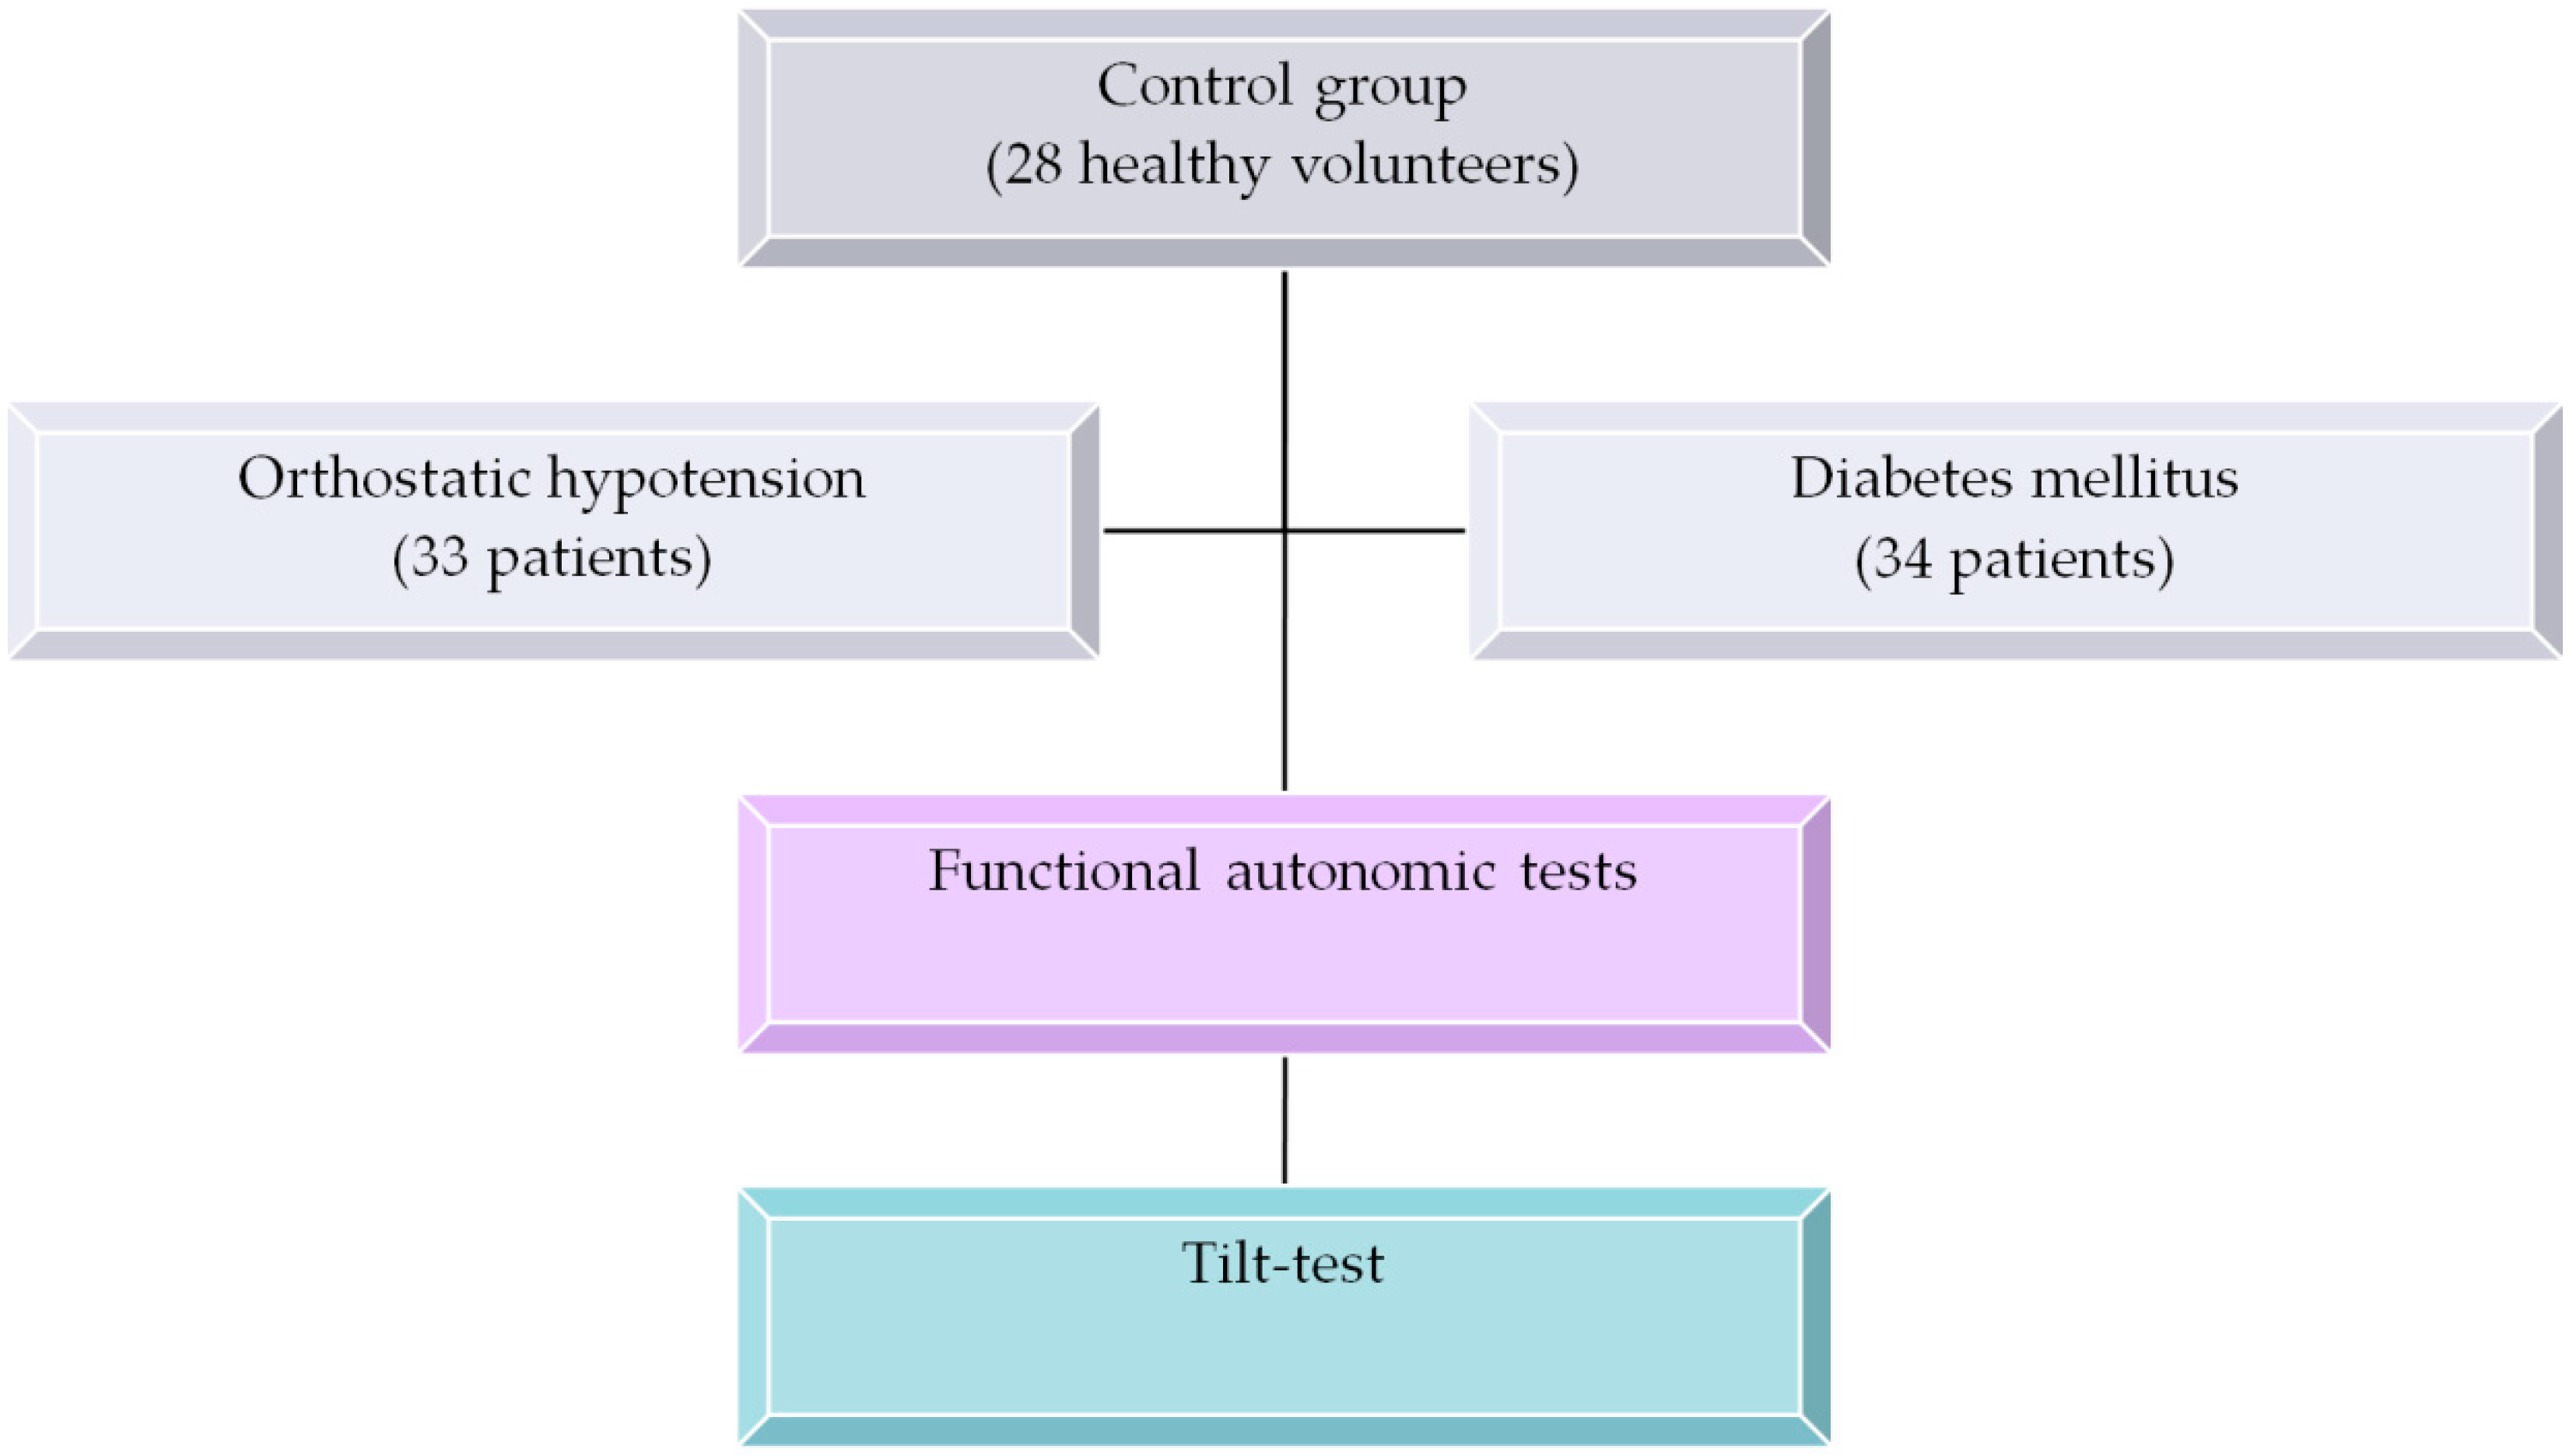
The study included 95 subjects subdivided into three groups:
- −
Group 1 included 33 patients aged 39.4 ± 17.5 years old with either classic or gradual orthostatic hypotension with orthostatic systolic blood pressure (SBP) reduction by at least 20 mmHg and/or by diastolic blood pressure reduction by at least 10 mmHg within three minutes of the orthostatic compared to the initial (supine) position. Functional tests performed prior to the tilt test indicated that most patients in this group demonstrated moderate autonomic dysfunction (see
Table 1 for the functional autonomic tests results);
- −
Group 2 included 34 diabetes mellitus patients aged 52.7 ± 10.9 years old with autonomic neuropathy diagnosed by functional autonomic tests as indicated in [
31,
32] that were performed prior to the tilt test. Only patients with at least two (out of seven) reduced functional autonomic test responses (for further details, see the functional tests specification below) were considered. All diabetes patients received standard combination therapy of blood sugar reducing drugs, including glitazones, gliptins, metformin and sulfonylureas, while receiving no specific therapy of autonomic function within one month before the study;
- −
Group 3 contained of 28 healthy volunteers aged 41.2 ± 11.1 years old.
Prior to the tilt-test all patients and volunteers underwent standard functional autonomic tests. A comprehensive assessment of autonomic regulation of blood circulation included the following tests:
Valsalva maneuver (cardiac component);
Valsalva maneuver (vasomotor component);
Deep breathing test;
Hand-grip test;
Cold-stress induced vasoconstriction for evaluation reaction of the forearm vessels while cooling the skin of the upper chest for 2 min;
Spontaneous arterial baroreflex (ABR);
Spectral power of heart rate variability.
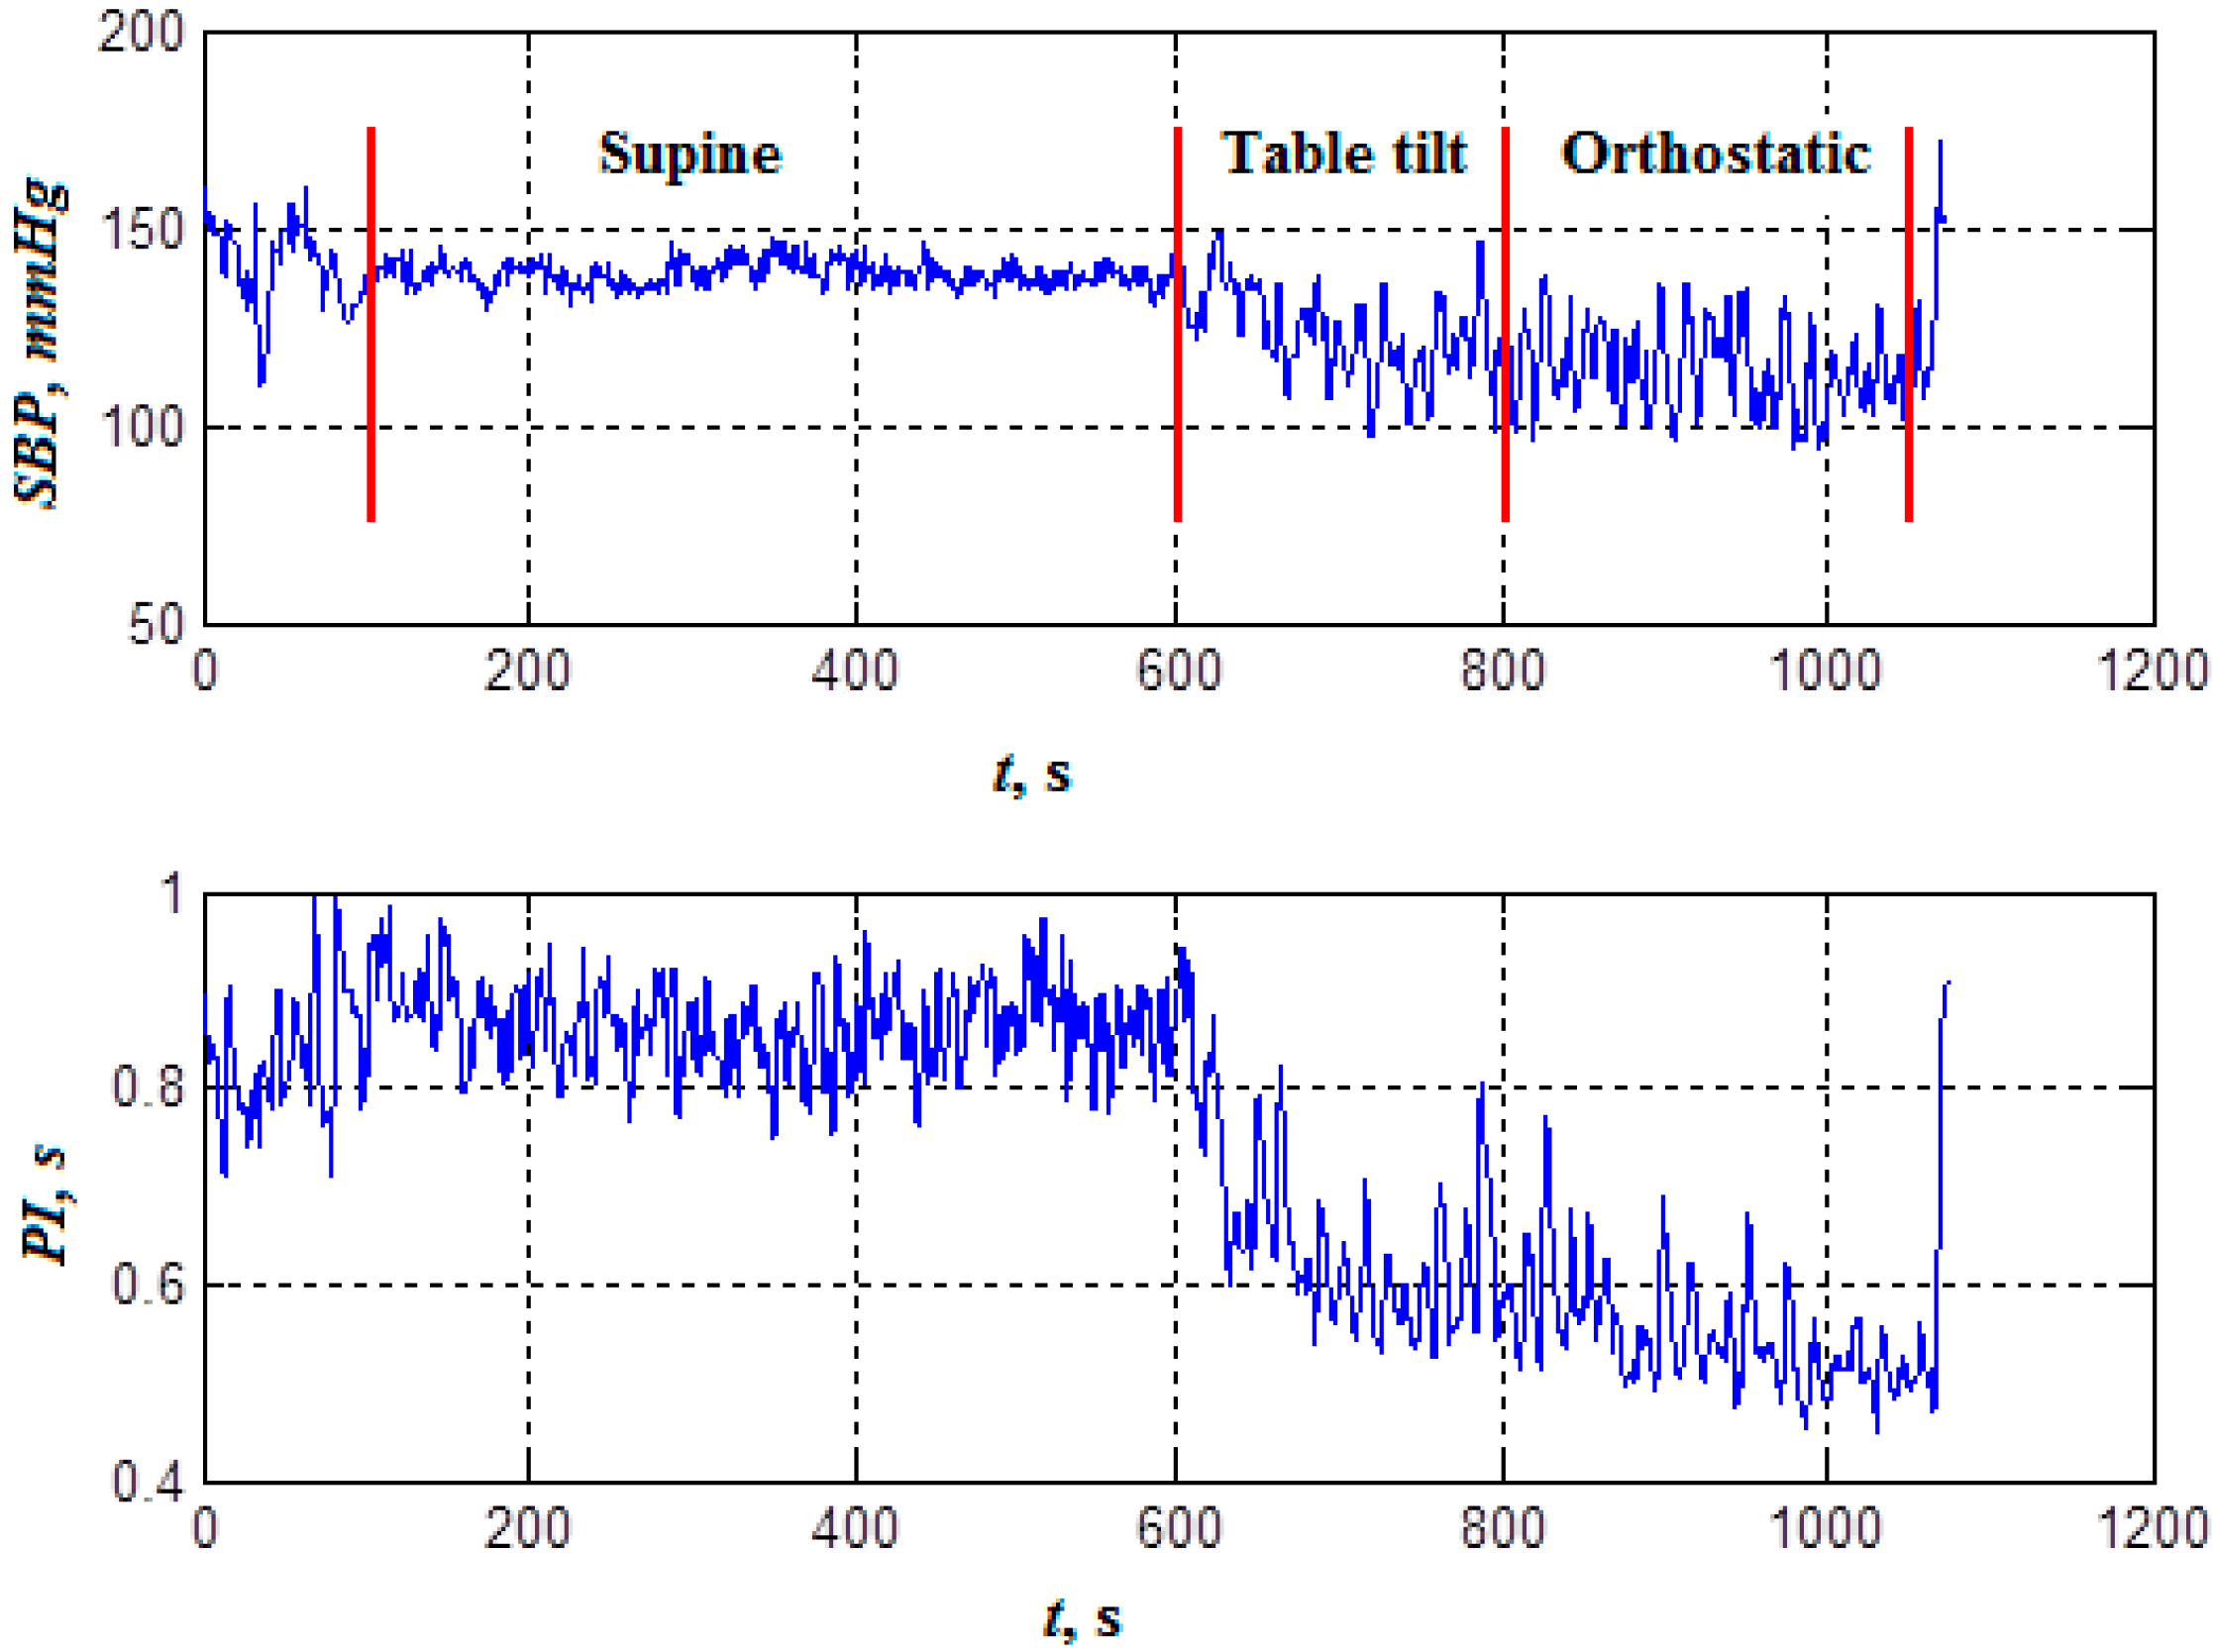
Next all 95 subjects and patients underwent a head-up tilt-test (table tilt 70°, duration of orthostatic position up to 30 min unless stopped earlier due to syncope response) [
33], see also [
34] that was performed under identical conditions between 10 am and 1 pm. The recording in the initial supine position and the initial fragment of the orthostatic phase recording (both around 10 min duration) were used in further analysis.
Hemodynamic parameters we measured continuously using the Finometer-Pro blood pressure monitor (Finapres Medical Systems, Enschede, The Netherlands) with parallel electrocardiogram (ECG) recording. The forearm blood flow was measured by venous occlusion plethysmography using Dohn air-filled cuff.
The overall study design is summarized in
Figure 1.
Detailed characteristic of the studied patients’ groups are summarized in
Table 1.
2.2. Data Acqusition and Preliminary Processing
Since the instantaneous phase calculation procedure by Hilbert transform employed in the signal mutual synchronization analysis is rather sensitive to random errors in measurements, an adaptive recursive filtering procedure has been applied to the original measurement sequences , where s denotes either systolic blood pressure (SBP) or pulse intervals (PI) aiming at the elimination of the anomalous measurements. This procedure is based on the analysis of the first differences of the pulse intervals and systolic blood pressure values. The threshold value for the exclusion of outliers is based on the analysis of their empirical distribution functions for the processed data series. The elimination procedure consists of two consecutive steps that are repeated iteratively: (i) marking of the potential outliers as candidates for future elimination and (ii) removing marked outliers. In the first step, one calculates the first differences from the initial dataset (that will be recalculated iteratively each time after a single outlier is eliminated). To mark the ith element of the dataset as a candidate for being an outlier (“OUT”) three conditions should be met simultaneously:
The absolute values of the first differences
and that are adjacent to the measured data are both either greater or equal than the standard deviation of the first differences.
The two consecutive first differences and have different signs.
The absolute values of the first differences normalized by its standard deviation and both exceed the critical value determined as a quantile of the Student’s t-distribution for the given dataset size N.
Those elements for which all three conditions are met are then marked as “OUT”. Out of the marked data
the one with the largest normalized standard deviation is eliminated. After elimination of a single outlier the above procedure is repeated iteratively unless there are no values marked as outliers for the chosen elimination depth. For deeper details on the filtering algorithm, we refer to [
35].
Since the sequence of pulse intervals was non-equidistant due to its inherent variability, we next used the cubic interpolation and resampling with the desired sampling frequency, 5 Hz in our case. Therefore, both analysed datasets were now represented by sequences equidistant in time and taken at the same time points.
2.3. BRS Estimation
To calculate BRS from blood pressure and pulse interval recordings during tilt tests, we followed a recently suggested methodology that is particularly suited for dealing with non-stationary data [
6]. The first differences of SBP and PI values were taken and the BRS was estimated as a linear regression coefficient of ΔPI on ΔSBP in those quadrants where the signs of ΔPI and ΔSBP were identical. To disregard uncertain as well as anomalous variations beat-to-beat changes of less than 1 mmHg in SBP or less than 3 ms in PI and more than 20 mmHg in SBP or more than 100 ms in PI were ignored.
2.4. The Method of PI and BRS Phase Synchronization Measurement
To estimate the mutual synchronization behaviour of the two signals quantitatively we used the method based on the comparison of their phases [
36]. Instantaneous phase values were determined by the Hilbert transform which is widely used in mathematics, physics and signal analysis. For the overall estimation algorithm design, see
Figure 1.
The Hilbert transform produces complex function
from the original real signal
s(
t) (that stands for either SBP or PI) by adding the imaginary component
s⊥(
t), which is defined as:
The resulting complex function is known as the complex analytical signal .
The real and imaginary parts of the analytical signal allowed us to determine the envelope
S(
t) as the absolute value of the analytic signal that characterized the laws governing its amplitude modulation, and the phase Φ(
t) as the argument of the analytical signal that characterized the laws governing its angular modulation. Accordingly;
Of note, the signal phase has a clear physical interpretation only in the case of harmonic or narrowband oscillations, while the above formalism was not restricted to these assumptions and thus allowed us to calculate phase values for arbitrary data sequences. Next, we determined the differences between the phases Φ
PI–Φ
SBP. Following [
27,
28] we next applied moving average filtering in a gliding window of size τ and calculated the standard deviation of the phase differences. Consecutive phase points where the standard deviation remained below a given threshold, equal to 2π/δ, were treated as belonging to synchronization episodes, once their duration exceeded
T seconds. This procedure was applied to the entire record in a gliding window while counting episodes of synchronous behavior. As a result, a quantitative measure of the phase synchronization was the synchronization coefficient Sync defined as the percentage of the synchronous behaviour episodes duration within the total duration of the analysis window.
2.5. Adjustment of Synchronization Analysis Algorithm Parameters
For the initial adjustment of the methods and finding appropriate parameters of the synchronization analysis algorithm that fit to the typical blood pressure and heart rate variability characteristics, another set of 150 stationary records which were obtained independently from this study and already used in previously reported analysis [
37] from subjects with various autonomic status under supine resting conditions (typical record duration around 10 min) have been used.
First optimization of synchronization algorithm parameters τ, T and δ was performed. The appropriate choice of these values depended on the specific experimental conditions and was not always universal for the given type of data. The parameters may be adjusted to optimize the sensitivity of the algorithm by avoiding the saturation at either very low or very high synchronization coefficients. The gliding window duration τ determined the number of phase points in the window. It was connected with the parameter δ used to calculate the threshold for the standard deviation of the instantaneous phase first differences since the standard deviation calculated for a finite data sample depended on the sample size.
To choose the appropriate window size τ, first the boundary conditions that specify its possible range were determined. One of the common hypotheses of the Mayer waves origin is their baroreflex loop based nature, suggesting that their period of about 10 s corresponds to the full feedback loop cycle [
38]. Accordingly, any internally or externally induced changes in blood pressure were followed by characteristic regulatory oscillations with the Mayer waves period. Thus, choosing the gliding window size that was comparable or above this 10 s period eliminated these short-term regulatory oscillations by averaging. Alternatively, to ensure that the observed variations in both blood pressure and pulse intervals were proper measurements not caused by single faulty measurements and do not appear artifacts of preliminary filtering procedures, one has to guarantee that at least several actual measurements have been performed in each window. Taking into account typical heart rate values, a 3 s gliding window will typically result in having 3–4 pulse measurements under resting conditions and even more under stress conditions with an increased heart rate. Accordingly, one has to restrict with τ above 3 s, and preferably, not longer than half period of Mayer oscillations, that is 5 s. For a better temporal resolution of the analysis, choosing the lower bound of the appropriate range that was a 3 s gliding window seems plausible. Next the threshold for the standard deviation of the phase difference was chosen empirically as 2π/300,
T = 0.4 s, the latter adjusted empirically to avoid saturation and this way increase the dynamic range of the Sync index.
The graphic insets in
Figure 2 exemplify the analysis results for a single tilt-test record. In addition to pre-processed data sequences and their Hilbert phases, the figure displays their first differences as well as the results of their standard deviation analysis in a gliding window (in the lower right panel). The dashed lines denote the 2π/δ threshold for the standard deviation of the phase difference. The bold solid curve denotes Φ
PI–Φ
SBP and curve fragments highlighted by red color denote the synchronization episodes where the standard deviation of the phase difference remains below the 2π/δ threshold. Finally, the fraction of such episodes within the total record duration determines the synchronization coefficient Sync.
The figure shows that, while for the entire analysed fragment the synchronization coefficient Sync was somewhat around 50%, it exhibited considerable variations along the record. While the first part of the record was characterized by prolonged episodes of synchronous behaviour interrupted by few short-term asynchronous fragments, the second part of the fragment exhibited more frequent asynchronous behaviour episodes interrupted by rather few coupling patterns. While the particular reasons for each onset and breakdown of this coupling can hardly be determined, there was a clear discrepancy between the first and the second part of the record in terms of their synchronization patterns. Such changes in the synchronization behaviour of blood pressure and pulse intervals could have been triggered by some physical or mental stress like change in the body position, and so on. Accordingly, reactions to various stress patterns that were imposed during functional tests can be studied in terms of the changes in the blood pressure—the pulse intervals synchronization coefficient, Sync. This requires that the recordings being analysed during different test phases. For example, for the head-up tilt table testing the supine and the orthostatic test, phases could be analysed separately, this way allowing us to evaluate how the synchronization pattern changes in response to the orthostatic stress. An additional advantage of the proposed methodology is that the evaluation of the degree of phase synchronization between SBP and PI may be useful in the study of regulatory functions in the human body during various functional tests, since it does not require data stationarity.
While the BRS value characterizes the intensity of the heart rate reaction to the blood pressure changes during observed feedback responses, the Sync value likely indicates how often such responses are activated in the first place. Accordingly, low intensity of the reaction characterized by low BRS that should result in higher than normal blood pressure variability, theoretically, could be at least partially compensated by its more frequent activation characterized by higher Sync.
2.6. Alternative Mutual Information Metrics
While according to the results of a recent study [
30], Sync appears the most sensitive of various mutual synchronization indices, it has its own drawbacks, including high sensitivity to any (including random) variations in the analyzed signals, that requires seeking for more robust alternatives that would respond more specifically only to significant variations, although typically at the cost of their lower sensitivity.
Among them, the third approach is the time delay stability estimate is based on the analysis of the relative shift of the maximum of the cross-correlation function of two studied series originally proposed in [
28]. In this approach, the average delay in 50% overlapping windows of fixed length is calculated, and the time delay stability episode is determined once within at least five consecutive windows the shift of the maximum of the cross-correlation function remains below a given threshold. Like in the previous method, in order to estimate the time delay stability coefficient for an entire record, the TDS value is determined as the fraction of the time delay stability episodes in the total record duration. Similarly, the starting set of the parameters used in this study follows the results of a recent simulated data based investigation [
30].
One more quantity utilized here is a certain combination of the previous two approaches and is based on the analysis of the correlation time of the phase differences of the studied data series. Like in the first method, the phase differences
KΦ
i(τ) are determined using the Hilbert transform. Next the observational data series are divided into 50% overlapping time windows of duration
T, and in each time window the correlation time of the phase differences is calculated as:
To obtain the overall statistics for a given data series, the averaged correlation time over all studied time windows is calculated. Once the window size is well above observed correlation times, this method becomes parameter-free.
The fifth approach utilizes the mean coherence of two data series [
3]. Contrasting with the three above described methods that are all obtained in the time domain, the coherence function is obtained in the frequency domain and is calculated as:
where
Px(
f) and
Py(
f) are the individual spectral densities, and
Pxy(
f) is the cross-spectral density of the analyzed datasets.
The sixth method is based on the calculation of cross-conditional entropy of the two series
x(
t) and
y(
t) according to the approach described in [
18]. First, the analyzed data series are normalized. Then in the series
y(
t) the patterns including
L − 1 samples are selected. The cross-conditional entropy is then defined as:
where
fx is a data fragment of size
L − 1 selected from the first data series
x(
i);
p(
fx) is the probability of the observation of
fx within the series
y(
t);
М is the number of corresponding fragments;
p(
y(
i)/
fx) is the conditional probability of a particular sample
y(
i) to be observed within a series
y(
t) following the
fx pattern.
The above index represents the amount of information carried by the sample x(i) when the pattern fx is assigned. Thus, the coefficient CE depends on the pattern size L. It reaches zero when a sufficient number of samples of y(t) carries the entire information of behavior of x(t). It remains high and constant if the processes x(t) and y(t) are independent and yields intermediate values when knowledge of y(t) allows for a limited prediction of the behavior of x(t).
Figure 3 exemplifies the entire analysis procedure for a single tilt-test record. After preliminary data preparation both SBP and PI sequences are subjected to the Hilbert transform and phase detection as indicated above. The entire algorithm was implemented using the Matlab software package.
2.7. Statistical Analysis
Since our preliminary studies [
35,
36,
37] indicated that the studied blood pressure—pulse intervals coupling metrics are not normally distributed, we used the methods of non-parametric statistics to process our results. To quantify the statistical significance of our results, we next applied the non-parametric Mann–Whitney U-test for independent samples [
39]. To calculate the correlations between the synchronization coefficient, the standard deviations of pulse intervals and systolic blood pressure and the baroreflex sensitivity we used the non-parametric Spearman’s correlation coefficients. All statistical analysis was performed using the IBM SPSS Statistics software package.
3. Results
Remarkably, while the orthostatic hypotension patients (Group 1) were characterized by a smaller number of reduced autonomic tests results (5.0 ± 1.2 vs. 2.5 ± 1.1) suggesting rather moderate autonomic dysfunction particularly less severe than that one in the diabetes patients (Group 2), they were characterized by considerably more pronounced blood pressure reduction during tilt test (34 ± 13 vs. 17 ± 14 for systolic and 17 ± 7 vs. 2 ± 16 for dyastolic blood pressure, respectively).
Analysis of both the entire tilt test records as well as each of its phases revealed that, as expected, the BRS differs significantly between healthy individuals and both patient groups, according to the non-parametric Mann–Whitney U-test (
p < 0.05 for the first group with orthostatic hypotension and
p < 0.001 for the second group of diabetes patients with autonomic neuropathy). Remarkably, in addition to the well-established BRS index, nearly all studied mutual information indices exhibited significant differences between the patients’ groups and the healthy volunteers (
p < 0.05). In marked contrast, when it comes to differential diagnostics, only a few studied metrics have shown significant discrepancies between the first and the second patients’ groups. In particular, besides the well established BRS index (
p < 0.05), also Sync (
p < 0.05) and TDS (
p < 0.005) mutual information metrics have shown significant differences (see also
Figure 4,
Figure 5 and
Figure 6 for visual illustration).
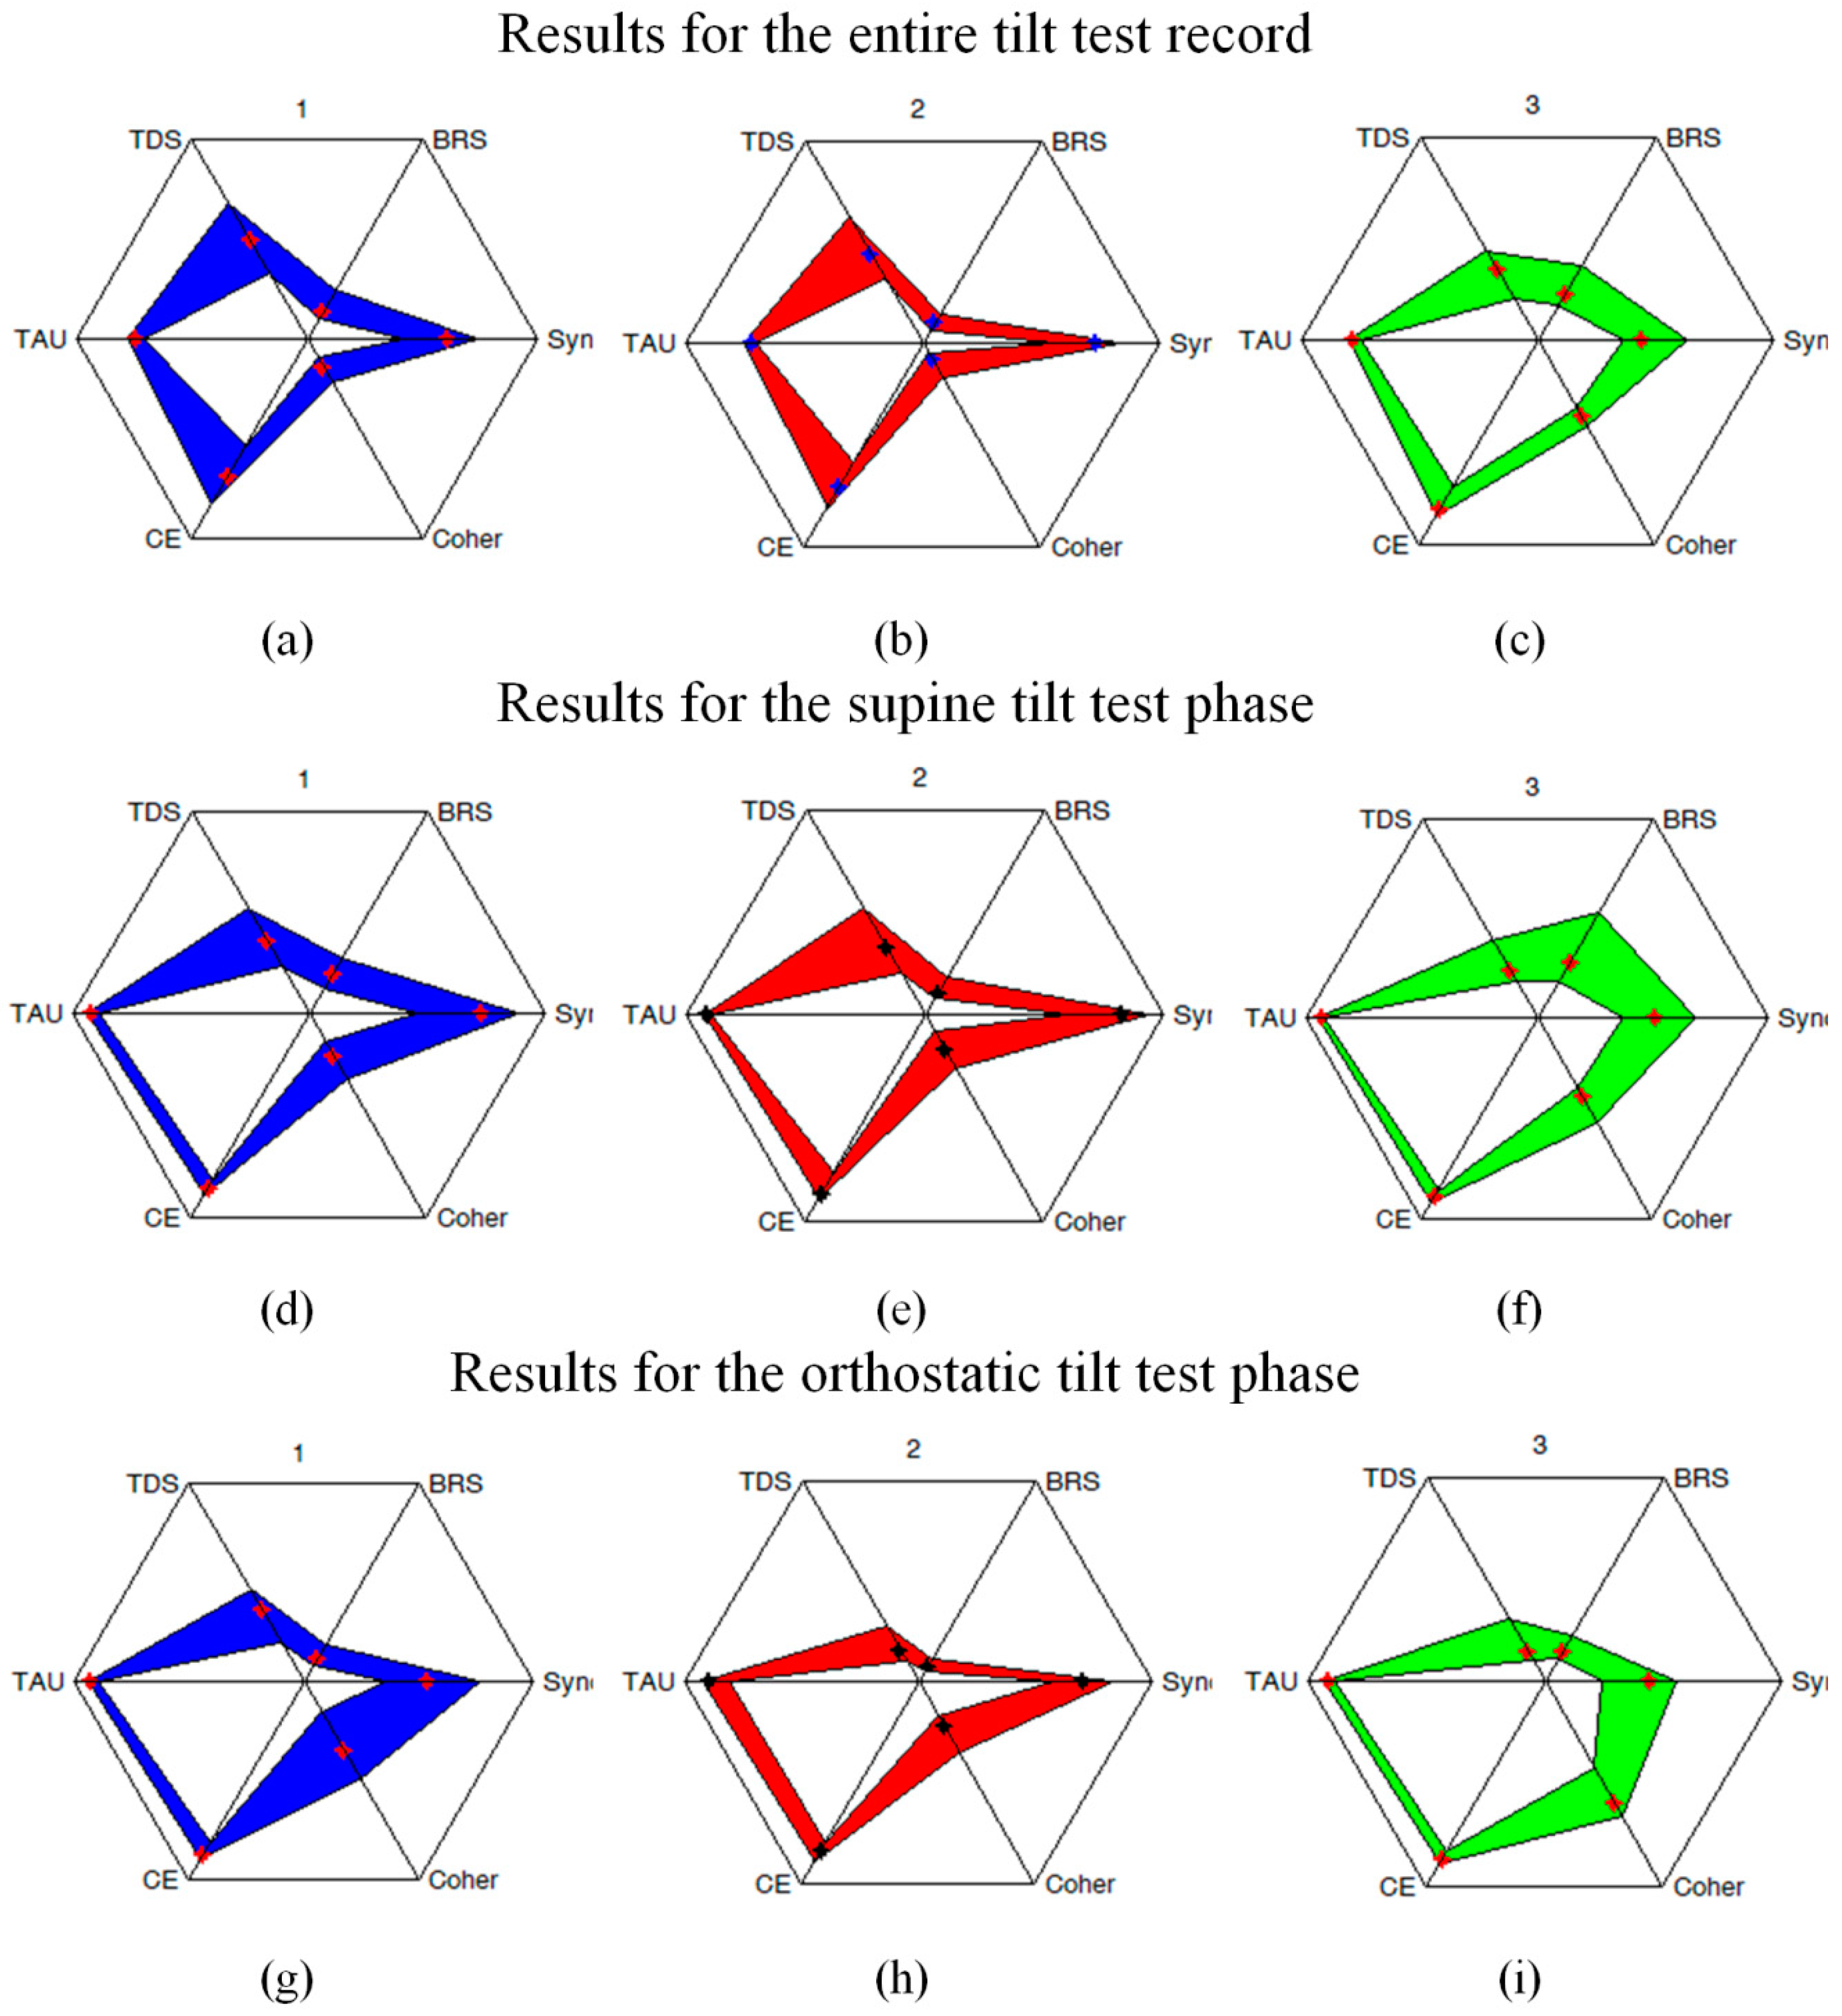
For a better representation of the overall response patterns quantified simultaneously by several indicators,
Figure 7 also depicts the star-style diagrams summarizing our results after appropriate normalization. Those indices that were not normalized by definition have been rescaled by dividing all values by the corresponding observed maxima.
Significant changes between the supine and the orthostatic phases of the tilt test could be observed for nearly all studied metrics except CE in the diabetes patients’ group (p < 0.05). However, only BRS and Coher metrics (p < 0.01) significantly differed between the supine and the orthostatic test phases both in the control group and in the first patient group with orthostatic hypotension, while no significant differences between the test phases could be observed in other studied indices.
In particular, although BRS reduced significantly in the orthostatic position for the patients with non-diabetic orthostatic hypotension (Group 1), given that their initial
BRS values (9.59 ± 4.65) (medians ± interquartile ranges are given here and below) in the supine position were only slightly below those in the control group (see
Figure 5), they appeared only moderately reduced also in the orthostatic position (5.16 ± 4.12, see also
Figure 6). In contrast, in diabetic patients (Group 2) characterized by already low BRS values in the supine position (4.07 ± 2.98, see also
Figure 5), its comparable relative reduction in the orthostatic position led to much lower absolute
BRS values (2.73 ± 1.03, see also
Figure 6).
According to these data, one could expect higher blood pressure variability in Group 2, as their autonomic nervous system is less sensitive to the changes in blood pressure, and their feedback response to blood pressure variations is weaker than in Group 1. Surprisingly, patients in Groups 1 and 2 demonstrated rather comparable blood pressure variability (SBP standard deviations were 7.83 ± 4.13 vs. 5.58 ± 3.08 mmHg in the supine and 7.69 ± 4.71 vs. 6.15 ± 1.84 in the orthostatic position, see also
Figure 5 and
Figure 6, respectively).
Moreover, the synchronization coefficient Sync demonstrated significant negative correlations with the standard deviation of the systolic blood pressure during the orthostatic phase of the tilt test. This seems to be rather a universal phenomenon, as it is reproduced well not only qualitatively but also quantitatively in all studied groups (Spearman’s correlation coefficient ρ ≈ −0.5, p < 0.05). The above indicates that in addition to the established BRS, synchronization patterns between blood pressure and pulse intervals also appear important markers of an adequate cardiovascular response to the orthostatic stress.
4. Discussion
While key indicators of the cardiovascular feedback regulation are characterized by well-known measures such as BRS, some details could not be revealed by using this single indicator, especially when it comes to the differential diagnostics. Despite of the pronounced discrepancies between the BRS values in patients from Groups 1 and 2 (approximately twofold between their median values for both supine and orthostatic tilt-test phases), blood pressure variability did not exhibit any significant discrepancies between the two patient groups, indicating that there might be another contributing factor that also plays an important role.
Such a factor could be revealed and, furthermore, quantified by considering the synchronization coefficient Sync and the time delay stability TDS metrics both indicating the (normalized) total duration of the time fragments when rather synchronous dynamics of blood pressure and pulse intervals could be observed. Our results indicate that in all studied groups under normal conditions both Sync and TDS demonstrate behavior that appears rather reciprocal to BRS. This indicates that in patients with reduced BRS the feedback mechanisms are likely being activated more frequently this way trying to compensate their lower sensitivity and intensity.
This compensation seems to be rather a universal phenomenon, as the reciprocal character of Sync and TDS vs. BRS can be clearly observed in the comparison between them in different studied groups in both supine and orthostatic positions (see boxplots in
Figure 4,
Figure 5 and
Figure 6). The compensation hypothesis is further supported by the fact that during
all tilt test phases in both patients from Group 1 and healthy subjects always negative (although not in all cases statistically significant) correlations between BRS and Sync have been observed. Although, qualitatively, a similar effect could also be observed when considering TDS instead of Sync, it appears less pronounced that could be likely attributed to the lower sensitivity of TDS when compared to Sync, as revealed by a recent computer simulations based study [
30].
A prominent exception from the above reciprocal relationship as well as from the corresponding negative correlation pattern could be observed only in diabetes patients likely indicating a breakdown of the above compensatory mechanism at least in some of the patients. Notably, this appears generally in line with recent studies of baroreflex control where significant dependence of the orthostatic baroreflex performance on concomitant conditions such as obesity has been reported [
21]. Moreover, in the same study a significantly higher number of baroreflex sequences per given time window (that could also serve as another possible substitute to Sync and/or TDS mutual synchronization metrics) likely indicating more frequent activation of the baroreflex loop could be observed in diabetes patients with concomitant obesity compared to control subjects, although differences between diabetes patients and weight-matched control subjects appeared insignificant. Since we have observed similar effect in our study by using the suggested Sync and TDS indicators, also concomitant conditions such as obesity presumably play a key role in the impairment of baroreflex control not only in terms of its low sensitivity, but also in terms of its timely activation in response to blood pressure variations, although more detailed investigations are required to further elucidate the key factors that influence this possible compensation breakdown.
Therefore, we believe that proposed additional indicators could be useful for the improvement of the differential diagnostics of blood pressure regulation efficacy and also lead to a deeper insight into the involved concomitant factors this way also aiming at the improvement of the mathematical models representing the underlying feedback control mechanisms.
Finally, the proposed complementary mutual behavior indicators might appear potentially useful for the analysis of other physiological signals as well as for the quantification of the alternative stress test responses other that the tilt test, for example, in stress detection studies in daily life scenarios (for recent examples of relevant investigations see e.g., [
40,
41]). However, for further practical utilization of these complementary indicators in other differential diagnostic scenarios, design of dedicated prediction tools based on, e.g., star-style diagram pattern recognition and/or shape analysis with anomaly detection [
42] or multivariate regression models with decision-making procedure based on the analysis of appropriately weighted combination of several complementary indices (see, e.g., [
43] for a recent example) is required.


 ,
, 


