Article

Segmentation of Multiple Tree Leaves Pictures with Natural Backgrounds using Deep Learning for Image-Based Agriculture Applications

by
Jaime Giménez-Gallego
,
Juan D. González-Teruel
,
Manuel Jiménez-Buendía
,
Ana B. Toledo-Moreo
,
Fulgencio Soto-Valles
and
Roque Torres-Sánchez
*
Group División de Sistemas e Ingeniería Electrónica (DSIE), Technical University of Cartagena, Campus Muralla del Mar s/n, E-30202 Cartagena, Spain
*
Author to whom correspondence should be addressed.
Appl. Sci. 2020, 10(1), 202; https://doi.org/10.3390/app10010202
Submission received: 5 November 2019 / Revised: 19 December 2019 / Accepted: 24 December 2019 / Published: 26 December 2019
(This article belongs to the Section Computing and Artificial Intelligence)

Abstract

:
The crop water stress index (CWSI) is one of the parameters measured in deficit irrigation and it is obtained from crop canopy temperature. However, image segmentation is required for non-leaf region exclusion in temperature measurement, as it is critical to obtain the temperature values for the calculation of the CWSI. To this end, two image-segmentation models based on support vector machine (SVM) and deep learning have been studied in this article. The models have been trained with different parameters (encoder depth, optimizer, learning rate, weight decay, validation frequency and validation patience), and several indicators (accuracy, precision, recall and F1 score/dice coefficient), as well as prediction, training and data preparation times are discussed. The results of the F1 score indicator are 83.11% for SVM and 86.27% for deep-learning models. More accurate results are expected for the deep-learning model by increasing the dataset, whereas the SVM model is worthwhile in terms of reduced data preparation times.

1. Introduction

Water is a limiting factor in arid zones and its optimal management is crucial to ensure appropriate production levels and the quality of crops. One of the techniques that has been studied and applied in recent years to reduce water consumption in agriculture is deficit irrigation [1,2,3,4], which requires measurable crop stress parameters. Midday stem water potential (SWP) is the reference method [5]. However, its measurement is very time consuming and it is not automated yet. As soil–plant–atmosphere is considered as a continuum [6], several automatically measurable variables have been proposed to be related to the SWP, so that it can be measured in an indirect way. The crop water stress index (CWSI) [7,8] is one of the most widely used indicators correlated with SWP and it is remotely measurable [9].
In order to obtain the CWSI, it is necessary to measure the crop canopy temperature. One of the methods to deal with this aim is the use of infrared radiometers (IR) [10,11]. However, when installing an IR in the field no feedback is available to know the proportion of leaves in the measuring cone. Thermography techniques are an alternative tool to estimate the crop canopy temperature [12,13,14,15,16,17]. No orientation issues arise since a graphical representation of reality is always available, so that enough information is provided to decide whether the visualized region is of interest. In either case, a similar issue arises: the necessity of discrimination between leaf and non-leaf regions in the field of vision. They are not capable of distinguishing between the leaves and other elements of the image, such as branches, trunk, sky or soil. Therefore, the measured temperature does not only correspond to that of the leaves, but to that of the average of all the elements covered by the field of vision.
It has been demonstrated that the exclusion of the non-leaf image region is critical to obtain the temperature values for the calculation of the CWSI [17]. To automate this, image-segmentation techniques would need to be implemented to identify the region of interest. However, the identification of the leaves in thermal images is a complicated task, even with high-resolution thermal cameras, whose price would make the system unviable. Thus, the segmentation is posed in visible images. Subsequently, using augmented reality techniques, correspondence between the processed visible image and the thermal image would be achieved, allowing the determination of the temperature values of the leaves exclusively. In this regard, the use of different techniques of colorimetric segmentation by image processing has been classically proposed in several studies. In particular, these are segmentation techniques based on colour thresholds [18,19], region identification [19] and watershed [19,20], that perform image processing using the hue saturation value (HSV), hue saturation intensity (HSI) or lab colour spaces. Likewise, significant work has been done based on machine-learning techniques with good results compared to other image processing methods [21]. Specifically, deep learning provides a great advantage in image processing, since it does not require feature engineering [21] and not only the colour is involved in the segmentation algorithm, but also the spatial relationship between colours, giving rise to the notion of shapes.
Currently there are numerous case studies related to the classification of images by means of machine-learning and deep-learning techniques [22,23,24,25]. Nonetheless, the aim of these studies is not as much the leaves segmentation as the phenotypic classification. In contrast, the problem we pose is the segmentation of the image to identify a region of interest. Specifically, the region that we seek to separate from the background is the one that is formed by the multiple leaves of the trees in a real scenario. Problematic areas due to over- or under-lighting, or withered and pitted leaves can be found. Besides, leaves themselves may be overlapped [26], be incomplete, or be covered by not interesting background elements, such us branches, fruits, soils with the presence of weeds and cloudy skies.
The segmentation of leaves from natural backgrounds, such as with overlapping leaves or branches, has been dealt with in several articles [20,27,28,29,30,31,32,33,34]. Nevertheless, a low complexity in the image composition is noticed in these papers, such as the lack of: light reflections, overlapping leaves, branches and fruits, or the presence of grass or weeds in the background. This involves a distancing from the real scenario that can be used in a field measurement. Furthermore, some articles [20,27] are only focused on a specific leaf centred in the image, but not on multiple leaves. Therefore, a lack of procedures to efficiently discriminate leaf regions from natural backgrounds in multi-leaf images has been found.
In this article, a segmentation procedure, that consists of individually classifying each pixel of an image into the corresponding “leaf” or “non-leaf” class, is proposed. This task is performed by analysing the individual information of the pixels and their relationship with the neighbours. To this end, support vector machine (SVM) and deep-learning algorithms have been used and compared in order to generate an automatic processing model.

2. Materials and Methods

2.1. Materials

To generate the segmentation model, a set of pictures for training was obtained. Different species of fruit trees were the target of the research: lemon (Citrus limon), orange (Citrus sinensis), almond (Prunus dulcis), olive (Olea europaea), loquat (Eriobotrya japonica), fig (Ficus carica), cherry (Cerasus) and walnut (Juglans regia) trees. The pictures were collected by means of mobile devices (smartphones) in different locations of city and countryside in Murcia, Spain (37°59′32.064″ N 1°7′50.356″ W). The images were taken throughout winter and spring at several times of the day, from morning to afternoon, covering the range of different lighting scenarios. Several resolutions were found: 3264 × 2448, 3264 × 1836, 1600 × 1200 and 1600 × 900 pixels. The datasets consisted of 251 pictures for SVM and 121 pictures for deep learning. The data processing and models training were performed by means of a computer with Intel® Core i5-8600K, 16 GB RAM and GTX 1070 Ti GPU/8 GB GDDR5 equipped with MATLAB 2018b (The MathWorks, Inc., Natick, MA, USA) [35]. GIMP (GNU image manipulation program) 2.10.10 software [36] was used for image masks refining.

2.2. Methods

Two different alternatives were proposed in order to obtain the image segmentation model: a SVM model together with a clustering-based dataset generation and a Deep Learning model.

2.2.1. Support Vector Machine (SVM) + Clustering

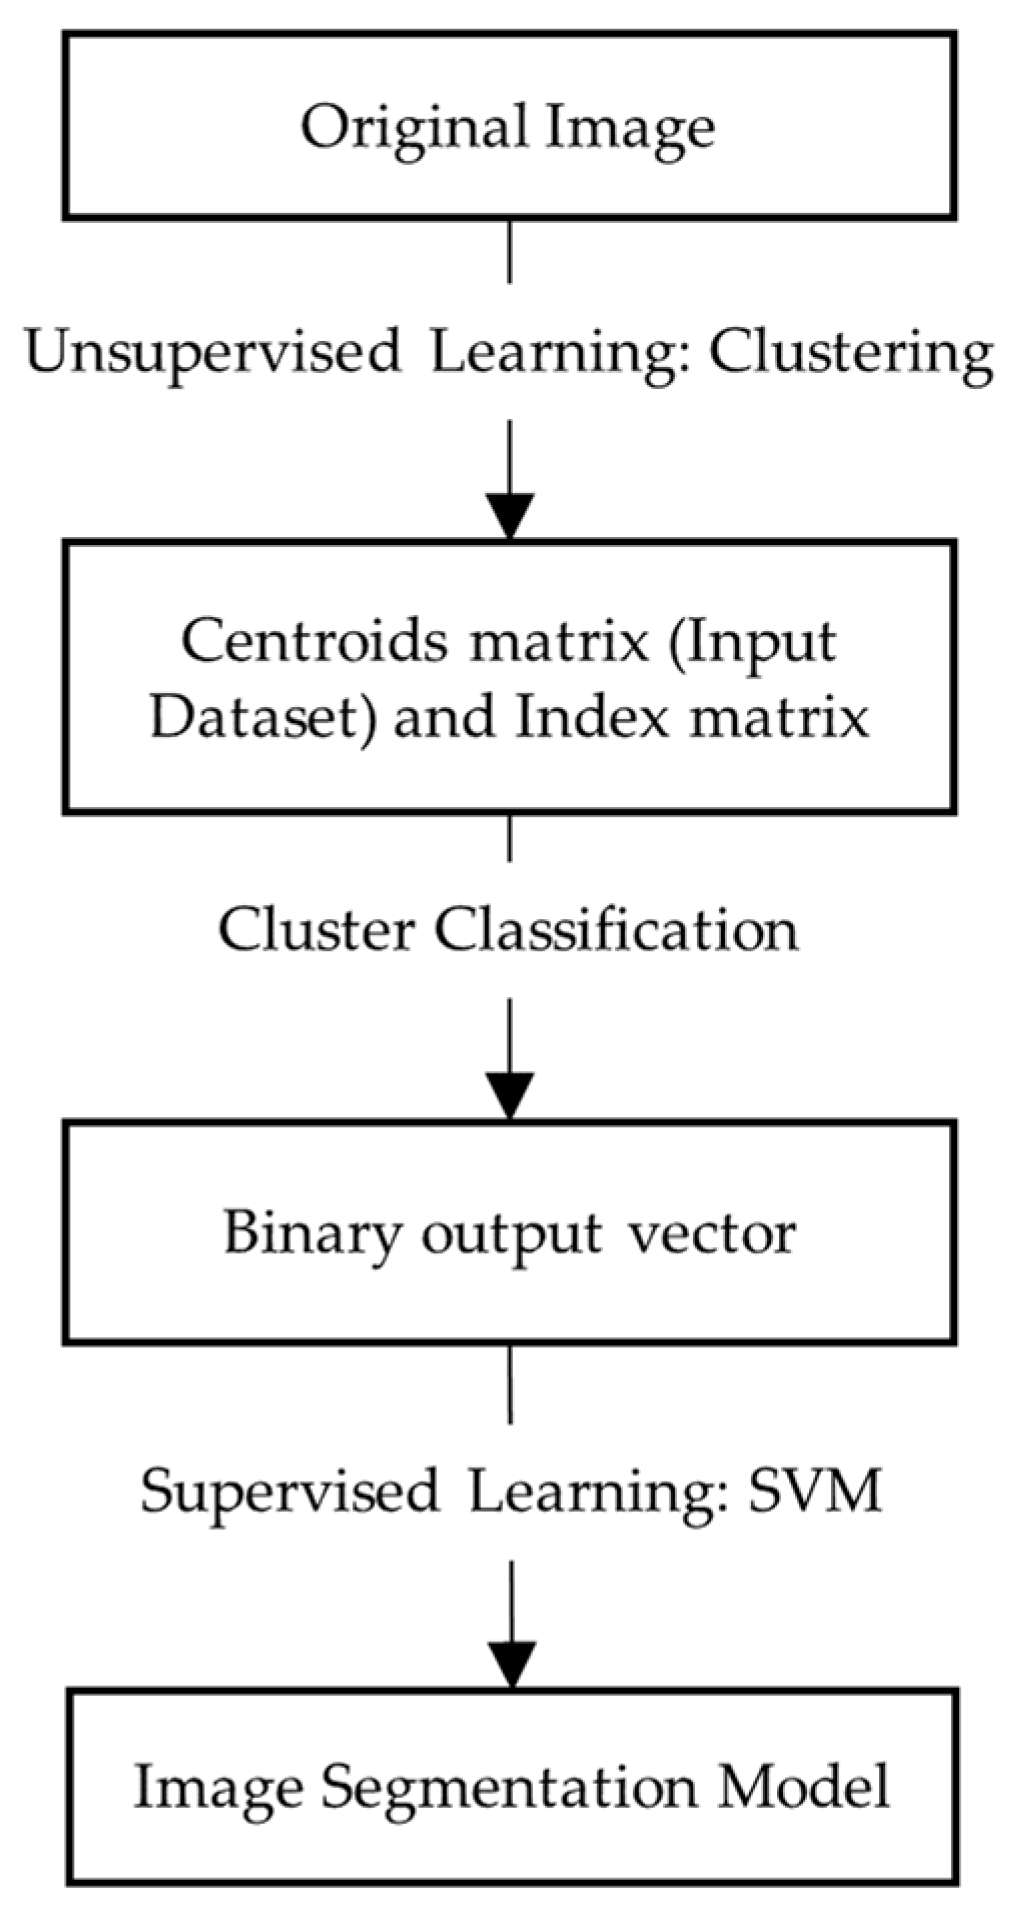
The proposed SVM + Clustering method consisted of several steps, as presented in Figure 1. To build the dataset for training, image masks that discriminate leaf and non-leaf pixels were needed. Since building this is a really time-consuming task if done manually, a clustering pre-process was implemented as an alternative to facilitate the dataset generation.
As it is a supervised method, input-output pairs of data are required for SVM training. The output was defined as a binary value that classifies every pixel as leaf (“1”) or non-leaf (“0”). In the case of inputs, the original pictures were taken in the Red-Green-Blue (RGB) colour space. Nonetheless, other colour spaces were used, as more relevant information for segmentation can be obtained [37,38]. Thus, a hybrid colour space formed by some channels of several colour spaces was defined. The colour spaces considered were: RGB, I1I2I3, HSV and CIE (International Commission on Illumination) L*a*b*. The procedure for choosing the channels consisted of representing each of them in a grayscale picture together with its histogram for different test images. This allowed visual determination of their sensitivity to discern between the leaves and the background. Finally, the hybrid colour space consisted of the selected channels: I3 from I1I2I3, a* and b* from CIE L*a*b*, and H from HSV.

Clustering

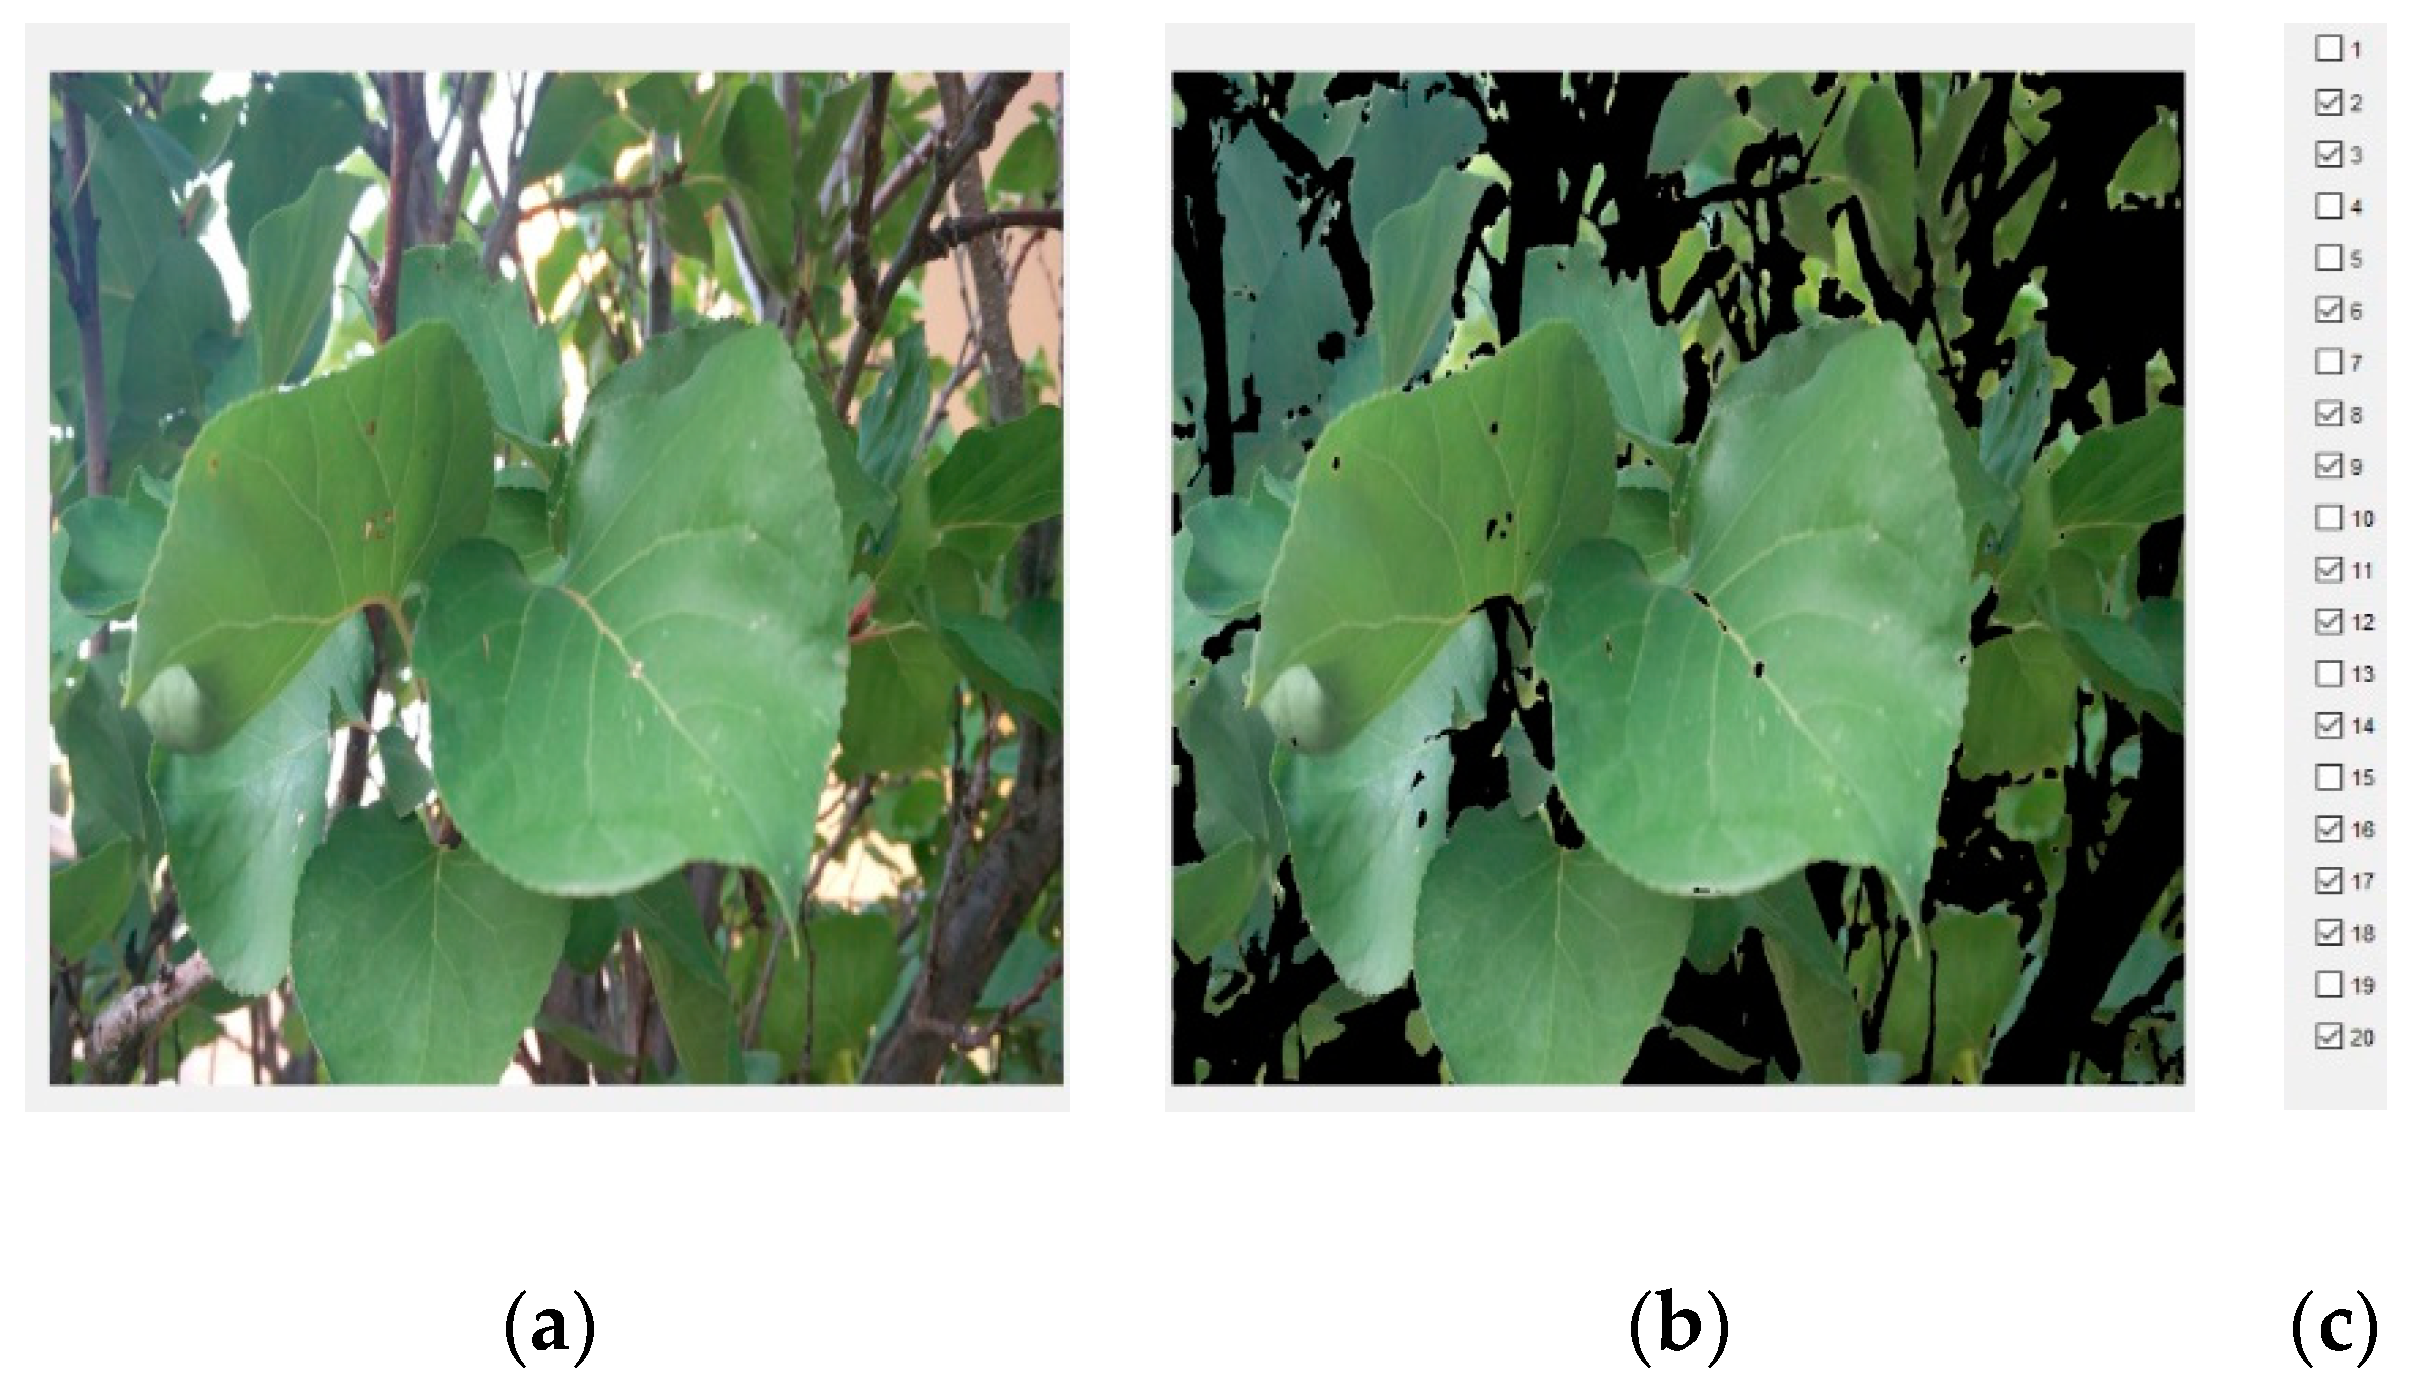
The clustering pre-process consisted of applying a k-means method to define several centroids and an index matrix from the pictures. All the original pixels were classified with an index depending on the centroid they belonged to. A number of 20 centroids was chosen arbitrarily. To build the dataset output a graphical user interface (GUI) where every picture is loaded and the index matrix is applied as a mask was developed. As shown in Figure 2, the interface allowed to manually enable or disable the pixels associated with each cluster by using checkboxes, automatically updating the picture and defining the supervised output. Aside from facilitating the task to create the dataset, the use of clustering led to normalization of pictures from different resolutions avoiding an unbalanced dataset. The output distribution of the dataset obtained was 53.73% leaf and 46.27% non-leaf.

b. SVM Training

In order to train the SVM model, the dataset was split into 80% for the training set and 20% for the validation set, and a fixed test set was defined from seven new pictures. The validation set was used to optimize the weight decay of the SVM model. To do this, training was carried out by using the training set with different weight decay values within a defined range and the model’s performance was evaluated by using the validation set. The final resulting model trained with the optimal weight decay together with the test set were used to evaluate the real model accuracy. The whole procedure was repeated 50 times arbitrarily, so that the distribution of the dataset was different for each iteration. Finally, the optimal model was selected as that with the best test accuracy.

2.2.2. Deep Learning

Mask Generation

In the case of deep learning, the pictures were taken as model inputs and the binary images as output masks. To generate the masks, the clustering process for SVM described above was used in a first step. The accuracy of this method is limited due to a finite number of clusters and the clustering error itself. Therefore, in order to obtain ground-truth masks with sufficient accuracy, a manual edition was performed by using GIMP software in a second step, as shown in Figure 3. This task consisted of correcting the erroneous classification of regions on the mask after clustering by manually colouring the pixels. For this procedure, a remarkable cost in terms of time was required.

Data Augmentation

The main problem when deep-learning training is performed is the amount of data available. With a view to enlarge the dataset and provide more information for model training, data augmentation was applied. This procedure made it possible to create new training data artificially from the original pictures. It consisted of basic geometric transformations, such as translations or turns, on the pictures and their respective masks. In this article, the data augmentation applied to the original pictures consisted of: a square crop centred on the picture, two square crops originating at the two ends, three horizontal flips corresponding to the crops previously obtained and two rotations of 20° in both directions with a subsequent square crop. Thus, the dataset was enlarged eight times resulting in a total of 968 pictures. These pictures were resized to a resolution of 480 × 480 pixels for training.

Test Set

For testing purposes, seven masks were generated from seven different pictures. These pictures had a resolution of 3264 × 1836 pixels and were too big to be able to make predictions with the model. Therefore, they were divided into four quadrants of 1632 × 918 pixels each. This allowed to obtain a larger number of pictures to make predictions and no information from the original pictures was lost. Finally, the test set was composed of a total of 28 pictures.

Deep-Learning Parameters and Training

A SegNet network architecture [39] was chosen for the deep-learning model. SegNet is a convolutional neural network for semantic image segmentation. The network input layer size was defined as 480 × 480. Twenty two different models were trained employing different parameter configurations, which are detailed in Table A1 and Table A2. The parameters modified were: Encoder Depth, optimizer, learning rate, weight decay, validation frequency and validation patience. Moreover, the image enhancement pre-process of contrast-limited adaptive histogram equalization (CLAHE) was also applied in training images for some models. The objective of this procedure was to emphasize the contrast of the image. The CLAHE pre-process was implemented in HSV colour space training images and then converted back to RGB. The data set (training set + validation set) was split in 90 and 10%, respectively. The distribution of pictures in training and validation set was randomly repeated 30 times to cover different configurations of the dataset. The best model was chosen according to the test accuracy.

3. Results

3.1. Results and Predictions on Test Pictures

In order to compare the results between the different models generated, an accuracy indicator was defined as the percentage of pixels correctly classified over the total of the image:
tp = true   positive ;   tn = true   negative ;   fp = false   positive ;   fn = false   negative
Accuracy = tp + tn tp + tn + fp + fn
The evaluation is made not only between the best models obtained for SVM and deep-learning, but also between several models generated with different parameters in both cases. For the SVM model, the results were obtained with different dataset sizes: 50, 122, 190 and 251 training images. SVM test accuracy results are presented in Table 1. For every size, the mean test accuracy of all 50 models iteratively generated with different dataset distributions was calculated, although only the mean test accuracy of the best model is presented in Table 1. Model number 4, which is the one that was trained with a larger dataset, was found to be the one with the best average accuracy (83.09%) and the best average accuracy for all the iterations of generation of the model (82.53%). Moreover, model 4 was determined as the best model, with the highest accuracy in 64.29% of the test pictures. The best model indicator was defined as the percentage of test pictures that present the best result with each model. This percentage was also reached considering 1% better test accuracy results for the model 4. Quantifying this evolution of percentages reveals small differences between model 4 and the rest in the cases it is not the best, presenting a higher accuracy or up to 1% lower in 89.29% of the test pictures. As expected, the accuracy of the model grows as the number of training examples increases.
Focusing on the best SVM model obtained, whose learning curve is shown in Figure 4, a case of high bias is observed, which may indicate an underfitting problem. The model does not fit the data sufficiently, it lacks information and requires more parameters to reduce the error. Specifically, method limitations were observed with regard to the clustering and SVM structure. Clustering for data preparation and SVM training are strictly conducted by the colour space parameters of the pixels, which seem to be insufficient for the segmentation. The problem does not apparently be related to the selection of channels or colour spaces, neither with the absence to add one of them, but with the nature of the method. Additional procedures are required for a segmentation that performs an analysis based on regions and textures.
In the case of the deep-learning model, trainings were performed with different dataset configurations, network architecture parameters and training options, which are presented in Table A1 and Table A2. The results for each model are shown in Table 2 and Table 3. Mean test accuracy of all 30 models generated iteratively with different dataset distributions was calculated, as well as the mean test accuracy of the best model. According to the results, model 13, with an accuracy of 85.05%, was found to be the best. Model 15 has a very similar accuracy (84.90%), obtained with a double value of validation patience parameter. Furthermore, the comparison of accuracy between models 11 (83.07%) and 10 (84.67%) demonstrates that the application of the image enhancement pre-process of CLAHE did not improve the results.
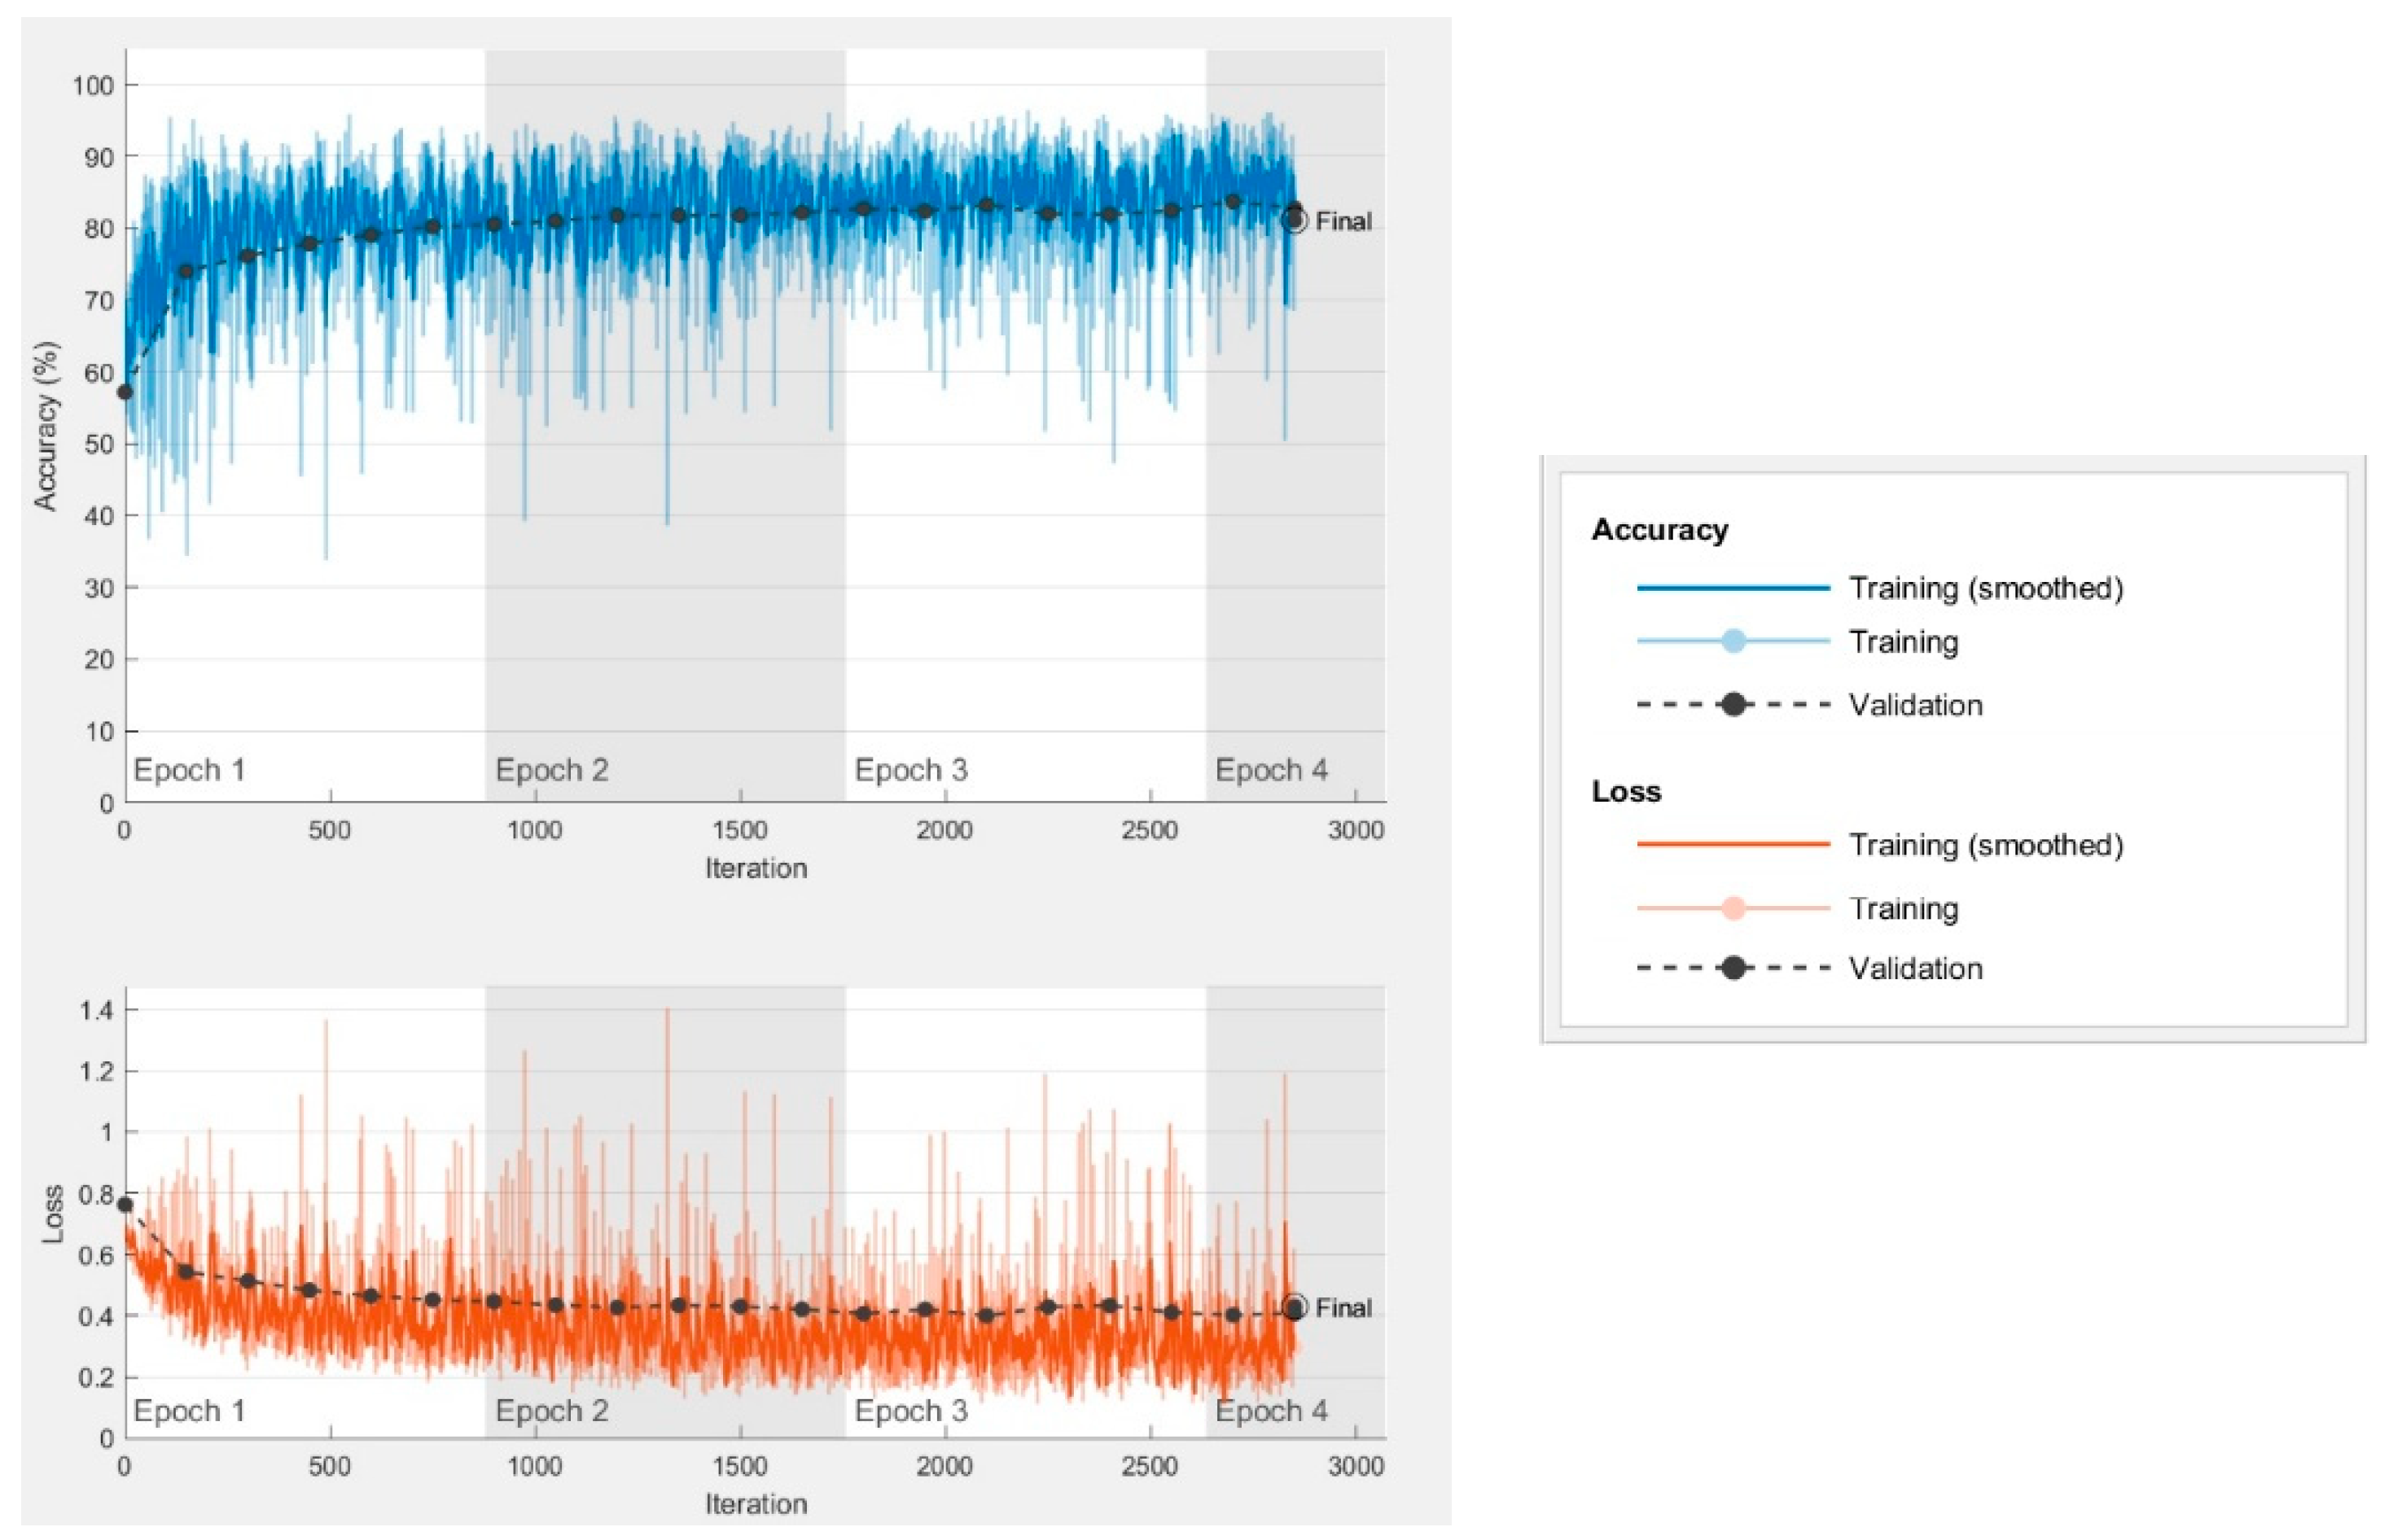
Valuable information is obtained from the training curves, as presented in Figure 5 for model 13. A high variability in accuracy is observed during training due to the differences presented between training images. As previously stated, the objective was to generate a segmentation model capable of working with pictures that included complex backgrounds and regions with problematic lighting. These pictures with characteristics that are more difficult to discriminate are responsible for the fact that poor results are frequently produced during training.
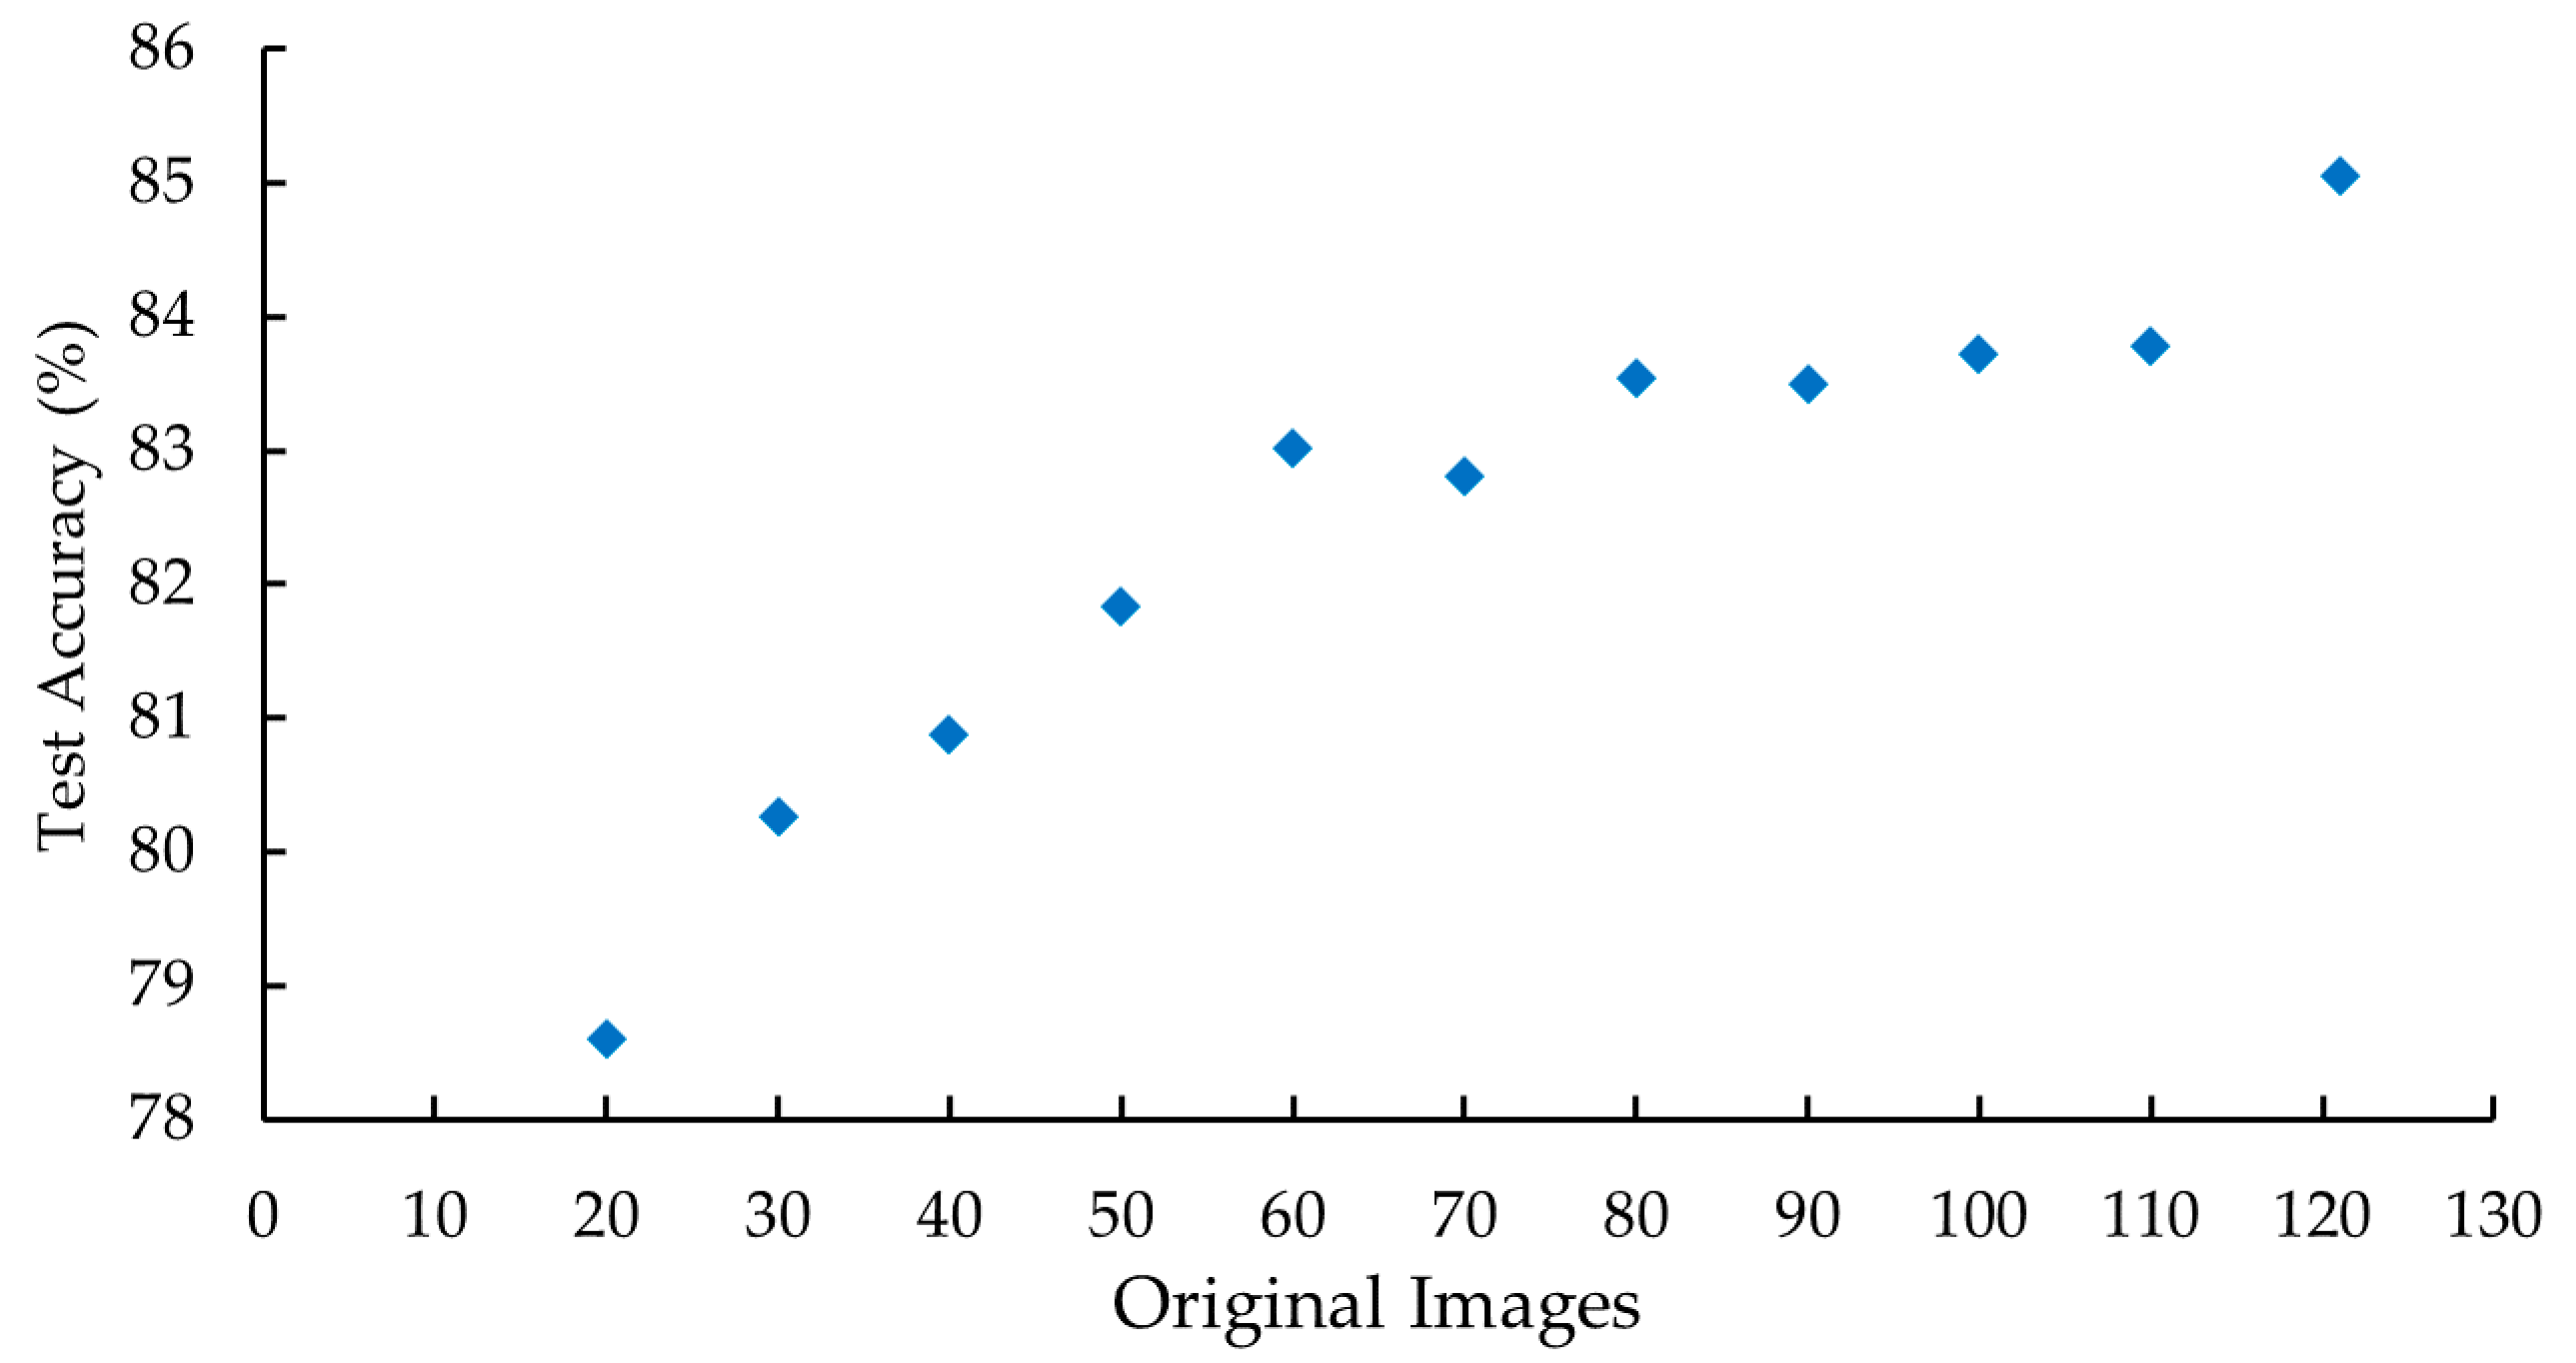
Once the best model was chosen, training was executed employing the same parameters with different dataset sizes in order to analyse the evolution of the test accuracy. The aim was to predict the possibility of model improvement in case we were to add new training pictures. The dataset size varied between 20 and 121 original images, i.e., 160 and 968 images after applying data augmentation, with 10 original images steps. The test accuracy indicator obtained from each case evidenced an enhancement as the dataset size increased, as shown in Figure 6. This trend suggests that by increasing the size of the training set, a more accurate model could be achieved.
To perform a comparison between the best models found for SVM and deep-learning, the following indicators were defined.
Precision = tp tp + fp
Recall = tp tp + fn
F 1 = 2   precision · recall precision + recall
where tp is the number of true positives, fp the number of false positives and fn the number of false negatives.
The deep-learning model has a better average result on accuracy, recall and F1 score, whereas the SVM model presents a better average precision, as shown in Table 4. This means that the deep-learning model is less restrictive, generating a lower number of false negatives, which leads to a 5.16% higher recall. However, as it is less restrictive, more false positives are also found, which lowers the precision to 2.19%. Taking into account the accuracy and F1 score, it can be determined that the best model is the deep learning one. Moreover, the percentages of the test pictures that have the best result with each model have also been obtained for each indicator and presented in the ‘Best model’ row of Table 4. In this case, the best result is achieved by the SVM model except for recall. However, as it can be seen in the following row, the percentages of best model vary significantly in favour of the deep-learning model if it is considered to be the best model with a higher result or up to 3% lower. In contrast, if we proceed in the same way by favouring the SVM model with the same percentage, the results are not improved so substantially. These improvements derived from the 3% favouring in each case are summarised in the last row of Table 4. The enhancement in the percentage of test pictures that obtain their best result for each model, on average for all indicators, would be 15.18% for SVM and 42.86% for deep learning. These results serve as an argument to define the deep-learning model as a priority when it comes to improving it in future work, since a small improvement in the indicators (3%) would lead to a significant improvement in the comparative results with the SVM model, in terms of percentage of best model (42.86%).
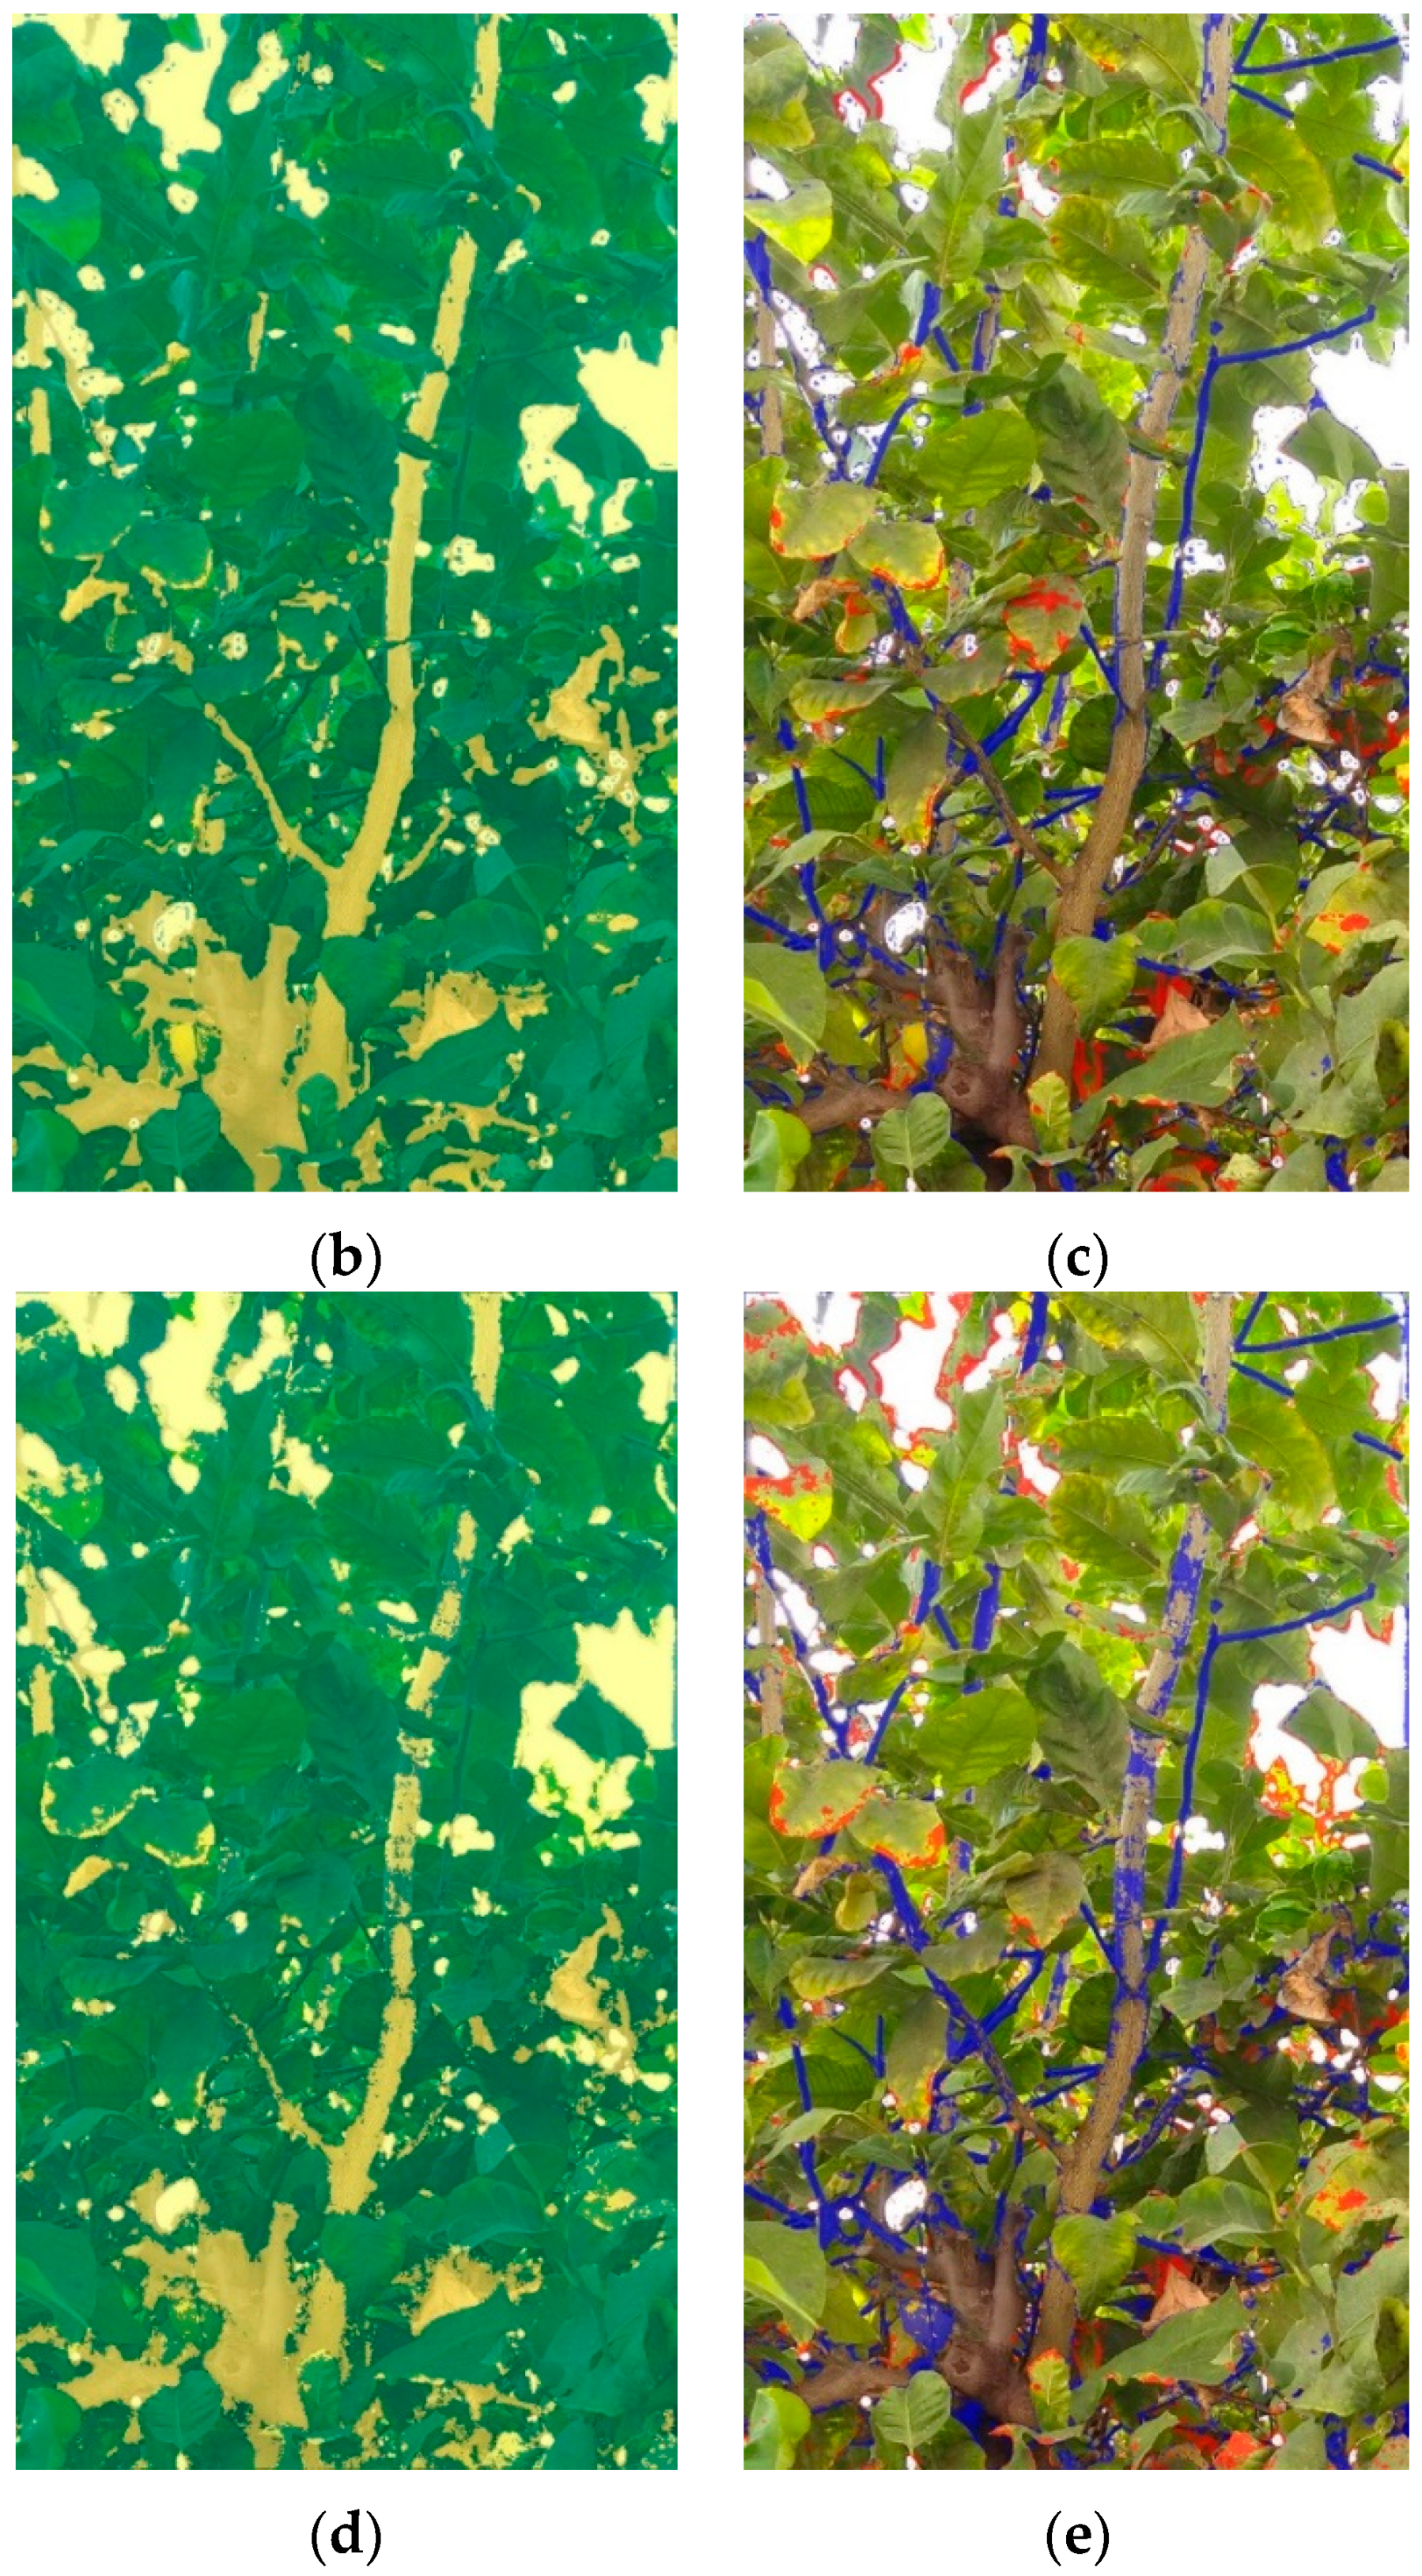
In Figure 7, an example of the image segmentations made by the models for a test picture is shown. The segmentation mask of the model is overlaid on the original picture, assigning the green and yellow colours to “leaf” and “non-leaf” classes, respectively. The mask of the model’s errors is overlaid on the original picture, assigning blue to the false positives (they are not leaves, but have been classified as such) and red to the false negatives (they are leaves, but have not been classified as such).

3.2. Prediction, Training and Data Preparation Time

Not only performance but time cost of the models should be accounted since economic and technical restrictions have to be considered. Prediction, training and data preparation times were analysed in order to evaluate the feasibility of the methods and to underscore the differences between them.
The prediction time of the model for image segmentation is crucial to determine the feasibility of its implementation in a future field application. Additionally, it must be noted that the computing power in this case would be significantly lower if it were not performed remotely. The average times for the segmentation of the test pictures executed by SVM models are presented in Table 5. According to results, SVM prediction time increases with the number of training images. The larger the dataset, the more complex and heavier the model is, so the prediction requires a higher computational cost. In the case of deep-learning models, prediction times are affected by the encoder depth parameter, which defines the number of network layers. Table 5 summarizes the average prediction times for trained deep-learning models with the same encoder depth values.
From the average prediction times of the test pictures in the best SVM and deep-learning models, which are shown in Table 6, it is appreciated that the SVM model takes approximately 42 times more prediction time. The SVM model is simpler, but requires individual prediction of each of the pixels that make up the picture. In contrast, the deep-learning model with the SegNet network architecture based on the encoder-decoder structure is more agile in prediction.
The time needed for models training is not a determining parameter to consider in the comparison between models, since it is a machine processing time and it is performed only once. However, it is interesting to take this into account as excessively high times could be a problem for future training with a greater number of pictures. Table 7 shows how the training time of SVM models rises as the dataset increases, as expected. In the case of the deep-learning model, the training time depends on the number of training images that compose the dataset, added to the validation frequency and validation patience parameters that define the stop criteria, as well as the learning rate and the regularization value.
Based on the results of the best SVM and deep-learning models, which are indicated in Table 8, the SVM model takes approximately 67 times less training time. The SVM model is simpler and its training does not require the computational capacity that the deep-learning model does.
The time it takes to prepare the data for training is a key factor in the process. This can be a bottleneck and the most determinant procedure, as the resulting model will be as good as the data we are training with. The data preparation times are then compared for both methods in Table 9. In the case of SVM, the computation time of the clustering and the time of manual classification of the clusters by means of the GUI are taken into account. Instead, for the deep-learning model it is necessary to add to the time for mask generation in the previous process, the manual editing time to adjust it perfectly. It is obtained that for each picture the preparation time of the SVM model is significantly lower (27 times) than that of the deep learning one. The manual editing time of the ground-truth mask represents the biggest stumbling block in this process. If these times are considered for all the pictures used in both cases, the total time is approximately 10 hours for SVM (251 pictures) and 126 hours for deep learning (121 pictures). The deep learning model required 116 hours more time for half of the training images.
4. Discussion

In general, the segmentation methods performed accurately with elements such as trunks, branches, sky and clouds. False positives were found with green fruits and green branches. Besides, false negatives with leaves in regions of problematic illumination have also been reported.
SVM has been demonstrated to be limited in this application. Despite having a much shorter data preparation time, significantly improvement in prediction is not expected, no matter how much the dataset size is increased. Neither does it seem promising to study new hybrid colour spaces composed by other channels or to add new ones. This limitation lies in the clustering method itself, rather than in the data.
Better results were obtained with deep learning, even using few pictures for training. Due to the size of the dataset, which represents a limitation, it was not possible for the model to reach the whole ability to recognize the shapes and textures of the elements of interest. An accuracy improvement by the deep learning model is expected with a larger training set. Specifically, it is considered important to add cases for training in which the model has presented poorer results. The objective is to penalize by means of the dataset the convergence of the training process in a concrete sense. If it contains more regions with doubtful fruits or branches, the model will be forced to extract differentiating features that allow its discrimination to be improved in order to optimize the monitoring parameter.

5. Conclusions

A segmentation method to discriminate leaf and non-leaf regions in images has been presented in this paper. SVM and deep-learning models were proposed to achieve this objective and were found to have 83.11 and 86.27% F1 score, respectively. The SVM model has shown limitations in terms of further improvement of results. However, a much shorter data preparation time must be employed. The deep-learning model was selected as the best option and it is proposed as the one to be developed in a future work.
Next steps would involve the implementation of the developed model in a portable unit, together with a thermal camera to measure the leaves temperature at field conditions, and to compare with other methods. Additionally, future studies should investigate the addition of new segmentation classes in the model that represent the different elements we can find in the pictures, e.g. one class for branches, another one for fruits, the sky, etc. The fact of defining an exclusive class for these elements can facilitate the extraction of their specific characteristics, as opposed to encompassing them in the background. Moreover, the information to decide according to the relative position of the classes is also taken into account. Nevertheless, a significant increase of masks generation and classification time has to be considered. Other interesting options could be the definition of individual models for different phenotypes, since leaves shape is characteristic of each of them, or the use of a pre-trained model with initialized weights, which would reduce the necessity of increasing the dataset size, as previous experience is hoarded. The procedure presented could also be followed to generate a leaf segmentation model for other species. Image segmentation models proposed here could also be employed in other applications for the measurement of other ranges of the electromagnetic spectrum image-based parameters.

Author Contributions

Conceptualization, R.T.-S. and J.G.-G.; methodology, J.G.-G. and R.T.-S.; software, J.G.-G.; validation, J.D.G.-T., F.S.-V., M.J.-B., A.B.T.-M. and J.G.-G.; formal analysis J.G.-G.; investigation, J.G.-G.; resources, R.T.-S. and J.G.-G.; data curation, R.T.-S., J.D.G.-T., F.S.-V., M.J.-B., A.B.T.-M. and J.G.-G.; writing—original draft preparation, J.G.-G., J.D.G.-T. and R.T.-S.; writing—review and editing, J.D.G.-T., M.J.-B., F.S.-V., A.B.T.-M., R.T.-S. and J.G.-G.; visualization, J.G.-G.; supervision, R.T.-S.; project administration, R.T.-S.; funding acquisition, R.T.-S, J.D.G.-T. All authors have read and agreed to the published version of the manuscript.

Funding

This research was funded in the call for aid for R&D projects corresponding to the Programa Estatal de Investigación, Desarrollo e Innovación orientada a los retos de la sociedad 2016 by the Ministerio de Ciencia, Innovacion y Universidades - Agencia Estatal de Investigacion (AEI) and co-financed by the European Regional Development Fund (FEDER) | Ministerio de Educación, Cultura y Deporte (FPU17/05155) | Fundación Séneca, Agencia de Ciencia y Tecnología of the Region of Murcia under the ‘Excellence Group Program 19895/GERM/15’.

Acknowledgments

The authors would like to acknowledge the support of Miriam Montoya in language assistance.

Conflicts of Interest

The authors declare no conflict of interest. The founding sponsors had no role in the design of the study; in the collection, analyses, or interpretation of data; in the writing of the manuscript; and in the decision to publish the results.

Appendix A

Table A1. Deep-learning model’s parameters (1/2).
Deep Learning1234567891011
Images575757112112112112112112121121
Dataset575757112112112672672896968968
Image EnhancementNYNNYNNNNNY
Data AugmentationNNNNNNx6x6x8x8x8
Encoder Depth22222422222
Optimizersgdmsgdmsgdmsgdmsgdmsgdmsgdmsgdmsgdmsgdmsgdm
Learning rate1 × 10−21 × 10−21 × 10−11 × 10−21 × 10−21 × 10−21 × 10−21 × 10−21 × 10−21 × 10−21 × 10−2
Regularization value1 × 10−41 × 10−41 × 10−41 × 10−41 × 10−41 × 10−41 × 10−41 × 10−41 × 10−41 × 10−41 × 10−4
Validation frequency20202020202020100150150150
Validation patience55555555555
Table A2. Deep-learning model’s parameters (2/2).
Deep Learning1213141516171819202122
Images121121121121121121121121121121121
Dataset968968968968968968968968968968968
Image EnhancementNNNNNNNNNNN
Data Augmentation×8×8×8×8×8×8×8×8×8×8×8
Encoder Depth45655555555
Optimizersgdmsgdmsgdmsgdmsgdmsgdmsgdmsgdmsgdmrmspropadam
Learning rate1 × 10−21 × 10−21 × 10−21 × 10−21 × 10−21 × 10−11 × 10−31 × 10−21 × 10−21 × 10−21 × 10−2
Regularization value1 × 10−41 × 10−41 × 10−41 × 10−41 × 10−41 × 10−41 × 10−41 × 10−31 × 10−51 × 10−41 × 10−4
Validation frequency150150150150150150150150150150150
Validation patience5551015555555

References

  1. English, M.J.; Nuss, G.S. Designing for Deficit Irrigation. J. Irrig. Drain. Div. 1982, 108, 91–106. [Google Scholar]
  2. Hargreaves, G.H.; Samani, Z.A. Economic Considerations of Deficit Irrigation. J. Irrig. Drain. Eng. 1984, 110, 343–358. [Google Scholar] [CrossRef]
  3. Tayfur, G.; Tanji, K.K.; House, B.; Robinson, F.; Teuber, L.; Kruse, G. Modeling Deficit Irrigation in Alfalfa Production. J. Irrig. Drain. Eng. 1995, 121, 442–451. [Google Scholar] [CrossRef] [Green Version]
  4. Fereres, E.; Soriano, M.A. Deficit irrigation for reducing agricultural water use. J. Exp. Bot. 2006, 58, 147–159. [Google Scholar] [CrossRef] [Green Version]
  5. Naor, A. Midday stem water potential as a plant water stress indicator for irrigation scheduling in fruit trees. Acta Hortic. 2000, 537, 447–454. [Google Scholar] [CrossRef]
  6. Elfving, D.C.; Kaufmann, M.R.; Hall, A.E. Interpreting Leaf Water Potential Measurements with a Model of the Soil-Plant-Atmosphere Continuum. Physiol. Plant. 1972, 27, 161–168. [Google Scholar] [CrossRef]
  7. Idso, S.B.; Jackson, R.D.; Pinter, P.J.; Reginato, R.J.; Hatfield, J.L. Normalizing the stress-degree-day parameter for environmental variability. Agric. Meteorol. 1981, 24, 45–55. [Google Scholar] [CrossRef]
  8. Jackson, R.D.; Idso, S.B.; Reginato, R.J.; Pinter, P.J. Canopy Temperature as a Crop Water Stress Indicator. Water Resour. Res. 1981, 17, 1133–1138. [Google Scholar] [CrossRef]
  9. Berni, J.A.J.; Zarco-Tejada, P.J.; Sepulcre-Cantó, G.; Fereres, E.; Villalobos, F. Mapping canopy conductance and CWSI in olive orchards using high resolution thermal remote sensing imagery. Remote Sens. Environ. 2009, 113, 2380–2388. [Google Scholar] [CrossRef]
  10. Blonquist, J.M.; Norman, J.M.; Bugbee, B. Automated measurement of canopy stomatal conductance based on infrared temperature. Agric. For. Meteorol. 2009, 149, 1931–1945. [Google Scholar] [CrossRef]
  11. Kimes, D.S.; Idso, S.B.; Pinter, P.J.; Reginato, R.J.; Jackson, R.D. View angle effects in the radiometric measurement of plant canopy temperatures. Remote Sens. Environ. 1980, 10, 273–284. [Google Scholar] [CrossRef]
  12. Costa, J.M.; Grant, O.M.; Chaves, M.M. Thermography to explore plant-environment interactions. J. Exp. Bot. 2013, 64, 3937–3949. [Google Scholar] [CrossRef] [PubMed]
  13. Leinonen, I.; Jones, H.G. Combining thermal and visible imagery for estimating canopy temperature and identifying plant stress. J. Exp. Bot. 2004, 55, 1423–1431. [Google Scholar] [CrossRef] [PubMed] [Green Version]
  14. Jones, H.G.; Serraj, R.; Loveys, B.R.; Xiong, L.; Wheaton, A.; Price, A.H. Thermal infrared imaging of crop canopies for the remote diagnosis and quantification of plant responses to water stress in the field. Funct. Plant. Biol. 2009, 36, 978–989. [Google Scholar] [CrossRef] [Green Version]
  15. Chaerle, L.; Van Der Straeten, D. Imaging techniques and the early detection of plant stress. Trends Plant. Sci. 2000, 5, 495–501. [Google Scholar] [CrossRef]
  16. Hellebrand, H.; Beuche, H.; Dammer, K.; Flath, K. Plant evaluation by NIR-imaging and thermal imaging. In Proceedings of the AgEng Conference on Engineering Future, Leuven, Belgium, 12–16 September 2004. [Google Scholar]
  17. Fuentes, S.; De Bei, R.; Pech, J.; Tyerman, S. Computational water stress indices obtained from thermal image analysis of grapevine canopies. Irrig. Sci. 2012, 30, 523–536. [Google Scholar] [CrossRef]
  18. Keller, K.; Kirchgessner, N.; Khanna, R.; Siegwart, R.; Walter, A.; Aasen, H. Soybean Leaf Coverage Estimation with Machine Learning and Thresholding Algorithms for Field Phenotyping. In Proceedings of the British Machine Vision Conference, Newcastle Upon Tyne, UK, 3–6 September 2018. [Google Scholar]
  19. Janwale, A.; Lomte, S.S. Plant Leaves Image Segmentation Techniques: A Review. Int. J. Comput. Sci. Eng. 2017, 5, 147–150. [Google Scholar]
  20. Xiaodong, T.; Manhua, L.; Hui, Z.; Wei, T. Leaf extraction from complicated background. In Proceedings of the 2009 2nd International Congress on Image and Signal Processing CISP’09, Tianjin, China, 17–19 October 2009; pp. 1–5. [Google Scholar]
  21. Kamilaris, A.; Prenafeta-Boldú, F.X. Deep learning in agriculture: A survey. Comput. Electron. Agric. 2018, 147, 70–90. [Google Scholar] [CrossRef] [Green Version]
  22. Satti, V.; Satya, A.; Sharma, S. An Automatic Leaf Recognition System for Plant Identification Using Machine Vision Technology. Int. J. Eng. Sci. Technol. 2013, 5, 874–879. [Google Scholar]
  23. Wang, Z.; Chi, Z.; Feng, D. Shape-Based Leaf Image Retrieval System. IEEE Proc. Vis. Image Signal Process. 2003, 150, 34–43. [Google Scholar] [CrossRef]
  24. Prasad, S.; Kudiri, K.M.; Tripathi, R.C. Relative sub-image based features for leaf recognition using support vector machine. In Proceedings of the 2011 International Conference on Communication, Computing & Security—ICCCS ’11, Rourkela, India, 12–14 February 2011; pp. 343–346. [Google Scholar]
  25. Duro, D.C.; Franklin, S.E.; Dubé, M.G. A comparison of pixel-based and object-based image analysis with selected machine learning algorithms for the classification of agricultural landscapes using SPOT-5 HRG imagery. Remote Sens. Environ. 2012, 118, 259–272. [Google Scholar] [CrossRef]
  26. Wang, Z.; Wang, K.; Yang, F.; Pan, S.; Han, Y. Image segmentation of overlapping leaves based on Chan–Vese model and Sobel operator. Inf. Process. Agric. 2018, 5, 1–19. [Google Scholar] [CrossRef]
  27. Cerutti, G.; Kurtz, C.; Vacavant, A.; Tougne, L.; Weber, J.; Grand-Brochier, M. Tree Leaves Extraction in Natural Images: Comparative Study of Preprocessing Tools and Segmentation Methods. IEEE Trans. Image Process. 2015, 24, 1549–1560. [Google Scholar]
  28. Liu, J.; Pattey, E. Retrieval of leaf area index from top-of-canopy digital photography over agricultural crops. Agric. For. Meteorol. 2010, 150, 1485–1490. [Google Scholar] [CrossRef]
  29. Pape, J.M.; Klukas, C. 3-d histogram-based segmentation and leaf detection for rosette plants. Lect. Notes Comput. Sci. (Incl. Subser. Lect. Notes Artif. Intell. Lect. Notes Bioinform.) 2015, 8928, 61–74. [Google Scholar]
  30. Ward, D.; Moghadam, P.; Hudson, N. Deep leaf segmentation using synthetic data. aiXiv 2019, arXiv:abs/1807.10931. [Google Scholar]
  31. Singh, V.; Misra, A.K. Detection of plant leaf diseases using image segmentation and soft computing techniques. Inf. Process. Agric. 2017, 4, 41–49. [Google Scholar] [CrossRef] [Green Version]
  32. Xia, C.; Wang, L.; Chung, B.-K.; Lee, J.-M. In Situ 3D Segmentation of Individual Plant Leaves Using a RGB-D Camera for Agricultural Automation. Sensors 2015, 15, 20463–20479. [Google Scholar] [CrossRef]
  33. Xia, C.; Lee, J.M.; Li, Y.; Song, Y.H.; Chung, B.K.; Chon, T.S. Plant leaf detection using modified active shape models. Biosyst. Eng. 2013, 116, 23–35. [Google Scholar] [CrossRef]
  34. Zheng, L.; Zhang, J.; Wang, Q. Mean-shift-based color segmentation of images containing green vegetation. Comput. Electron. Agric. 2009, 65, 93–98. [Google Scholar] [CrossRef]
  35. MATLAB—El Lenguaje del Cálculo Técnico—MATLAB & Simulink. Available online: https://es.mathworks.com/products/matlab.html (accessed on 18 June 2019).
  36. GIMP—GNU Image Manipulation Program. Available online: https://www.gimp.org/ (accessed on 18 June 2019).
  37. Cheng, H.D.; Jiang, X.H.; Sun, Y.; Wang, J. Color Image Segmentation: Advances and Prospects. Pattern Recognit. 2001, 34, 2259–2281. [Google Scholar] [CrossRef]
  38. Ojala, T.; Rautiainen, M.; Matinmikko, E.; Aittola, M. Semantic Image Retrieval with HSV Correlograms. In Proceedings of the 12th Scandinavian Conference on Image Analysis, Bergen, Norway, 11–14 June 2001; pp. 621–627. [Google Scholar]
  39. Badrinarayanan, V.; Kendall, A.; Cipolla, R. SegNet: A Deep Convolutional Encoder-Decoder Architecture for Image Segmentation. IEEE Trans. Pattern Anal. Mach. Intell. 2017, 39, 2481–2495. [Google Scholar] [CrossRef] [PubMed]
Figure 1. Support vector machine (SVM) method diagram.
Applsci 10 00202 g001
Figure 2. Cluster classification example. (a) original image; (b) mask overlaid to original image; (c) checkboxes for cluster classification.
Applsci 10 00202 g002
Figure 3. Mask manual edition example. (a) original picture; (b) clustering classification mask; (c) edited mask.
Applsci 10 00202 g003
Figure 4. SVM 4 learning curve.
Applsci 10 00202 g004
Figure 5. Deep-learning model 13 training process.
Applsci 10 00202 g005
Figure 6. Deep-learning test accuracy vs. number of training images.
Applsci 10 00202 g006
Figure 7. Test picture segmentation example: (a) original image, (b) SVM segmentation, (c) SVM errors, (d) deep-learning segmentation, (e) deep-learning errors.
Applsci 10 00202 g007aApplsci 10 00202 g007b
Table 1. Support vector machine (SVM) test accuracy results.
SVM1234
Images50122190251
Mean Test Accuracy of the best model (%)74.9077.9582.4883.09
Best model (%) 13.5710.7121.4364.29
Best model 4 @1% (%) 23.577.140.0089.29
Mean Test Accuracy of Model Generation Iterations (%)73.7176.5981.2082.53
1 Percentage of the pictures that present the best result with each model. 2 Best model considering 1% better the model number 4.
Table 2. Deep-learning test accuracy results (1/2).
Deep Learning1234567891011
Mean Test Accuracy of the best model (%)78.2179.8181.9683.5382.3082.9184.6184.4982.9484.6783.07
Mean Test Accuracy of Model Generation Iterations (%)69.1375.3470.6078.3879.7076.4479.2378.7879.2279.7980.44
Table 3. Deep-learning test accuracy results (2/2).
Deep Learning1213141516171819202122
Mean Test Accuracy of the best model (%)83.9085.0583.5584.9084.1483.3483.1383.6084.1678.0180.60
Mean Test Accuracy of Model Generation Iterations (%)80.5180.2678.2880.6680.9967.5677.2678.9880.6167.2773.66
Table 4. SVM and deep-learning results.
Accuracy (%)Precision (%)Recall (%)F1 Score (%)
SVM 4Deep Learning 13SVM 4Deep Learning 13SVM 4Deep Learning 13SVM 4Deep Learning 13
Mean83.0985.0590.5488.3581.1286.2883.1186.27
Best model (%)64.2935.7185.7114.2946.4353.5764.2935.71
Best model Deep Learning @3% (%) 117.8682.1442.8657.1414.2985.7114.2985.71
Best model SVM @3% (%) 282.1417.8692.867.1464.2935.7182.1417.86
Improvement (%) 317.8646.437.1442.8617.8632.1417.8650.00
1 Best model considering Deep Learning 3% better. 2 Best model considering SVM 3% better. 3 Difference between Best model and Best model @3%.
Table 5. SVM and deep-learning prediction time.
SVMImages50122190251
Prediction Time (s)3.9011.6923.3531.78
Deep LearningEncoder Depth2456
Prediction Time (s)0.7010.7450.7500.761
Table 6. SVM and deep-learning prediction time.
ModelSVM 4Deep Learning 13
Images251121
Prediction Time (s)31.780.76
Table 7. SVM training time.
SVM1234
Images50122190251
Train Time (s)0.473.508.6615.17
Table 8. SVM and deep-learning training time.
ModelSVM 4Deep Learning 13
Images251121
Train Time (min)0.2516.75
Table 9. SVM and deep-learning data preparation time per image.
ModelSVMDeep Learning
Clustering (min)0.330.33
Cluster Classification (min)22
GIMP (min)-60
Data Preparation Time (min)2.3362.33