1. Introduction
Many researchers have studied mathematical models of the steelmaking process, aiming to predict and automatically control the complicated steelmaking process using computers. An appropriate mathematical model can help us understand the essence of the steelmaking process and improve the techniques used; this is the foundation of automatic control in the steelmaking process. China is one of the main countries which produces steel through vanadium extraction [
1]. The Panzhihua Iron and Steel Group (PISG), located in the Sichuan Province, is one of the most important steel industry bases in China. The region is rich in vanadium–titanium magnetite, whose vanadium content accounts for 61% of the proven reserves in China [
2].
The industrial uses of vanadium–titanium magnetite mainly includes vanadium extraction and steelmaking. At first, vanadium is extracted from the vanadium-containing molten steel in a converter, following which the resultant semi-steel is smelted to steel. Currently, the vanadium extraction process still depends on manual operation and control of the production relies on the experience of operators. Therefore, it is important to establish mathematical models to predict the changes of composition in molten steel and slag.
There have been many studies focused on mathematical models of the steelmaking process. Shukla et al. [
3] studied the converter steelmaking process from thermodynamic and kinetic standpoints, obtained the reaction trend when the process was regarded at thermodynamic equilibrium, and compared it with the actual process. Takawa et al. [
4] proposed a mathematical model that can be applied to an automatic blowing process and gave an estimate of the content of some components in the molten steel by sampling analysis of the blowing process. Reichel and Szekely [
5] established a mathematical model of the AOD (Argon Oxygen Decarburization) and VOD (Vacuum Oxygen Decarburization) refining processes. According to their model, in the case of high carbon, the decarburization rate is proportional to the oxygen supply rate; while, in the case of low carbon, the decarburization rate is related to both the carbon content and oxygen supply rate. Johansson et al. [
6] established a non-linear model to consider the estimation of carbon content in the process of steelmaking and proved that the error is locally asymptotically stable. Konno et al. [
7] developed a general dynamic system simulator as a tool to analyze dynamic systems, represented by differential equations, difference equations, and algebraic equations. Han Min et al. [
8] proposed an endpoint prediction model based on correlation vector machines to predict the carbon content and temperature of an oxygen converter. Fruehan [
9] put forward some hypotheses on the oxidation mechanisms of C and Cr under different conditions and developed a reaction model to predict the oxidation rates of C and Cr in the AOD process. Deb Roy and Robertson [
10,
11] proposed a mathematical model for stainless steel refining and validated the model with data obtained from a 45-ton converter producing 304 stainless steel. Asai and Szekely [
12,
13] put forward a mathematical model of the stainless steel decarbonizing process, based on the mass and heat balance of the system. Wang et al. [
14] obtained a multiple linear regression model to predict the oxygen blowing quantity by analyzing the factors that affect oxygen consumption during the basic oxygen furnace steelmaking process. The Nippon steel corporation [
15] has developed an expert system for converter steelmaking. Li et al. [
16] established a prediction model and control model based on a neural network by analyzing BOF steelmaking characteristics. Wei and Zhu [
17,
18] believed that the distribution ratio of oxygen which is blown to the molten pool across various elements is proportional to its Gibbs free energy of reaction. However, few studies have focused on mathematical models of vanadium extraction. Xu et al. [
19] proposed a series of kinetic models of reactions in the oxygen converter, based on the results of the experiments and a parameter estimation method, in which the dynamic behaviors of vanadium, silicon, and carbon in the oxygen converter bath are described. In addition, there have been a few penetrating studies on mathematical models of the vanadium extraction process.
In this paper, based on the relevant theories of physics and chemistry, mathematical models of the vanadium extraction process are established to describe and predict the changes of composition in molten steel and slag during vanadium extraction. The numerical simulation results of the model are compared with the existing results, and its advantages over existing models are discussed. Theoretical analysis of the model explains the contradiction between “vanadium extraction” and “carbon protection”; furthermore, the model is used to analyze the competitive oxidation among elements.
2. Improved Mathematical Model of the Vanadium Extraction Process
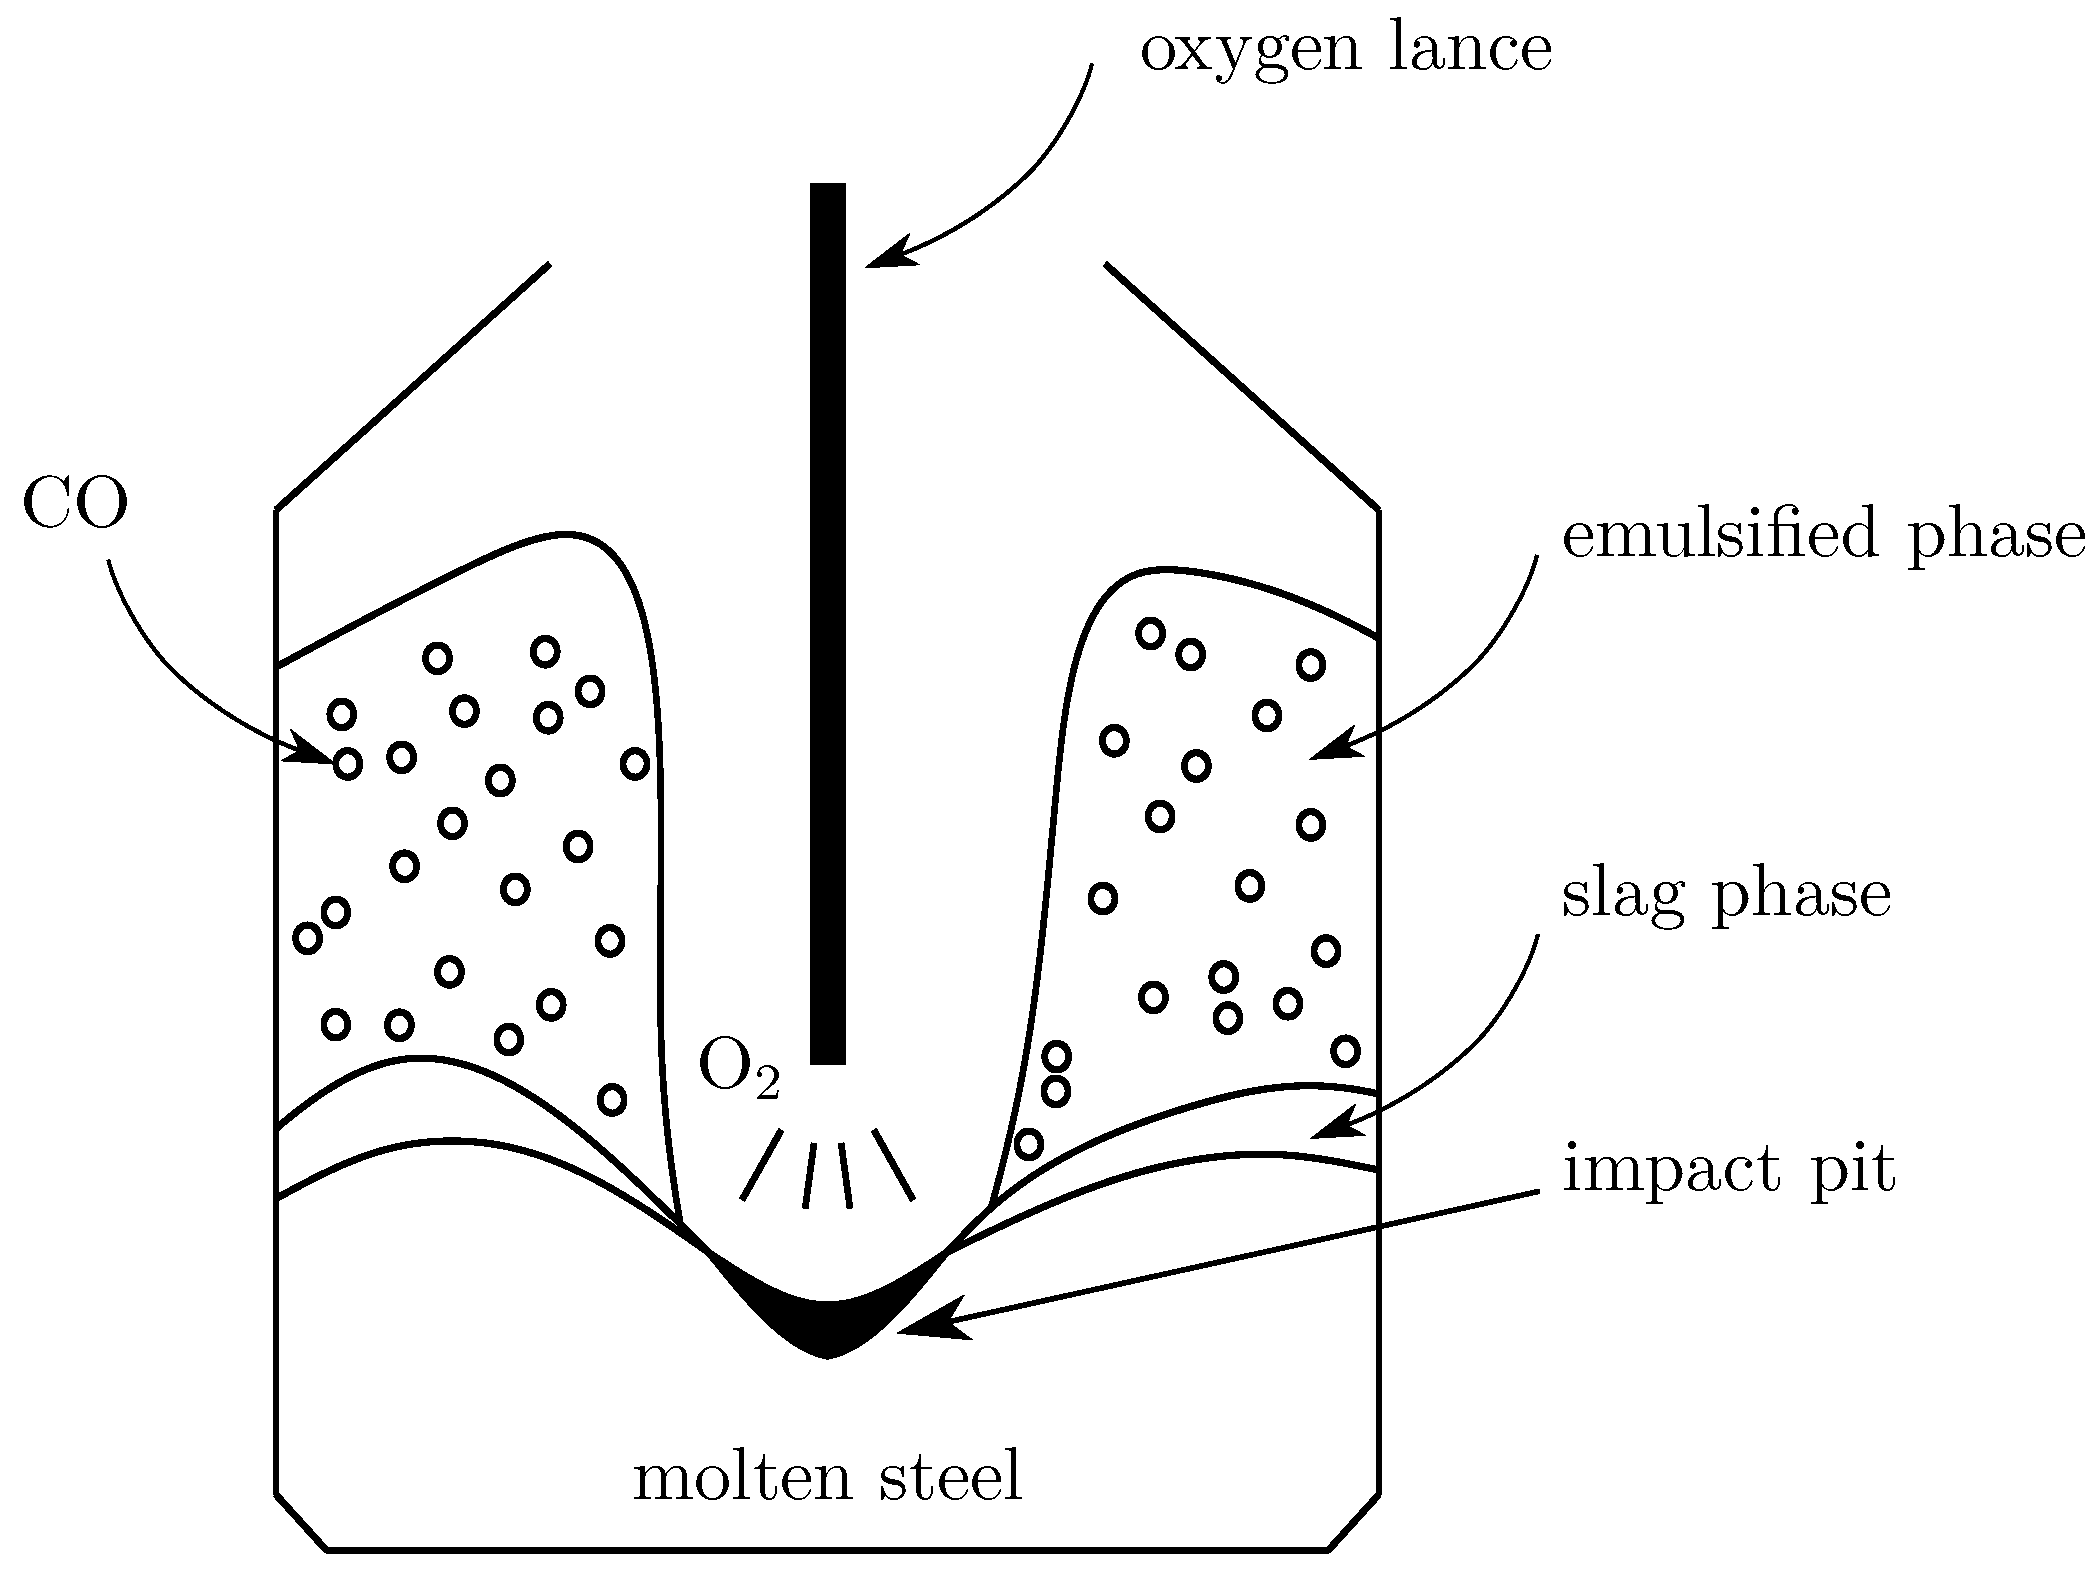
When extracting vanadium in a converter (
Figure 1), vanadium-containing molten steel and a coolant are put together into the converter, following which an oxygen lance is inserted into the converter to blow oxygen at a high pressure. The high-speed oxygen jets interact with the metal melt in the converter, reacting with the elements in the molten steel which, in turn, oxidizes the vanadium to stable vanadium oxides, causing them to group into slag. The element oxidization process in the converter mainly consists of three series links: the diffusion of the reactants to the phase interfaces, interfacial chemical reactions, and the diffusion of the resultants away from the phase interfaces. Among these steps, the one with the lowest rate is called the rate limiting step.
As the slag in the vanadium extraction process is acidic, and as phosphorus and sulfur in the molten pool have been shown to not be involved in the reaction [
20], we mainly consider the elements iron, carbon, vanadium, titanium, silicon, manganese, and oxygen in the molten steel. In this paper, substances in the metal phase (molten steel) are denoted by
, where
represents
; the substances in the gaseous phase (gas) are denoted by
, where
represents
and
; and the substances in the slag phase (slag) are denoted by
, where
represents
. Note that vanadium has many oxidation states; however, vanadium mainly has been shown to have a valence of
in the slag [
21], which we assume for convenience.
2.1. The Gas–Liquid Interface of the Impact Pit
Due to the impact of the top-blown oxygen jet, an impact pit forms on the surface of the molten pool. at the gas–liquid interface of the impact pit, the oxygen is absorbed at the surface of the impact pit, and
,
,
,
,
, and
in the molten steel are oxidized. Although the dissolved elements in molten steel have an affinity for oxygen, the number of iron atoms at the surface of molten pool is much larger than other elements and, so, the oxidation of
is still at an absolute advantage [
22]. For convenience, it is assumed that the oxidation reaction of
only occurs on the interface of impact pit, and all oxidation products of
are
; which oxidizes other elements as an oxidant. The oxidation reaction equation of
is
If the oxygen pressure, flow, and oxygen lance position remain unchanged, the shape and size of the impact pit remain almost constant. Therefore, the contact area of
and
is basically unchanged. The chemical reaction (
1) is carried out rapidly at a high temperature and, so, the chemical reaction process does not become a rate limiting step. Assuming that the oxidation rate of
in the impact pit is proportional to the oxygen blowing rate, then the oxidation rate of
at the gas–liquid interface of the impact pit is
where
is the mass change rate of
at the interface of the impact pit,
is the molar mass of substance
,
is the utilization of oxygen,
is the flow rate of top-blown oxygen gas, and
is the molar volume of the gas.
2.2. The Slag–Metal Interface
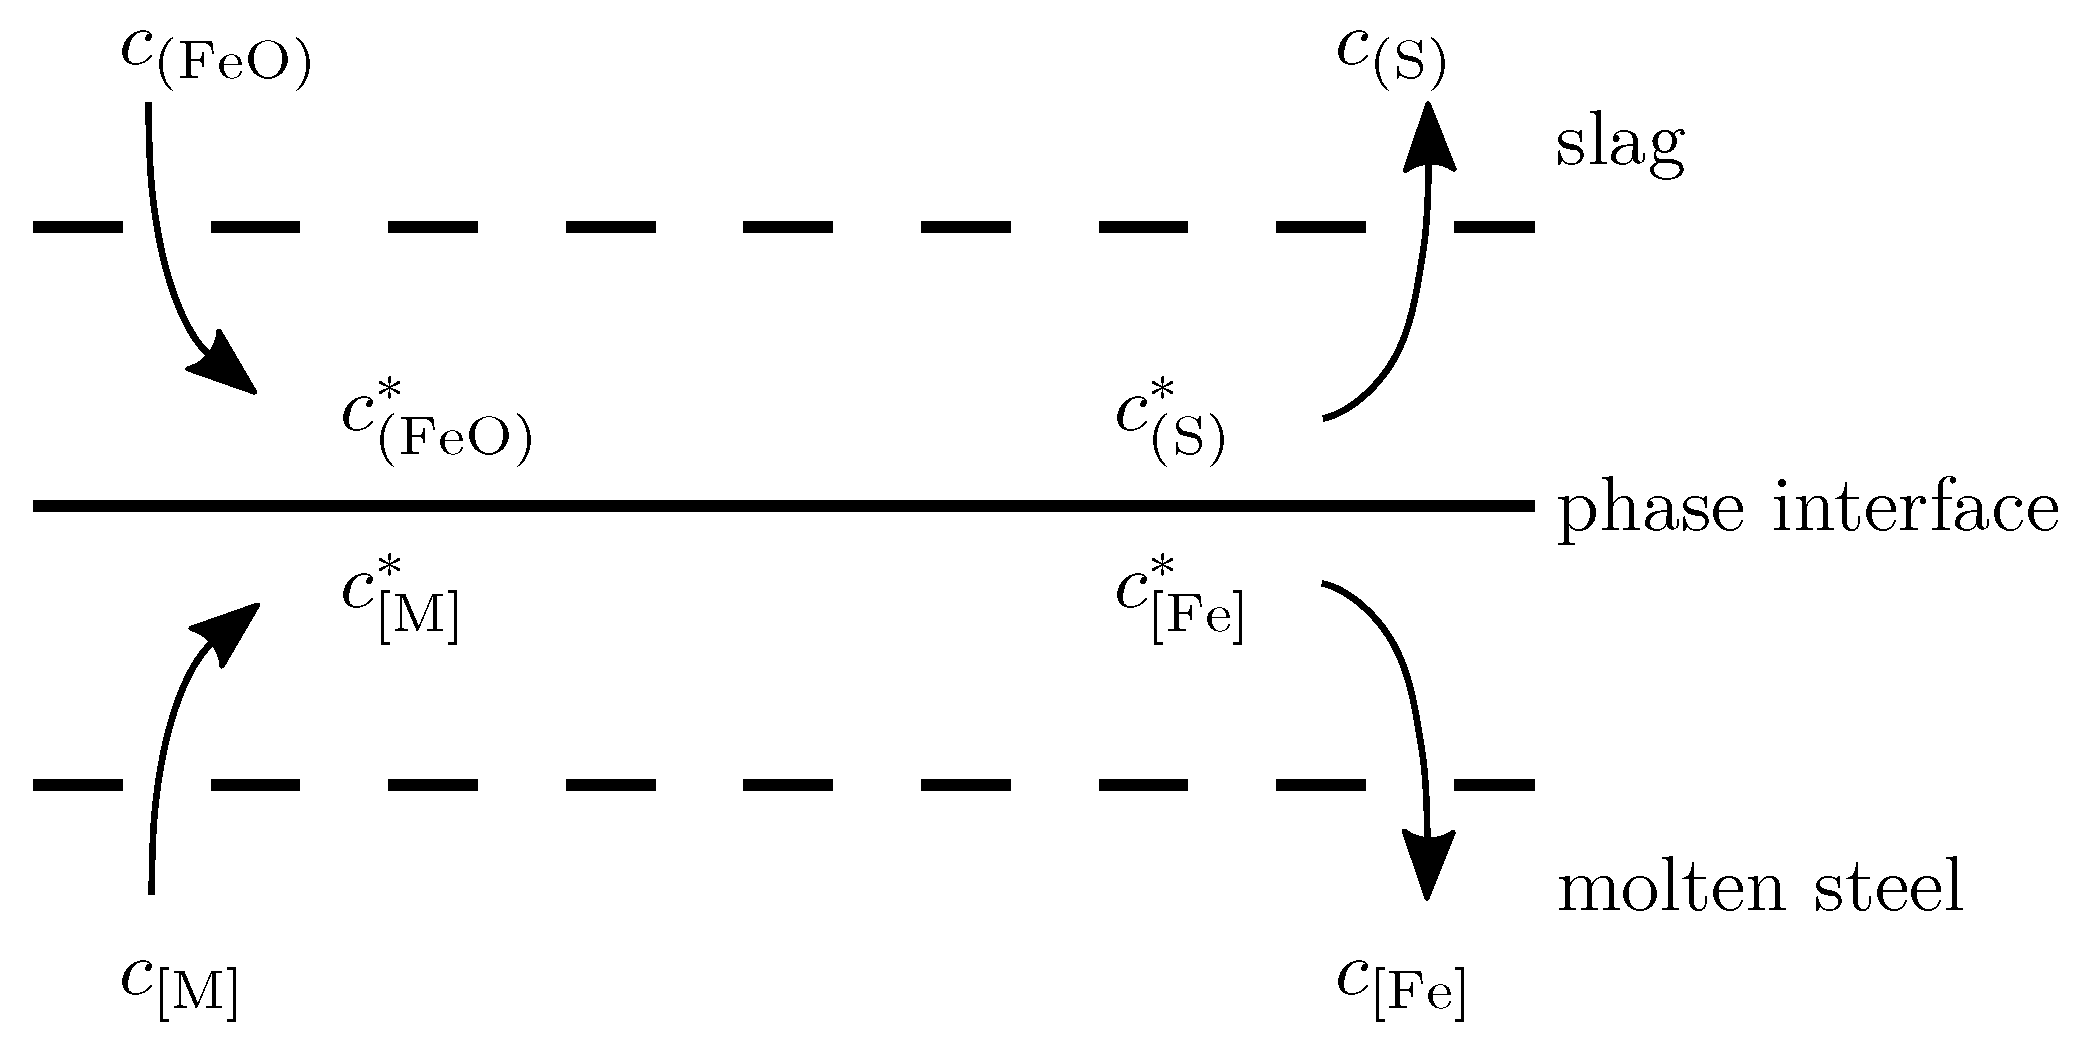
When the molten pool is strongly stirred, the slag is broken and incorporated into the molten steel to form the slag–metal interface. Within the system composed of molten metal and slag, due to different physical properties or flow velocities, there exist boundary layers [
22] representing the mass transfer resistances on both sides of the phase interface. As shown in
Figure 2, due to the concentration difference, each component
(with a concentration of
) and
(with a concentration of
) diffuse to the phase interface, where their concentrations are denoted by
and
, respectively. Similarly, each component
(with a concentration of
) and
(with a concentration of
) in the phase interface diffuse to the slag and molten steel, where their concentrations are denoted by
and
, respectively. The whole chemical reaction process consists of reactant diffusion, interface reaction, and product diffusion.
As an oxidant, the
generated by top-blown oxygen oxidizes
,
,
, and
at the slag–metal interface. The corresponding chemical reaction equations are
In order to establish the rate equation of the chemical reactions (
3)–(
6), the rate limiting elements of the chemical reactions are analyzed from the two following aspects:
Interface Chemical Reaction: The interface chemical reaction is carried out rapidly at a high temperature, and the chemical reaction process does not become the rate limiting step.
Mass Transfer of Reactant and Resultant: Generally, the concentrations of the reactant and the resultant are high, and their mass transfer processes will not be the rate limiting step.
Therefore, the mass transfer processes of the reactants
and the products
are the rate limiting steps. The rates of the interface reactions are regulated by each other. It is generally considered that the diffusion processes on both sides of the slag–metal interface satisfy the steady-state principle [
22]. According to the definition of a rate limiting step, the diffusion rates of
can reveal the rates of the interface reactions (
3)–(
6). By Fick’s law [
23], we have
where
is the diffusion rate of
,
is the contact area for chemical reactions at the slag–metal interface,
is the mol change rate of
at the slag–metal interface,
is the mass transfer coefficient of
,
is the concentration of
, and
is the concentration of
at the slag-metal interface. According to (
7)–(
10), the rate change equation of
can be derived, as long as
can be determined.
According to the literature, the interfacial concentration equations are obtained by assuming that the interface reaction is in thermodynamic equilibrium [
20,
24] or by usng the distribution ratio of oxygen [
17]. However, the key idea of these different modeling ideas is to give an estimate of the interface concentration, either directly or indirectly. As the oxidation rate of the element
is related to the Gibbs free energy
of (
3)–(
6), the concentration
, and the mass transfer coefficient
, we can assume that the oxidation rate of the element is proportional to the product of
,
and
; that is,
where
. Under the typical temperature used for vanadium extraction, the Gibbs free energy of
is much greater than that of
,
, and
. Therefore,
will be oxidized preferentially. Only when the interfacial concentration of
is very low, will the other elements begin to be oxidized. The temperature in the converter is very high and, so, the rate of each chemical reaction is very fast. Therefore, once the reactant
diffuses to the interface, it will be consumed rapidly.
So, we take
as an estimate for the interface concentration.
At the slag–metal interface, part of the
generated by the top-blown oxygen enters into the molten steel in the form of dissolved oxygen atoms
; the chemical reaction equation for this is
By Fick’s law, the diffusion fluxes of the reactant
and resultant
are
where
is the mol change rate of
at the slag–metal interface and
is the mass transfer coefficient of
. At high temperatures, the chemical reaction (
13) is carried out rapidly and can be considered to be in equilibrium [
20]. The equilibrium constant is
In stable state, the
diffusing to the interface is entirely used for the oxidation reaction (
3)–(
6) and decomposition reaction (
13); that is,
Slag plays an important role in the converter blowing process. The slag layer is located between the molten steel and the emulsion system, which is related to the slag–metal interface and emulsion system. On one hand, the slag–metal interface is formed through the interaction of slag and molten steel; on the other hand, the emulsion system is formed by slag, molten steel droplets, and bubbles. In many articles [
17,
20,
25], the contact area of reactions has been taken as a constant in the empirical formula; even the mass of the molten steel and slag are considered to be constant, as well. Obviously, this treatment does not provide a representative approximation of the actual process, as the contact area and the masses of the molten steel and slag change over time. Generally, the contact area increases with the mass of slag. This paper assumes that the contact area at the slag–metal interface is proportional to the slag mass:
where
is the total mass of slag and the proportionality coefficient
is a positive constant.
By (
7)–(
12), (
14)–(
18), we can obtain the chemical reaction rate equation of each element present at the slag–metal interface:
where
is the mass change rate of
at the slag–metal interface.
2.3. Emulsion System
During the converter blowing process, the interaction of the supersonic oxygen jet and the gas generated in the converter will break the oxygen jet, molten metal, and slag into droplets and bubbles, generating the metal–slag-bubble emulsion system. The contact area of the chemical reaction in the emulsion system increases rapidly and the oxidation reaction becomes more intense, which is the fundamental reason behind the high reaction speed and high productivity of oxygen converter blowing. Then, films are rapidly formed on the surfaces of the metal droplets which are incorporated into the jet. These droplets are the basic carrier, transferring oxygen into the molten pool. With the rapid motion of the jet, the oxygen-containing droplets participate in the circulation of the molten pool, becoming scattered in the slag and forming an emulsified state.
In the emulsion system, the major oxygen source and product of the decarburizing reaction are
and
. The corresponding chemical reaction equation is
In order to establish the rate equation of the chemical reaction (
25), the rate limiting steps of (
25) are analyzed in the two following aspects:
Interface Chemical Reaction: The interface chemical reaction is carried out rapidly at high temperature and, so, the chemical reaction process does not become the rate limiting step.
Mass Transfer of Reactant and Resultant: Generally, the concentration of the reactant is high and the mass transfer process of will not be the rate limiting step. The concentration of the resultant is also very high and the mass transfer resistance of can be ignored. The resultant is a gas; the mass transfer process of a gas will not be the rate limiting step, either.
Therefore, in this paper, we assume that the main influencing factor of the decarbonization reaction is the mass transfer process of
. By Fick’s law
where
is the contact area of the decarbonization reaction in the emulsion system,
is the mol change rate of
in the emulsion system where the decarbonization occurs,
is the concentration of
at the interface of the decarbonization reaction. According to (
26), the rate change equation of
can be derived, as long as
can be determined.
Generally, as the chemical reactions in the emulsion system are complex and coupled, it is difficult to determine
exactly; hence, we give an estimate of
to establish the rate equation of decarbonization. Note that [
22]
is the case in the process of vanadium extraction. For convenience, let
be our estimate of the interface concentration.
By (
26), (
28), and chemical reaction (
25), we have
In the emulsion system,
passes
to the system by
and oxidizes
,
,
, and
by
Similar to the analysis and assumption used for the slag–metal interface, we obtain
where
is the mass change rate of
in the region of the oxidation and decomposition reactions in the emulsion system,
is the contact area of the oxidation and decomposition reactions in the emulsion system,
is the equilibrium constant of the chemical reaction (
31), and
is the Gibbs free energy of the oxidation reactions (
32)–(
35) in the emulsion system.
The mass of the substance
in the emulsion system is equal to the sum of the masses in the region of the decarburizing reaction and the region of the oxidation and decomposition reactions; that is,
Taking the derivative of (
42) with respect to
t, we get
where
is the mass change rate of
in the emulsion system.
Similar to (
18), we assume that the total contact area of the emulsion system is proportional to the slag mass
where
is the total contact area of the emulsion system and the proportionality coefficient
is a positive constant. The total contact area of the emulsion system is the sum of the contact area of the decarbonization reaction and the contact area of the oxidation and decomposition reactions; that is,
When the external conditions (e.g., oxygen lance position, oxygen flow, and so on) are left basically unchanged, we assume that
and
are basically stable at a certain percentage:
where the proportionality coefficients
and
are positive constants. By (
44)–(
46), we have
where
and
are positive constants.
By (
29)–(
30), (
36)–(
41), (
43), and (
47)–(
48), we obtain the chemical reaction rate equation of each element in the emulsion system as
At this point, the reaction rate equations at the gas–liquid interface, the slag–metal interface, and in the emulsion system have been established. Next, the rate equations for the different interfaces need to be combined to form a closed system.
2.4. Dynamic Model of Vanadium Extraction
The mass of substance
is equal to the sum of the mass in the molten steel
, at the gas–liquid interface of the impact pit
, at the slag–metal interface
, and in the emulsion system
; that is,
Taking the derivative of (
56) with respect to
t, we have
Note that the chemical reaction of the substance
mainly occurs at the gas–liquid interface of impact pit, at the slag–metal interface, and in the emulsion system; it is almost unchanged in the molten steel. Thus,
The concentration of
in the model satisfies
where
is the density of molten steel and
is the mass of the molten steel. The mass of the molten steel is equal to the total mass of each element:
The concentration of
in the model satisfies
where
is the density of the slag and
is the mass of free
. The
in the slag is not only in the form of simple molecules, but is also combined with other oxides and present in the form of complex oxides (such as vanadium–iron spinel
) in the slag. Only free
can react with the material
in the molten steel. We assume that the mass of free
is proportional to the total mass of the
:
where the proportionality coefficient
is a positive constant.
The oxidized
is present as oxides
in the slag. By the law of conservation of mass, we have
where
and
are the initial values of
and
, respectively. Note that
Substituting (
64) into (
63), we have
The slag mass is equal to the sum of the mass of each substance of slag; that is,
Substituting (
62) and (
65) into (
61), we have
By (
2), (
19)–(
24), (
49)–(
55), (
57), (
58), and (
67), and letting the corresponding constants be marked as
,
,
,
,
,
,
,
,
,
,
,
,
,
, and
, we obtain the dynamic model of vanadium extraction as follows:
where
3. Numerical Simulation and Discussion
The values of the mass transfer coefficients of each element in the model are given in
Table 1 [
20]. The values of the standard Gibbs free energy of each element in the model are given in
Table 2 [
22]. The equilibrium constant of the chemical reactions (
13) and (
31) are
where
and
are the Gibbs free energies of the chemical reactions (
13) and (
31) in
Table 2,
is the ideal gas constant, and
and
are the average temperatures of the slag–metal interface and the emulsion system, respectively. According to [
1],
and
can be taken as
The values of the initial conditions of each element in the model are given in
Table 3 [
20,
22]. The proportionality coefficients in the model are given in
Table 4 [
1,
22]. In addition, the oxygen flow
can be taken as [
20]
Furthermore, the densities of molten steel (
) and of slag (
) can be taken as [
22]
According to the parameters and initial conditions above, the MATLAB [
26] numerical simulation results and discussion are as follows.
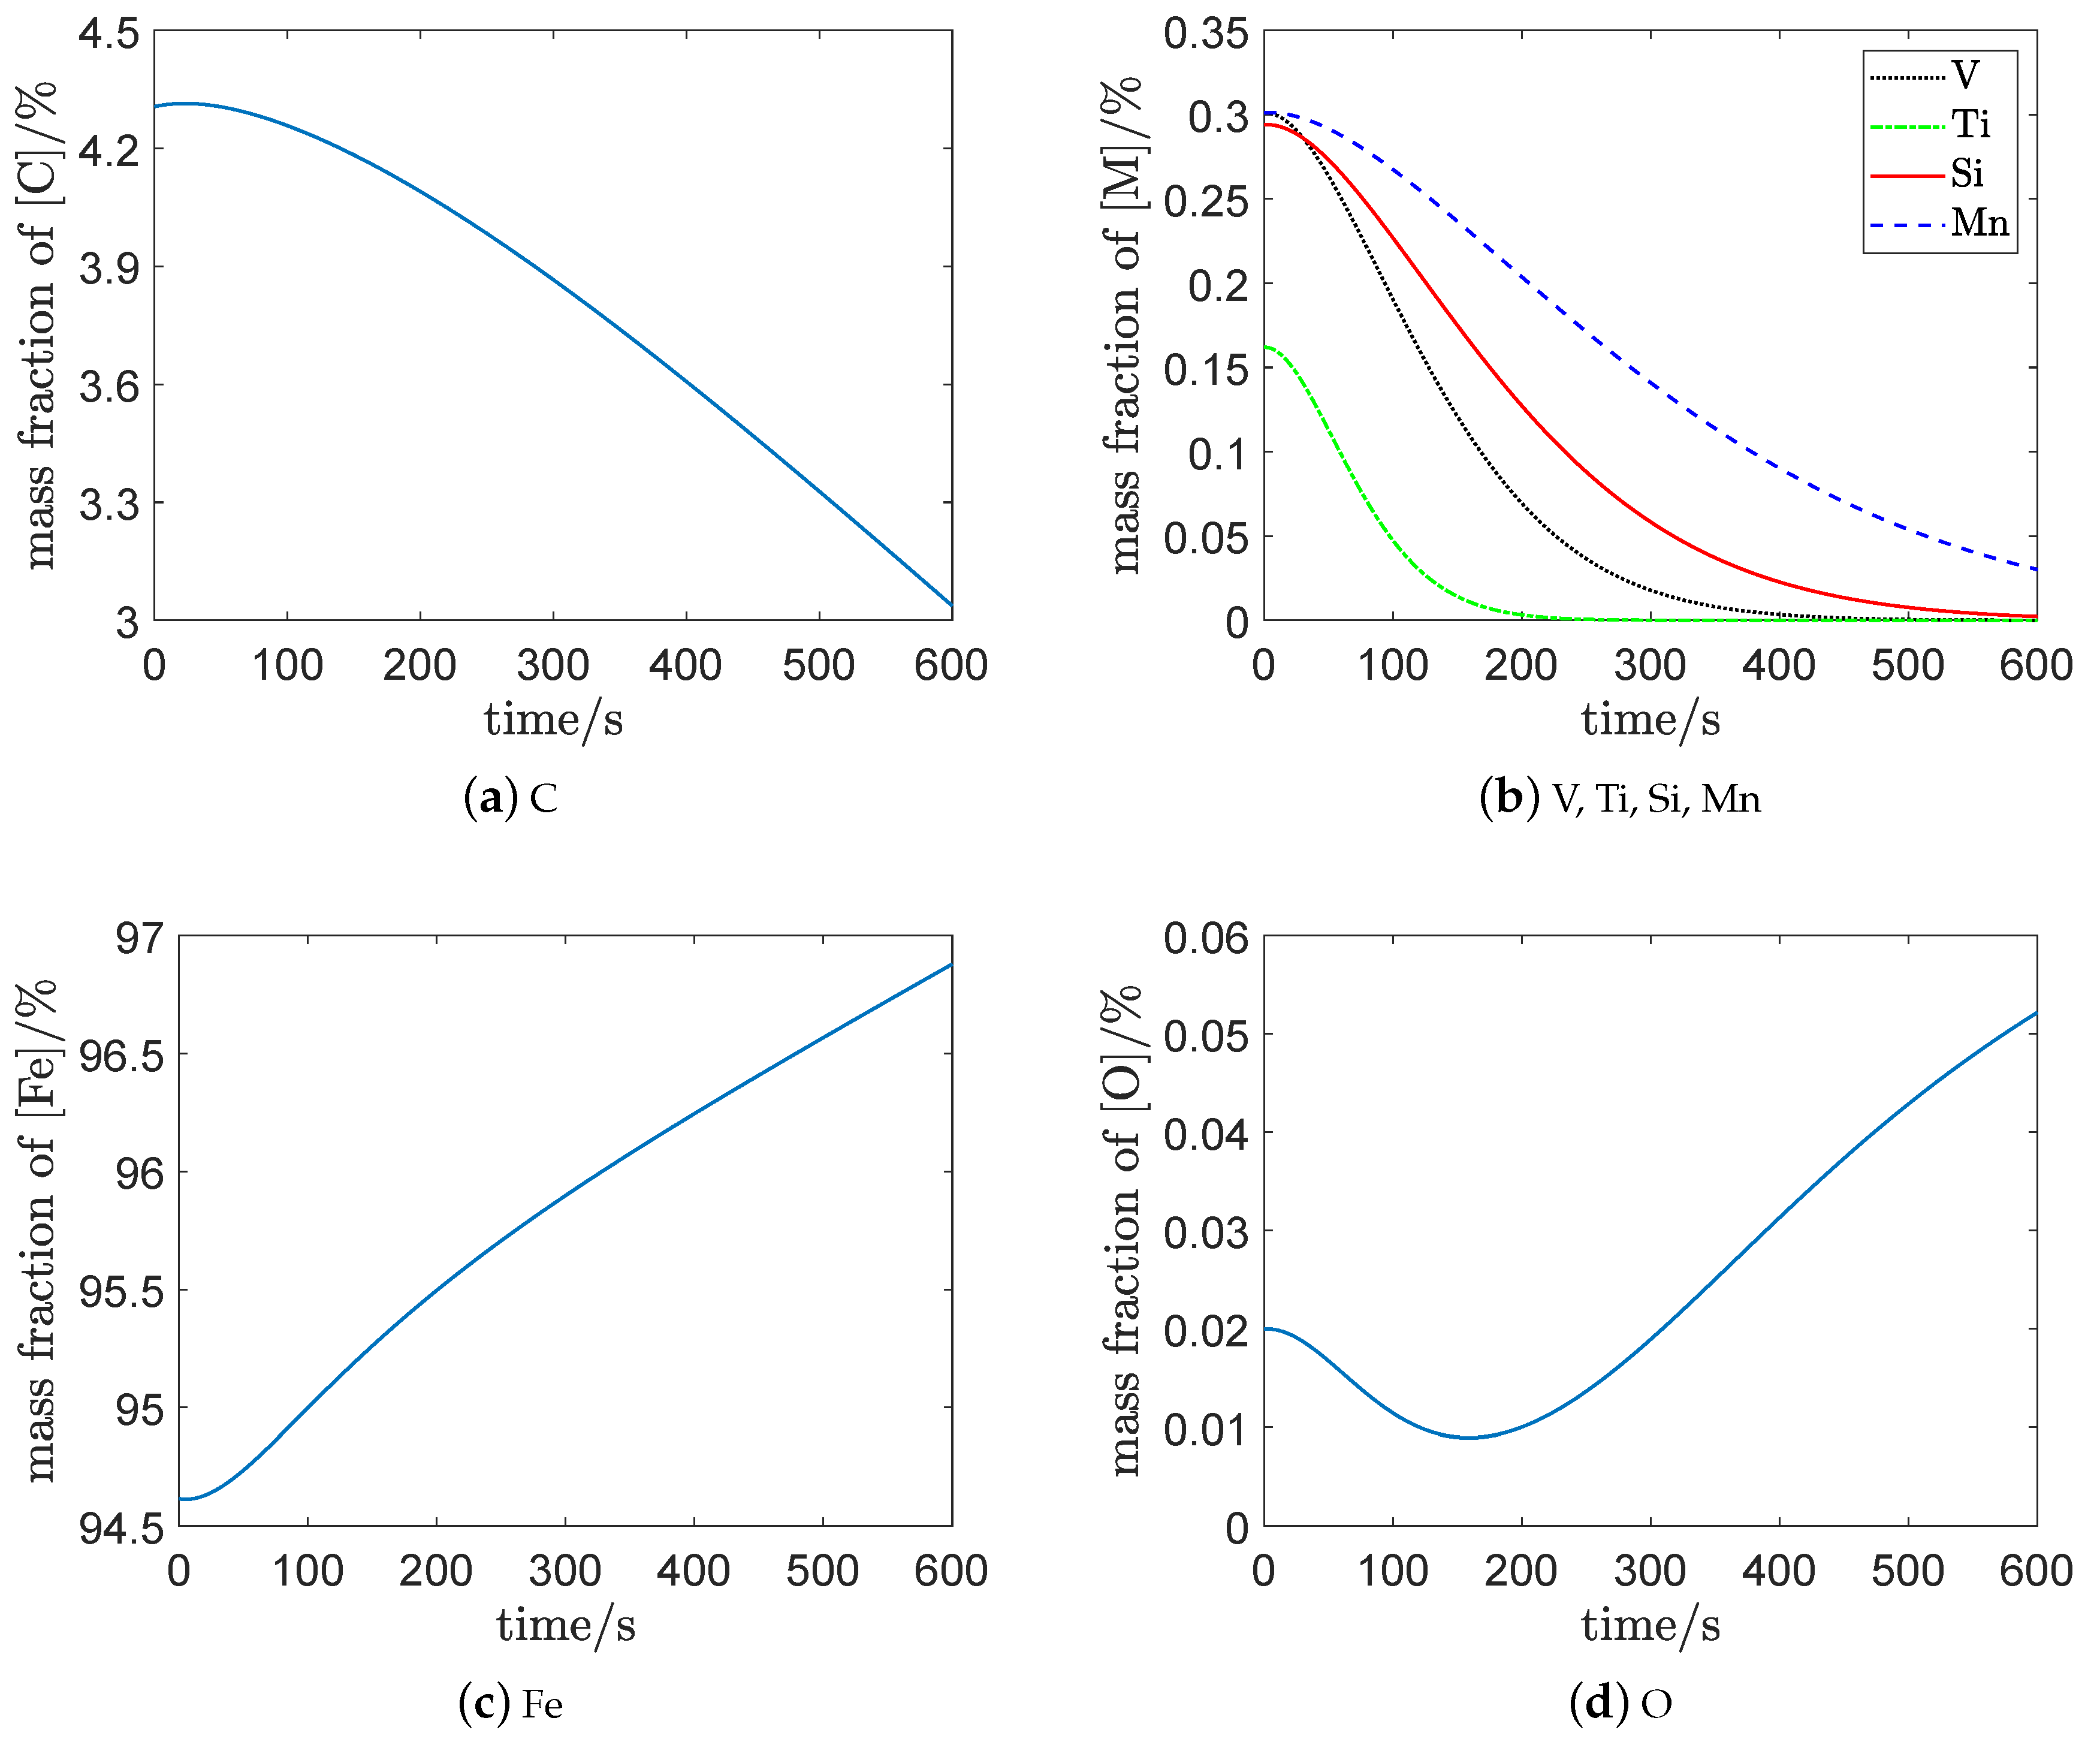
The composition of the molten steel is shown in
Figure 3. From about 0–0.5 min (at the beginning), the slope of each curve is fairly flat, which indicates that the mass fraction remained almost unchanged. The reason for this is that the slag–metal interface and the emulsion system gradually formed at the beginning and, so, the contact area of each reaction was not large enough to visually change the content of each element. As the contact area of the slag–metal interface and the emulsion system are considered to be non-constant, the model in this paper can capture this characteristic.
Figure 3a shows that the carbon content changed slightly at the beginning, with the decarburization rate increasing later. The reason for this is that the emulsion system was present at the beginning of generation and the contact area of the decarbonizing reaction limited the decarbonization rate.
Figure 3a,b show that the mass fraction of
was about
. Meanwhile, the mass fraction of
reached the endpoint control target of the vanadium extraction process [
1]:
where
is the mass fraction of
.
The mass fractions of
and
were about
and
, respectively, when the endpoint control target was reached; which is consistent with
Figure 4 [
1]. In
Figure 4, the mass fraction of
was about
when the mass fraction of
reached
.
The mass fractions of
and
were about
and 0 when the curve of
became approximately parallel to the horizontal axis. In
Figure 4, the mass fraction of
was about
when the mass fraction of
reached
.
According to (
68) and (
69), we have
Integrating both sides of the equation above and substituting the initial conditions, we can obtain the first integrals of
and
:
The Equation (
77) shows that
and
changed uniformly. When
was reduced, the mass of
was reduced accordingly. Equation (
77) implies a contradiction between “vanadium extraction” and “carbon protection”. It is impossible to oxidize all the
into the slag and keep enough
in the molten steel simultaneously. In fact,
as
. That is to say, in order to keep enough carbon, there must be a certain amount of
left.
Similarly to (
77), we obtain a series of the first integrals by (
69)–(
72):
The equation (
78) shows that the competitive oxidation between each element is mainly related to their initial value
and parameter
. The parameter
is related to the mass transfer coefficient of each element and the Gibbs free energy of each reaction. Thus, the initial value and the mass transfer coefficient of each element and the Gibbs free energy of each reaction work together to control their oxidation rate and oxygen consumption ratio, which affects the competitive oxidation between elements. Equation (
78) can be used to estimate the content of each element at the end of vanadium extraction process. For example, it is generally used to measure the carbon content of the iron water after the vanadium extraction process. Then, the other element’s contents can be estimated by using (
78).
At the end of vanadium extraction, the mass fraction of and were approximately parallel to the horizontal axis, which implies that the oxidation of and had been approximately completed. The remaining and in the molten pool are continuously oxidized in the steelmaking process.
Figure 3c shows that the mass fraction of
kept increasing with the oxidation of
,
,
, and
. The reason for this is that a lot of
is generated constantly with the consumption of
, which is then fed back to the molten steel.
Figure 3d shows that the mass fraction of
decreased first, then gradually rose to a higher level. This implies that some
and
combined to supply the oxidants
at the beginning of vanadium extraction process. With the increase of
generated by the top-blown oxygen, the
decomposed to improve
; that is, the mass fraction of
consequently increased.
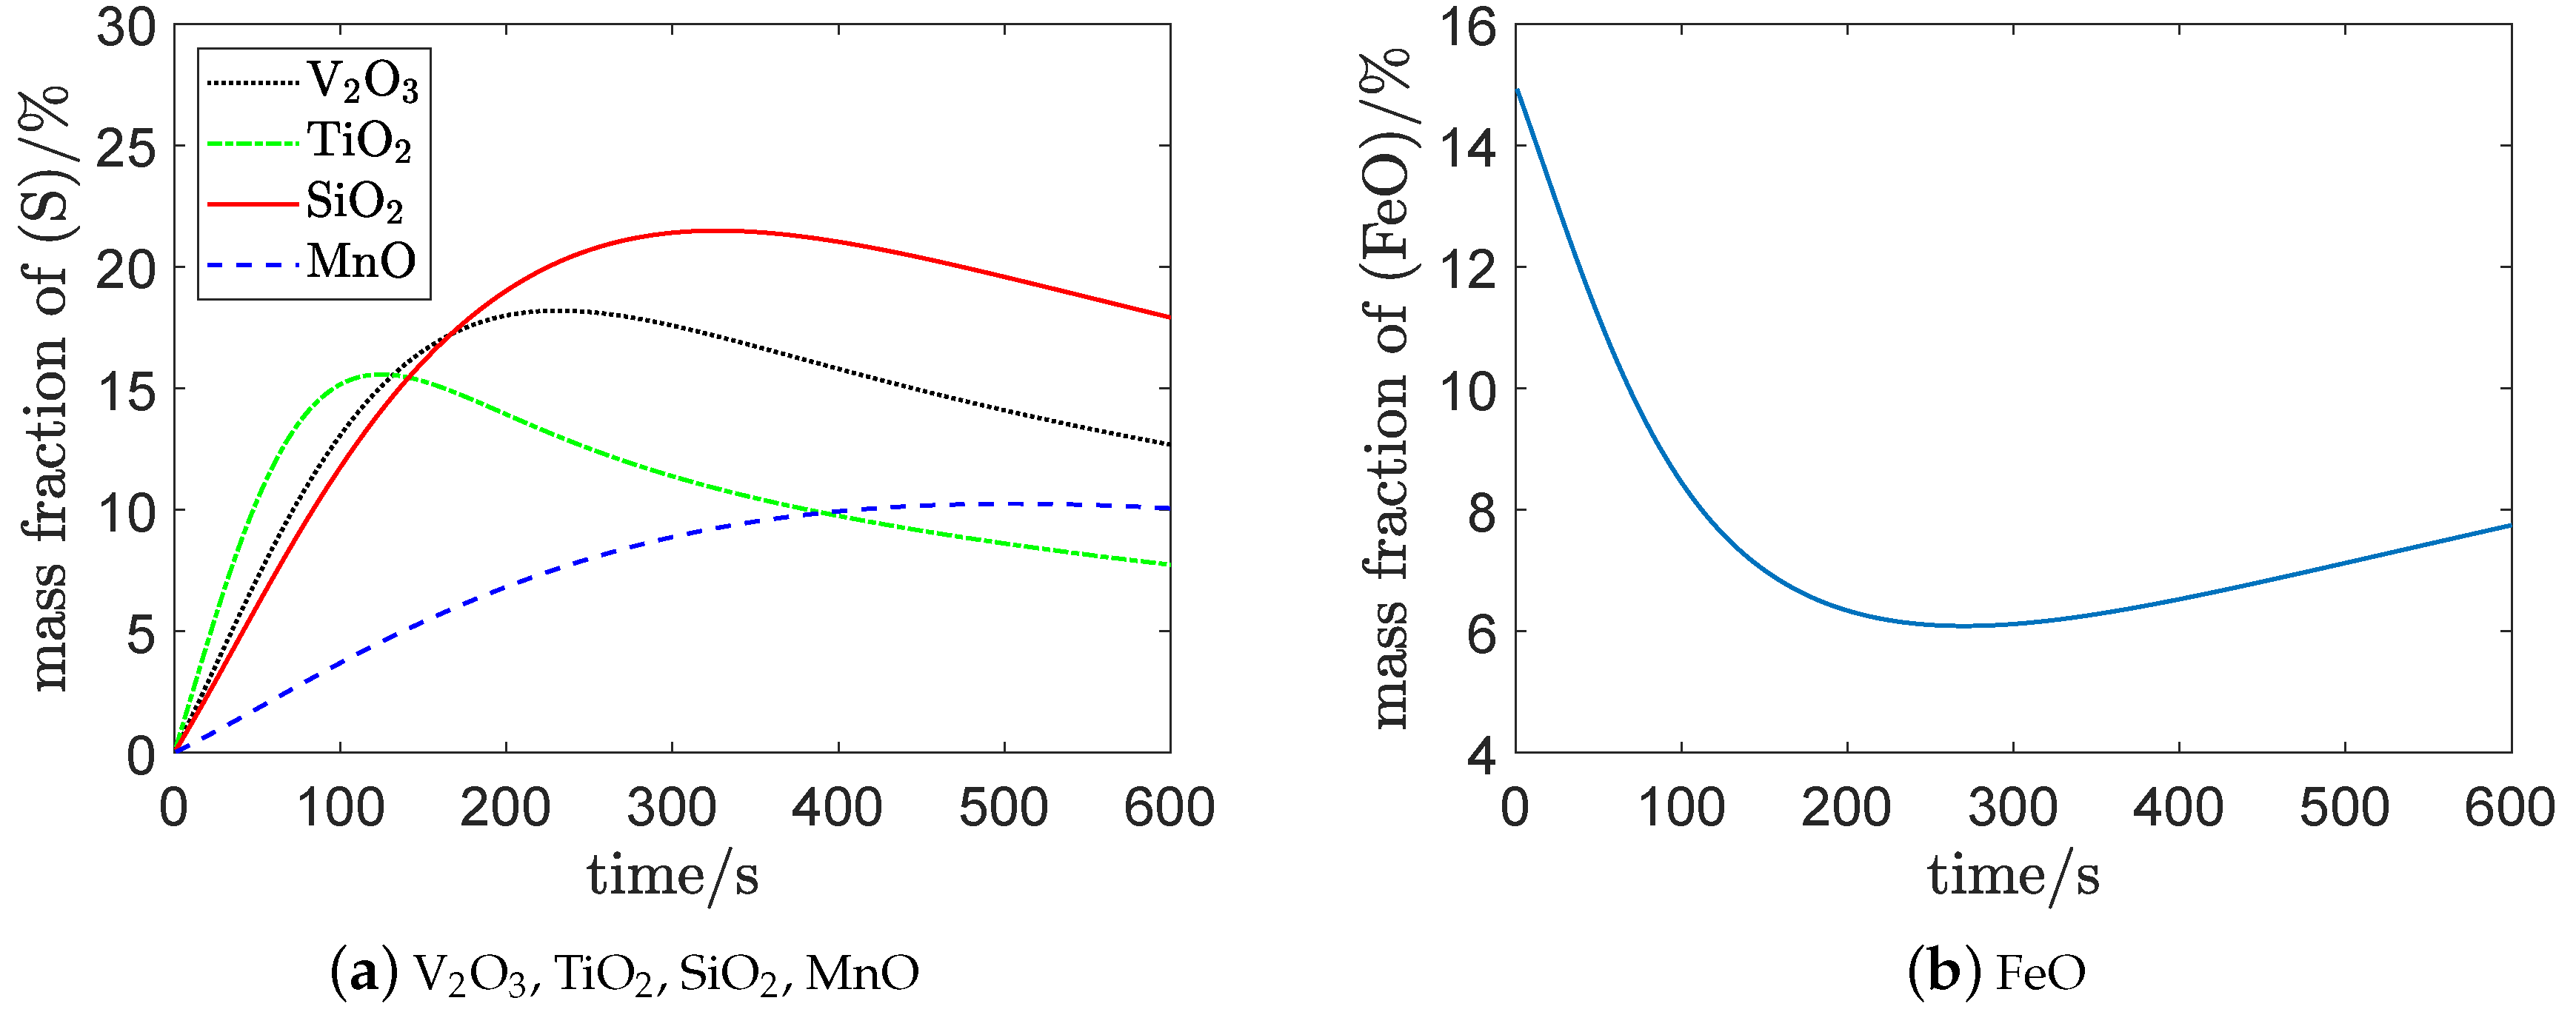
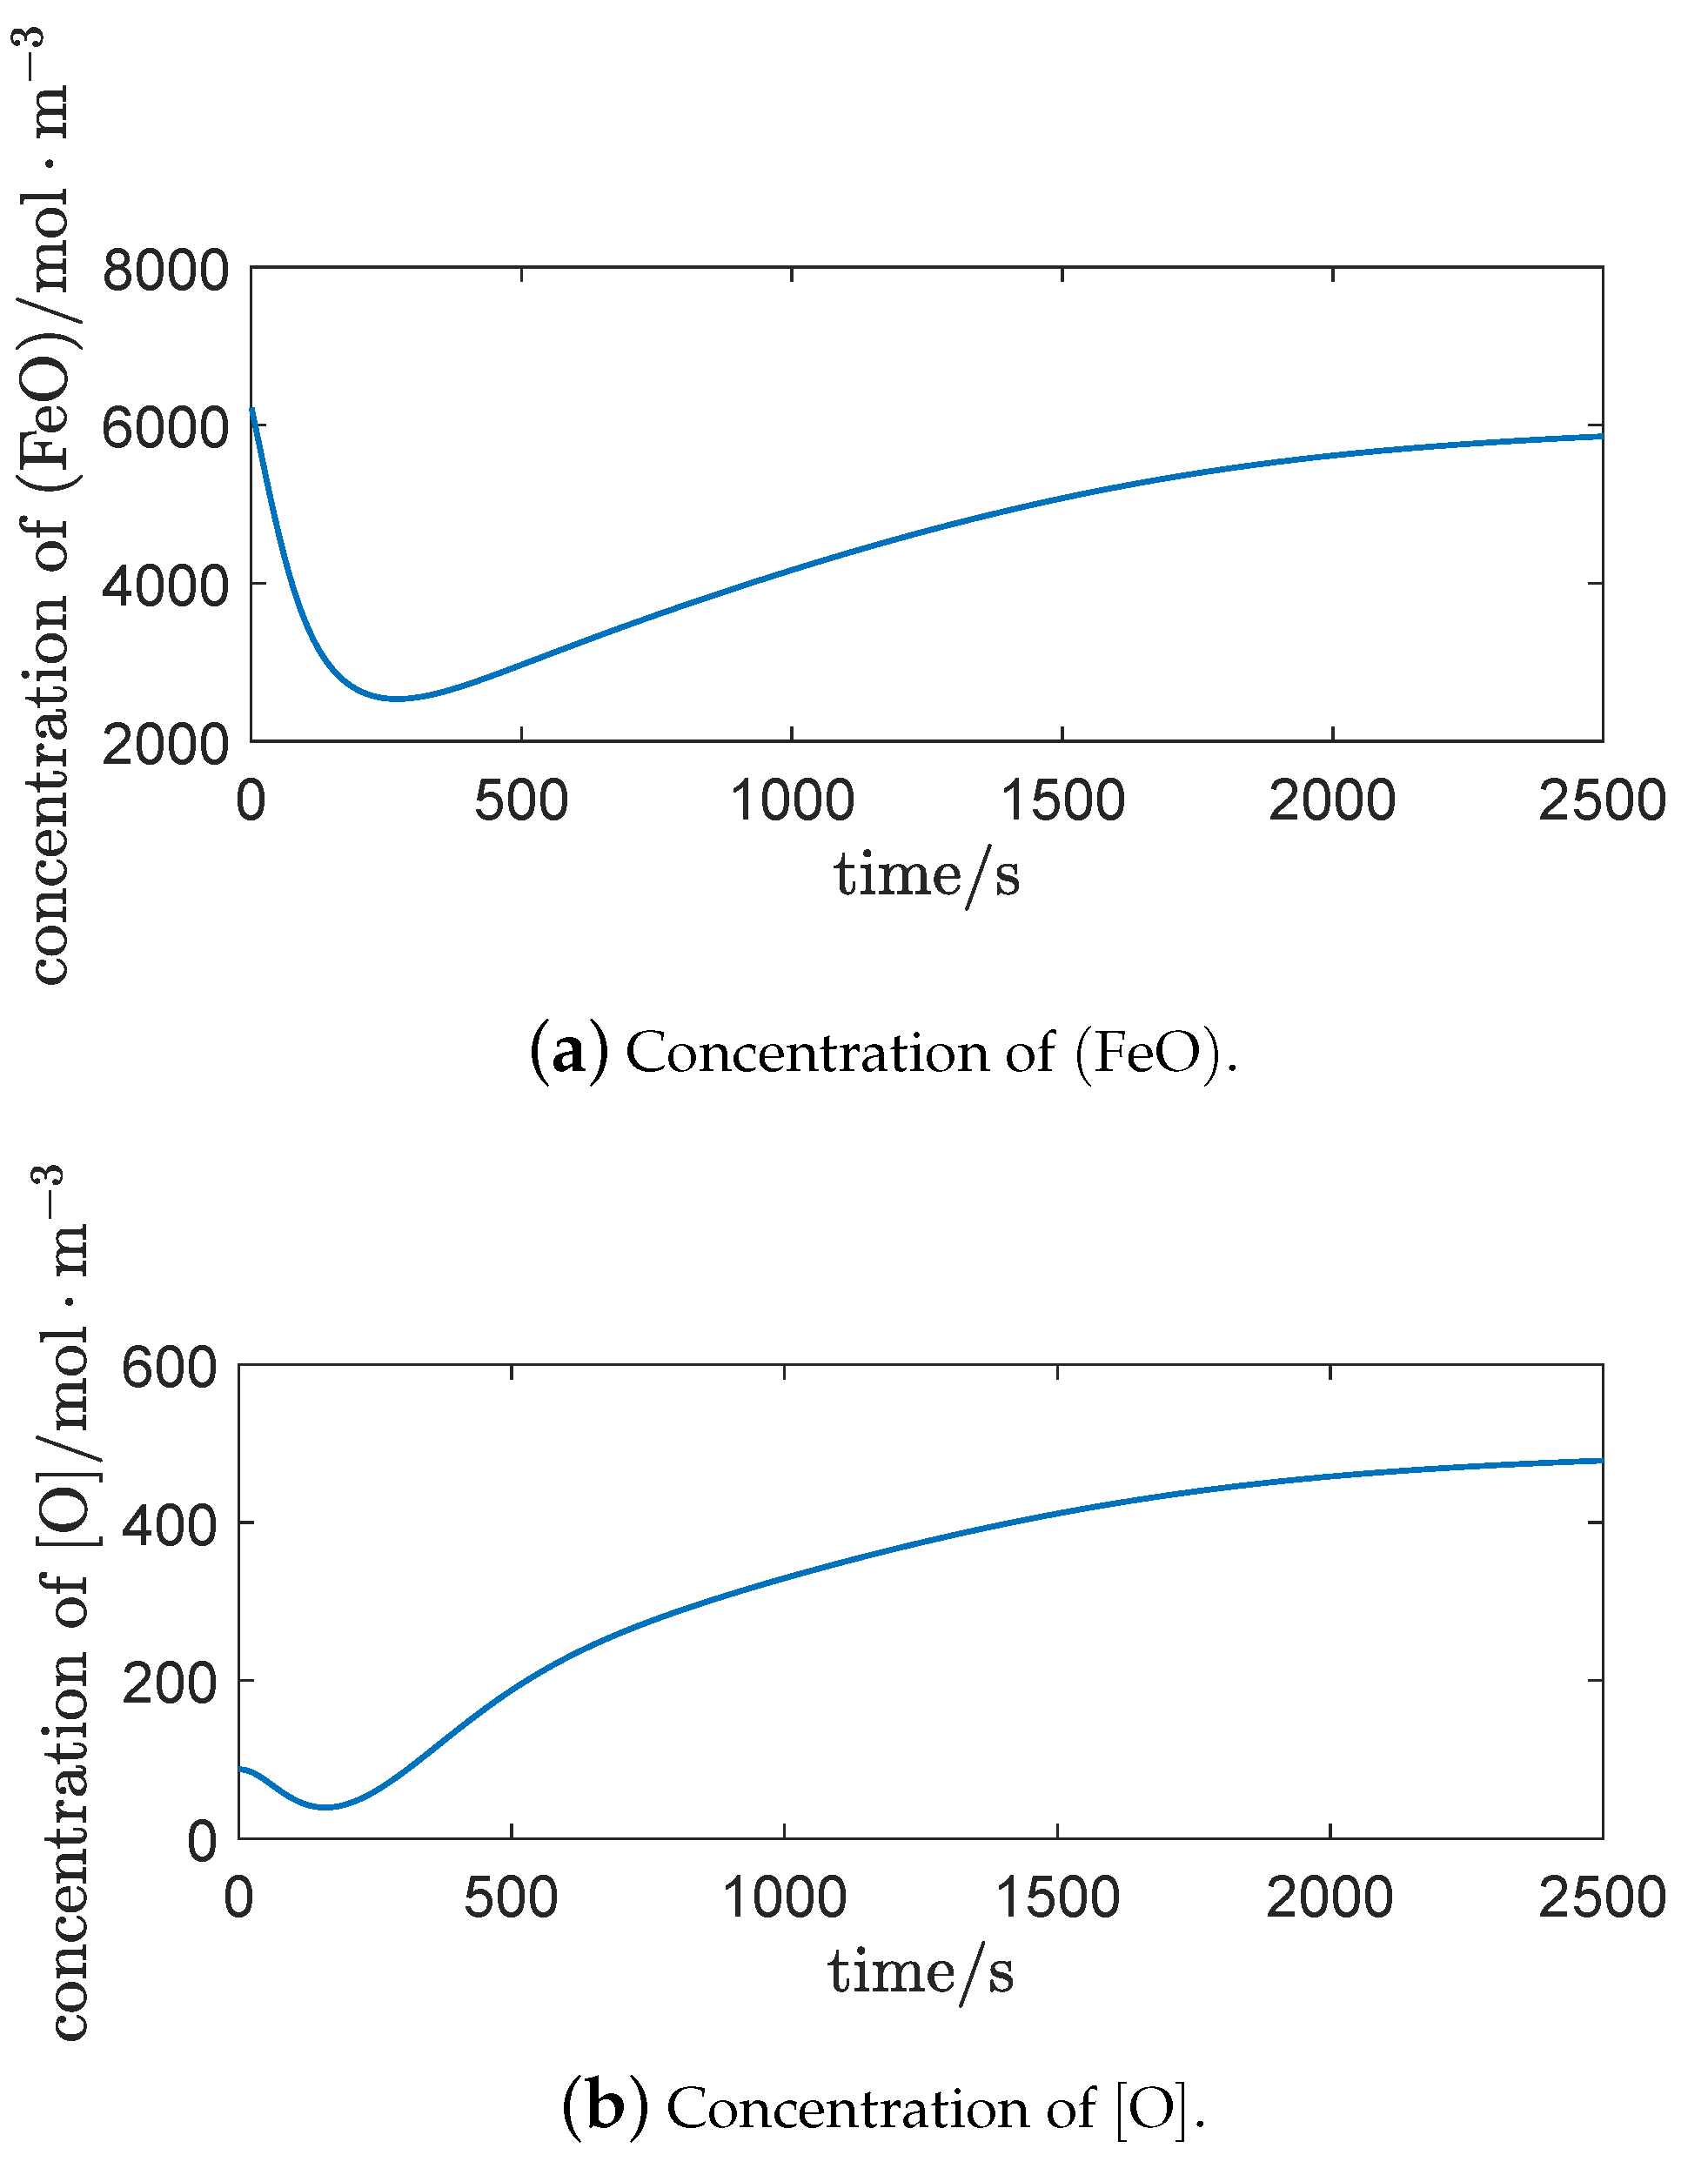
The composition of the slag is shown in
Figure 5.
Figure 5a shows that the curves of
,
, and
quickly reached their respective maxima, then decreased gradually. However, the curve of
was relatively flat, indicating that
,
, and
were more easily oxidized than
.
Figure 5b shows that the content of
was higher at first, reached its lowest level in the intermediate stage, and gradually recovered in the latter period. The reasons for this are that:
At the beginning of vanadium extraction process, with the rapid formation of the gas–liquid interface of the impact pit, plenty of
were generated through the oxidation reaction (
1). Then, the
took part in the oxidation reaction at the slag–metal interface and in the emulsion system as an oxidant. At that time, the slag–metal interface and the emulsion system were at the beginning of generation, and the contact areas of the corresponding oxidation reactions were small. So, the consumption of
was not large.
During the vanadium extraction process, with the formation of the slag–metal interface and the emulsion system, the oxidation rates of , , , , and continually increased. As was largely consumed as an oxidant, the content of reduced significantly.
At the end of vanadium extraction process, with a decrease of , , , and , the consumption of also decreased. As was generated continually at the gas–liquid interface of the impact pit, the content of then recovered.
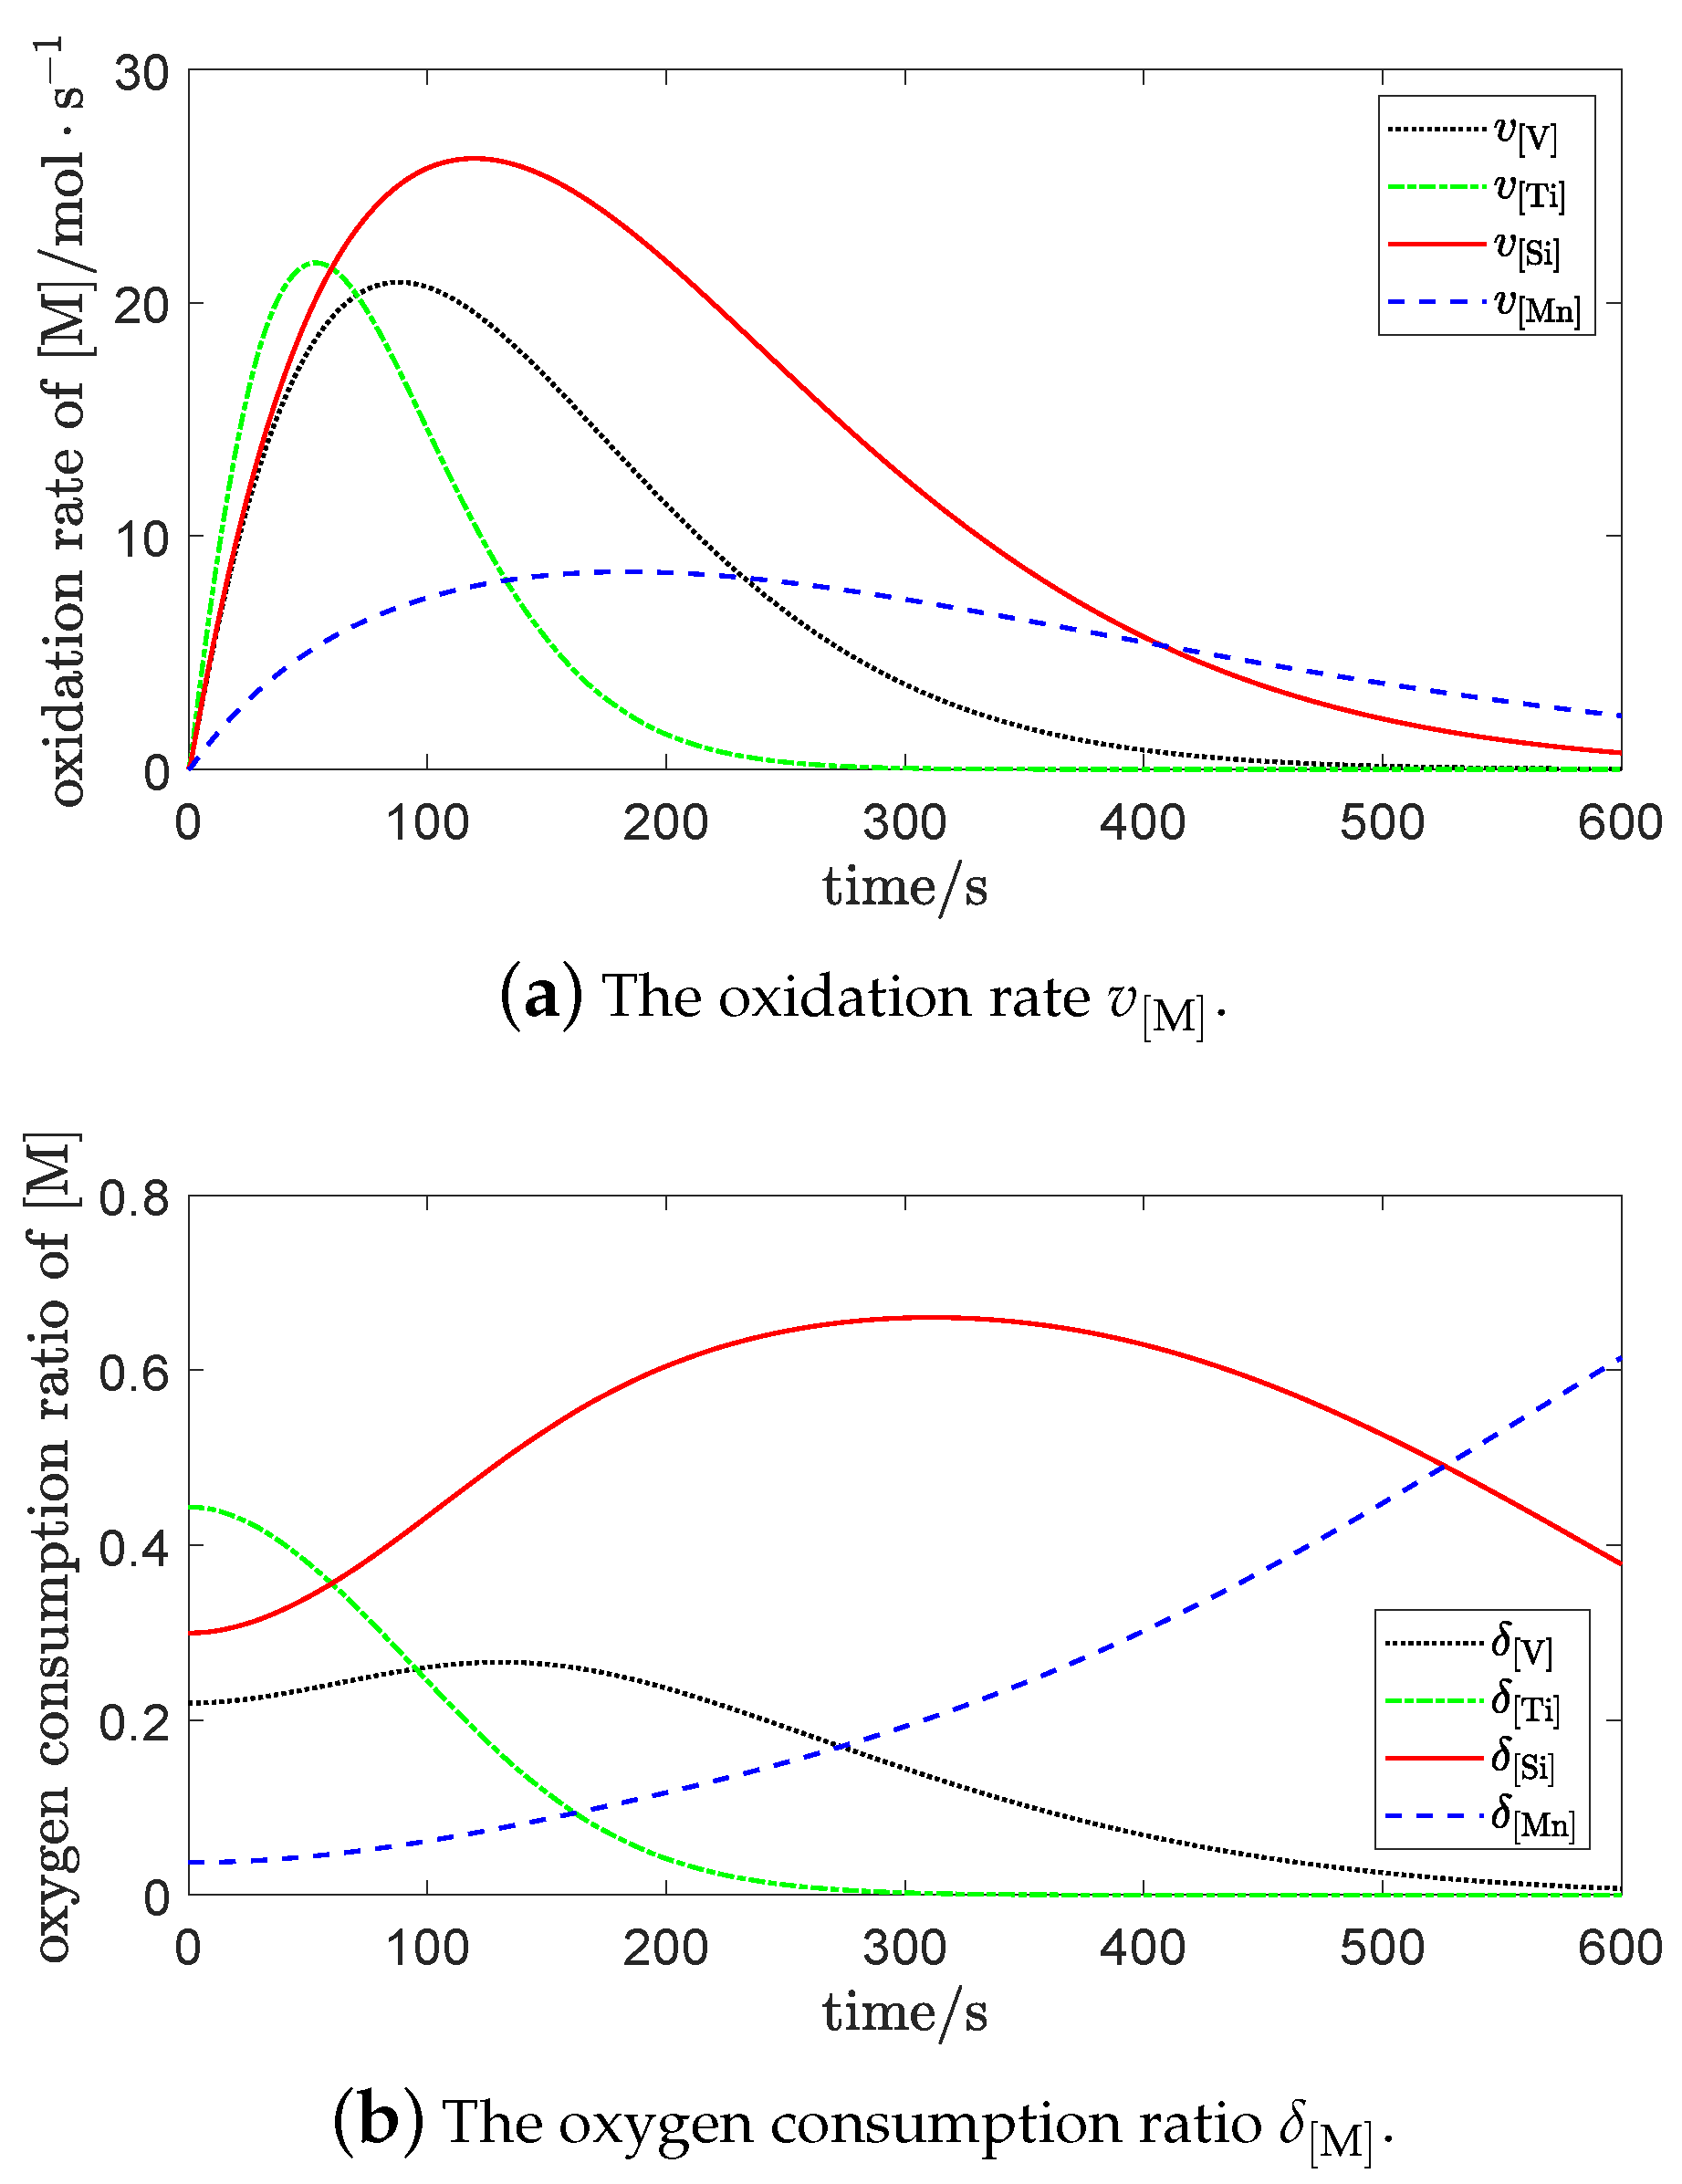
The oxidation rates of each element were
and the oxygen consumption ratios of each element were
where
At the beginning of vanadium extraction process, the order of oxidation rates of each element was . This indicates that the oxygen was mainly used to oxidize , , and in the early stage; only a small amount of oxidant was used to oxidize . As the Gibbs free energy of can be large, its oxygen consumption ratio decreased gradually. The reason for this is that its concentration decreased rapidly, making its oxidation reaction most violent in the beginning.
During the vanadium extraction process, the oxidation rate and the oxygen consumption ratio of became the strongest, following the consumption of . In the whole process of blowing, the oxidation rate and the oxygen consumption ratio of was bigger than that of .
At the end of vanadium extraction process, the oxygen consumption ratio of basically monotonically increased, following the consumption of , , and . The oxidation rate and the oxygen consumption ratio of exceeded that of in the later stage, which indicates that more was oxidized in middle and later stages.
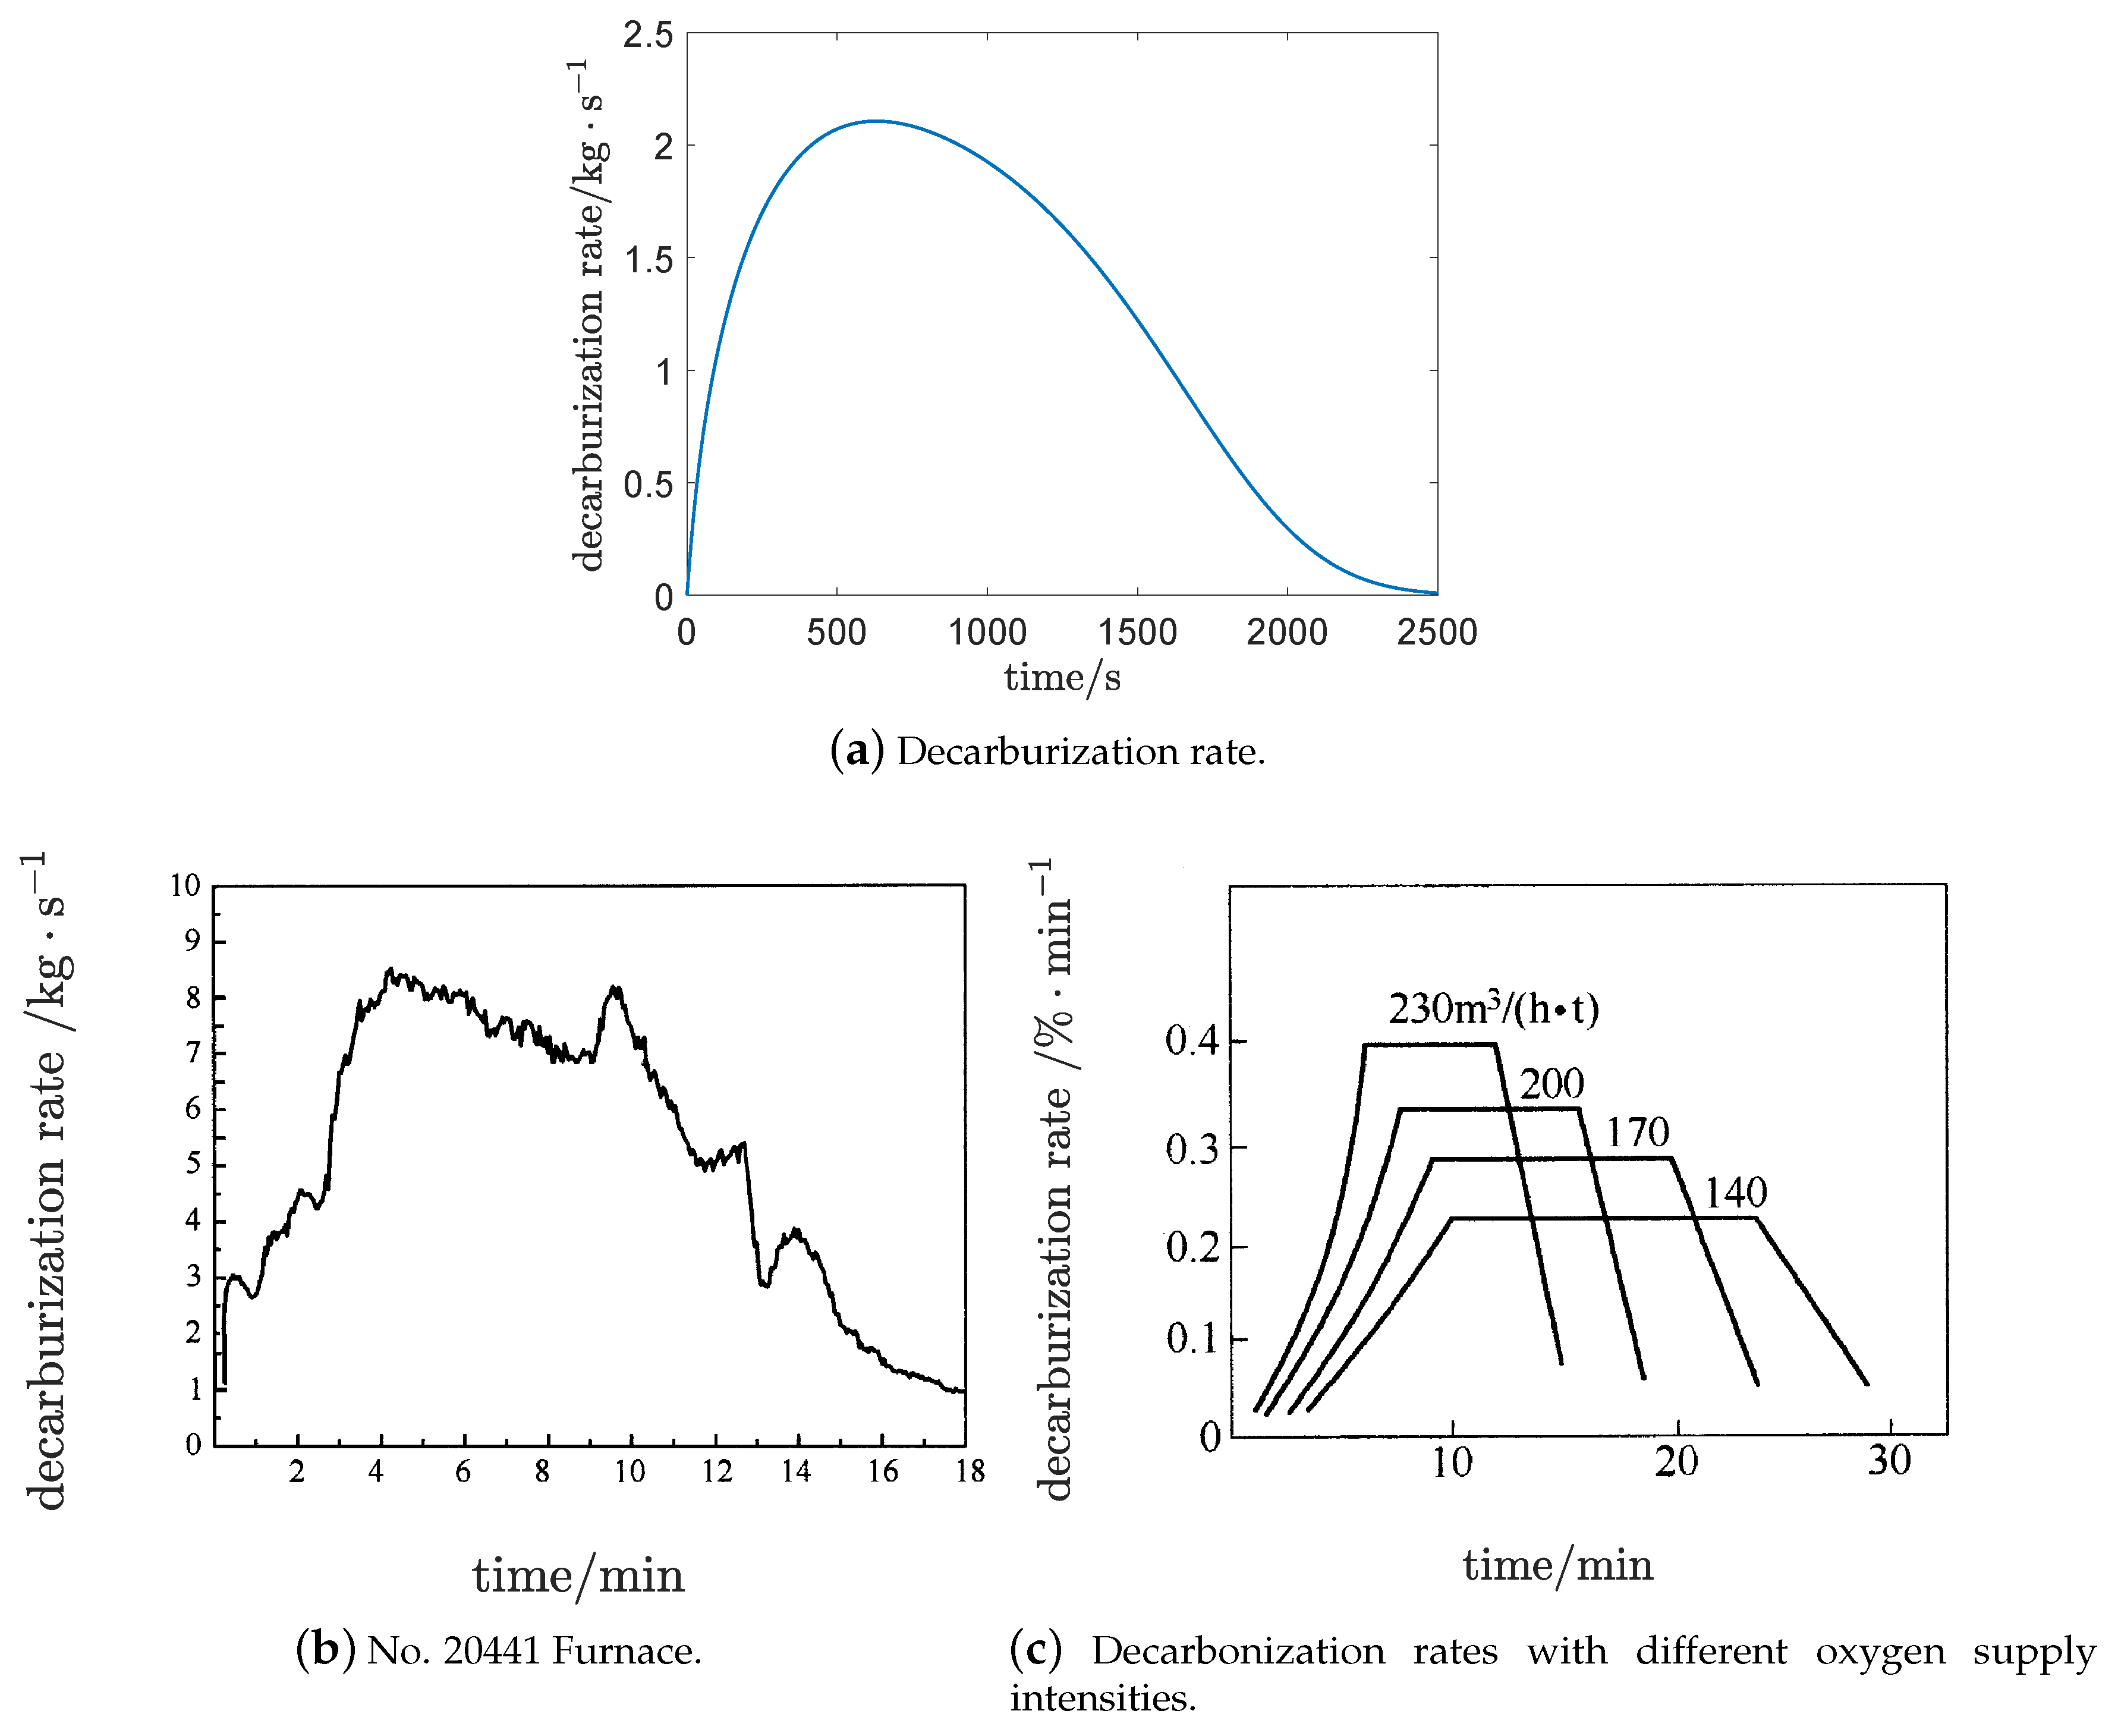
Figure 7a shows that the decarburization rate gradually accelerated, increasing almost linearly at the beginning. The decarbonization rate reached its maximum and remained almost unchanged for some time. Finally, the decarbonization rate decreased with an approximate exponential decay, along with the decrease of
. According to (
47), (
59), and the equations of model (
68), we have
Obviously, the decarburization rate is determined by the contact area and concentration . The probable causes for the “trapezoid” structure of the decarburization rate are:
At the beginning of vanadium extraction process, the contact area of the decarbonization reaction was small, with little consumption of . At this time, the effect of was greater than that of . The main reason for the linear growth of the decarburization rate was that the contact area increased almost linearly.
During the vanadium extraction process, with the formation of the emulsion system, the effects of and reached a balance, ausing the decarburization rate to remain almost unchanged.
At the end of vanadium extraction process, the effect of was greater than that of . The decarbonization rate decreased with the decrease of .
Figure 7b [
27] is from the production data of a steel plant. It shows a similar “trapezoid” structure of the decarburization rate to
Figure 7a.
Figure 7c [
22] is the decarbonization rates for different oxygen supply intensities. The decarburization rate curves show a similar “trapezoid” structure for converters with different oxygen blowing strengths and capacities.
Figure 8 shows that
and
changed consistently, which is in agreement with the distribution law of the solution.
By (
68)–(
74), we obtain the first integral as follows
Equation (
80) shows the conservation of the oxygen in the system. The left side of the Equation (
80) shows the oxygen sources of the system, and the right side shows where the oxygen goes to. In the middle and later stages, the oxidation rates of
,
,
, and
were very small, and the top-blown oxygen was almost entirely used for decarbonization; that is,
Substituting (
81) and (
82) into (
80), we have
Taking the derivative of (
65) with respect to
t, we have
Substituting (
83) into (
84), we have
Equation (
85) implies that the masses of
and
change consistently.
