Article

The Role of In-Flight Service Quality on Value for Money in Business Class: A Logit Model on the Airline Industry

1
Department of Aviation Management, Eskişehir Technical University, Eskişehir 26470, Turkey
2
Graduate School of Social Sciences, Anadolu University, Eskişehir 26470, Turkey
*
Author to whom correspondence should be addressed.
Adm. Sci. 2019, 9(1), 26; https://doi.org/10.3390/admsci9010026
Submission received: 18 February 2019 / Revised: 14 March 2019 / Accepted: 21 March 2019 / Published: 25 March 2019

Abstract

:
The main purpose of this study was to investigate the effect of in-flight service quality on value for money for business passengers in airlines. In this study, in-flight service quality included four dimensions—seat comfort, staff service, food and beverages, and in-flight entertainment—while value for money was used as a dichotomous variable. In the study, 1096 business passenger reviews were employed through secondary data. Logistic regression analysis was used to investigate the relationships between the variables and finally the success of classification was tested by the ROC (Receiver Operating Characteristics) curve. As a result, the findings indicate that the proposed logit model sufficiently explains the relationship between in-flight service quality and value for money in business passengers. Moreover, the study provides a deep understanding of how passengers perceive in-flight service quality in business class. The study also reveals that seat comfort has the highest impact on value for money.

1. Introduction

The airline industry, which has been growing steadily since the Second World War, reached 4.1 billion passengers in 2017 (ICAO 2018) a number which is expected to nearly double to reach 7.8 billion passengers by 2036 (IATA 2017). In a more distant projection, this number is expected to reach 10 billion passengers by 2040 (ICAO 2018). Additionally, in parallel with the increase in the number of passengers, the supply of airlines is also expected to grow. The competition between airlines is predicted to increase in the coming years due to an increased supply and market growth. Therefore, providing the best value to the customer by considering the cost and service balance has become a necessity in order to obtain a larger market share (Lacic et al. 2016). The emergence of low-cost carriers (LCCs) after deregulation and liberalization has changed the structure of the airline industry considerably. Initially, the carriers appealed to leisure travelers with their low ticket prices, and in the following period, they started to appeal to business passengers by increasing their customer portfolio (Mason 2001). This has made the competition between LCCs and FSCs (Full Service Carriers) even more destructive. The reason for this is that the business passengers, which constitute a large part of the profitability of FSCs, have been gradually shifting to LCCs. Therefore, FSCs should create a sense of value that will respond to the needs of business passengers in order for them to be sustainable (Mason 2006). According to the Civil Aviation Authority (2003), business passengers constitute a significant portion of the revenue of FSCs. Douglas (2005) argued that one business class passenger in the major market brought equal income to three to five economy class passengers. Mason (2005) stated that business class, which constitutes only 12% of passengers, accounts for 28% of the total revenue. Therefore, it has become quite crucial for FSCs to make a difference in the delivery of services to business passengers and to continually improve service quality in this class in order to increase their profitability. The services offered by airlines are divided into ground services and in-flight services. Ground services refer to all services offered to passengers at the airport, while in-flight services include onboard catering, entertainment, physical evidence, and the cabin crew (Koklic et al. 2017). In-flight services play a pivotal role for business passengers to evaluate the value they have obtained and to choose the airline accordingly (Li et al. 2017). Therefore, it can be said that the in-flight service quality is an important measure of the value perceived by the passengers. When the literature is examined, however, there is no study investigating specifically the effect of in-flight service quality on value for money for business travelers. Moreover, the studies have generally investigated the overall perceived value and have also not directly focused on in-flight service quality. Therefore, our main purpose in this study is to investigate the effect of in-flight service quality on value for money in business class. Rajaguru (2016) found that the effect of value for money on satisfaction is higher in FSCs than LCCs. Therefore, to gain a deeper understanding, this study focused on FSCs, and specifically on business class. This study aims to contribute to the literature by investigating value for money, which is a rarely-discussed issue in the airline industry in terms of business passengers. Furthermore, another object of the study is to examine how the logit model can be adapted to the value for money evaluation of business passengers. Logistic regression analysis is a very useful and flexible method that allows relationships to be revealed in multi-level variables (Eboli and Mazzulla 2009). We can say that consumers’ perceptions of satisfaction are generally categorical and their perceptions are positive or negative. Therefore, this matter was also taken into consideration in the method selection.
The rest of the study includes the following sections. Theoretical background and hypotheses development are presented in Section 2. Research design and methodology are explained in Section 3. Data analysis and results, and a discussion of the findings are presented in Section 4 and Section 5, respectively. The conclusion and suggestions are provided in Section 6.

2. Theoretical Background and Hypotheses Development

2.1. Service Quality

Grönroos (1984) argued that service quality is a process based on the evaluations of consumers about expected and perceived service. Accordingly, satisfaction occurs if the perceived service meets or exceeds expectations (Hapsari et al. 2017). If the expectations are very high, ensuring satisfactory service quality depends on a higher service performance. Because services are abstract in nature (Chen and Liu 2017), the evaluation of service quality is based on perceptions. Service quality has made a tremendous impact and has attracted practitioners and theorists since it was conceptualized. Parasuraman et al. (1988) proposed SERVQUAL, one of the most well-known measurement models for the conceptualization of service quality. According to their study, service quality includes reliability, responsiveness, assurance, tangibles, and empathy dimensions (Parasuraman et al. 1988).
Kotler and Keller (2012) stated that service quality leads to high customer satisfaction. In addition, they added that service quality leads to lower costs, increased profitability, and more satisfied customers. Kaynama and Black (2000) also argued that service quality decreases employee turnover rates, and thus increases the retention of skilled employees. Service quality is vital for all businesses to survive and the airline industry is no exception. Service quality in the airline industry also contributes to the attractiveness of the airline.
Service quality for airlines refers to “the satisfactory level of the interaction between passengers and airline employees while providing transportation services which are core products” (Suki 2014). Airlines are trying to improve service quality in order to provide satisfactory services to customers, to identify problems better, and to prevent problems (Bellizzi et al. 2018). There are many studies which have discussed the importance of service quality in airlines. Hapsari et al. (2017) found that service quality in airlines positively affects brand image, satisfaction, and perceived value. Rajaguru (2016) found that service quality is an important predictor of customer satisfaction and behavioral intention. In addition, Chiu et al. (2016) found that word of mouth (WOM) and reputation depend on high service quality.

2.2. Value for Money

Zeithaml (1988) defined the perceived value as “customers’ overall assessment of the utility of a product based on perceptions of what is received and what is paid” (Zeithaml 1988). At this point, money, effort, risk, and time represent what was paid, while nonmonetary inputs such as utility, quality, and benefits represent what was received (Kashyap and Bojanic 2000). When the literature is examined, it is seen that the distinction between perceived value and value for money has not been sufficiently explained. In fact, perceived value is a more generic concept. Sweeney and Soutar (2001) found empirically that perceived value includes perceived quality/performance, social value, emotional value, and price/value for money factors. Rajaguru argued that the perceived value includes two perspectives and that value for money represents the utilitarian component, not the symbolic component (Rajaguru 2016). According to Kashyap and Bojanic (2000), value for money, which represents a utilitarian perspective, is ideal for measuring the general exchange between money and benefit. In other words, the value is defined as a perceptual evaluation based on the comparison of the price paid for a product and what is received (Rajaguru 2016).
It can be said that the perceived value is similar and related to the service quality concept. Zeithaml (1988), for example, stated in the means-end theory that value, perceived price, and quality had inseparable ties in consumer evaluations. Second, the perceived value emphasizes the interaction between the service and the consumer, while service quality refers to the interaction between the service staff and the consumer (Sánchez-Fernández and Iniesta-Bonillo 2007). Finally, “gaps” are the basis of both concepts. Accordingly, service quality is shaped by the gap between expectation and performance, while the gap between benefit and cost shapes perceived value.
Several studies in the airline industry have also investigated the concept of perceived value. When the literature is examined, some studies explained perceived value as value for money (Kashyap and Bojanic 2000; Rajaguru 2016; Šebjan et al. 2017), and others explained perceived value as an overall model (Hapsari et al. 2017; Chen and Liu 2017; Forgas et al. 2010). Kashyap and Bojanic (2000) argued that the perceived value is predominantly critical in passengers’ decisions, so businesses should provide value-oriented services. According to Rajaguru (2016), value for money predicts satisfaction. Hapsari et al. (2017) found in their study that the perceived value is an important antecedent of satisfaction. Similarly, Rajaguru (2016) reported that value for money explained the behavioral intention as well as being an antecedent of satisfaction. Šebjan et al. (2017) found that value for money predicted the intention to recommend.

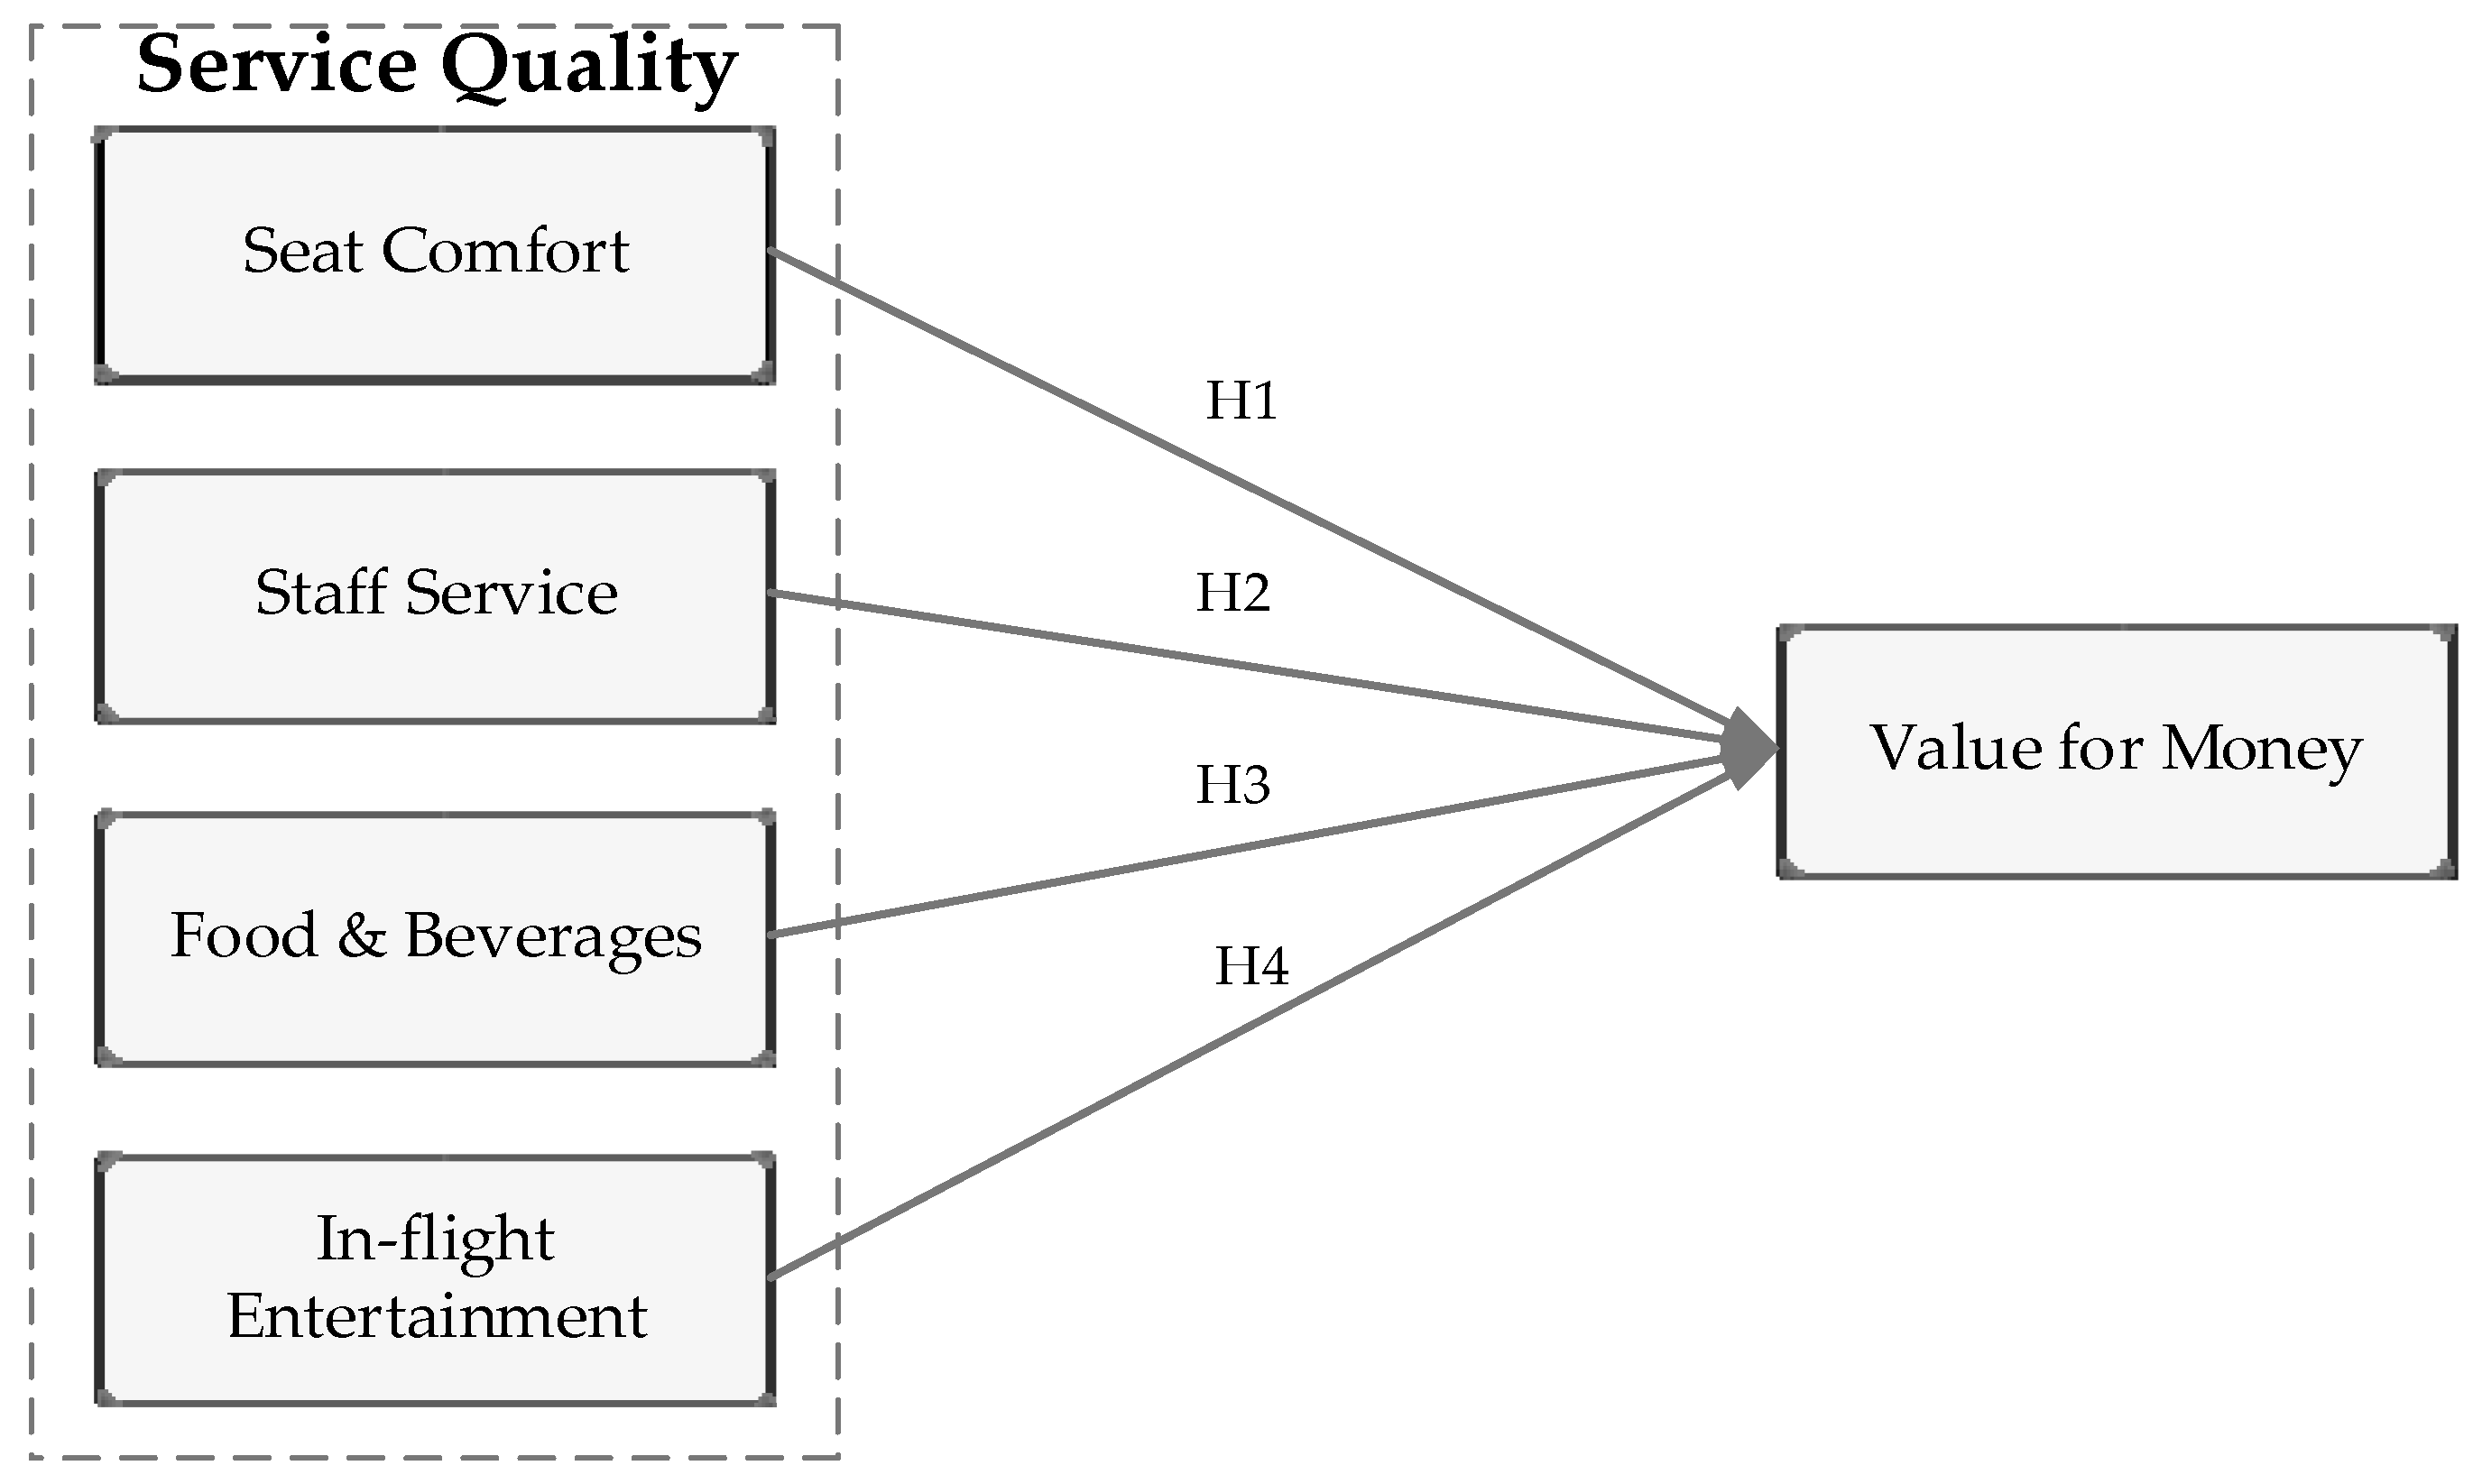
2.3. Hypotheses Development

Seat comfort is considered to be one of the most important factors in airline selection (Da Silva Menegon et al. 2017). In recent years, passengers have also seen seat comfort as an increasingly attractive service item (Chou et al. 2011). Seat comfort becomes even more critical on long-haul flights (Šebjan et al. 2017). Seat comfort is an important factor that allows airlines to differentiate from their competitors while providing a more satisfactory service experience (Da Silva Menegon et al. 2017). Ostrowski et al. (1993) reported that seat comfort has the highest impact on service quality. Similarly, Liou and Tzeng (2007) found that the most important factors in onboard services are the comfort and the cleanliness of the seats. Šebjan et al. (2017) found that seat comfort is the most important factor of in-flight service quality and stated that it is decisive on value for money. Based on the above literature, the following hypothesis was established:
Hypothesis 1 (H1).
Seat comfort quality is positively associated with the value for money perceived by business passengers.
The staff provide many services to the passengers, including serving food and beverages, assisting passengers with seating, providing information on safety and security, and creating a reliable and professional relationship with passengers (Wycoff and Holley 1990). Furthermore, the staff have a direct impact on the quality of the service by interacting with passengers when providing services (Chen 2006). Similarly, it is known that a courteous and smiling flight crew has a positive effect on in-flight service quality (Tsaur et al. 2002). Furthermore, Nejati et al. (2013) found that the flight crew is one of the most important service quality factors. Based on the above literature, the following hypothesis was established:
Hypothesis 2 (H2).
Staff service quality is positively associated with the value for money perceived by business passengers.
Regardless of the business model, airlines provide a food and beverage service to passengers at various levels. In-flight food and beverages are an important determinant of service quality (Chou et al. 2011) and passengers are sensitive to the quality of the food and beverage service. As interactions take place between passengers and staff during the presentation of food and beverages, passengers tend to evaluate these services on the basis of perceived value. For example, Lee and Ko (2016) have argued that the food and beverage services affect overall value. Therefore, it can be said that value for money is affected by the quality of the food and beverages (Nield et al. 2000). Based on the above literature, the following hypothesis was established:
Hypothesis 3 (H3).
Food and beverage quality is positively associated with the value for money perceived by business passengers.
Increasing competition in the airline industry has forced airlines to improve their products. Airlines, which aim to improve in-flight entertainment facilities, have made great strides and now offer a wide range of entertainment services (Alamdari 1999). In recent years, having advanced in-flight entertainment systems has become a significant differentiation opportunity in the airline industry (Aksoy et al. 2003). In-flight entertainment systems are one of the important service attributes that allow passengers to have a more comfortable travel experience, especially on long-haul flights. In this respect, the perceived value of the entertainment systems for passengers is quite high (Francis et al. 2007). Based on the above literature, the following hypothesis was established:
Hypothesis 4 (H4).
In-flight entertainment quality is positively associated with the value for money perceived by business passengers.

3. Research Design and Methodology

In this study, we adopted the positivist paradigm because it is intended to empirically test the hypotheses established based on literature (Sandada and Matibiri 2016). The use of this approach in this study is self-explanatory because the causal relationships between the variables were discussed. Therefore, in this study, quantitative research methods were used. In this section, the conceptual model, data collection process, and research method are explained.

3.1. Conceptual Model

In this study, the research problem was constructed based on the causal relationship between in-flight service quality and value for money (Šebjan et al. 2017; Leonnard 2018). Thus, the aim was to investigate the effects of judgments about in-flight service quality on value for money.
At this point, we were influenced by Oliver’s (1977) expectation confirmation theory (ECT). The ECT argues that before a product is purchased, consumers have some expectations about performance. Consumers, therefore, compare their expectations and product performance according to the various attributes after the purchase. Satisfaction occurs if the perceived performance meets expectations. Otherwise, feelings of dissatisfaction arise and consumers’ future purchases are affected (Kardes et al. 2011). Since the satisfaction of consumers in their past experiences guides their future purchases, our study was carried out in this direction. The conceptual model of the study is presented in Figure 1.
As shown in Figure 1, this research includes seat comfort, staff service, food and beverages, and in-flight entertainment as predictor variables and value for money as a dependent variable.

3.2. Sampling and Data Collection Process

This research covered business class passengers. In accordance with the purpose of the study, secondary data that are frequently used in the evaluation of airline service quality was used (Waguespack and Rhoades 2014). The data reflected passengers’ reviews via the Skytrax qualityrating website (http://www.airlinequality.com). Nowadays, Skytrax has great prestige in terms of quality excellence in the airline industry worldwide, and evaluates airlines and airports through passenger reviews (Skytrax 2018). Park (2007) stated that these reviews on airlines significantly affect the purchasing behavior of consumers. The use of secondary data was preferred because it is so effective in terms of sample size and geographic spread, and passengers’ evaluations are voluntary. In addition, the assessment of the reviews after the experience and the validation of all of the assessments are other factors that increase the data reliability.
In addition, verification of all reviews is also noteworthy in terms of data reliability. The survey data were taken from business class passengers who flew between 1 January–31 December 2017. Since many airlines have a business class, only airlines affiliated to any strategic cooperation were included in the study, to limit the scope. In this context, only numerical reviews were taken and 1096 passenger reviews were found to be suitable for analysis (n = 1096). This is noteworthy because the large sample size increases the statistical power. The data analyzed in the study were collected in September 2018. The independent variables were measured on a 5 point Likert scale (1 = low quality; 5 = high quality). The dependent variable was measured as a dichotomous variable. For this purpose, scores 1–3 were recoded as 0 and scores 4–5 as 1 (0 = unsatisfied and 1 = satisfied). Survey questions containing demographic characteristics were not reported.

3.3. Logistic Regression Analysis

Logistic regression is used to predict group membership in models with continuous, discrete, dichotomous, or mixed variables (Field 2009). Different from linear regression, in logistic regression, the dependent variable is binary or dichotomous (Hosmer et al. 2013) and the logit transformation is applied on the dependent variable.
Although logistic regression is applied to problems involving dichotomous dependent variables, such as discriminant analysis, it is more flexible than this. For example, predictor variables do not need to meet the normality assumption, and no linear relationship is required between the predictor and dependent variables. In addition, it is not necessary for the variances to be equal or homogeneous (Field 2009; Hair et al. 2014).
The equation of logistic regression is as follows (Field 2009):
P ( Y ) = 1 1 + e ( b 0 + b 1 X 1 i + b 2 X 2 i + + b n X n i )
where e denotes the base of natural logarithms. Additionally, b 0 is constant, X n are predictor variables, and b n denotes the coefficients assigned to these predictors.   P ( Y ) in the equation denotes the probability of occurrence (Y). Another unique term in logistic regression is the odds. The probability of the occurrence of an event is divided by the probability of not occurring, and this is called the odds ratio. In the logistic regression equation, the odds ratio is expressed as Exp (β). Exp (β) indicates how many times the Y variable is observed with the effect of the X n predictor (Girginer and Cankuş 2010).
In logistic regression, R 2 is not used to calculate the model’s goodness-of-fit. Instead, the analogous pseudo R 2 is used (Huck 2012). Nagelkerke recommended that this value should be between 0–1, with R 2 = 1 considered to be the perfect model fit (Hair et al. 2014). The Hosmer and Lemeshow test is another value that measures the overall fit of the model. The basic principle is to measure the similarity of the expected and observed values of the dependent variable. As the difference between the expected and observed classification decreases, the model fit improves (p > 0.05) (Pandey and Chawla 2016).
Another overall model fit test is −2 log likelihood (LL). This value shows how accurate the maximum likelihood estimation is. The minimum value that can be assigned to −2LL is 0, which corresponds to a perfect fit (Çokluk 2010). The statistical significance of predictive variables in the analysis is determined using Wald statistics (Huck 2012). Accordingly, the Exp (β) values are interpreted for each predictor.
Logistic regression also includes two technical terms; these are sensitivity and specificity. Sensitivity is the hit rate for the correct classification of participants in the first category, whereas specificity is the hit rate for the other category (Huck 2012). The ROC (Receiver Operating Characteristics) curve is applied in this process. The area under the curve parameter measures the success of the model in the ROC curve. This value, which is between 0–1, is considered to be excellent as it approaches 1, while approaching 0 is poor (Pandey and Chawla 2016).

4. Data Analysis and Results

In this section, research data is analyzed and the results are presented. Moreover, after the logistic regression, classification success was achieved by using the ROC curve. The IBM SPSS 25 package program was used in the analysis. Some assumptions had to be met for logistic regression. In the preparation phase for analysis, Z-scores of the predictors were calculated to meet the outliers assumption and no problem was found (Cohen et al. 2018). The assumption of the linearity of the logits was also (p > 0.05) (Field 2009).
Within the scope of the study, data from 57 FSCs related to three airline alliances were collected (n = 1096). There was no missing data in the analysis. Detailed statistics on airlines and alliances are presented in Appendix A (Table A1). The majority of participants (464; 42.3%) were passengers of FSCs within Oneworld, then 369 passengers (33.7%) within Star Alliance, and finally, 263 passengers (24%) from Skyteam.
Table 1 shows the descriptive statistics and correlation coefficients between predictors. The highest rated attribute was the staff service (M = 3.920 and SD = 1.351). Staff services were followed by seat comfort (M = 3.664 and SD = 1.319), food and beverages (M = 3.422 and SD = 1.428), and entertainment attributes (M = 3.329 and SD = 1.355), respectively. Overall, we can deduce that all passengers have positive perceptions about in-flight service quality. In addition, 61.7% of passengers were reported to be satisfied in terms of value for money. When the correlation analysis was examined, it was determined that the predictors were significantly correlated (p < 0.001). It was also reported that there was no multicollinearity problem because the coefficients were r < 0.90 and above (Pallant 2011). Tolerance and VIF statistics were also checked.
After the descriptive statistics, the logistic regression analysis was applied to test the model in the study. In the analysis, several parameters were used to test the overall model fit. The model summary is given in Table 2.
In the analysis, −2 log likelihood (−2LL) shows that the predicted model was compatible with the data (679.699). In other words, predictors added to Model 0 provided a statistically significant contribution to logit estimation. Moreover, the logistic model was found to be statistically significant in classifying the passengers reported as satisfied and unsatisfied (χ2 (4, N = 1096) = 779.328, p < 0.001). When the pseudo R 2 was considered, it was found that the model explained 69.2% of the variance (Nagelkerke’s R 2 ) in value for money. In addition, Cox and Snell’s R 2 was found to be 50.9%. The overall fit of the model was examined using the Hosmer and Lemeshow test, and the model was found to be suitable (χ2 = 6.150, p = 0.630 > 0.05).
The classification table according to the satisfaction of the passengers is below (Table 3). The logistic model correctly classified 87.3% of the observations.
The regression results, which were established to evaluate the impact of in-flight service quality on value for money, are given in Table 4.
As shown in Table 4, our model contains four independent variables (seat comfort, staff service, food and beverages, and in-flight entertainment). According to Wald statistics (Çokluk 2010), all predictors in the model were statistically significant (p < 0.05). In other words, all independent variables made a statistically significant contribution to the model. Therefore, according to the table, our logistic regression equation is as follows:
Logit (odds in favor of being satisfied) = −7.810 + 0.776X1 + 0.727X2 + 0.611X3 + 0.201X4,
where the X variables denote seat comfort, staff service, food and beverages, and in-flight entertainment predictors, respectively.
In the last column, exponentiated logistic regression coefficients (Exp (β)) are given. These values were higher than 1 for all predictors. When the coefficients were examined, the strongest predictor on satisfaction was seat comfort, with a 2.173 odds ratio. This means that an increase in comfort in one unit increases the value for money by 2.173 times. In other words, the perceived value for money increases as the seat comfort rating increases. Staff service had the next highest impact on value for money, with a 2.069 odds ratio. The third most significant variable was the food and beverages quality, with an odds ratio of 1.843. The least effective variable was reported to be entertainment, with a 1.222 odds ratio.
In the last step of the application, the ROC analysis was applied. In the ROC curve, the classification success of the model was evaluated based on the area under the curve (AUC) measure. The AUC values are shown in Table 5, in addition to the ROC curve shown in Figure 2. All AUC values in the table are higher than 0.800 and statistically significant (p < 0.001), so our model has a very strong practical and statistical significance (Pandey and Chawla 2016).

5. Discussion of the Findings

As a result of this study, it was found that in-flight service quality positively affects value for money. This finding supports previous studies (Chen and Liu 2017; Lee et al. 2018; Šebjan et al. 2017). All predictors, according to Wald’s statistics, had a significant effect on value for money. Therefore, the H1, H2, H3, and H4 hypotheses were supported.
It was found that seat comfort had the highest impact on value for money. This finding is similarly consistent with many studies in literature (Tsaur et al. 2002; Fourie and Lubbe 2006; Chou et al. 2011). FSCs with business cabins operate numerous medium-haul and long-haul flights. It is known that the primary discomforts in long-distance flights are caused by poor sleep comfort and back and leg pain, especially in tall passengers. Since passengers spend time in the same seat during the flight, it is important that this area should not cause the passenger any discomfort (Li et al. 2017). From this viewpoint, we can state that passengers are willing to pay more because they are aware of the importance of seat comfort. In this respect, FSCs also offer solutions to meet consumer expectations. Qatar Airways’ Qsuite, Etihad Airways’ Business Studio, and Delta Air Lines’ Delta ONE products are the best examples of this (Independent 2018).
More recently, seat comfort has been seen as a necessity rather than a luxury. According to a study conducted by Airbus, long haul economy passengers take great care over seat comfort in long flights, and they are willing to pay more for this. In the study, 54% of economy passengers stated that seat comfort was essential, while 41% of the passengers stated that they were willing to pay more for better seat comfort (Smith 2013). Based on the importance of this phenomenon, airlines are trying to differentiate and increase their ancillary revenues by creating more suitable options, such as emergency exit and front row sales (Smith 2013). Warnock-Smith et al. (2017) addressed the importance of ancillary revenues and new opportunities for airlines. They found that seat comfort, which is not considered important on short-haul flights, is essential in long-distance flights. They also found that the willingness of the passengers to pay for this was very high.
In addition to such innovations, some airlines offer services in the premium economy class to meet the needs and expectations of passengers. This means more legroom, broader options for food and beverages, etc. The premium class, which is about 10–15% more expensive than the economy class, is about 65% less costly than business class. Thus, airlines create added-value for the passengers who are aware of the comfort (SeatGuru 2018). The fact that the demand for extra legroom in the FSCs is high (Warnock-Smith et al. 2017) is attractive for airlines in terms of the potential for ancillary revenues. It should be noted that these kinds of applications are very useful tools for attracting passengers who want to travel more comfortably but do not use business class (Lee and Luengo-Prado 2004).
Another concern in the study is the staff service. The role of the cabin crew in service quality, and therefore in value creation, has been discussed since the SERVQUAL model included responsiveness and empathy dimensions. In literature, it has been found that the cabin crew is prominent in many studies (Osaki and Kubota 2016; Koklic et al. 2017). The cabin crew are the representatives of the airline on board. In the case that the cabin crew are more eager and willing to assist consumers, satisfaction increases positively (Loureiro and Fialho 2017). Osaki and Kubota (2016) concluded that the attitude of the cabin crew significantly affects customer satisfaction through the premium services. Therefore, the importance of service delivery, as well as the content of the service, is supported by this study. Similarly, Koklic et al. (2017) found that the quality of the crew service was highly effective on customer satisfaction in FSCs.
Food and beverage quality was our third most important variable. Gilbert and Wong (2003) found that business class passengers have lower expectations for food quality. It was also discussed that the quality of food and beverages is greatly affected by the staff service (Messner 2016). Finally, consistent with previous studies (Tsaur et al. 2002; Milioti et al. 2015; Šebjan et al. 2017; Tsafarakis et al. 2018), the least significant attribute was found to be in-flight entertainment. Therefore, we can conclude that even though in-flight entertainment systems are important for business travelers, they are not prioritized sufficiently. However, as in-flight entertainment systems are a fairly recent innovation, airlines have the opportunity to differentiate in this area. In other words, by making some innovations, airlines can gain a competitive advantage and create value for their passengers.

6. Conclusions and Implications

Airlines are increasingly consumer-oriented and thus seek to attract consumers. One of the most effective tools used in this process is satisfactory in-flight service. This is especially the case if the passenger is a business passenger who spends a lot of money on their flight. In this study, a logit model, which measures the effect of in-flight service quality on value for money for business class passengers, was tested on 1096 business passengers, with the aim of obtaining more explanatory power due to the larger sample size. Consequently, in-flight service quality was found to have a significant impact on value for money.
Theoretically, the findings show that the proposed logit model adequately explains the in-flight service quality–value for money relationship for business travelers. Moreover, the model fit is good, and the classification table and the ROC curve gave successful results. In short, the key contributions of this study are as follows: (a) Value for money was investigated in a limited number of previous studies in the airline industry. Unlike previous studies, the difference between the perceived value and value for money has been explained comprehensively by using a much larger data set. (b) For the first time, the impact of in-flight service quality on value for money was specifically investigated for business passengers. (c) When selecting the sample, it was required that the airlines be members of airline alliances. Since service quality in the alliances has been conducted in a limited number of studies, it is expected that this study also contributes to literature in this respect.
The study also provides many implications for practitioners in the airline industry. First, the proposed logistics model will contribute to a better understanding of how consumers perceive in-flight service quality. Since value for money affects loyalty and repurchase intention, the findings should be used at every stage of the service design process. Considering the findings of the study, seats must be more ergonomically designed and comfortable to create loyal customers. Compared to leisure passengers, business travelers generate higher revenue per seat (RASM) (Wu and So 2018). Therefore, the findings will help airlines to produce higher value-added services by utilizing their scarce resources more effectively. In addition, it should also be noted that the study represents a kind of “voice of customers”.
High service quality has a high impact on positive WOM/eWOM of airlines. Therefore, we can conclude that this study reflects the spread of positive eWOM in airlines in terms of the data source. Another important implication is about staff training. The findings suggest that staff recruitment and training play a significant role in providing high value-added services in airlines.

Limitations and Directions for Future Studies

As for the suggestions for future studies, although secondary data was used in the study, wider models can be applied in the future. For example, pre-flight and post-flight services can be explicitly investigated. On the other hand, value for money can be investigated according to some sociodemographic characteristics. Thus, the findings may enable the attributes that each customer segment prioritizes to be used in marketing communication activities. Furthermore, evaluations can be made considering the airline business model/cabin class through the moderation effect. In addition, researchers can propose integrated models that provide results that are more robust by using MCDM (Multi-Criteria Decision Making) methods, which is an increasing trend in service quality literature. Finally, we recommend focusing specifically on the premium economy class, which aims to deliver superior value at a slightly higher cost than economy class. This recent cabin class, which provides a significant competitive advantage to airlines, is expected to be a very effective long-haul travel product in the near future (Kuo and Jou 2017). Finally, researchers can make similar analyses of different customer evaluation systems for further studies.
As in all research, there are some limitations in this study. First, it should be noted that service quality and satisfaction are quite dynamic phenomena by nature, and as such, it is not always possible for airlines to maintain the same quality standards, and consumer expectations may change due to various reasons. Therefore, it should be noted that this study only covers the relevant research period. Secondly, only the attributes offered by Skytrax were used in the analysis. However, service quality contains many dimensions and cannot be limited to only four attributes. There are also limitations in the structure of the sample. Since the data do not include demographic information such as age and gender, the findings reflect a broad population. Therefore, highlighting these characteristics in future studies will contribute further to the literature.

Author Contributions

Conceptualization, Ö.A.; methodology, Ö.A.; software, M.B.; validation, M.B. and Ş.A.; formal analysis, Ş.A.; investigation, Ö.A.; resources, M.B.; data curation, M.B.; writing—original draft preparation, Ö.A.; writing—review and editing, Ö.A.; visualization, Ş.A.; supervision, Ö.A.

Funding

This research received no external funding.

Conflicts of Interest

The authors declare no conflict of interest.

Appendix A

Table A1. Descriptive Statistics Related to Airlines and Strategic Alliances.
AirlineFrequencyPercentAirlineFrequencyPercentAirlineFrequencyPercent
TURKISH AIRLINES625.657SINGAPORE 373.376AIR EUROPA 30.274
ADRIA 10.091 SOUTH AFRICAN 60.547 CHINA EASTERN 131.186
AEGEAN 70.639 SWISS 141.277GARUDA INDONESIA 171.551
AIR CANADA 232.099TAP 222.007MEA 20.182
AIR CHINA 151.369THAI 222.007XIAMEN AIRLINES 10.091
AIR INDIA 70.639 UNITED 211.916SAUDIA 30.274
AIR NEW ZEALAND 181.642AEROFLOT 90.821 AIR BERLIN 111.004
ANA 100.912 AIR FRANCE 151.369AMERICAN 333.011
ASIANA 70.639 CHINA SOUTHERN 898.120BRITISH AIRWAYS 11510.493
AUSTRIAN 30.274 KENYA AIRWAYS 70.639 SRILANKA 171.551
AVIANCA 50.456 AERO. ARGENTINAS 40.365 VIETNAM AIRLINES 181.642
BRUSSELS 50.456 ALITALIA 80.730 JORDON 20.182
COPA AIR 50.456 FINNAIR 211.916QATAR 988.942
EGYPT 60.547 KLM 191.734QANTAS 363.285
ETHIOPIAN 121.095TAROM 00.000 MALAYSIA 494.471
EVA AIR 10.091 AEROMEXICO 100.912 LATAM 181.642
LOT 242.190CHINA AIRLINES 111.004JAL 80.730
LUFTHANSA 262.372DELTA AIRLINES 232.099IBERIA 80.730
SAS 100.912 KOREAN AIR 111.004CATHAY 484.380
Total = 1906 (100%)
Star Alliance = 369 (33.67%)Skyteam = 263 (24%)Oneworld = 464 (42.33%)

References

  1. Aksoy, Şafak, Eda Atılgan, and Serkan Akıncı. 2003. Airline services marketing by domestic and foreign firms: Differences from the customers’ viewpoint. Journal of Air Transport Management 9: 343–51. [Google Scholar] [CrossRef]
  2. Alamdari, Fariba. 1999. Airline in-flight entertainment: The passengers’ perspective. Journal of Air Transport Management 5: 203–9. [Google Scholar] [CrossRef]
  3. Bellizzi, Maria Grazia, Laura Eboli, Carmen Forciniti, and Gabriella Mazzula. 2018. Air transport passenger’s satisfaction: An ordered logit model. Transportation Research Procedia 33: 147–54. [Google Scholar] [CrossRef]
  4. Chen, Ching-Fu. 2006. Job satisfaction, organizational commitment and flight attendants’ turnover intentions: A note. Journal of Air Transport Management 12: 274–76. [Google Scholar] [CrossRef]
  5. Chen, Chun-Mei, and Hsian-Ming Liu. 2017. Exploring the impact of airlines service quality on customer loyalty: Evidence from Taiwan. International Journal of Business and Management 12: 36–50. [Google Scholar] [CrossRef]
  6. Chiu, Su-Chin, Chih-Hsing Liu, and Jin-Hua Tu. 2016. The influence of tourists’ expectations on purchase intention: Linking marketing strategy for low-cost airlines. Journal of Air Transport Management 53: 226–34. [Google Scholar] [CrossRef]
  7. Chou, Chang, Li-Jen Liu, Sue-Fen Huang, Jeng-Ming Yih, and Tzeu-Chen Han. 2011. An evaluation of airline service quality using the fuzzy weighted SERVQUAL method. Applied Soft Computing 11: 2117–28. [Google Scholar] [CrossRef]
  8. Civil Aviation Authority. 2003. CAA Passenger Survey Report 2003. London: Economic Regulation Group, UK Civil Aviation Authority. [Google Scholar]
  9. Cohen, Louis, Lawrence Manion, and Keith Marrison. 2018. Research Methods in Education. New York: Routledge. [Google Scholar]
  10. Çokluk, Ömay. 2010. Lojistik regresyon analizi: Kavram ve uygulama. Kuram ve Uygulamada Eğitim Bilimleri 10: 1357–407. [Google Scholar]
  11. Da Silva Menegon, Lizandra, Silvana Ligia Vincenzi, Dalton Francisco de Andrade, Pedro AlbertoBarbetta, Eugenio Andrés Díaz Merino, and Peter Vink. 2017. Design and validation of an aircraft seat comfort scale using item. Applied Ergonomics 62: 216–26. [Google Scholar] [CrossRef]
  12. Douglas, Ian. 2005. Do business class air fares capture added value for airline alliance membership? Journal of Revenue and Pricing Management 4: 219–27. [Google Scholar] [CrossRef]
  13. Eboli, Laura, and Gabriella Mazzulla. 2009. An ordinal logistic regression model for analysing airport passenger satisfaction. EuroMed Journal of Business 4: 40–57. [Google Scholar] [CrossRef]
  14. Field, Andy. 2009. Discovering Statistics Using SPSS. London: SAGE Publications Ltd. [Google Scholar]
  15. Forgas, Santiago, Miguel A. Moliner, Javier Sánchez, and Ramon Palau. 2010. Antecedents of airline passenger loyalty: Low-cost versus traditional airlines. Journal of Air Transport Management 16: 229–33. [Google Scholar] [CrossRef]
  16. Fourie, Colette, and Berendien Lubbe. 2006. Determinants of selection of full-service airlines and low-cost carriers—A note on business travellers in South Africa. Journal of Air Transport Management 12: 98–102. [Google Scholar] [CrossRef]
  17. Graham, Francis, Nigel Dennis, Stephen Ison, and Ian Humphreys. 2007. The transferability of the low-cost model to long-haul airline operations. Tourism Management 28: 391–98. [Google Scholar]
  18. Gilbert, David, and Robin K. C. Wong. 2003. Passenger expectations and airline services: A Hong Kong based study. Tourism Management 24: 519–32. [Google Scholar] [CrossRef]
  19. Girginer, Nuray, and Bülent Cankuş. 2010. Eskisehir’ de belediye hizmetlerine ilişkin algı ve memnuniyetin ikili lojistik regresyon analizi ile ölçülmesi. Eskişehir Osmangazi Üniversitesi Sosyal Bilimler Dergisi 11: 297–322. [Google Scholar]
  20. Grönroos, Christian. 1984. A service quality model and its marketing implications. European Journal of Marketing 18: 36–44. [Google Scholar] [CrossRef]
  21. Hair, Joseph F., William C. Black, Barry J. Babin, and Rolph E. Anderson. 2014. Multivariate Data Analysis. Harlow: Pearson Education Limited. [Google Scholar]
  22. Hapsari, Raditha, Michael D. Clemes, and David Dean. 2017. The impact of service quality, customer engagement and selected marketing constructs on airline passenger loyalty. International Journal of Quality and Service Sciences 9: 21–40. [Google Scholar] [CrossRef]
  23. Hosmer, David W., Stanley Lemeshow, and Rodney X. Sturdivant. 2013. Applied Logistic Regression. Hoboken: John Wiley & Sons. [Google Scholar]
  24. Huck, Schuyler W. 2012. Reading Statistics and Research. Boston: Pearson Education. [Google Scholar]
  25. IATA. 2017. International Air Trasportation Association. Available online: https://www.iata.org/pressroom/pr/Pages/2017-10-24-01.aspx (accessed on 10 December 2018).
  26. ICAO. 2018. International Civil Aviation Organization. Available online: https://www.icao.int/annual-report-2017/Pages/the-world-of-air-transport-in-2017.aspx (accessed on 12 January 2019).
  27. Independent. 2018. Best Business Class Beds in the Sky, from Japan Airlines to Qatar’s Qsuites. Available online: https://www.independent.co.uk/travel/news-and-advice/best-business-class-beds-flights-airlines-seats-etihad-british-airways-qatar-japan-air-new-zealand-a8163961.html (accessed on 19 November 2018).
  28. Kardes, Frank R., Maria L. Cronley, and Thomas W. Cline. 2011. Consumer Behavior. Mason: Cengage Leerning. [Google Scholar]
  29. Kashyap, Rajiv, and David C. Bojanic. 2000. A structural analysis of value, quality, and price perceptions of business and leisure travelers. Journal of Travel Research 39: 45–51. [Google Scholar] [CrossRef]
  30. Kaynama, Shohreh A., and Christine I. Black. 2000. A proposal to assess the service quality of online travel agencies: An exploratory study. Journal of Professional Services Marketing 21: 63–88. [Google Scholar] [CrossRef]
  31. Koklic, Mateja Kos, Monika Kukar-Kinney, and Spela Vegelj. 2017. An investigation of customer satisfaction with low-cost and full-service airline companies. Journal of Business Research 80: 188–96. [Google Scholar] [CrossRef]
  32. Kotler, Philip, and Kevin L. Keller. 2012. Marketing Management. Upper Saddle River: Prentice Hall. [Google Scholar]
  33. Kuo, Chung-Wei, and Rong-Chang Jou. 2017. Willingness to pay for airlines’ premium economy class: The perspective of passengers. Journal of Air Transport Management 59: 134–42. [Google Scholar] [CrossRef]
  34. Lacic, Emanuel, Dominik Kowald, and Elisabeth Lex. 2016. High Enough?: Explaining and Predicting Traveler Satisfaction Using Airline Reviews. Halifax: Nova Scotia, pp. 249–54. [Google Scholar]
  35. Lee, JooEun, and SeonHee Ko. 2016. Effect of the in-flight meal service quality on the customer value and loyalty. Indian Journal of Science and Technology 9: 1–6. [Google Scholar] [CrossRef]
  36. Lee, Darin, and María José Luengo-Prado. 2004. Are passengers willing to pay more for additional legroom? Journal of Air Transport Management 10: 377–83. [Google Scholar] [CrossRef]
  37. Lee, Carman K. M., K. Kam Hung Ng, High Kai Chan, King Lun Choy, W. C. Tai, and L. S. Choi. 2018. A multi-group analysis of social media engagement and loyalty constructs between full-service and low-cost carriers in Hong Kong. Journal of Air Transport Management 73: 46–57. [Google Scholar] [CrossRef]
  38. Leonnard, S. E. 2018. Perceived service quality, perceived value for money, satisfaction and repurchase intention: An evaluation on private university services. International Journal of Commerce and Finance 4: 40–51. [Google Scholar]
  39. Li, Wenhua, Suihuai Yu, Huining Pei, Chuan Zhao, and Baozhem Tian. 2017. A hybrid approach based on fuzzy AHP and 2-tuple fuzzy linguistic method for evaluation in-flight service quality. Journal of Air Transport Management 60: 49–64. [Google Scholar] [CrossRef]
  40. Liou, James J. H., and Gwo-Hshiung Tzeng. 2007. A non-additive model for evaluating airline service quality. Journal of Air Transport Management 13: 131–38. [Google Scholar] [CrossRef]
  41. Loureiro, Sandra Maria Correia, and Ana Filipa Fialho. 2017. The role of intrinsic in-flight cues in relationship quality and behavioural intentions: Segmentation in less mindful and mindful passengers. Journal of Travel & Marketing 34: 948–62. [Google Scholar]
  42. Mason, Keith J. 2001. Marketing low-cost airline services to business travellers. Journal of Air Transport Management 7: 103–9. [Google Scholar] [CrossRef]
  43. Mason, Keith J. 2005. Observations of fundamental changes in the demand for aviation services. Journal of Air Transport Management 11: 9–25. [Google Scholar] [CrossRef]
  44. Mason, Keith J. 2006. The value and usage of ticket flexibility for short haul business travellers. Journal of Air Transport Management 12: 92–97. [Google Scholar] [CrossRef]
  45. Messner, Wolfgang. 2016. The impact of an aircraft’s service environment on perceptions of in-flight food quality. Journal of Air Transport Management 53: 123–30. [Google Scholar] [CrossRef]
  46. Milioti, Christina P., Matthew G. Karlaftis, and Eleni Akkogiounoglou. 2015. Traveler perceptions and airline choice: A multivariate probit approach. Journal of Air Transport Management 49: 46–52. [Google Scholar] [CrossRef]
  47. Nejati, Mehran, Mostafa Nejati, and Azadeh Shafaei. 2013. Ranking airlines’ service quality factors using a fuzzy approach: Study of the Iranian society. International Journal of Quality & Reliability Management 25: 520–32. [Google Scholar]
  48. Nield, Kevin, Metin Kozak, and Geoffrey LeGrys. 2000. The role of food service in tourist satisfaction. International Journal of Hospitality Management 19: 375–84. [Google Scholar] [CrossRef]
  49. Oliver, Richard L. 1977. Effect of expectation and disconfirmation on postexposure product evaluations: An alternative interpretation. Journal of Applied Psychology 62: 480–86. [Google Scholar] [CrossRef]
  50. Osaki, Takanori, and Yukihiko Kubota. 2016. Perceptions of premium service and superiority: Why do customers pay more for high-value-added domestic airline services in Japan? Journal of Air Transport Management 57: 196–201. [Google Scholar] [CrossRef]
  51. Ostrowski, Peter L., Terrence V. O’Brien, and Geoffrey L. Gordon. 1993. Service quality and customer loyalty in the commercial airline industry. Journal of Travel Research 32: 16–24. [Google Scholar] [CrossRef]
  52. Pallant, Julie. 2011. SPSS Survival Manual. Berkshire: Open University Press. [Google Scholar]
  53. Pandey, Shweta, and Deepak Chawla. 2016. Understanding Indian online clothing shopper loyalty and disloyalty: The impact of e-lifestyles and website quality. Journal of Internet Commerce 15: 332–52. [Google Scholar] [CrossRef]
  54. Parasuraman, A., Valarie A. Zeithaml, and Leaonard L. Berry. 1988. SERVQUAL: A Multiple-Item Scale for Measuring Consumer Perceptions of Service Quality. Journal of Retailing 64: 12–40. [Google Scholar]
  55. Park, Jin-Woo. 2007. Passenger perceptions of service quality: Korean and Australian case studies. Journal of Air Transport Management 13: 238–42. [Google Scholar] [CrossRef]
  56. Rajaguru, Rajesh. 2016. Role of value for money and service quality on behavioural intention: A study of full service and low cost airlines. Journal of Air Transport Management 53: 114–22. [Google Scholar] [CrossRef]
  57. Sánchez-Fernández, Raquel, and M. Ángeles Iniesta-Bonillo. 2007. The concept of perceived value: A systematic review of the research. Marketing Theory 7: 427–51. [Google Scholar] [CrossRef]
  58. Sandada, Maxwell, and Bright Matibiri. 2016. An investigation into the impact of service quality, frequent flier programs and safety perception on satisfaction and customer loyalty in the airline industry in Southern Africa. South East European Journal of Economics and Business 11: 41–53. [Google Scholar] [CrossRef]
  59. SeatGuru. 2018. Premium Economy Class Comparison Chart. Available online: https://www.seatguru.com/charts/premium_economy.php (accessed on 28 October 2018).
  60. Šebjan, Urban, Polona Tominc, and Karin Širec. 2017. Multiple conceptual modelling of perceived quality of in-flight airline services. Promet-Traffic & Transportation 29: 311–19. [Google Scholar]
  61. Skytrax. 2018. Our Background. Available online: https://www.airlinequality.com/skytrax-research/ (accessed on 28 October 2018).
  62. Smith, Graham. 2013. Economy Passengers ‘Increasingly Research Seat Comfort’. Available online: https://www.businesstraveller.com/news/2013/11/18/economy-passengers-increasingly-research-seat-comfort/ (accessed on 28 October 2018).
  63. Suki, Norazah Mohd. 2014. Passenger satisfaction with airline service quality in Malaysia: A structural equation modeling approach. Research in Transportation Business & Management 10: 26–32. [Google Scholar]
  64. Sweeney, Jillian C., and Geoffrey N. Soutar. 2001. Consumer perceived value: The development of a multiple item scale. Journal of Retailing 77: 203–20. [Google Scholar] [CrossRef]
  65. Tsafarakis, Stelios, Theodosios Kokotas, and Angelos Pantouvakis. 2018. A multiple criteria approach for airline passenger satisfaction measurement and service quality improvement. Journal of Air Transport Management 68: 61–75. [Google Scholar] [CrossRef]
  66. Tsaur, Sheng-Hshiung, Te-Yi Chang, and Chang-Hua Yen. 2002. The evaluation of airline service quality by fuzzy MCDM. Tourism Management 23: 107–15. [Google Scholar] [CrossRef]
  67. Waguespack, Blaise P., and Dawna L. Rhoades. 2014. Twenty five years of measuring airline service quality or why is airline service quality only good when times are bad? Research in Transportation Business and Management 10: 33–39. [Google Scholar] [CrossRef]
  68. Warnock-Smith, David, John F. O’Connell, and Mahnaz Maleki. 2017. An analysis of ongoing trends in airline ancillary revenues. Journal of Air Transport Management 64: 42–54. [Google Scholar] [CrossRef]
  69. Wu, Cheng-Lung, and T. H. Hanson So. 2018. On the flight choice behaviour of business-purpose passengers in the Australian domestic air market. Journal of Air Transport Management 72: 56–67. [Google Scholar] [CrossRef]
  70. Wycoff, Edgar B., and Jill D. Holley. 1990. Effects of flight attendants’ touch upon airline passengers’ perceptions of the attendant and the airline. Perceptual and Motor Skills 71: 932–34. [Google Scholar] [CrossRef]
  71. Zeithaml, Valarie A. 1988. Consumer perception of price, quality, and value: A means-end model and synthesis of evidence. Journal of Marketing 52: 2–22. [Google Scholar] [CrossRef]
Figure 1. Conceptual Model.
Admsci 09 00026 g001
Figure 2. ROC Curve.
Admsci 09 00026 g002
Table 1. Descriptive statistics and correlations between predictors.
VariablesMeanStd. Dv.(1)(2)(3)(4)
Seat comfort3.6641.3191
Staff service 3.9201.3510.625 *1
Food and beverages 3.4221.4280.682 *0.732 *1
In-flight entertainment 3.3291.3550.641 *0.575 *0.711 *1
Note: for value for money, 0 = unsatisfied and 1 = satisfied, and p < 0.001 *.
Table 2. Model Summary.
ModelDeviancedfχ2p R C S 2 R N 2
H01459.0271095
H1679.6991091779.328<0.001 0.5090.692
Hosmer & Lemeshow Statistics
χ2 = 6.150p = 0.630
Note: R C S 2 and R N 2 denote Cox and Snell’s and Nagelkerke’s R2, respectively.
Table 3. Classification Table.
ObservedPredictedPercentage Correct
UnsatisfiedSatisfied
Step 1Unsatisfied3338779.3
Satisfied5262492.3
Overall Percentage 87.3
Table 4. Binominal logistic regression results.
PredictorβS. E.WalddfpExp (β)
Seat comfort0.7760.10356.6261<0.001 2.173
Staff service 0.7270.10251.0671<0.001 2.069
Food and beverages 0.6110.10832.0701<0.001 1.843
In-flight entertainment 0.2010.0974.28610.038 1.222
Constant−7.8100.500244.0831<0.001 0.000
Table 5. Correct rate of classification.
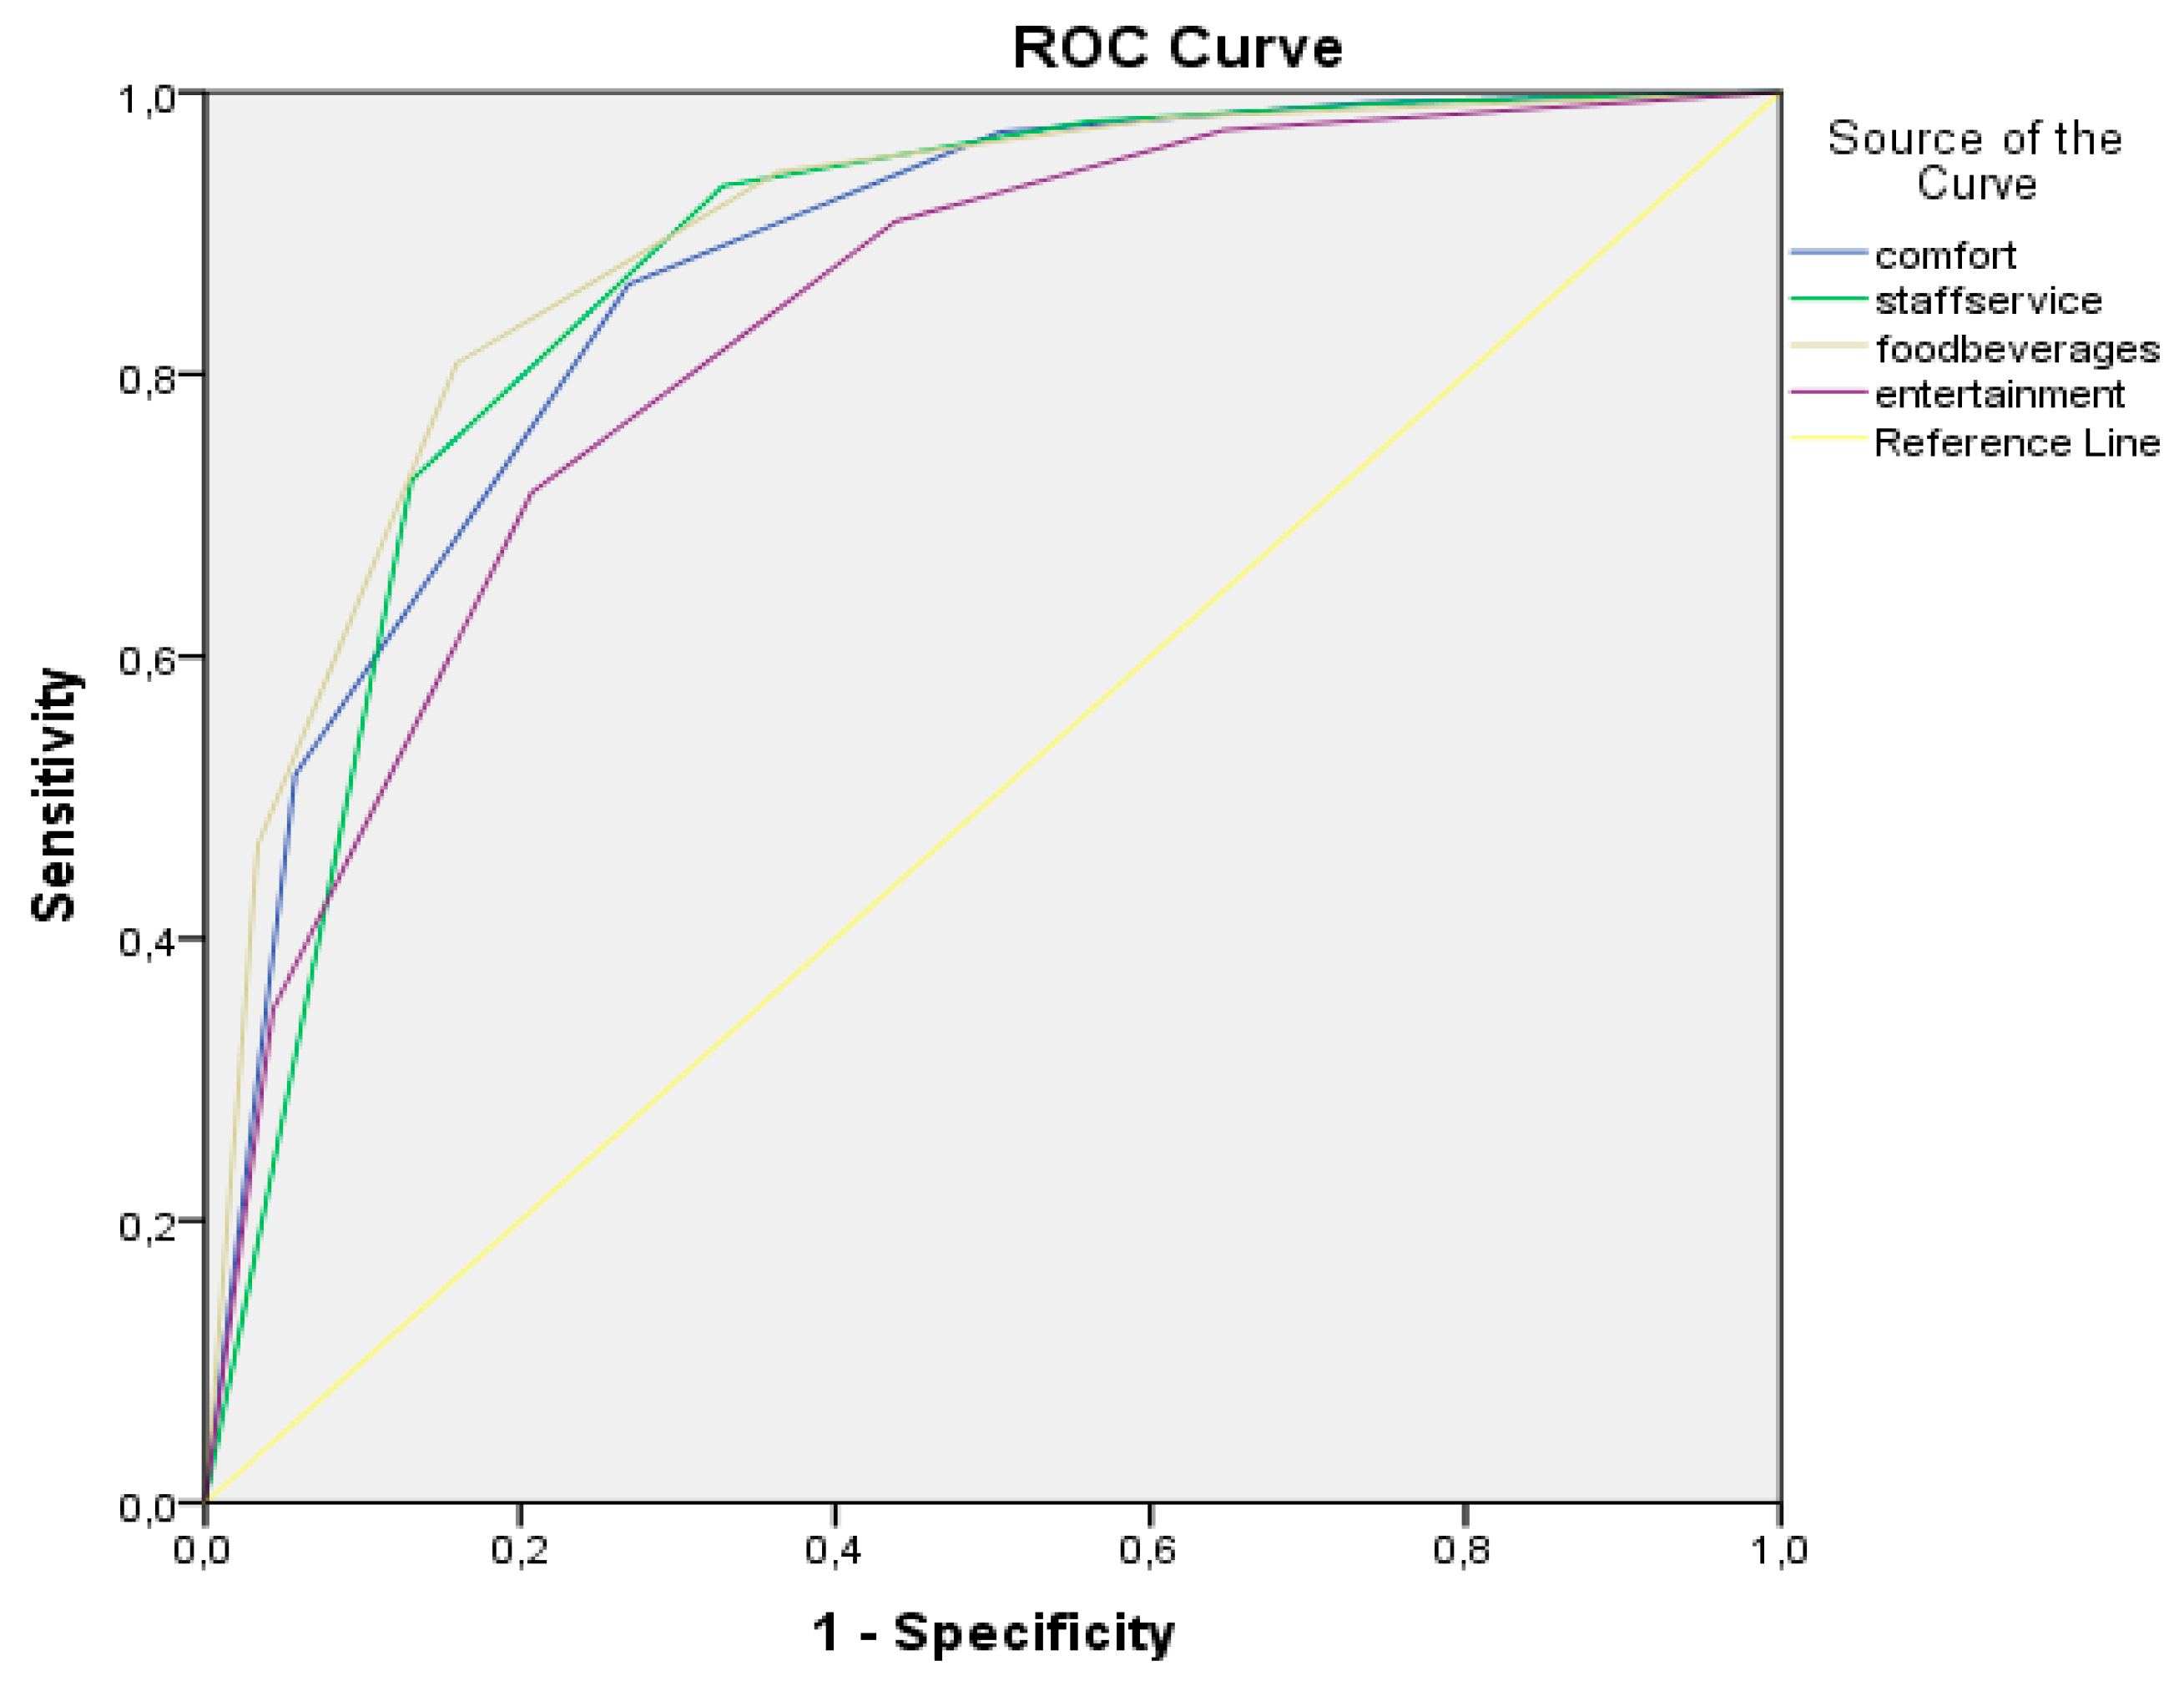
Area Under the Curve
Predictors Areap
Comfort 0.867<0.001
Staff service0.869<0.001
Food and beverages0.890<0.001
Entertainment0.827<0.001

