Article

Developing the Marketing Experience to Increase Shopping Time: The Moderating Effect of Visit Frequency

by
Silvia Cachero-Martínez
1,* and
Rodolfo Vázquez-Casielles
2
1
Cátedra Fundación Ramón Areces de Distribución Comercial, University of Oviedo, 33006 Oviedo, Spain
2
Business Administration, University of Oviedo, 33006 Oviedo, Spain
*
Author to whom correspondence should be addressed.
Adm. Sci. 2018, 8(4), 77; https://doi.org/10.3390/admsci8040077
Submission received: 25 October 2018 / Revised: 23 November 2018 / Accepted: 26 November 2018 / Published: 30 November 2018
(This article belongs to the Special Issue Customer Loyalty and Brand Management)

Abstract

:
In the retail sector, the creation of shopping experiences becomes increasingly important to obtain a competitive advantage, and to meet consumers’ needs and desires. Knowing how to design and apply these experiences can stimulate consumer engagement and their intention to spend more time at the retailer. Under this premise, the objective of this research is to analyze the relationship between different shopping experience dimensions, consumers’ engagement, and their willingness to spend more time at the retailer. Using survey methodology on a sample of 527 consumers, the results show that shopping experiences stimulate the consumers’ engagement and their predisposition to spending more time at the store. In addition, a moderating effect of visit frequency to the retailer is observed, such that the higher this is, the more intense the relationship between experience dimensions and consumer engagement will be.

1. Introduction

The retail sector, one of the most dynamic in the economy (IBM 2012), must know how to adapt to the new market’s demands. It faces increasingly demanding consumers, who demand unique products and services, and who have shared loyalty (Alfaro 2012). In addition, consumers do not demand only products or services, but they also want to live unique and unrepeatable experiences during the shopping. Given this new scenario of distribution, retailers have had to update both their offers and their ways of doing things, in order to offer a differentiated product and service, and thus seek the engagement and loyalty of their customers. For this, as the study by Deloitte (2016) indicates, it is necessary to design strategies that are focused on the “shopping experience”, identifying those factors or dimensions that “create” experiences, defining how they will be implemented, and developing ongoing actions to revitalize and to surprise the customer with these shopping experiences. These new strategies provoke the situation in which the consumer goes to the retail establishment, not only to shop for a product or service, but also to enjoy the act of shopping itself (Krishna 2013).
Most consumers initially engage with a retailer for rational reasons, such as the value that it brings, or comfort. As the frequency of visits increases, feelings begin to emerge, due to the commitment or engagement that is acquired with the retailer. In this process, the experiences formed during shopping play a fundamental role (Homburg et al. 2017). Understanding how consumers experience emotions caused by marketing stimuli raises various implications in the design of the retailer’s offer. Retailers need to develop action procedures that allow them to manage what they can offer in marketing experiences (Alfaro 2012).
Shopping experience research relates these experiences to satisfaction, relegating consumer behavior to the background, and not identifying that marketing actions are what lead to loyal and committed customers (Brun et al. 2017). Tsaur et al. (2007) examine whether experiences of experiential marketing have positive effects on consequent visitors’ behaviors. They affirm that the experiences of experiential marketing have positive effects on emotions. Furthermore, emotions also have a positive effect on the behavioral intention, through the mechanism of satisfaction. No studies have been found that directly relate shopping experiences with engagement and shopping time. In this paper, the authors analyzed different experience dimensions, and their relationship with consumer engagement and with the predisposition to extend consumer shopping time, which is the main contribution of this research. This will allow the store manager to identify the aspects to be modified in its strategy, in order to obtain more engagement from customers who wish to stay longer in the store, thus creating deeper relationships that distinguishing the store from the competition. Grewal et al. (2017) highlight the importance of the study of engagement as an area of great interest in retailing.
This article contributes to the management literature of retail companies in two ways. In the first place, the knowledge of the type of experiences at the store is extended, analyzing the relationship between different dimensions of experience (sensory, intellectual, social, pragmatic, and emotional), consumer engagement, and willingness by the consumer to extend their shopping time. Secondly, the empirical research expands on existing knowledge, analyzing the moderating effect of visit frequency to the retailer. This is to understand whether a greater frequency of visits increases the positive influence of the experience dimensions on the engagement, intensifying not only the attitudinal loyalty, but also other shopping behaviors from the desire to spend more time in the store.
In the following sections, we comment on the relevant literature on the subject, and propose various hypotheses. Later we describe the research methodology and the results of the estimation of our causal model. Finally, we carry out a discussion on the theoretical and managerial implications, as well as the conclusions of the study.

2. Literature Review

In the marketing literature, different dimensions of customer experience have been analyzed. In different studies, four dimensions of experience are identified (Pine et al. 1999; Schmitt 1999, 2003; Gentile et al. 2007; Brakus et al. 2009; Grewal et al. 2009; Verhoef et al. 2009; Cachero and Vázquez 2017): sensory experience, intellectual experience, social experience, and pragmatic experience. Furthermore, Holbrook and Hirschman (1982) were the first to introducing emotions (e.g., happiness, enjoyment) as a component of consumer behavior, and to recognize emotional experience as a fundamental aspect of consumption (Bagozzi et al. 1999; Arnold and Reynolds 2003). In this paper we propose a hierarchical structure of the experience dimensions (Schmitt 1999), in line with the cognitive-affective approach of Ajzen and Fishbein (1980). As a background of emotional experience, we identify other dimensions of experience (Gentile et al. 2007; Brakus et al. 2009; Verhoef et al. 2009): sensory experience, intellectual experience, social experience, and pragmatic experience.

2.1. Sensory Experience

This is a dimension of experience that includes the senses of consumers, and that affects their perception, judgment, and behavior (Smith and Wheeler 2002). The empowerment of the consumer senses has been used in the retail sector for a long time; what has changed is the way of doing it: before, sensory experience was developed unconsciously, and today, planning by the retailer is maximum, either because sensory experience affects the consumer’s perception of the store (Helkkula 2011), or the consumer’s perception of the brand (Moreira et al. 2017).
The retailer is looking for absolute well-being, both for the consumer and for the people who work there. For this, it affects different environmental factors that it modifies based on the sensory experience that it wants to offer. Thus, the lighting varies, the layout of the product, the design, the smells, the color, the music, etc. Sensory-based stores have experienced great developments; they are shops where the brand is played, smelled, and heard. Table 1 presents the most relevant studies related to the sensory experience.

2.2. Intellectual Experience

Intellectual experience occurs when the retailer’s merchandising strategy (intellectual experience through design) and/or interaction with employees (intellectual experience with employees) stimulates the consumer’s curiosity and invites them to think and imagine (Schmitt 1999). Consumer curiosity is achieved when a seller evokes mystery during shopping (Menon and Soman 2002). Some academics say that the induction of curiosity produces positive results for the retailer (Hill et al. 2016). An emerging tool for retailers is augmented reality (Scholz and Smith 2016), with a promising future (Javornik 2016). It consists of combining the real world with the virtual world through a computer process, enriching the visual experience and provoking curiosity (Carmigniani and Furht 2011).

2.3. Social Experience

This type of experience refers to the consumer himself and his social context, his relationships with other consumers (Ferguson et al. 2010), and with the employees. From the research of Tauber (1972), the literature suggests that shopping is a social experience, so that relationships with the group are determinants of many of their behaviors.

2.4. Pragmatic Experience

The pragmatic experience implies that the consumer is motivated by the utility, value, functionality, efficiency, convenience, and usability of things, and not by their appearance, aesthetics, or social context. It refers to heuristic rules and election criteria linked to savings, acquiring products or services that are practical and of recognized quality, as well as the speed and efficiency of the actions of information search and purchase at the retailer (Walsh et al. 2011). For example, to stimulate the pragmatic experience, a retailer can offer an assortment of well-known brands with a price-quality ratio and better promotions than those of the competition. The objective is to attract a group of consumers who are interested in obtaining detailed information on prices and promotions, ensure that there is sufficient stock of the promoted products, or that the quality of the products is maintained during promotion periods. The retailer can also offer an assortment range that meets the needs of customers, all types of guarantees and complementary services (changes, returns, home delivery) or discounts, as well as allowing customers to verify the utility and practical value of some products.

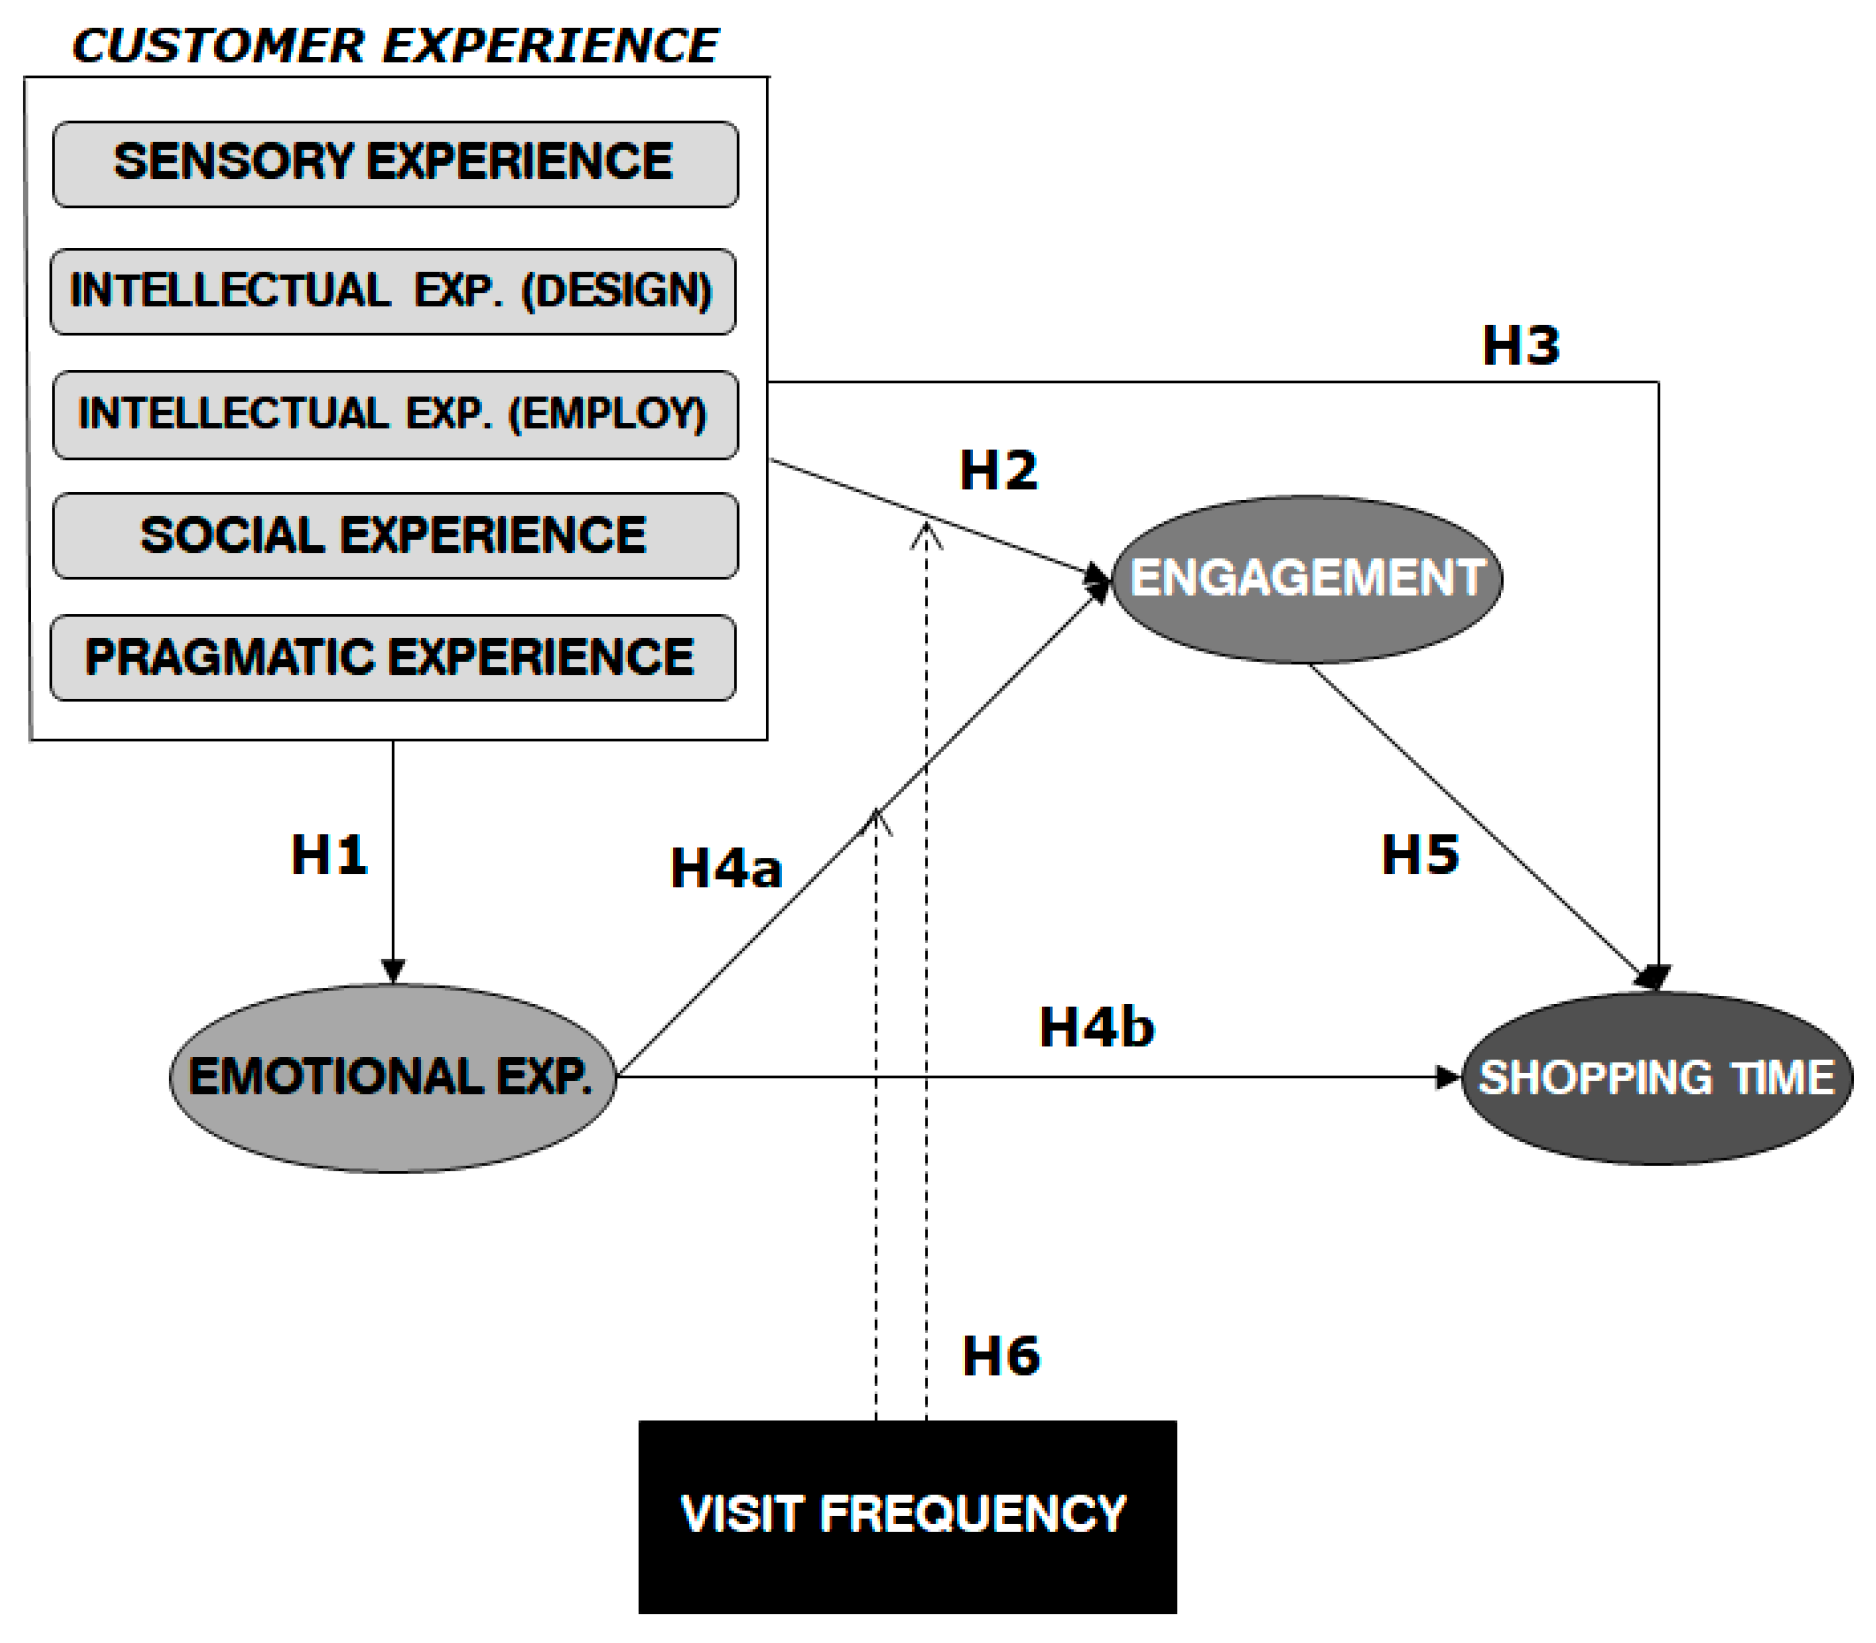
3. Research Model and Hypotheses

In line with the review literature, the objective of this research is to analyze the relationship between different shopping experience dimensions, consumers’ engagement, and their willingness to spend more time at the retailer (see Figure 1). This section discusses our key research variables and their hypothesized relationships.

3.1. Effects of Experience Dimensions (Sensory, Intellectual, Social, and Pragmatic)

The store stimuli linked to sensory experience are not only a source of emotional experience (Kaltcheva and Weitz 2006; Walsh et al. 2011; Nasermoadeli et al. 2013), but can also encourage consumer engagement (Gentile et al. 2007; Iglesias et al. 2011), attitudinal loyalty (Brakus et al. 2009; Iglesias et al. 2011), and other shopping behaviors such as extension in shopping time (e.g., wishing to spend more time in the establishment because of the good sensory environment that is enjoyed in the shop: smells, lighting, appropriate music, etc.). Thus, the following hypotheses are formulated:
Hypothesis 1a.
Favorable perceptions of sensory experience have a positive influence on consumers’ positive emotional experience.
Hypothesis 2a.
Favorable perceptions of sensory experience have a positive influence on consumer engagement.
Hypothesis 3a.
Favorable perceptions of sensory experience are positively related to extended shopping time.
In relation to intellectual experience, the retailer needs to consider the process of reflection and surprise that he wishes to invoke via the shop design, novelty in the presentation and testing of products, leisure activities, and interaction with employees. The offer with original and creative products that lead the consumer to imagine, combined with the stimulation of creativity by retailers, for example through the creation of augmented reality experiences, can generate emotional experiences, engagement, attitudinal loyalty, and other shopping behaviors such as extended shopping time (Foroudi et al. 2016). Thus:
Hypothesis 1b.
Favorable perceptions of intellectual experience (through design) have a positive influence on consumers’ positive emotional experiences.
Hypothesis 2b.
Favorable perceptions of intellectual experience (through design) have a positive influence on consumer engagement.
Hypothesis 3b.
Favorable perceptions of intellectual experience (through design) are positively related to extended shopping time.
Hypothesis 1c.
Favorable perceptions of intellectual experience (through employees) have a positive influence on consumers’ positive emotional experience.
Hypothesis 2c.
Favorable perceptions of intellectual experience (through employees) have a positive influence on consumer engagement.
Hypothesis 3c.
Favorable perceptions of intellectual experience (through employees) are positively related to extended shopping time.
The design of social experiences by the retailer is a strategy desired by the consumer because it provides various non-monetary benefits (Borges et al. 2010). One of them would be to have the opportunity to go shopping with family/friends, and to obtain information about new products/services or trends that reflect attitudes and lifestyles. Other experiences that the consumer wants are to go shopping to find new friends, meet other people, or simply to see people. In addition, the social experience offers the opportunity to interact with other consumers who share interests, and to go to a place where reference groups can meet.
Going shopping today is a social act, a time of enjoyment in the company of friends or family (Mangleburg et al. 2004), and where a closer relationship with employees is expected (Chang et al. 2011), which encourages the positive emotional experience. Being advised, understood, and heard by employees are aspects that are highly valued by consumers, so that these actions can awaken the positive emotions of the consumer during shopping, with a consequent increase in their engagement. In addition, improving social interactions in the retailer results in higher levels of consumer loyalty and other shopping behaviors such as extended shopping time (Penz and Hogg 2011; Nasermoadeli et al. 2013). All of these lead to the following hypotheses:
Hypothesis 1d.
Favorable perceptions of social experience have a positive influence on consumers’ positive emotional experiences.
Hypothesis 2d.
Favorable perceptions of social experience have a positive influence on consumer engagement.
Hypothesis 3d.
Favorable perceptions of social experience are positively related to extended shopping time.
At many times, the client may experience emotions that are derived from pragmatic experience (Spinelli et al. 2015). The present study considers that functional purchases, apparently utilitarian, such as searching for good prices, promotions, or products, can be pleasant, and therefore influence the emotional experience. This is due to non-monetary reasons, including for example, the hedonic benefits provided by non-monetary promotions, or even the emotions derived from getting a good product at a good price (Alba and Williams 2013).
The creation of pragmatic experiences positively influences the positive emotional experience (derived from getting a product at a better price, or finding a product with less effort), in the engagement (derived from the continuous relationship with the retailer looking for his products of quality or its promotions), loyalty (derived from having carried out an effective, convenient and useful purchase, which encourages re-living that process or extending it), and other shopping behaviors such as extended shopping time (Walsh et al. 2011). Therefore, the following hypotheses are proposed:
Hypothesis 1e.
Favorable perceptions of pragmatic experience have a positive influence on consumers’ positive emotional experiences.
Hypothesis 2e.
Favorable perceptions of pragmatic experience have a positive influence on consumer engagement.
Hypothesis 3e.
Favorable perceptions of pragmatic experience are positively related to extended shopping time.

3.2. Consequences of Emotional Experience

The review of the literature confirms that having positive emotional experiences is a desired factor for consumers (Li et al. 2009); thus, in recent years, the emotional components in decision-making have become more relevant (Quartier et al. 2014; Adam et al. 2015; Pérez and Del Bosque 2015; Kim et al. 2016; Ladhari et al. 2017). Currently, retailers have begun to develop experience-marketing strategies as a way to express the values that represent the company. What they seek is to generate emotions and feelings in the consumer, such that the links with these feelings are deeper (Mishra et al. 2016), and engagement is encouraged (Johnson et al. 2008).
Beatty et al. (2012) propose an analysis with three components of commitment: affective commitment, calculated commitment, and normative commitment. This research has considered the positive dimension of commitment, i.e., affective commitment (Gilliand and Bello 2002), where the consumer is faithful to the retailer due to different relational benefits: benefits of special treatment (with extra services, sensory experiences, and intellectual experiences), social benefits (personal and friendly links between consumers and employees), and trust benefits.
The affective commitment is configured in the literature as a continuous relationship between a distributor or between a brand and a consumer (Hollebeek 2011). This commitment is the result of the emotional bond between both (Brodie et al. 2011; Claffey and Brady 2014), and it plays a key role in long-term relationships (Bowden 2009; Mollen and Wilson 2010), leading to deeper relationships and the creation of a real engagement. So, it raises:
Hypothesis 4a.
Favorable perceptions of emotional experience have a positive influence on consumer engagement.
It is interesting for retailers to investigate the relationship between shopping experiences and attitudinal loyalty (Srivastava and Kaul 2014), to select strategies that are linked to experience marketing, and to obtain loyal customers. The model proposed in this research studies the effect of positive emotional experience on an indicator of shopping behavior: predisposition to extend shopping time. The time that consumers spend today to make their purchases has decreased significantly. It is interesting to investigate whether the consumers that are emotionally linked to a retail store or a brand are really willing to invest a greater part of their time in the act of shopping in it. It is to be expected that consumers who are emotionally linked to a retailer have more loyalty (Foroudi et al. 2016; Srivastava and Kaul 2014), as well as more predisposition to extend their shopping time (Andreu et al. 2006). For all these reasons, it is proposed that:
Hypothesis 4b.
Favorable perceptions of emotional experience are positively related to extended shopping time.
Finally, this research raises the possible relationship between the consumer engagement and the predisposition to extend shopping time, from the review of literature that analyze the link between engagement and other indicators of loyalty and shopping behavior (Evanschitzky et al. 2006; Hsu et al. 2010). Engagement is the indicator of the consumer’s desire to maintain the relationship (Geyskens et al. 1996). A consumer engagement, is one that manifests a sense of belonging towards the retailer (De Ruyter et al. 2001), and where the consumer is more likely to want to extend their time of purchase at the retailer. This leads us to propose the following hypothesis:
Hypothesis 5.
Consumer engagement is positively related to extended shopping time.

3.3. Moderating Effect of Visit Frequency

Presumably, those consumers who visit the retailer more, whether or not they make purchases there, are looking for the shopping experience that it offers, and because the memory of that experience remains in their mind, creating value and providing satisfaction (Tsiotsou 2006). The frequency of shopping should indicate that the consumer is engaged and is loyal to the brand, but other factors must be evaluated. There are studies, such as Roy’s (1994), which relate more frequent visits with hedonic motivations and less frequent visits with functional motivations (for example, going to the retailer only when there are promotions). Traditionally, shopping frequency has also been linked to security, closer relationships, and excitement and enjoyment during the purchase (Swinyard 1998).
Shopping experiences can influence consumer engagement to a greater extent if they visit the retailer with some frequency. One of the reasons that may be due to the consumer visiting the store regularly is due to the memory of the shopping experience, and through which he has created a certain level of commitment with the retailer. As the consumer–retailer relationship matures and becomes more personal and close, as a result of a greater number of visits, the amount of information available and the trust in the shop or brand increases (Gill et al. 1998). In addition, more frequent shoppers tend to be more hedonic-oriented. Consumers who have a hedonic orientation are pursuing an activity that they do not “have to do”, and that they find personally gratifying. These consumers desire to derive richer and fuller experiences from the activity, which facilitates a greater engagement (Kaltcheva and Weitz 2006; Vieira and Torres 2014). Therefore, it is expected that for those consumers who visit the establishment more frequently, the effect of the shopping experience on the engagement is greater. Thus, it is proposed that:
Hypothesis 6.
As the frequency of the visit to the retailer increases, the positive influence of the experience dimensions on the consumer engagement increases.
As a conclusion to this section, Figure 1 summarizes all of the hypotheses that are previously proposed and justified.

4. Research Methodology

4.1. Research Scope

In order to contrast the hypotheses, the present investigation focused on nine retail sectors: clothing store and fashion; shoes; cosmetics and perfumery; jewelry; sports; electronics; decoration; bookstores and toys. For these sectors, retail brands offer different types of shopping experiences: sensory, intellectual, social, and pragmatic. Each interviewee indicated his opinion of a retailer, which he had visited in the last two weeks. The sample was 527 consumers from several cities in Spain. Its distribution was made by age and sex levels. Table 2 details the technical data of the study.

4.2. Research Design and Measurement Scales

At the methodological level, work has been subdivided into two stages. The first one consists of the identification of the dimensions of the experience that are present in the retail sector, and the second analyzes the relationships between those dimensions of experience and consumer engagement and attitudinal loyalty (using shopping time as an indicator).
For the data collection, a questionnaire was prepared so that a sample of consumers could indicate their opinion on different dimensions of the shopping experience, and factors related to the engagement with the retailer, and with shopping time. The format of the scales was the following: the positive emotional experience was measured with a Likert scale that reflected the intensity of those emotions, from “1-Not at all” to “7-Extremely”, and the rest of the concepts were measured with Likert scales whose answers varied from “1—Total Disagreement” to “7—Total Agreement”. The scales have been elaborated from the review of the literature: Cachero and Vázquez (2017) for the dimensions of the experience; Walsh et al. (2011), Curth et al. (2014) and Vivek et al. (2014) for engagement; and Andreu et al. (2006) for the predisposition to extend shopping time, adapting these scales to the retail sector.

5. Data Analysis

An approach comprising confirmatory factor analysis (CFA), structural equation modeling (SEM), and multi-group analysis was adopted.
First, CFA was run to check the reliability and validity of the variables (Hair et al. 2010).
Second, to examine the effects of the experience dimensions (sensory, intellectual, social, and pragmatic), consequences of emotional experience, and the mediating effect of positive emotional experience, EQS 6.2 software was used, applying the Structural Equation Model (SEM-covariances). The estimation method used was that of the robust maximum likelihood (ML Robust). In addition to its use in similar research, the choice of this software focused on its advantages. SEM-covariances allow us to estimate multiple and cross-referenced dependency relationships among diverse variables and constructs, and they have the capacity to represent concepts that are not observed in these relationships, considering the measurement error in the estimation process (Hair et al. 2010). Finally, it is a flexible technique that allows for the comparison of alternative models that represent the same situation and selection of the ideal one, as well as rectifying the initial model to find an improved one.
Third, to test for the moderating effect of visit frequency on the relationships between customer experience (sensory, intellectual, social, pragmatic, emotional) and engagement, a multi-group analysis was run, which compared differences in coefficients of the corresponding structural paths for the individuals with a high frequency of visits, and for individuals with a low frequency of visits to retailers.

6. Results

6.1. Research Reliability and Measurement Scales

To demonstrate the reliability and validity of the measurement model, a confirmatory factorial analysis was carried out, from which satisfactory overall adjustment results were obtained, with content validity (standardized loading factors greater than 0.6) (Table 3). The Cronbach’s alpha coefficients were all above 0.7, the composite reliability was greater than 0.7, and the Average Variance Extracted (AVE) was close to or greater than 0.5, confirming the convergent validity. There was also discriminant validity, given that the confidence intervals of all the correlations between the concepts analyzed did not contain the unit value, and its squared value did not exceed the AVE of the measurement scales considered (Table 4). The psychometric properties were adequate, so we continued with the estimation of the structural model.

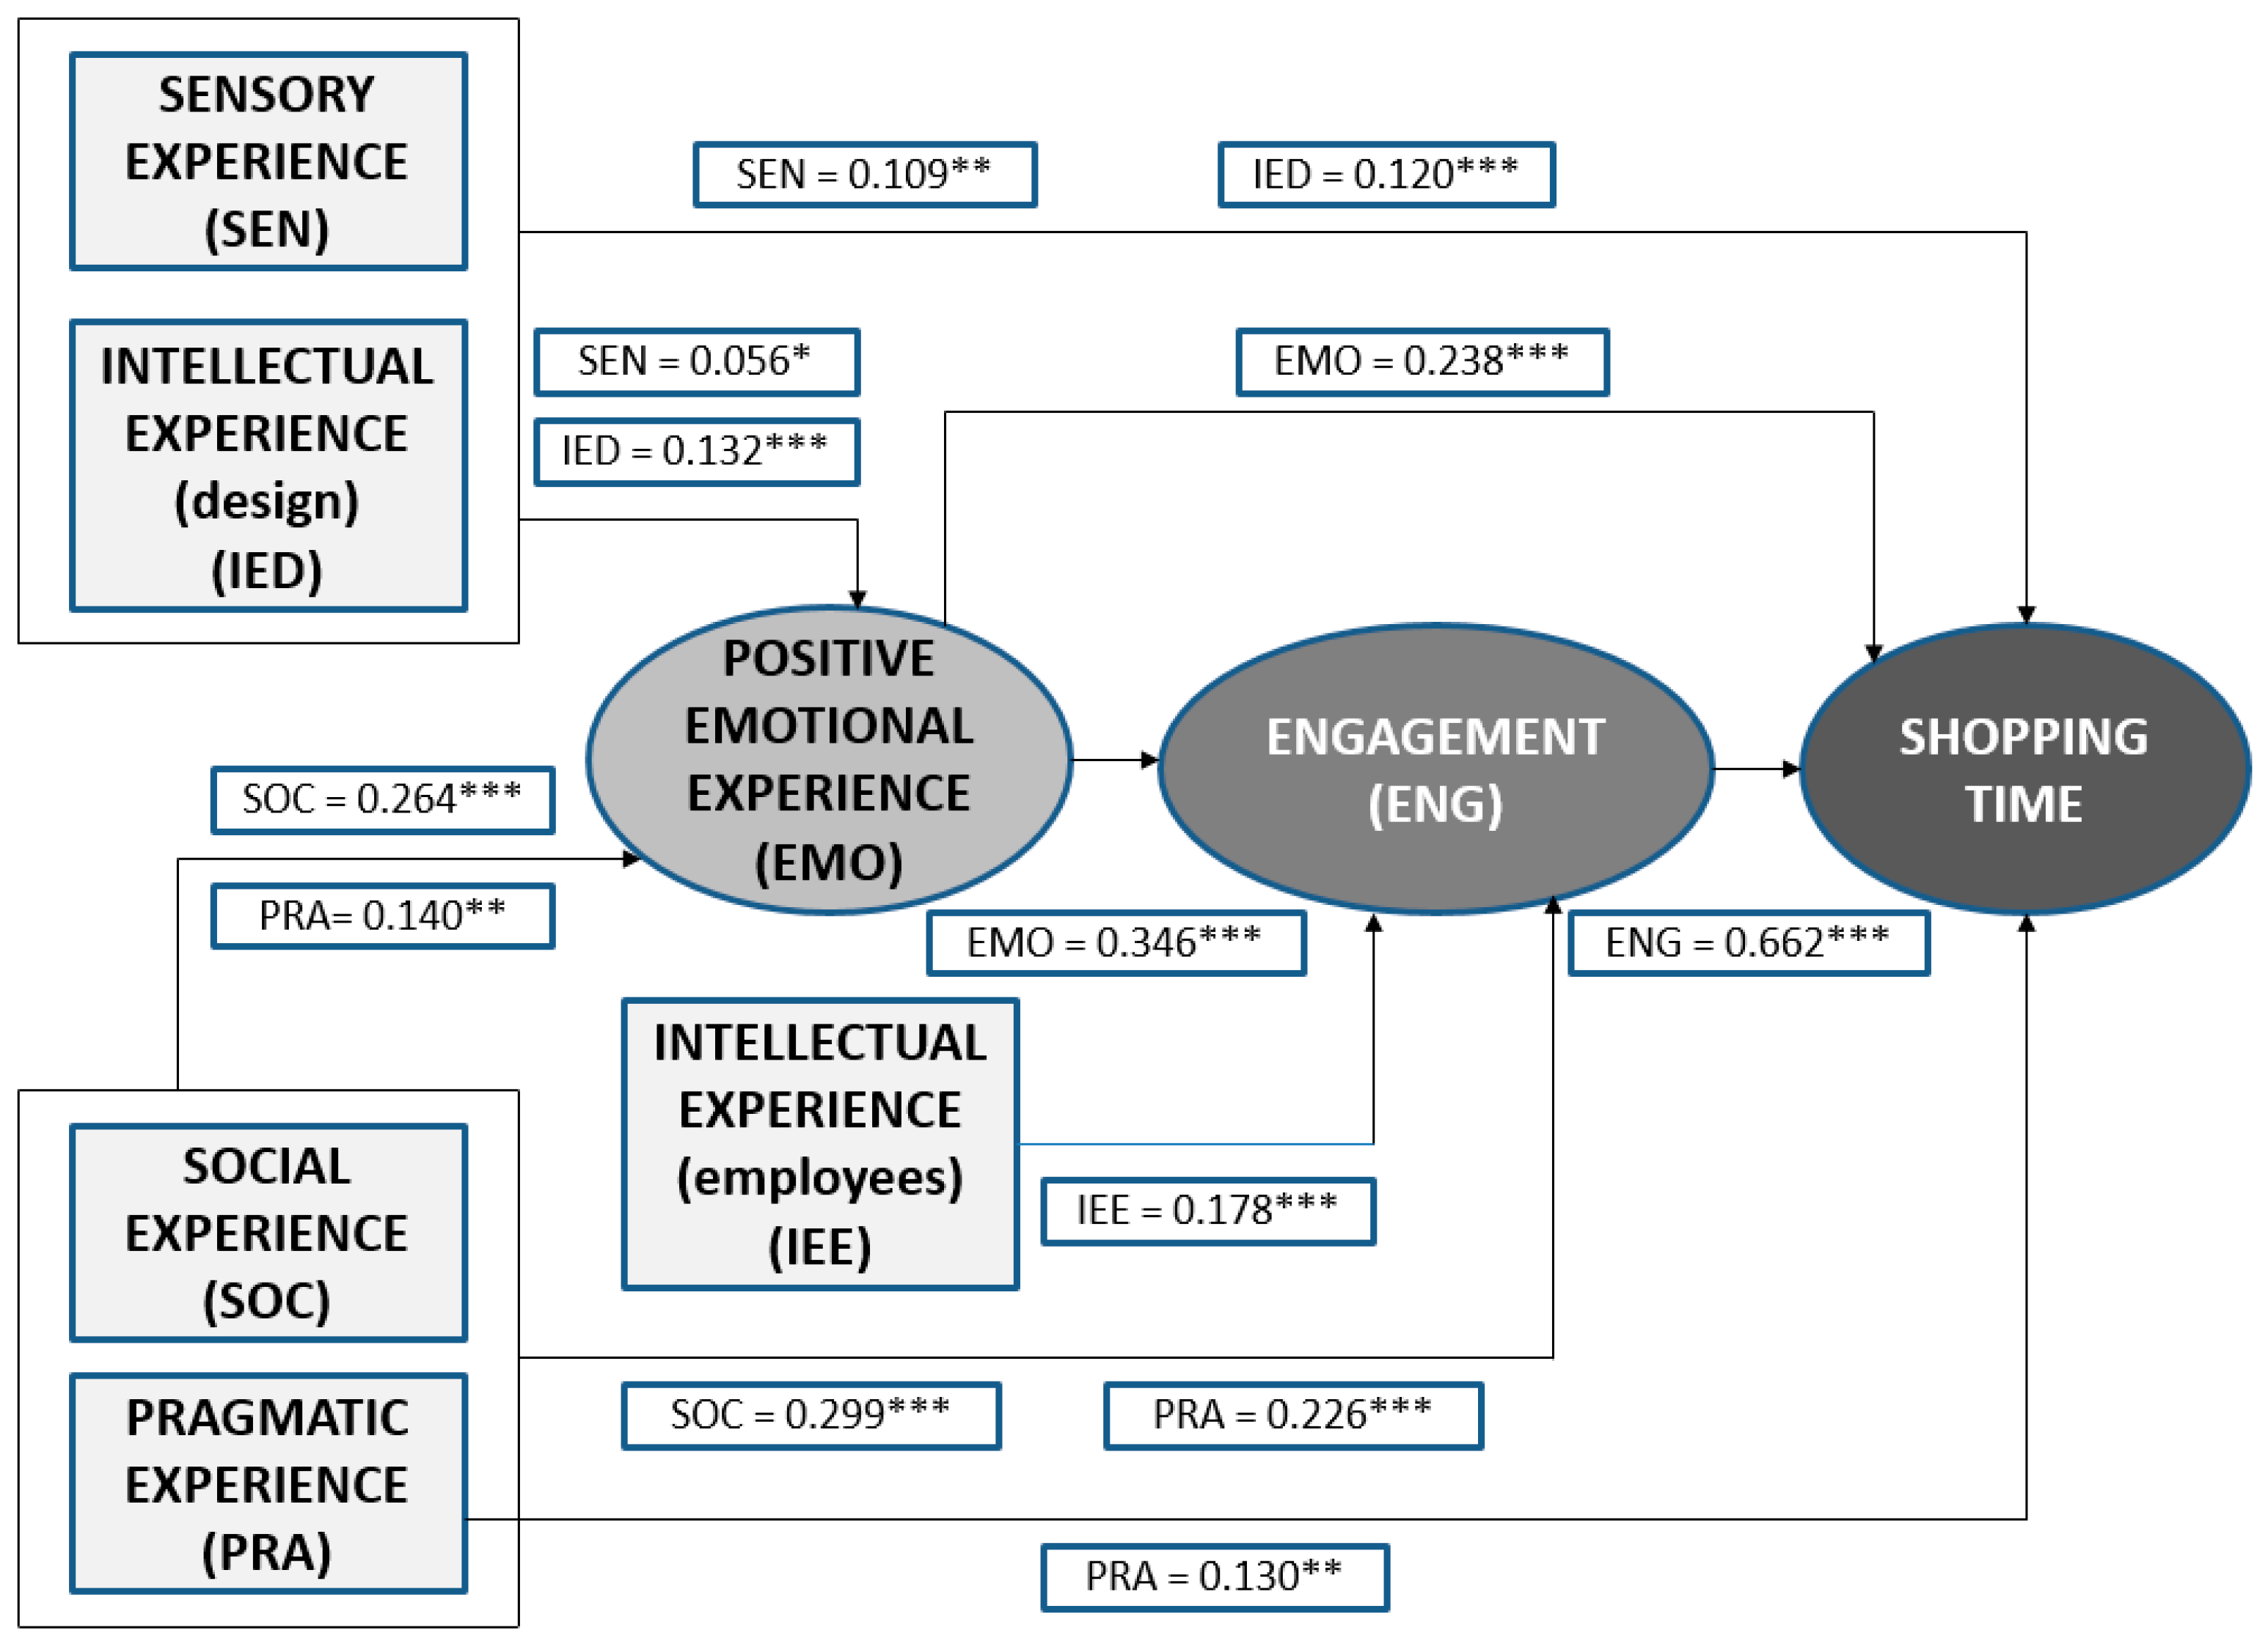
6.2. Estimation of the Structural Model

Table 5 and Figure 2 shows the results of the structural model, obtained with EQS 6.2. The goodness indices of the adjustment are adequate (BBNNFI = 0.894, IFI = 0.929, CFI = 0.929, RMSEA = 0.052). It is observed that the positive emotional experience is affected by the sensory experience (H1a: β1a = 0.056), the intellectual design (H1b: β1b = 0.132), the social experience (H1d: β1d = 0.264), and the pragmatic experience (H1e: β1e = 0.140). Regarding the engagement, the variables that directly and positively influence it are the intellectual experience with employees (H2c: β2c = 0.178), the social experience (H2d: β2d = 0.229), the pragmatic experience (H2e: β2e = 0.226), and the positive emotional experience (H4a: β4a = 0.346). Finally, the shopping time is modified directly and positively by the sensory experience (H3a: β3a = 0.109), the intellectual experience through design (H3b: β3b = 0.120), the pragmatic experience (H3e: β3e = 0.130), and the positive emotional experience (H4b: β4b = 0.238). In addition, this shopping time is also directly and positively influenced by consumer commitment (H5: β5 = 0.662).

6.3. The Mediating Effect of Positive Emotional Experience

Once the structural model has been proposed, it is considered relevant that the mediating effect of the positive emotional experience in relation to experience dimensions–engagement is analyzed. In order to assess these mediating effects, the B-K method is a good alternative (Baron and Kenny 1986; Iacobucci 2008). However, although this method has been extensively applied for years, there is some criticism towards it, and many statistics recommend that other methods are applied (Preacher and Hayes 2004, 2008; Hayes 2013). Thus, two general approaches can be adopted to analyze mediation models: the regression approach, and the structural equation model (SEM) approach. The regression approach is used when the variables are observable indicators for which it is assumed that there is no measurement error. The most popular alternative is the macro/interface Process for SPSS that uses re-sampling methods (e.g., bootstrap procedure) to calculate the variance of the indirect effect or mediation. The SEM approach is more complex, but more recommendable, and it is used when any of the variables are a non-observable or latent variable, which is assumed to be free of measurement error, and is studied by using multiple indicators of the construct. In this paper, we used the structural equations approach (SEM), since each of the dimensions of experience and engagement are latent constructs with multiples indicators. In this way, we also controlled the measurement errors.
For each of the relationships between Customer Experience (X), Emotional Experience (Y), and Engagement (Z), the SEM approach allowed us to develop three stages (Holmbeck 1997, p. 602):
In the first stage, a partial model is calculated (unrestricted model), in which the direct and indirect effects are included among all the variables X, Y, and Z. The path coefficients obtained must be significant, and the value of χ2 with respect to the degrees of freedom required must be greater than 0.05.
In the second stage, several restricted models are calculated (models of total mediation), such that the paths X → Y are restricted to zero (that is, this parameter is omitted). The coefficients paths obtained must be significant, and the value of χ2 with respect to the degrees of freedom required must be greater than 0.05.
In the third stage, a difference test χ2 is calculated. The objective is to verify the improvement of the fit of one model with respect to another alternative model. The adjustment of a model against its alternative is considered to be acceptable when the probability of the value of the test χ2 with respect to the degrees of freedom required is significant (p < 0.05). In this case, if the restricted models improve the adjustment of the unrestricted model, it can be affirmed that there is a partial mediation of the emotional experience.
Figure 2 and Table 6 summarize the mediating effects that have been significant after applying the three stages of the SEM approach. Taking these results into account, the analyses showed that positive emotional experience presents (a) an effect of total mediation between sensory experience and engagement; (b) an effect of total mediation between the intellectual experience through design and engagement; (c) an effect of partial mediation between social experience and engagement; and (c) an effect of partial mediation between pragmatic experience and engagement.
Table 7 summarizes the direct and indirect effects for each consumer experience dimension. The dimensions with the greatest influence on engagement are social experience (0.390) and positive emotional experience (0.346).

6.4. The Moderating Effect of Visit Frequency

To analyze the moderating effects of the visit frequency, a distinction was made between individuals with a high frequency of visits (those who visited the establishment weekly or several times a month) and individuals with a low frequency of visits (several times a year or less), obtaining the causal parameters for both groups, and later testing the difference between said coefficients gamma and beta in LISREL notation, using an adequate moderation test (Baron and Kenny 1986). A multisample analysis was carried out, following the two methodological stages proposed by Jaccard et al. (1996).
The first stage involves a “multi-group solution”. Using the EQS 6.2 software, parameters are estimated for each group of individuals, and a measure of the goodness of the fit of the model for both groups considered simultaneously. To study the differences between the groups it is more appropriate to perform the analysis in terms of non-standardized regression coefficients, due to the possible differences between the groups in the standard deviations of their constructs (Jaccard et al. 1996).
In the second stage, in order to check if there are significant differences between the causal parameters, the model was re-estimated by introducing (as a null hypothesis) the restriction that the coefficients in the structural model are the same in both groups (Iglesias and Vázquez 2001). In this second stage, and thanks to the Lagrange multiplier test (lmtest), it is possible to analyze if there are significant differences between the parameters of both subsamples. That is to say, the goal is to verify whether the elimination of the restrictions produces a significant change in the X2 statistic. This would lead to a rejection of the equality restriction in the parameters, since its elimination would significantly improve the adjustment of the model.
The multi-group solutions of the first stage are summarized in Table 8, and the results of the second stage in Table 9. For those consumers with a high frequency of visits (weekly or several times a month), the social, pragmatic, and positive emotional experiences have a greater influence on engagement than for those consumers with low frequency of visits (several times a year or less). If consumers are very engaged with the company, it is logical to think that they will be the ones who visit the retailer more, because of the engagement that they have with it. This makes them value more positively the experiences that are developed in the store, especially those that are related to the emotional bond.

7. Discussion

The consumer of today seeks to enjoy himself during shopping. We are faced with a consumer who is much more demanding than just a decade ago, given that the pace of life has changed; a customer who may not often even have time to make purchases. That is why the retailer, must allow the consumer to “get away from it all”, making him enjoy the escape from his daily routine, in the time dedicated to shopping. The generation of experiences at the store facilitates this task for retailers. A unique and an unrepeatable shopping process can encourage the creation of a special bond with the consumer, which leads to more loyal customers and encourages them to devote a greater part of their time to shopping. In this way retailers, can get real fans instead of just customers (Alfaro 2012). Therefore, it is relevant to identify which types of experiences involve engagement (Brun et al. 2017), in order to stimulate this type of experience.
The literature published up to now and applied to the retail sector identifies and analyzes different dimensions of the experience, but not its direct influence on consumer engagement and on their willingness to extend their shopping time. This research reveals which of these dimensions of experience have a greater impact on consumer behavior. To do this, experiences at the store have been defined as a subjective perception of a retailer’s commercial strategies. These experiences manifest themselves in a variety of dimensions that can be grouped into different categories: sensory, intellectual (through design and through employees), social, pragmatic, and emotional. Summarizing, the generation of experiences is complex, and it involves the presence of more than one dimension. The most important thing is to identify what types of experiences the consumer values, to be able to gain loyal and engaged customers.

8. Conclusions

The results of empirical research suggest that the dimensions of experience that can increase consumer engagement are the intellectual through employees, and the social, the pragmatic, and the emotional. Examples include creating spaces where customers can interact with employees, to demonstrate the uses of the product, organizing events at the store to encourage interaction between consumers with the same interests, offering quality products and efficiency in information search actions, or encouraging the generation of positive emotions in the retailer.
Thus, it is clear how important it is today to carry out experiential marketing activities, given that it influences not only the level of consumer engagement, but also the willingness to extend the shopping time. This is especially relevant nowadays. Given that the consumer has little time to make his purchases, it is essential to design a store that appeals to him, and that makes him want to spend more time in the retail store. Analyzing the predisposition to extend shopping time, it is observed that the dimensions of experience that lead to this type of predisposition are the sensory, the intellectual through design, the pragmatic, and the emotional. If the retailer seeks to increase consumer shopping time in order to achieve a possible increase in spending, this type of experience should be encouraged, to enable the customer to feel good, and for them to enjoy the act of purchasing. Examples include designing the store with sensory factors (such as an identifiable product or store smell, or type of music, according to the target customer), in a functional way for the consumer, so that they can shop for desired products without much effort, appealing to the emotions through these factors. These emotions can be stimulated through the creation of elements of sensory and intellectual experiences through design, and of social and pragmatic experiences. For example, designing stores so that consumers can interact with the products and encourage creativity and imagination when using them; encouraging consumers to come to the store to obtain information about new products or trends that reflect their lifestyle; or by making customers feel good about buying a cheaper product or a better-value-for-money product. An interesting option to improve this study would be to measure positive emotional experiences in the moment when those emotions are experienced. Nowadays, this is possible thanks to neuromarketing techniques, such as the eye tracking used in the Shopper Lab, which recreates shopping environments stimulating the development of different shopping experiences.
As a complement, we have analyzed the relationships between the dimensions of the shopping experience and consumer engagement by consumer segments, depending on the level of visit frequency to the store (high frequency or low frequency). The conclusions obtained indicate that positive emotional experience has a stronger influence on engagement in those consumers who visit the establishment more often. This may be due to the fact that the promotion of favorable affective states activates consumer engagement with the company, and the desire to return to it. Traditionally, consumer engagement has been linked to the experience of positive emotions at the store, and this study confirms this relationship, noting that it is greater for customers who visit the retailer more frequently. In addition, the social experience and the pragmatic experience also influence consumer engagement to a greater extent for these customers who visit the retail store more often. The idea that the consumer is a social being is confirmed, and that those activities of a social nature that the store can organize leads to higher levels of engagement. It is that feeling of belonging to a social group that is greater when visiting the retailer more frequently (to look for a social experience with family, friends, and other consumers with the same tastes). We must also mention the importance of offering a pragmatic experience when designing strategies to increase levels of consumer engagement, given that it is a dimension of the experience that draws the attention mainly of consumers who most frequently visit the retail store. Thus, attention should be paid to the functionality and quality of the offer, so that the consumer continues to frequently visit the store with the desire to find that kind of experience.

Managerial Implications

This study serves as support for decision-making by managers of retail companies, mainly when the consumer seeks shopping experiences. In the first place, stimulating the senses of consumers enhances their emotions in the retail store. Being able to manipulate the products offered by the retailer, and allowing users to interact with them, can be a source of emotion creation. Creating a pleasant shopping environment, e.g., in olfactory and visual terms, allows consumers to have a pleasant time. Enjoyment in the retail store with friends and family affects the sensations experienced by the consumer, since their comments can affect and alter emotions. From this perspective, the visual and design elements are very important for making a purchase attractive: augmented reality or platforms like Pinterest are some examples. In addition, the use of different screens and omnichannel technologies in physical stores helps create a visual experience that also intervenes in the shopping process.
What types of experiences are those that lead the consumer to increase their engagement with a particular retailer? The human being is a social being. For that reason, the interactions with the employees and with other consumers of the store are crucial. This is where experiences take on special relevance. It is about creating experiences that allow the consumer to interact with other customers, e.g., organizing book signings, records, sponsored concerts, lectures on new uses of certain products, or workshops/test centers and co-innovation. Knowing and developing those activities and services that will really surprise and interest the consumer can promote their engagement, willingness to extend their shopping time, and loyalty, turning the consumer into a true fan of the retailer.
The results of this research invite retailers to create emotional experiences, since these are the ones that most greatly influence consumer engagement. However, intellectual experiences through employees, and social and pragmatic experiences also affect that engagement. Currently, consumption has become a form of leisure, so that purchases are increasingly emotional, and consumers more often tend to want to enjoy the act of receiving information and/or purchasing a product. Also, this positive emotional experience also encourages the consumer to extend their shopping time, along with the creation of sensory experiences (stores that smell, allow touch, etc.) and pragmatic (oriented to the functionality of the store, the assortment and quality of the offer). Nowadays, getting the consumer to extend his shopping time is a challenge for the retailers’ strategies, and for this, it is essential to achieve the emotional engagement of the consumer. On the other hand, the retailer should know the frequency by which their customers come to the store, in order to invest their resources in designing those strategies that have more impact on consumer engagement. This is possible nowadays, for example, through geolocation from apps installed on the consumers’ smartphone. Encouragement to download the app of the retailer can be a tactic that can be developed, in order to obtain detailed factors such as the number of visits and their duration, including the route that is made within the store.
Although digital technologies have simplified the shopping process, tangible experiences are very valuable for consumers. That is why retailers must transform themselves from a simple place where the product is sold, to a more experimental, more sensory-rich space. Those retailers that do not bet on the marketing of experiences will be disadvantaged in terms of competitiveness and the possibilities of protecting themselves against falls in margins and prices. It is necessary to link customers through shopping experiences so that the price is not the most relevant factor, but rather the favor of the consumer towards the recommendation of the retailer, its products/brands/services, and above all, the achievement of consumer engagement. The retail store of the future will have to call hearts, not minds, since in a world of increasingly similar products and services, it will be the experience that makes the retailers different, and therefore, the factor that will bring them to market success.

Author Contributions

Conceptualization, S.C.-M. and R.V.-C.; Formal analysis, S.C.-M. and R.V.-C.; Investigation, S.C.-M.; Methodology, S.C.-M.; Software, S.C.-M.; Validation, S.C.-M. and R.V.-C.; Writing—original draft, S.C.-M. and R.V.-C.; Writing—review & editing, S.C.-M.

Funding

This research received no external funding.

Acknowledgments

The authors are grateful to Cátedra Fundación Ramón Areces de Distribución Comercial (www.catedrafundacionarecesdcuniovi.es) for their valuable support to develop this empirical research.

Conflicts of Interest

The authors declare no conflict of interest.

References

  1. Ackerman, Joshua M., Christopher C. Nocera, and John A. Bargh. 2010. Incidental haptic sensations influence social judgments and decisions. Science 328: 1712–15. [Google Scholar] [CrossRef] [PubMed]
  2. Adam, Marc T., Jan Krämer, and Marius B. Müller. 2015. Auction fever! How time pressure and social competition affect bidders’ arousal and bids in retail auctions. Journal of Retailing 91: 468–85. [Google Scholar] [CrossRef]
  3. Ajzen, Icek, and Martin Fishbein. 1980. Understanding Attitudes and Predicting Social Behaviour. Upper Saddle River: Prentice-Hall. [Google Scholar]
  4. Alba, Joseph W., and Elanor F. Williams. 2013. Pleasure principles: A review of research on hedonic consumption. Journal of Consumer Psychology 23: 2–18. [Google Scholar] [CrossRef]
  5. Alfaro, Elena. 2012. El ABC Del Shopping Experience. Cómo Generar Experiencias Para Vender MÁS. Madrid: Wolters Kluwer España. [Google Scholar]
  6. Andreu, Luisa, Enrique Bigné, Ruben Chumpitaz, and Valérie Swaen. 2006. How does the perceived retail environment influence consumers’ emotional experience? Evidence from two retail settings. The International Review of Retail, Distribution and Consumer Research 16: 559–78. [Google Scholar] [CrossRef]
  7. Arnold, Mark J., and Kristy E. Reynolds. 2003. Hedonic shopping motivations. Journal of Retailing 79: 77–95. [Google Scholar] [CrossRef]
  8. Bagozzi, Richard P., Mahesh Gopinath, and Prashanth U. Nyer. 1999. The role of emotions in marketing. Journal of the Academy of Marketing Science 27: 184–206. [Google Scholar] [CrossRef]
  9. Baron, Reuben M., and David A. Kenny. 1986. The moderator-mediator variable distinction in social psychological research: Conceptual, strategic, and statistical considerations. Journal of Personality and Social Psychology 51: 1173–82. [Google Scholar] [CrossRef] [PubMed]
  10. Beatty, Sharon E., Kristy E. Reynolds, Stephanie M. Noble, and Mary P. Harrison. 2012. Understanding the relationships between commitment and voice: Hypotheses, empirical evidence, and directions for future research. Journal of Service Research 15: 296–315. [Google Scholar] [CrossRef]
  11. Borges, Adilson, Jean-Charles Chebat, and Barry J. Babin. 2010. Does a companion always enhance the shopping experience? Journal of Retailing and Consumer Services 17: 294–99. [Google Scholar] [CrossRef]
  12. Bowden, Jana L. 2009. The process of customer engagement: A conceptual framework. Journal of Marketing Theory & Practice 17: 63–74. [Google Scholar]
  13. Brakus, J. Joško, Bernd H. Schmitt, and Lia Zarantonello. 2009. Brand experience: What is it? How is it measured? Does it affect loyalty? Journal of Marketing 73: 52–68. [Google Scholar] [CrossRef]
  14. Brodie, Roderick, Linda Hollebeek, Biljana Juric, and Ana Ilić. 2011. Customer engagement: Conceptual domain, fundamental propositions, and implications for research. Journal of Service Research 14: 252–71. [Google Scholar] [CrossRef]
  15. Brun, Isabelle, Lova Rajaobelina, Line Ricard, and Bilitis Berthiaume. 2017. Impact of customer experience on loyalty: A multichannel examination. The Service Industries Journal 37: 317–40. [Google Scholar] [CrossRef]
  16. Cachero, Silvia, and Rodolfo Vázquez. 2017. Living positive experiences in store: How it influences shopping experience value and satisfaction? Journal of Business Economics and Management 18: 537–53. [Google Scholar] [CrossRef]
  17. Carmigniani, Julie, and Borko Furht. 2011. Augmented reality: An overview. In Handbook of Augmented Reality. Edited by Borko Furht. New York: Springer, pp. 3–46. [Google Scholar]
  18. Chang, Hyo-Jung, Molly Eckman, and Ruoh-Nan Y. Yan. 2011. Application of the Stimulus-Organism-Response model to the retail environment: The role of hedonic motivation in impulse buying behavior. The International Review of Retail, Distribution and Consumer Research 21: 233–49. [Google Scholar] [CrossRef]
  19. Claffey, Ethel, and Mairead Brady. 2014. A model of consumer engagement in a virtual customer environment. Journal of Customer Behaviour 13: 325–46. [Google Scholar] [CrossRef]
  20. Curth, Susane, Sebastian Uhrich, and Martin Benkenstein. 2014. How commitment to fellow customers affects the customer-firm relationship and customer citizenship behavior. Journal of Services Marketing 28: 147–58. [Google Scholar] [CrossRef]
  21. De Ruyter, Ko, Luci Moorman, and Jos Lemmink. 2001. Antecedents of commitment and trust in customer–supplier relationships in high technology markets. Industrial Marketing Management 30: 271–86. [Google Scholar] [CrossRef]
  22. Deloitte. 2016. Digital and Asociación DEC. I Estudio Nacional Sobre el Nivel de “Operativización” de la Experiencia de Cliente. Available online: https://www2.deloitte.com/es/es/pages/operations/articles/OCX-estudio-operativizacion-experiencia-cliente.html (accessed on 12 May 2018).
  23. Evanschitzky, Heiner, Gopalkrishnan R. Iyer, Hilke Plassmann, Joerg Niessing, and Heribert Meffert. 2006. The relative strength of affective commitment in securing loyalty in service relationships. Journal of Business Research 59: 1207–13. [Google Scholar] [CrossRef]
  24. Ferguson, Ronald J., Michéle Paulin, and Jasmin Bergeron. 2010. Customer sociability and the total service experience: Antecedents of positive word-of-mouth intentions. Journal of Service Management 21: 25–44. [Google Scholar] [CrossRef]
  25. Foroudi, Pantea, Zhongeqi Jin, Suraksha Gupta, TC Melewar, and Mohammad M. Foroudi. 2016. Influence of innovation capability and customer experience on reputation and loyalty. Journal of Business Research 69: 4882–89. [Google Scholar] [CrossRef]
  26. Gallace, Alberto, and Charles Spence. 2014. In Touch with the Future: The Sense of Touch from Cognitive Neuroscience to Virtual Reality. Oxford: Oxford University Press. [Google Scholar]
  27. Gentile, Chiara, Nicola Spiller, and Giuliano Noci. 2007. How to sustain the customer experience: An overview of experience components that co-create value with the customer. European Management Journal 25: 395–410. [Google Scholar] [CrossRef]
  28. George, Miriam. 2015. Haptics: The new wave of tactics for customer experience. International Journal of Information & Futuristic Research 2: 2606–11. [Google Scholar]
  29. Geyskens, Inge, Jan B. E. Steenkamp, Lisa K. Scheer, and Nirmalya Kumar. 1996. The effects of trust and interdependence on relationship commitment: A trans-Atlantic study. International Journal of Research in Marketing 13: 303–17. [Google Scholar] [CrossRef]
  30. Gill, Michael J., William B. Swann Jr., and David H. Silvera. 1998. On the genesis of confidence. Journal of Personality and Social Psychology 75: 1101. [Google Scholar] [CrossRef]
  31. Gilliand, David I., and Daniel C. Bello. 2002. Two sides to attitudinal commitment: The effect of calculative and loyalty commitment on enforcement mechanisms in distribution channels. Journal of the Academy of Marketing Science 30: 24–43. [Google Scholar] [CrossRef]
  32. Grewal, Dhruv, Michael Levy, and Vijay Kumar. 2009. Customer experience management in retailing: An organizing framework. Journal of Retailing 85: 1–14. [Google Scholar] [CrossRef]
  33. Grewal, Dhruv, Anne L. Roggeveen, and Jens Nordfält. 2017. The future of retailing. Journal of Retailing 93: 1–6. [Google Scholar] [CrossRef]
  34. Hair, Joseph F., William C. Black, Barry J. Babin, Rolph E. Anderson, and Ronald L. Tatham. 2010. Multivariate Data Analysis: A Global Perspective, 7th ed. Upper Saddle River: Pearson Prentice Hall. [Google Scholar]
  35. Hayes, Andrew F. 2013. Introduction to Mediation, Moderation and Conditional Process Analysis. A Regression Based Approach. New York: The Guilford Press. [Google Scholar]
  36. Helkkula, Anu. 2011. Characterising the concept of service experience. Journal of Service Management 22: 367–89. [Google Scholar] [CrossRef]
  37. Hill, Krista, Paul W. Fombelle, and Nancy J. Sirianni. 2016. Shopping under the influence of curiosity: How retailers use mystery to drive purchase motivation. Journal of Business Research 69: 1028–34. [Google Scholar] [CrossRef]
  38. Holbrook, Morris B., and Elizabeth C. Hirschman. 1982. The experiential aspects of consumption: Consumer fantasies, feelings, and fun. Journal of Consumer Research 9: 132–40. [Google Scholar] [CrossRef]
  39. Hollebeek, Linda. 2011. Demystifying customer brand engagement: Exploring the loyality nexus. Journal of Marketing Management 27: 785–807. [Google Scholar] [CrossRef]
  40. Holmbeck, Grayson N. 1997. Toward terminological, conceptual and statistical clarity in the study of mediadors and moderators: Examples from the child-clinical and pediatric psychology literatures. Journal of Consulting and Clinical Psycholog 65: 599–610. [Google Scholar] [CrossRef]
  41. Homburg, Christian, Danijel Jozic, and Christina Kuehnl. 2017. Customer experience management: Toward implementing and evolving marketing concept. Journal of the Academy of Marketing Science 45: 377–401. [Google Scholar] [CrossRef]
  42. Hsu, Chieng-Lu, Chia-Chang Liu, and Yuan-Duen Lee. 2010. Effect of commitment and trust towards micro-blogs on consumer behavioral intention: A relationship marketing perspective. International Journal of Electronic Business Management 8: 292–303. [Google Scholar]
  43. Iacobucci, Dawn. 2008. Mediation Analysis. London: Sage. [Google Scholar]
  44. IBM. 2012. Retail 2020: Reinventando la Distribución Minorista (UNA VEZ MÁS). Available online: https://www-05.ibm.com/services/es/bcs/pdf/REW03013-ESES-01_HR.pdf (accessed on 6 November 2017).
  45. Iglesias, Víctor, and Rodolfo Vázquez. 2001. The moderating effects of exclusive dealing agreements on distributor satisfaction. Journal of Strategic Marketing 9: 215–31. [Google Scholar] [CrossRef]
  46. Iglesias, Oriol, Jatinder J. Singh, and Joan M. Batista-Foguet. 2011. The role of brand experience and affective commitment in determining brand loyalty. Journal of Brand Management 18: 570–82. [Google Scholar] [CrossRef]
  47. Jaccard, James, Choi K. Wan, and Jim Jaccard. 1996. Lisrel Approaches to Interaction Effects in Multiple Regression. Thousand Oaks: Sage. [Google Scholar]
  48. Javornik, Ana. 2016. Augmented reality: Research agenda for studying the impact of its media characteristics on consumer behaviour. Journal of Retailing and Consumer Services 30: 252–61. [Google Scholar] [CrossRef]
  49. Johnson, Mark S., Eugene Sivadas, and Ellen Garbarino. 2008. Customer satisfaction, perceived risk and affective commitment: An investigation of directions of influence. Journal of Services Marketing 22: 353–62. [Google Scholar] [CrossRef]
  50. Kahn, Barbara E. 2017. Using visual design to improve customer perceptions of online assortments. Journal of Retailing 93: 29–42. [Google Scholar] [CrossRef]
  51. Kaltcheva, Velitchka D., and Barton A. Weitz. 2006. When should a retailer create an exciting store environment? Journal of Marketing 70: 107–18. [Google Scholar] [CrossRef]
  52. Kim, Sooyun, Geebum Park, Yeonjoo Lee, and Sunmee Choi. 2016. Customer emotions and their triggers in luxury retail: Understanding the effects of customer emotions before and after entering a luxury shop. Journal of Business Research 69: 5809–18. [Google Scholar] [CrossRef]
  53. Krishna, Aradhna. 2006. Interaction of senses: The effect of vision versus touch on the elongation bias. Journal of Consumer Research 32: 557–66. [Google Scholar] [CrossRef]
  54. Krishna, Aradhna. 2013. Customer Sense: How the 5 Senses Influence Buying Behavior. New York: Palgrave Macmillan. [Google Scholar]
  55. Krishna, Aradhna, and Maureen Morrin. 2008. Does touch affect taste? The perceptual transfer of product container haptic cues. Journal of Consumer Research 34: 807–18. [Google Scholar] [CrossRef]
  56. Krishna, Aradhna, Ryan Elder, and Cindy Caldara. 2010. Feminine to smell but masculine to touch? Multisensory congruence and its effect on the aesthetic experience. Journal of Consumer Psychology 20: 410–18. [Google Scholar] [CrossRef]
  57. Ladhari, Riadh, Nizar Souiden, and Beatrice Dufour. 2017. The role of emotions in utilitarian service settings: The effects of emotional satisfaction on product perception and behavioral intentions. Journal of Retailing and Consumer Services 34: 10–18. [Google Scholar] [CrossRef]
  58. Lawton, Stuart. 2016. Exploring the meal experience: Customer perceptions of dark-dining. In Food Science, Production, and Engineering in Contemporary Economies. IGI Global: Hershey, pp. 225–44. [Google Scholar]
  59. Li, Jiunn-Ger T., Jai-Ok Kim, and So Young Lee. 2009. An empirical examination of perceived retail crowding, emotions, and retail outcomes. The Service Industries Journal 29: 635–52. [Google Scholar] [CrossRef]
  60. Mangleburg, Tamara F., Patricia M. Doney, and Terry Bristol. 2004. Shopping with friends and teens’ susceptibility to peer influence. Journal of Retailing 80: 101–16. [Google Scholar] [CrossRef]
  61. Menon, Satya, and Dilip Soman. 2002. Managing the power of curiosity for effective web advertising strategies. Journal of Advertising 31: 1–14. [Google Scholar] [CrossRef]
  62. Mishra, Prashant, Madhupa Bakshi, and Ramendra Singh. 2016. Impact of consumption emotions on WOM in movie consumption: Empirical evidence from emerging markets. Australasian Marketing Journal 24: 59–67. [Google Scholar] [CrossRef]
  63. Mollen, Anne, and Hugh Wilson. 2010. Engagement, telepresence and interactivity in online consumer experience: Reconciling scholastic and managerial perspectives. Journal of Business Research 63: 919–25. [Google Scholar] [CrossRef] [Green Version]
  64. Moreira, António C., Nuno Fortes, and Ramiro Santiago. 2017. Influence of sensory stimuli on brand experience, brand equity and purchase intention. Journal of Business Economics and Management 18: 68–83. [Google Scholar] [CrossRef]
  65. Nasermoadeli, Amir, Kwek C. Ling, and Farshad Maghnati. 2013. Evaluating the impacts of customer experience on purchase intention. International Journal of Business and Management 8: 128–38. [Google Scholar] [CrossRef]
  66. Orth, Ulrich R., and Jochen Wirtz. 2014. Consumer processing of interior service environments: The interplay among visual complexity, processing fluency, and attractiveness. Journal of Service Research 17: 296–309. [Google Scholar] [CrossRef]
  67. Penz, Elfriede, and Margaret Hogg. 2011. The role of mixed emotions in consumer behavior: Investigating ambivalence in consumers’ experiences of approach-avoidance conflicts in online and offline settings. European Journal of Marketing 45: 104–32. [Google Scholar] [CrossRef]
  68. Pérez, Andrea, and Ignacio R. Del Bosque. 2015. An integrative framework to understand how CSR affects customer loyalty through identification, emotions and satisfaction. Journal of Business Ethics 129: 571–84. [Google Scholar] [CrossRef]
  69. Pine, B. Joseph, Joseph Pine, and James H. Gilmore. 1999. The Experience Economy: Work Is Theatre & Every Business a Stage. Brighton: Harvard Business Press. [Google Scholar]
  70. Preacher, Kristopher J., and Andrew F. Hayes. 2004. SPSS and SAS procedures for estimating indirect effects in simple mediation models. Behavior Research Methods, Instruments & Computers 36: 717–31. [Google Scholar]
  71. Preacher, Kristopher J., and Andrew F. Hayes. 2008. Asymptotic and resampling strategies for assessing and comparing indirect effects in multiple mediator models. Behavior Research Methods 40: 879–91. [Google Scholar] [CrossRef] [PubMed]
  72. Quartier, Katelijn, Jan Vanrie, and Koenraad Van Cleempoel. 2014. The Mediating Role of Consumers’ Perception of Atmosphere on Emotions and Behavior. A Study to Analyze the Impact of Lighting in Food Retailing. Available online: www.academia.edu/download/13148766/final2_1.pdf (accessed on 15 May 2017).
  73. Roy, Abhik. 1994. Correlates of mall visit frequency. Journal of Retailing 70: 139–61. [Google Scholar] [CrossRef]
  74. Sachdeva, Ishita, and Sushma Goel. 2015. Role of store atmospherics on customer experience. International Journal of Multidisciplinary Approach & Studies 2: 72–83. [Google Scholar]
  75. Schmitt, Bernd. 1999. Experiential marketing. Journal of Marketing Management 15: 53–67. [Google Scholar] [CrossRef]
  76. Schmitt, Bernd H. 2003. Customer Experience Management: A Revolutionary Approach to Connecting with Your Customers. Hoboken: John Wiley & Sons. [Google Scholar]
  77. Scholz, Joachim, and Andrew N. Smith. 2016. Augmented reality: Designing immersive experiences that maximize consumer engagement. Business Horizons 59: 149–61. [Google Scholar] [CrossRef]
  78. Smith, Shaun, and Joe Wheeler. 2002. Managing the Customer Experience: Turning Customers into Advocates. London: Pearson Education. [Google Scholar]
  79. Spence, Charles. 2012. Managing sensory expectations concerning products and brands: Capitalizing on the potential of sound and shape symbolism. Journal of Consumer Psychology 22: 37–54. [Google Scholar] [CrossRef]
  80. Spence, Charles, and Alberto Gallace. 2011. Multisensory design: Reaching out to touch the consumer. Psychology & Marketing 28: 267–308. [Google Scholar]
  81. Spence, Charles, Nancy M. Puccinelli, Dhruv Grewal, and Anne L. Roggeveen. 2014. Store atmospherics: A multisensory perspective. Psychology & Marketing 31: 472–88. [Google Scholar]
  82. Spinelli, Sara, Camila Masi, Gian Paolo Zoboli, John Prescott, and Erminio Monteleone. 2015. Emotional responses to branded and unbranded foods. Food Quality and Preference 42: 1–11. [Google Scholar] [CrossRef]
  83. Srivastava, Mala, and Dimple Kaul. 2014. Social interaction, convenience and customer satisfaction: The mediating effect of customer experience. Journal of Retailing and Consumer Services 21: 1028–37. [Google Scholar] [CrossRef]
  84. Swinyard, William R. 1998. Shopping mall customer values: The national mall shopper and the list of values. Journal of Retailing and Consumer Services 5: 167–72. [Google Scholar] [CrossRef]
  85. Tantanatewin, Warakul, and Vorapat Inkarojrit. 2016. Effects of color and lighting on retail impression and identity. Journal of Environmental Psychology 46: 197–205. [Google Scholar] [CrossRef]
  86. Tauber, Edward M. 1972. Why do people shop? Journal of Marketing 36: 46–49. [Google Scholar] [CrossRef]
  87. Tsaur, Sheng-Hshiung, Yi-Ti Chiu, and Chih-Hung Wang. 2007. The visitors behavioral consequences of experiential marketing: An empirical study on Taipei Zoo. Journal of Travel & Tourism Marketing 21: 47–64. [Google Scholar]
  88. Tsiotsou, Rodoula. 2006. Using visit frequency to segment ski resorts customers. Journal of Vacation Marketing 12: 15–26. [Google Scholar] [CrossRef]
  89. Verhoef, Peter C., Katherine N. Lemon, Ananthanarayanan Parasuraman, Anne Roggeveen, Michael Tsiros, and Leonard A. Schlesinger. 2009. Customer experience creation: Determinants, dynamics and management strategies. Journal of Retailing 85: 31–41. [Google Scholar] [CrossRef]
  90. Vieira, Valter A., and Claudio V. Torres. 2014. The effect of motivational orientation over arousal-shopping response relationship. Journal of Retailing and Consumer Services 21: 158–67. [Google Scholar] [CrossRef]
  91. Vivek, Shiri D., Sharon E. Beatty, Vivek Dalela, and Robert M. Morgan. 2014. A generalized multidimensional scale for measuring customer engagement. Journal of Marketing Theory and Practice 22: 401–20. [Google Scholar] [CrossRef]
  92. Walsh, Gianfranco, Edward Shiu, Louise M. Hassan, Nina Michaelidou, and Sharon E. Beatty. 2011. Emotions, store-environmental cues, store-choice criteria, and marketing outcomes. Journal of Business Research 64: 737–44. [Google Scholar]
  93. Wedel, Michel, and Rik Pieters. 2015. The buffer effect: The role of color when advertising exposures are brief and blurred. Marketing Science 34: 134–43. [Google Scholar] [CrossRef]
  94. Wiener, Hillary J., and Tanya L. Chartrand. 2014. The effect of voice quality on ad efficacy. Psychology & Marketing 31: 509–17. [Google Scholar]
  95. Zaltman, Gerald, and Nancy Puccinelli. 2000. Strategic Use of Music in Marketing: A Selective Review [Case Study]. Boston: Harvard Business School Publishing. [Google Scholar]
  96. Zielke, Stephan. 2011. How store lightning influences store atmosphere, price and quality perceptions and shopping intention. Paper present at the European Marketing Academy Conference, Ljubljana, Slovenia, May 24–27. [Google Scholar]
Figure 1. Conceptual model exploring customer experience, engagement, and shopping time.
Admsci 08 00077 g001
Figure 2. Significant relationships between all of the variables studied. * p < 0.05; ** p < 0.01; *** p < 0.01.
Admsci 08 00077 g002
Table 1. Relevant studies related to sensory experience.
SenseAuthorDescriptions
VisualSachdeva and Goel (2015); Orth and Wirtz (2014); Kahn (2017); Wedel and Pieters (2015); Zielke (2011); Tantanatewin and Inkarojrit (2016)This type of experience focuses on colors, shapes, distance, article size, lighting, or digital merchandising. It is the most direct way to provide information to consumers, either offline, online, or through advertising exhibitions, attracting them to the shop and trying to get the consumer to remember and “record” in their mind. Designing a good visual experience is decisive for a retailer, given that 90% of the information received by the brain is visual. The most studied factor is the impact of color as a trigger in the decision to shop and choose a brand.
ScentSpence et al. (2014); Krishna (2013)The stimulation of smell is a marketing tool of great potential, since it allows the retailer to generate affective states, promote a product, positioning a brand, or to assign “exclusive aromas” to a retailer and to differentiate it from the competition. In addition, it is also used to stimulate impulse-buying at store. For the scent experience to produce greater positive effects, there needs to be congruence between the smell, the desired environment for a retailer, the product offered, and/or the profile of the target buyer.
AuditoryZaltman and Puccinelli (2000); Wiener and Chartrand (2014)The sense of hearing is constantly active, making it an interesting point of attention for retailers who wish to apply sensory marketing to their store. It is not just about experiencing the sound, but trying to create, through music and the voice, a link with the consumer, facilitating the representation of the brand in the consumers’ minds, and creating associations that activate emotions and experiences. The review of the literature places special emphasis on the use of music as a tool to create the store image in the consumer’s mind, as well as the identity of the brand. In addition, it can help to change the mood and to create sensations that help customers to extend their shopping time.
TasteLawton (2016); Krishna (2013)The sense of taste has been studied in the field of food and beverage products. The responses to different flavors are programmed genetically, instead of being learned or linked to experience, but they are highly influenced by the rest of the senses, so that taste can be considered as a mix of the rest of the senses, since these can affect the perception of the consumer’s taste. This raises many possibilities of action to retailers that offer food and drink products, since they can link their products with certain scents to modify the behavior of consumers.
TactileGeorge (2015); Gallace and Spence (2014); Ackerman et al. (2010)Touching a product is fundamental when generating consumer information, given that the integration of these tactile perceptions in their behavior facilitates the purchase decision. Being able to touch the products and to experiment with them, intentionally or not, makes the customer–product relationship much closer, thus favoring the possibility of purchase. Although we have tactile sensors in all parts of our body, marketing research has focused on the hands as a primary source of the perceptual system: they are the “outer brain” of a person.
MultisensoryKrishna et al. (2010); Spence and Gallace (2011); Spence et al. (2014); Krishna (2006); Krishna and Morrin (2008); Spence (2012)The review of the literature recognizes and identifies different sensory modalities, since consumers rarely process information using only one sense. There are, therefore, multisensory interactions, whose responses are more positive than if only one of the senses was used. Thus, the study of these interactions is of great interest, since they can facilitate consumer perceptions, attitudes, and preferences.
Table 2. Research data.
Survey typeStructured questionnaire
UniverseCustomers of offline stores that have recently made a purchase in the sectors selected for the study
Geographical scopeSpain
Sampling procedureBy sex and age
Sampling size527 valid surveys
Sampling error±4.27%
Desire level of confidence95%; p = q = 0.5
Table 3. Analysis of the reliability and validity of the proposed model.
Factorsλ Stand.CRAVEα Cronbach
Positive Emotional Experience0.9460.7460.945
Happy0.878
Excited0.877
Entertaining0.828
Animated0.880
Enthusiastic0.904
Surprised (favorably)0.811
Sensory Experience0.8940.5870.891
Temperature is suitable, activating the shopping experience0.684
Cleanliness and good condition, stimulating the shopping experience0.816
Lighting is motivating, making the shopping experience pleasant0.849
Color of the walls and floor provide a shopping experience in a pleasant environment0.853
Music (tempo, volume, and type) provides a very pleasant shopping experience0.692
Smells provides a very pleasant shopping experience0.680
Intellectual Experience (Design)0.9040.5740.903
Design (furniture, decoration and equipment) stimulates consumer curiosity0.784
Section design stimulates the shopping experience and interactions with the product0.761
Communication materials (display) stimulate imagination and consumer creativity 0.761
Store layout stimulates curiosity0.828
Shop-window offers an attractive presentation (artistic, creative)0.719
Store has a pleasant entry (spacious and inviting)0.727
Outside of the store design invites you to enter0.717
Intellectual Experience (Employees)0.8680.6280.869
Employees are always willing to help (provide information, support decision-making) and answer all customer questions0.882
Employees have great knowledge of what they sell and the experiences that the products provide0.902
There are enough employees to offer personalized services and to explain the experiences provided by the use of products0.749
Payment for the items purchased is fast, avoiding negative experiences0.600
Social Experience0.8080.5870.797
Shopping at this store gives me the opportunity to experience the feeling of status (interactions with other customers)0.760
Shopping at this store allows me to obtain information and experiences on trends that are consistent with my lifestyle0.862
Going to this store allows me to spend a pleasant time with my family/friends0.663
Pragmatic Experience0.7430.4920.866
Price0.764
Product0.684
Promotion0.651
Engagement0.9320.8220.931
I am very proud to be a customer of this store0.899
I feel like I identify with the values and objectives of this company0.920
I am loyal to this company because I like the relationship that I have with it0.900
Extended Shopping Time0.8390.6350.837
Spending more time searching for information in this store is a good idea0.768
If I had more time I would extend my stay in the store0.791
The time I’ve spent in this store has been worth it0.830
Overall fit of the structural model: S-BX2(532) = 1513.6040, p < 0.001. BBNFI = 0.860, BBNNFI = 0.893, CFI = 0.904, IFI = 0.905, RMSEA = 0.051, SRMR = 0.050. AVE = Average Variance Extracted; CR = Composite Reliability; BBNFI = Bentler-Bonett Normed Fit Index; BBNNFI = Bentler-Bonnet Non-Normed Fit Index; CFI = Confirmatory Fit Index; IFI = Incremental Fit Index; RMSEA = Root Mean Square Error of Approximation; SRMR = Standardized Root Mean Square Residual.
Table 4. Discriminant validity analysis of the proposed model.
12345678
1. Positive emotional experience0.746 ᴬ
2. Sensory experience0.047 ᴮ0.587
3. Intellectual (design) experience0.0900.4480.574
4. Intellectual (employees) experience0.0520.1210.1600.628
5. Social experience0.1500.3150.4800.3360.587
6. Pragmatic experience0.1090.2600.3200.3290.3570.492
7. Engagement0.2590.0720.1230.2020.3160.2770.822
8. Extended shopping time0.3860.0590.1490.1450.3000.3040.4250.635
A: The data in the table that appears in bold and on the diagonal is the AVE of each concept. B: The data below the diagonal of the table correspond to the squared correlations between pairs of constructs.
Table 5. Results of the structural equation model analyses.
Structural RelationshipsStandardized Coef.t-Value
H1a: Sensory experience → Positive emotional experience0.0561.948 *
H1b: Intellectual experience (design) → Positive emotional experience0.1323.045 ***
H1c: Intellectual experience (employees) → Positive emotional experiencensns
H1d: Social experience → Positive emotional experience0.2645.398 ***
H1e: Pragmatic experience → Positive emotional experience0.1402.764 **
H2a: Sensory experience → Engagementnsns
H2b: Intellectual experience (design) → Engagementnsns
H2c: Intellectual experience (employees) → Engagement0.1784.510 ***
H2d: Social experience → Engagement0.2996.671 ***
H2e: Pragmatic experience → Engagement0.2264.515 ***
H3a: Sensory experience → Shopping time0.1093.053 **
H3b: Intellectual experience (design) → Shopping time0.1203.536 ***
H3c: Intellectual experience (employees) → Shopping timensns
H3d: Social experience → Shopping timensns
H3e: Pragmatic experience → Shopping time0.1303.154 **
H4a: Positive emotional experience → Engagement0.3466.932 ***
H4b: Positive emotional experience → Shopping time0.2385.518 ***
H5: Engagement → Shopping time0.66211.571 ***
* p < 0.05; ** p < 0.01; *** p < 0.01; ns: not significant.
Table 6. Analysis of the mediating effect of positive emotional experience in the relationship between experiences–engagement.
Relationship between FactorsSignificant EffectMediation of Positive Emotional Experience
Sensory experience → EngagementOnly indirect
(through positive emotions)
Total
Intellectual experience (design) → EngagementOnly indirect
(through positive emotions)
Total
Intellectual experience (employees) → EngagementYES (only direct)No
Social experience → EngagementYES (direct)
YES (indirect)
(through positive emotions)
Partial
Pragmatic experience → EngagementYES (direct)
YES (indirect)
(through positive emotions)
Partial
Table 7. Direct and indirect effects of type of experience on engagement.
Type of ExperienceEffect of Each Type of Experience on Engagement
DirectIndirectTotals
SensoryNOSensory → Positive emotional experience
Positive emotional experience → Engagement
(0.056)(0.346) = 0.019
0.019
Intellectual (design)NOIntellectual (design) → Positive emotional experience
Positive emotional experience → Engagement
(0.132)(0.346) = 0.046
0.046
Intellectual (employees)0.178NO0.178
Social0.299Social → Positive emotional experience
Positive emotional experience → Engagement
(0.264)(0.346) = 0.091
0.390
Emotional0.346NO0.346
Pragmatic0.226Pragmatic → Positive emotional experience
Positive emotional experience → Engagement
(0.140)(0.346) = 0.048
0.274
Table 8. Multi-group analysis: shoppers with high versus low visit frequencies.
Causal RelationshipsHigh Visit Frequency (N = 206)Low Visit Frequency (N = 321)
β (t-Student)β (t-Student)
Sensory experience → EngagementNSNS
Intellectual experience (design) → EngagementNSNS
Intellectual experience (employees) → Engagement0.210 (3.571)0.175 (3.159)
Social experience → Engagement0.377 (5.190)0.254 (4.533)
Pragmatic experience → Engagement0.284 (3.458)0.166 (2.746)
Positive emotional experience → Engagement0.353 (4.213)0.302 (5.322)
Fit of GoodnessBBNNFI = 0.873; CFI = 0.892; RMSEA = 0.053
NS: not significant.
Table 9. Hypothesis test result in a multi-group analysis.
Causal Relationshipsdfχ2 Differences between High and Low Visit Frequencyp-Value
Sensory experience → Engagement10.0490.825
Intellectual experience (design) → Engagement10.1440.704
Intellectual experience (employees) → Engagement11.1070.293
Social experience → Engagement14.6660.033
Pragmatic experience → Engagement13.8470.050
Positive emotional experience → Engagement15.4000.023

