Local Food Shopping: Factors Affecting Users’ Behavioural E-Loyalty


Abstract
1. Introduction
2. Literature Review
2.1. Relational Variables in Local Food E-Commerce
2.2. The Impact of Perceived Flow and Control
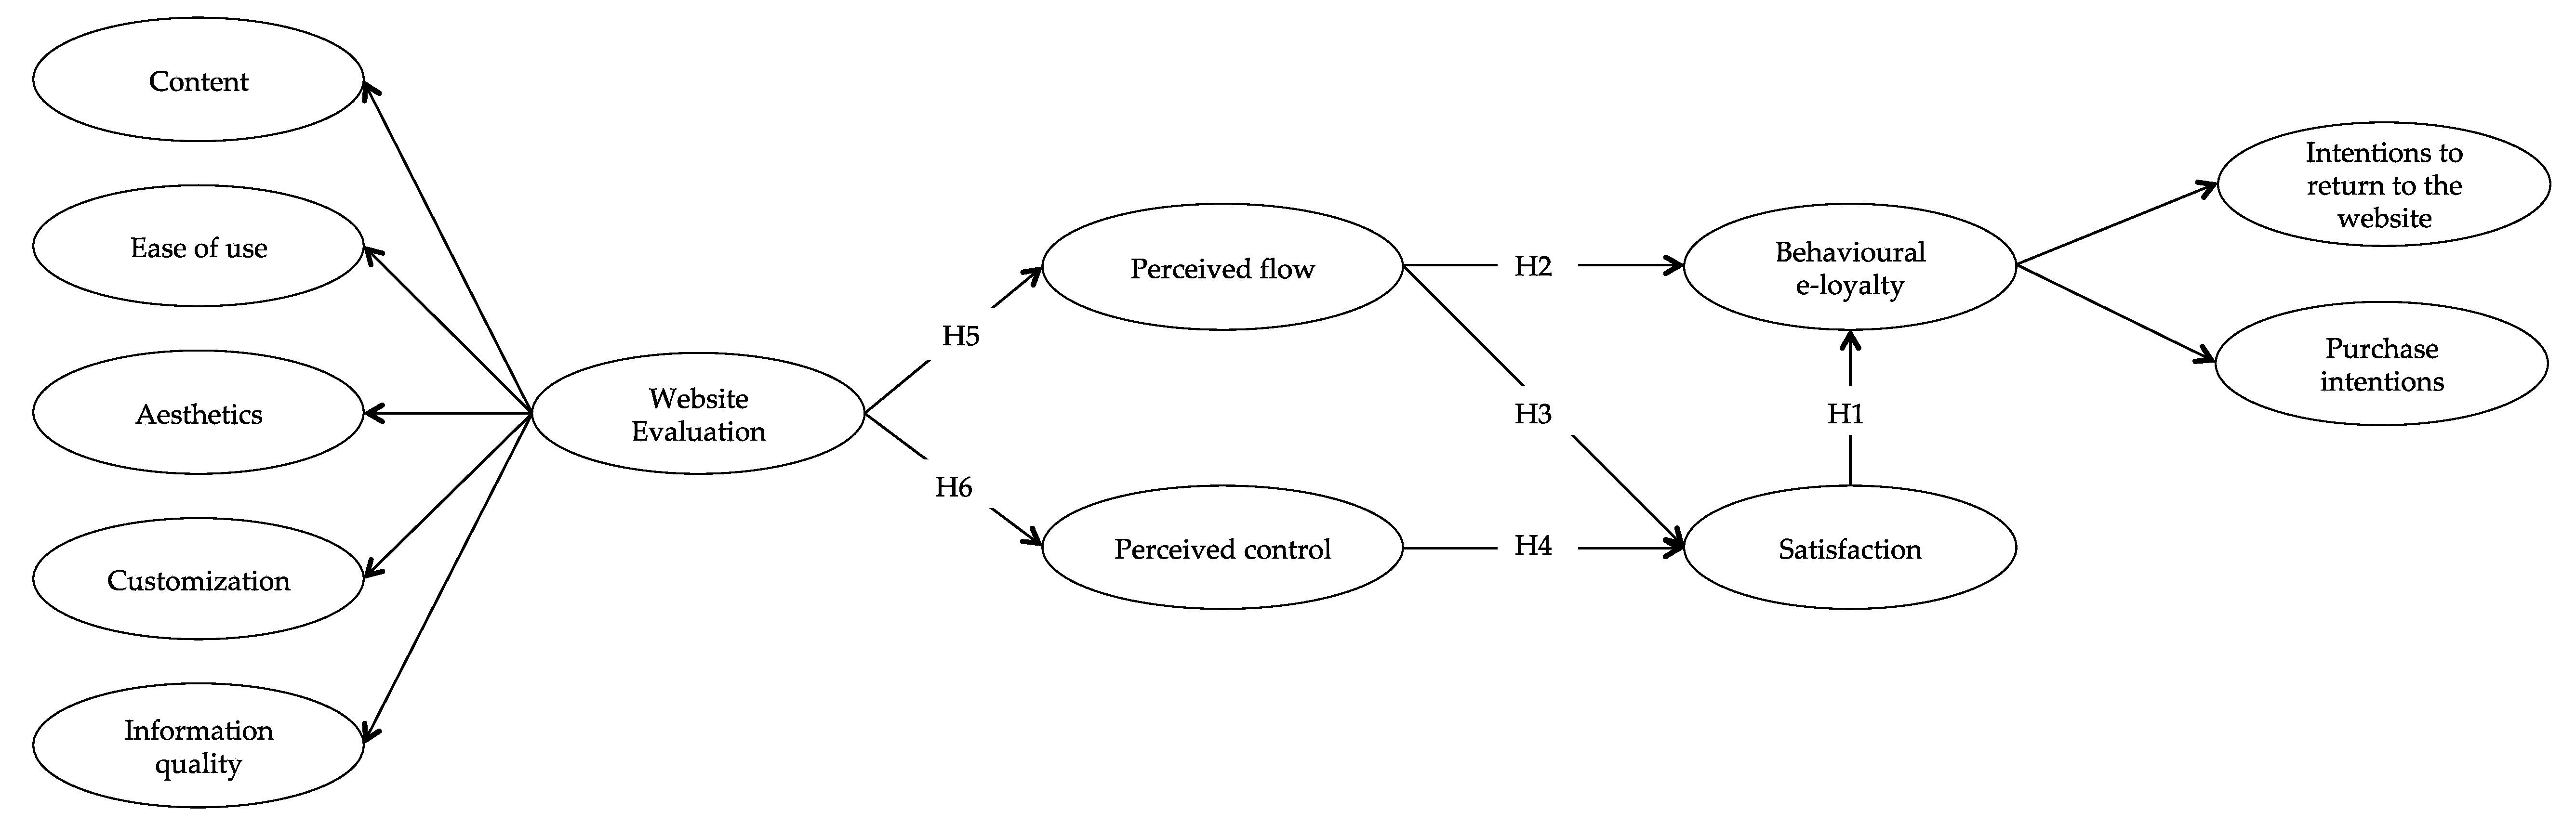
2.3. The Impact of Website Evaluation on Perceived Flow and Control
3. Research Methodology
3.1. Sampling Procedure and Data Collection
3.2. Measurement of Constructs
3.3. Reliability and Validity
4. Research Findings
5. Discussion and Implication
6. Conclusions
6.1. Academic Contributions
6.2. Practical Implications
6.3. Limitations and Future Research
Author Contributions
Funding
Acknowledgments
Conflicts of Interest
References
- Alcántara-Pilar, Juan Miguel, Salvador del Barrio-García, Esmeralda Crespo-Almendros, and Lucía Porcu. 2017. Toward an understanding of online information processing in e-tourism: Does national culture matter? Journal of Travel and Tourism Marketing 34: 1128–42. [Google Scholar] [CrossRef]
- Ali, Faizan. 2016. Hotel website quality, perceived flow, customer satisfaction and purchase intention. Journal of Hospitality and Tourism Technology 7: 213–28. [Google Scholar] [CrossRef]
- Atulkar, Sunil, and Bikrant Kesari. 2017. Satisfaction, loyalty and repatronage intentions: Role of hedonic shopping values. Journal of Retailing and Consumer Services 39: 23–34. [Google Scholar] [CrossRef]
- Bagozzi, Richard, and Youjae Yi. 1988. On the evaluation of structural equation models. Journal of the Academy of Marketing Science 16: 74–94. [Google Scholar] [CrossRef]
- Bhattacherjee, Anol. 2001. An empirical analysis of the antecedents of electronic commerce service continuance. Decision Support Systems 32: 201–14. [Google Scholar] [CrossRef]
- Bilgihan, Anil. 2016. Gen Y customer loyalty in online shopping: An integrated model of trust, user experience and branding. Computers in Human Behavior 61: 103–13. [Google Scholar] [CrossRef]
- Bilgihan, Anil, and Milos Bujisic. 2015. The effect of website features in online relationship marketing: A case of online hotel booking. Electronic Commerce Research and Applications 4: 222–32. [Google Scholar] [CrossRef]
- Bilgihan, Anil, Khaldoon Nusair, Fevzi Okumus, and Cihan Cobanoglu. 2015. Applying flow theory to booking experiences: An integrated model in an online service context. Information and Management 52: 668–78. [Google Scholar] [CrossRef]
- Bilgihan, Anil, Jay Kandampully, and Tingting Zhang. 2016. Towards a unified customer experience in online shopping environments: Antecedents and outcomes. International Journal of Quality and Service Sciences 8: 102–19. [Google Scholar] [CrossRef]
- Blake, Megan K., Jody Mellor, and Lucy Crane. 2010. Buying local food: Shopping practices, place, and consumption networks in defining food as “local”. Annals of the Association of American Geographers 100: 409–26. [Google Scholar] [CrossRef]
- Canavan, Orla, Maeve Henchion, and Seamus O’Reilly. 2007. The use of the internet as a marketing cannel for Irish speciality food. International Journal of Retail and Distribution Management 35: 178–95. [Google Scholar] [CrossRef]
- Chang, Shu-Chun, Pei-Yu Chou, and Lo Wen-Chien. 2014. Evaluation of satisfaction and repurchase intention in online food group-buying, using Taiwan as an example. British Food Journal 16: 44–61. [Google Scholar] [CrossRef]
- Chen, Yen-Ting, and Tsung-Yu Chou. 2012. Exploring the continuance intentions of consumers for B2C online shopping: Perspectives of fairness and trust. Online Information Review 36: 104–25. [Google Scholar] [CrossRef]
- Chen, Qimei, Sandra J. Clifford, and William D. Wells. 1999. Attitude toward the site II: New information. Journal of Advertising Research 42: 33–45. [Google Scholar] [CrossRef]
- Chen, Zhao, Kwek Choon Ling, Guo XiaoYing, and Tang Chun Meng. 2012. Antecedents of online customer satisfaction in China. International Business Management 6: 168–75. [Google Scholar] [CrossRef]
- Chin, Wynne W. 1998. Issues and opinions on structural equation modeling. MIS Quarterly 22: 7–16. [Google Scholar]
- Chiu, Chao-Min, Chao-Sheng Chiu, and Hae-Ching Chang. 2007. Examining the integrated influence of fairness and quality on learners’ satisfaction and Web-based learning continuance intention. Information Systems Journal 17: 271–87. [Google Scholar] [CrossRef]
- Chou, Pao-Hua, Pi-Hsiang Li, Kuang-Ku Chen, and Menq-Jiun. 2010. Integrating web mining and neural network for personalized e-commerce automatic service. Expert Systems with Applications 37: 2898–910. [Google Scholar] [CrossRef]
- Chou, Shihyu, Chi-Wen Chen, and Jiun-You Lin. 2015. Female online shoppers: Examining the mediating roles of e-satisfaction and e-trust on e-loyalty development. Internet Research 25: 542–61. [Google Scholar] [CrossRef]
- Chung, Namho, Hyunae Lee, Seung Jae Lee, and Chulmo Koo. 2015. The influence of tourism website on tourists’ behavior to determine destination selection: A case study of creative economy in Korea. Technological Forecasting and Social Change 96: 130–43. [Google Scholar] [CrossRef]
- Constantinides, Efthymios, Carlota Lorenzo-Romero, and Miguel A. Gómez. 2010. Effects of web experience on consumer choice: A multicultural approach. Internet Research 20: 188–209. [Google Scholar] [CrossRef]
- Dedeke, Adenekan. 2016. Travel web-site design: Information task-fit, service quality and purchase intention. Tourism Management 54: 541–54. [Google Scholar] [CrossRef]
- Duman, Teoman, and Anna S. Mattila. 2005. The role of affective factors on perceived cruise vacation value. Tourism Management 26: 311–23. [Google Scholar] [CrossRef]
- Eroglu, Segvin A., Karen A. Machleit, and Lenita M. Davis. 2003. Empirical testing of a model of online store atmospherics and shopper responses. Psychology and Marketing 20: 139–50. [Google Scholar] [CrossRef]
- Filieri, Raffaele, Salma Alguezaui, and Fraser McLeay. 2015. Why do travelers trust TripAdvisor? Antecedents of trust towards consumer-generated media and its influence on recommendation adoption and word of mouth. Tourism Management 51: 174–85. [Google Scholar] [CrossRef]
- Fornell, Claes, and David F. Larcker. 1981. Structural equation models with unobservable variables and measurement error. Journal of Marketing Research 18: 39–50. [Google Scholar] [CrossRef]
- Gonçalves, Helia, Maria de Fátoma Salgueiro, and Paulo Rita. 2016. Online purchase determinants of loyalty: The mediating effect of satisfaction in tourism. Journal of Retailing and Consumer Services 30: 279–91. [Google Scholar] [CrossRef]
- Grunert, Klaus G., and Kim Ramus. 2004. Consumers’ willingness to buy food through the internet: A review of the literature and a model for future research. British Food Journal 107: 381–403. [Google Scholar] [CrossRef]
- Ha, Sejin, and Leslie Stoel. 2012. Online apparel retailing: Roles of e-shopping quality and experiential e-shopping motives. Journal of Service Management 23: 197–215. [Google Scholar] [CrossRef]
- Hair, Joseph F., William C. Black, Barry J. Babin, and Rolph Anderson. 2010. Multivariate Data Analysis. Upper Saddle River: Prentice Hall. [Google Scholar]
- Hair, Joseph F., Markco Sarstedt, Christian Ringle, and Jeannette A. Mena. 2012. An assessment of the use of partial least squares structural equation modeling in marketing research. Journal of the Academy of Marketing Science 40: 414–33. [Google Scholar] [CrossRef]
- Hair, Joseph F., Markco Sarstedt, Lukas Hopkins, and Volker G. Kuppelwieser. 2014. Partial least squares structural equation modeling (PLS-SEM): An emerging tool in business research. European Business Review 26: 106–21. [Google Scholar] [CrossRef]
- Hair, Joseph F., G. Tomas M. Hult, Christian Ringle, and Markco Sarstedt. 2017. A Primer on Partial Least Squares Structural Equation Modeling (PLS-SEM). Thousand Oaks: Sage. [Google Scholar]
- Hansen, Torben. 2008. Consumer values, the theory of planned behaviour and online grocery shopping. International Journal of Consumer Studies 32: 128–13. [Google Scholar] [CrossRef]
- Hausman, Angela V., and Jeffrey Sam Siekpe. 2009. The effect of web interface features on consumer online purchase intentions. Journal of Business Research 62: 5–13. [Google Scholar] [CrossRef]
- Heng, Yan, Zhifeng Gao, Yuan Jiang, and Xuqi Chen. 2018. Exploring hidden factors behind online food shopping from Amazon reviews: A topic mining approach. Journal of Retailing and Consumer Services 42: 161–68. [Google Scholar] [CrossRef]
- Henseler, Jörg, Christian M. Ringle, and Rudolf R. Sinkovics. 2009. The use of partial least squares path modeling in international marketing. Advances in International Marketing 20: 277–320. [Google Scholar]
- Henseler, Jörg, Theo K. Dijkstra, Markco Sarstedt, Christian M. Ringle, Adamantios Diamantopoulos, Detmar W. Straub, David J. Ketchen, Joseph F. Hair, G. Tomas M. Hult, and Roger J. Calantone. 2014. Common beliefs and reality about PLS comments on Rönkkö and Evermann (2013). Organizational Research Methods 17: 182–209. [Google Scholar] [CrossRef]
- Henseler, Jörg, Christian M. Ringle, and Markco Sarstedt. 2015. A new criterion for assessing discriminant validity in variance-based structural equation modelling. Journal of the Academy of Marketing Science 43: 115–35. [Google Scholar] [CrossRef]
- Henseler, Jörg, Geoffrey Hubona, and Paulina A. Ray. 2016. Using PLS path modelling in new technology research: Updated guidelines. Industrial Management and Data Systems 116: 2–120. [Google Scholar] [CrossRef]
- Hoffman, Donna L., and Thomas P. Novak. 1996. Marketing in hypermediacomputer-mediated environments: Conceptual foundations. Journal of Marketing 60: 50–68. [Google Scholar] [CrossRef]
- Hsu, Chia-Lin, Kuo Chien Chang, and Mu-Chen Chen. 2012. The impact of website quality on customer satisfaction and purchase intention: Perceived playfulness and perceived flow as mediators. Information Systems and e-Business Management 10: 549–70. [Google Scholar] [CrossRef]
- Hu, Li-tze, and Peter M. Bentler. 1999. Cutoff criteria for fit indexes in covariance structure analysis: Conventional criteria versus new alternatives. Structural Equation Modeling 6: 1–55. [Google Scholar] [CrossRef]
- Huang, Lan-Ying, Ying-Jiun Hsieh, and Yen-Chun Jim Wu. 2014. Gratifications and social network service usage: The mediating role of online experience. Information and Management 51: 774–82. [Google Scholar] [CrossRef]
- Hui, Michael K., and John E. G. Bateson. 1991. Perceived control and the effects of crowding and consumer choice on the service experience. Journal of Consumer Research 18: 174–84. [Google Scholar] [CrossRef]
- Ilbery, Brian, David Watts, Sue Simpson, Andrew Gilg, and Jo Little. 2006. Mapping local foods: Evidence from two English regions. British Food Journal 18: 213–25. [Google Scholar] [CrossRef]
- Ilsever, Joe, Dianne Cyr, and Michael Parent. 2007. Extending models of flow and e-loyalty. Journal of Information Science and Technology 4: 3–22. [Google Scholar]
- Kabadayi, Sertan, and Reetika Gupta. 2011. Managing motives and design to influence web site revisits. Journal of Research in Interactive Marketing 5: 153–69. [Google Scholar] [CrossRef]
- Khanal, Bhoj Raj, Christopher Gan, and Susanne Becken. 2014. Tourism inter-industry linkages in the Lao PDR economy: An input–output analysis. Tourism Economics 20: 171–94. [Google Scholar] [CrossRef]
- Kim, Yeong Gug, and Gang Li. 2009. Customer satisfaction with and loyalty towards online travel products: A transaction cost economics perspective. Tourism Economics 15: 825–46. [Google Scholar] [CrossRef]
- Kim, Myung-Ja, Namho Chung, and Choong-Ki Lee. 2011. The effect of perceived trust on electronic commerce: Shopping online for tourism products and services in South Korea. Tourism Management 32: 256–65. [Google Scholar] [CrossRef]
- Koufaris, Marios. 2002. Applying the technology acceptance model and flow theory to online consumer behavior. Information Systems Research 13: 205–23. [Google Scholar] [CrossRef]
- Ku, Edward C. S., and Chun-Der Chen. 2014. Cultivating travellers’ revisit intention to e-tourism service: The moderating effect of website interactivity. Behaviour and Information Technology 34: 465–78. [Google Scholar] [CrossRef]
- Lee, Seonjeong A., and Miyoung Jeong. 2012. Effects of e-servicescape on consumers’ flow experiences. Journal of Hospitality and Tourism Technology 3: 47–59. [Google Scholar] [CrossRef]
- Lee, Gwo-Guang, and Hsiu-Fen Lin. 2005. Customer perceptions of e-service quality in online shopping. International Journal of Retail and Distribution Management 33: 161–76. [Google Scholar] [CrossRef]
- Lee, Kuan Huei, Jan Packer, and Noel Scott. 2015. Travel lifestyle preferences and destination activity choices of Slow Food members and non-members. Tourism Management 46: 1–10. [Google Scholar] [CrossRef]
- Lin, Chinho, and Watcharee Lekhawipat. 2014. Factors affecting online repurchase intention. Industrial Management and Data Systems 114: 597–611. [Google Scholar] [CrossRef]
- Liu, Chang, and Kirk P. Arnett. 2000. Exploring the factors associated with Web site success in the context of electronic commerce. Information and Management 38: 23–33. [Google Scholar] [CrossRef]
- Luarn, Pin, and Hsin-Hui Lin. 2003. A customer loyalty model for e-serve context. Journal of Electronic Commerce Research 4: 156–67. [Google Scholar]
- Manganari, Emmanouela E., George J. Siomkos, and Adam P. Vrechopoulos. 2009. Store atmosphere in web retailing. European Journal of Marketing 43: 1140–53. [Google Scholar] [CrossRef]
- Manganari, Emmanouela E., George J. Siomkos, Irini D. Rigopoulou, and Adam P. Vrechopoulos. 2011. Virtual store layout effects on consumer behaviour: Applying an environmental psychology approach in the online travel industry. Internet Research 21: 326–46. [Google Scholar] [CrossRef]
- Mathwick, Charla, and Edward Rigdon. 2004. Play, flow, and the online search experience. Journal of Consumer Research 31: 324–32. [Google Scholar] [CrossRef]
- Megicks, Phil, Juliet Memer, and Robert J. Angell. 2012. Understanding local food shopping: Unpacking the ethical dimension. Journal of Marketing Management 28: 264–189. [Google Scholar] [CrossRef]
- Mohamed, Norshidah, Ramlah Hussein, Nurul Hidayah, Ahmad Zamzuri, and Hanif Haghshenas. 2014. Insights into individual’s online shopping continuance intention. Industrial Management and Data Systems 114: 1453–176. [Google Scholar] [CrossRef]
- Mohd-Any, Amrul Asraf, Heidi Winklhofer, and Christine Ennew. 2015. Measuring users’ value experience on a travel website (e-Value): What value is co-created by the user? Journal of Travel Research 54: 496–510. [Google Scholar] [CrossRef]
- O’Cass, Aron, and Jamie Carlson. 2010. Examining the effects of website-induced flow in professional sporting team websites. Internet Research 20: 115–34. [Google Scholar] [CrossRef]
- Ozkara, Behcet Yalin, Mujdat Ozmen, and Jong Woo Kim. 2017. Examining the effect of flow experience on online purchase: A novel approach to the flow theory based on hedonic and utilitarian value. Journal of Retailing and Consumer Services 37: 119–31. [Google Scholar] [CrossRef]
- Pallud, Jessie, and Detmar W. Straub. 2014. Effective website design for experience-influenced environments: The case of high culture museums. Information and Management 51: 359–73. [Google Scholar] [CrossRef]
- Pappas, Ilias O., Adamantia G. Pateli, Michail N. Giannakos, and Vassilious Chrissikopoulos. 2014. Moderating effects of online shopping experience on customer satisfaction and repurchase intentions. International Journal of Retail & Distribution Management 42: 187–204. [Google Scholar] [CrossRef]
- Pearson, David, Joanna Henryks, Alex Trott, Philip Jones, Gavin Parker, David Dumaresq, and Rob Dyball. 2011. Local Food: Understanding consumer motivations in innovative retail formats. British Food Journal 113: 886–99. [Google Scholar] [CrossRef]
- Pedraja, Marta, and M. Jesus Yagüe. 2004. Perceived quality and price: Their impact on the satisfaction of restaurant customers. International Journal of Contemporary Hospitality Management 16: 373–79. [Google Scholar] [CrossRef]
- Pee, Loo Geok, James Jiang, and Gary Klein. 2018. Signaling effect of website usability on repurchase intention. International Journal of Information Management 39: 228–41. [Google Scholar] [CrossRef]
- Pereira, Hélia G., Maria de Fátima Salgueiro, and Paulo Rita. 2016. Online purchase determinants of loyalty: The mediating effect of satisfaction in tourism. Journal of Retailing and Consumer Services 30: 279–91. [Google Scholar] [CrossRef]
- Quevedo-Silva, Filipe, Otavio Freire, Dario de Oliveira, Marcelo Moll, Guiliana Isabella, and Luisa Brito. 2016. Intentions to purchase food through the internet: Developing and testing a model. British Food Journal 118: 572–87. [Google Scholar] [CrossRef]
- Rezaei, Sajad, Faizan Ali, Muslim Amin, and Sreenivasan Jayashree. 2016. Online impulse buying of tourism products. Journal of Hospitality and Tourism Technology 7: 60–83. [Google Scholar] [CrossRef]
- Rose, Susan, Moira Clark, Philip Samouel, and Neil Hair. 2012. Online customer experience in e-retailing: An empirical model of antecedents and outcomes. Journal of Retailing 88: 308–22. [Google Scholar] [CrossRef]
- Rubio, Natalia, Javier Oubiña, and Nieves Villaseñor. 2014. Brand awareness–Brand quality inference and consumer’s risk perception in store brands of food products. Food Quality and Preference 32: 289–98. [Google Scholar] [CrossRef]
- Sánchez-García, Isabel, Rik Pieters, Marcel Zeelenberg, and Enrique Bigné. 2012. When satisfied consumers do not return: Variety seeking’s effect on short- and long-term intentions. Psychology and Marketing 29: 15–24. [Google Scholar] [CrossRef]
- San-Martín, Héctor, and Ángel Herrero. 2012. Influence of the user’s psychological factors on the online purchase intention in rural tourism: Integrating innovativeness to the UTAUT framework. Tourism Management 33: 341–50. [Google Scholar] [CrossRef]
- San-Martín, Sonia, Jana Prodanova, and Nadia Jiménez. 2012. The impact of age in the generation of satisfaction and WOM in mobile shopping. Journal of Retailing and Consumer Services 23: 1–8. [Google Scholar] [CrossRef]
- Seyfang, Gill. 2008. Avoiding Asda? Exploring consumer motivations in local organic food networks. Local Environment 13: 187–201. [Google Scholar] [CrossRef]
- Sireci, Stephen G., Yongwei Yang, James Harter, and Eldin J. Ehrlich. 2006. Evaluating guidelines for test adaptations: A methodological analysis of transalation quality. Journal of Cross-Cultural Psychology 37: 557–67. [Google Scholar] [CrossRef]
- Sims, Rebecca. 2009. Food, place and authenticity: Local food and the sustainable tourism experience. Journal of Sustainable Tourism 17: 321–36. [Google Scholar] [CrossRef]
- Sirdeshmukh, Deepak, Norita B. Ahmad, M. Sajid Khan, and Nicholas J. Ashill. 2018. Drivers of user loyalty intention and commitment to a search engine: An exploratory study. Journal of Retailing and Consumer Services 44: 71–81. [Google Scholar] [CrossRef]
- Smith, Amy K., and Ruth N. Bolton. 2002. The effect of customer’s emotional responses to service failures on their recovery effort evaluations and satisfaction judgment. Journal of the Academy of Marketing Science 30: 5–23. [Google Scholar] [CrossRef]
- Teo, Thompson, Shirish Srivastava, and Li Jiang. 2008. Trust and electronic government success: An empirical study. Journal of Management Information Systems 25: 99–132. [Google Scholar] [CrossRef]
- Tobler, Christina, Vivianne H. M. Visschers, and Michael Siegrist. 2011. Eating green. Consumers’ willingness to adopt ecological food consumption behaviors. Appetite 57: 674–82. [Google Scholar] [CrossRef] [PubMed]
- Venkatesh, Viswanath. 2000. Determinants of perceived ease of use: Integrating control, intrinsic motivation, and emotion into the technology acceptance model. Information Systems Research 11: 342–65. [Google Scholar] [CrossRef]
- Wang, Liang, Rob Law, Basak Denizci, Kam Hung, and Davis Ka Chio Fong. 2015. Impact of hotel website quality on online booking intentions: ETrust as a mediator. International Journal of Hospitality Management 47: 108–15. [Google Scholar] [CrossRef]
- Wen, Chao, Victor Prybutok, and Chenyan Xu. 2011. An integrated model for customer online repurchase intention. Journal of Computer Information Systems 52: 14–23. [Google Scholar] [CrossRef]
- Wolfinbarger, Mary, and Mary C. Gilly. 2003. Etailq: Dimensionalizing, measuring and predicting etail quality. Journal of Retailing 79: 183–98. [Google Scholar] [CrossRef]
- Wu, Ing-Long, Kuei-Wan Chen, and Mai-Lun Chiu. 2016. Defining key drivers of online impulse purchasing: A perspective of both impulse shoppers and system users. International Journal of Information Management 36: 284–96. [Google Scholar] [CrossRef]
- Yen, Chia-Hiu, and Hsi-Peng Lu. 2008. Factors influencing online auction repurchase intention. Internet Research 18: 7–25. [Google Scholar] [CrossRef]
- Yoo, Jungmin, and Minjung Park. 2016. The effects of e-mass customization on consumer perceived value, satisfaction, and loyalty toward luxury brands. Journal of Business Research 69: 5775–84. [Google Scholar] [CrossRef]
- Zeithaml, Valane, Leonard Berry, and Ananthanarayanan Parasuraman. 1996. The behavioral consequences of service quality. Journal of Marketing 60: 31–46. [Google Scholar] [CrossRef]
- Zepeda, Lydia, and David Deal. 2009. Organic and local food consumer behaviour: Alphabet theory. International Journal of Consumer Studies 33: 697–705. [Google Scholar] [CrossRef]
- Zepeda, Lydia, and Jinghan Li. 2006. Who buys local food? Journal of Food Distribution Research 37: 385–94. [Google Scholar] [CrossRef]
- Zhao, Ling, and Yaobin Lu. 2012. Enhancing perceived interactivity through network externalities: An empirical study on micro-blogging service satisfaction and continuance intention. Decision Support Systems 53: 825–34. [Google Scholar] [CrossRef]


| Reference | Variables of the Navigation Experience | Outcomes of the Navigation Experience |
|---|---|---|
| Koufaris (2002) | Ease of use, perceived usefulness, entertainment, control, concentration | Purchase intentions |
| Lee and Lin (2005) | Website design, viability, reactivity, customization | Perceived quality, satisfaction, purchase intentions |
| Hausman and Siekpe (2009) | Entertainment, utility, information and content | Purchase intentions, revisit intentions |
| Constantinides et al. (2010) | Usability, interactivity, aesthetics, marketing mix and trust | Website selection |
| Manganari et al. (2011) | Ease of use | Trust, satisfaction |
| Rose et al. (2012) | Ease of use, aesthetics, perceived benefits, connectivity, customization, ability, challenge, interaction speed, immersion | Satisfaction, trust, purchase intention |
| Hsu et al. (2012) | Website quality | Satisfaction, purchase intention |
| Ha and Stoel (2012) | Privacy and security, content and functionality, customer service, atmosphere | Satisfaction, purchase intention |
| Hsu et al. (2012) | Utility and perceived ease of use | Satisfaction, loyalty |
| Pappas et al. (2014) | Customization | Purchase intentions |
| Pallud and Straub (2014) | Content, made for the medium, ease of use, promotion, emotion, aesthetics, subjective norms, attitudes, facilitating conditions | Intentions to return to the website, intentions to go to the museum |
| Bilgihan et al. (2016) | Easiness to locate the website or app, ease of use, perceived usefulness, hedonic and utilitarian features, perceived enjoyment, personalization, social interactions and multi-device compatibility | Brand engagement, positive word of mouth (WOM), and repeat purchase |
| n | % | n | % | ||
|---|---|---|---|---|---|
| Gender | Number of visits to the website | ||||
| Female | 175 | 57 | 1–5 visits | 254 | 83 |
| Male | 130 | 43 | >5 visits | 51 | 17 |
| Age | Time spent on the website | ||||
| 18–25 | 8 | 3 | 0–5 min | 105 | 34 |
| 26–30 | 42 | 14 | 6–10 min | 108 | 35 |
| 31–35 | 115 | 38 | 11–15 min | 56 | 19 |
| 36–40 | 38 | 12 | >16 min | 36 | 12 |
| 41–45 | 30 | 10 | How often do you buy online? | ||
| 46–50 | 25 | 8 | 1–5 times per year | 98 | 32 |
| 51–55 | 23 | 7.5 | 6–10 times per year | 77 | 25 |
| 56–60 | 14 | 4.5 | >10 times per year | 111 | 36 |
| 61–65 | 7 | 2 | Never | 19 | 6 |
| 66–69 | 2 | 1 | Household monthly income (in euros) | ||
| >70 | 1 | 0 | <900 | 41 | 13 |
| Education | 901–1200 | 38 | 13 | ||
| Postgraduate | 90 | 29.5 | 1201–1500 | 44 | 15 |
| Graduate | 158 | 52 | 1501–2000 | 74 | 24 |
| Undergraduate | 30 | 10 | 2001–2000 | 46 | 15 |
| Secondary | 26 | 8.5 | 3001–4000 | 25 | 8 |
| Primary | 1 | 0 | >4000 | 37 | 12 |
| Occupation | |||||
| Employed | 231 | 76 | |||
| Student | 5 | 2 | |||
| Unemployed | 16 | 4 | |||
| Housewife | 9 | 3 | |||
| Other | 42 | 14 | |||
| Retired | 2 | 1 |
| Factor | Description | Mean | Standard Deviation |
|---|---|---|---|
| Aesthetics (AE) | |||
| 1. | I find that the design of this website looks pleasant. | 6.072 | 1.050 |
| 2. | The layout of this website is fascinating. | 6.020 | 1.107 |
| 3. | I find the design of this website to be creative. | 5.797 | 1.211 |
| 4. | I find that the design of this website looks aesthetic. | 5.970 | 1.138 |
| Content (CO) | |||
| 1. | This website offers content that is relevant to the core audience. | 5.708 | 1.221 |
| 2. | ... uses media appropriately and effectively to communicate the content. | 5.702 | 1.288 |
| 3. | ... provides the appropriate breadth and depth of content. | 5.567 | 1.271 |
| 4. | ... provides current and timely information. | 5.708 | 1.189 |
| Customization (CU) | |||
| 1. | This website makes me feel they are talking to me personally as a customer. | 5.275 | 1.431 |
| 2. | The requirement to login to this shopping website makes me feel recognized as a customer. | 5.266 | 1.538 |
| 3. | It is important to me that this shopping website feels like my personal area when I use it. | 5.439 | 1.510 |
| 4. | I like that I am able to customize this shopping website to my own liking. | 5.580 | 1.438 |
| Ease of use (EO) | |||
| 1. | This website offers clear and understandable goals. | 6.007 | 1.043 |
| 2. | … is well-structured and organized. | 5.964 | 1.111 |
| 3. | … provides clear and understandable results and feedback regarding your progress. | 5.787 | 1.091 |
| 4. | ... allows me to easily shop for what I want. | 6.010 | 1.070 |
| 5. | It is easy to become confident at this website shopping. | 5.751 | 1.258 |
| 6. | Learning how to navigate through this website has not taken too long for me. | 6.246 | 1.044 |
| Information quality (IQ) | |||
| 1. | The website produces the most current information. | 5.767 | 1.166 |
| 2. | ... provides me with all the information I need. | 5.623 | 1.335 |
| 3. | The information provided by the website is accurate. | 5.770 | 1.212 |
| 4. | In general, the website provides me with high-quality information. | 5.728 | 1.331 |
| Intention to return to the website (IR) | |||
| 1. | I will revisit this website next time I need. | 5.587 | 1.576 |
| 2. | It is worth returning to this website again. | 5.695 | 1.449 |
| 3. | I am likely to return to this website next time I need. | 5.590 | 1.547 |
| 4. | I am encouraged to revisit this website next time I need. | 5.587 | 1.539 |
| Perceived control (PC) | |||
| 1. | I feel in control of what I am doing when I purchase from this website. | 5.810 | 1.178 |
| 2. | I can easily control the information that is provided on this website. | 5.721 | 1.141 |
| 3. | I feel I can control my use of information on this website. | 5.698 | 1.146 |
| 4. | The level of information provided by this website helps me to feel in control of my purchase decision. | 5.757 | 1.217 |
| Perceived flow (PF) | |||
| 1. | When I navigate in this website, I felt totally captivated. | 5.466 | 1.333 |
| 2. | When I navigate in this website, time seemed to pass very quickly. | 5.318 | 1.444 |
| 3. | When I visit this website, nothing seemed to matter to me. | 4.475 | 1.845 |
| Purchase intention (PI) | |||
| 1. | It is likely that next year I will transact with this website. | 4.928 | 1.820 |
| 2. | Given the chance, I intend to use this website. | 5.213 | 1.715 |
| 3. | Given the chance, I predict that next year I should use this website. | 5.157 | 1.776 |
| Satisfaction (SA) | |||
| 1. | Overall, I was satisfied with this online commerce. | 5.662 | 1.288 |
| 2. | The online site information content met my needs. | 5.495 | 1.389 |
| 3. | It was easy to buy the product I chose. | 5.954 | 1.167 |
| 4. | I was satisfied with online buying when compared to offline buying. | 5.557 | 1.420 |
| Factor | Indicator | Standardized Loading | t-Value (Bootstrap) | CA | rho_A | CR | AVE |
|---|---|---|---|---|---|---|---|
| Aesthetics | AE1 | 0.896 | 58,910 | 0.918 | 0.920 | 0.942 | 0.803 |
| AE2 | 0.907 | 51,329 | |||||
| AE3 | 0.892 | 63,188 | |||||
| AE4 | 0.890 | 45,549 | |||||
| Content | CO1 | 0.878 | 62,306 | 0.913 | 0.914 | 0.939 | 0.793 |
| CO2 | 0.892 | 57,361 | |||||
| CO3 | 0.888 | 57,888 | |||||
| CO4 | 0.904 | 69,183 | |||||
| Customization | CU1 | 0.869 | 48,781 | 0.896 | 0.902 | 0.927 | 0.761 |
| CU2 | 0.904 | 66,494 | |||||
| CU3 | 0.891 | 49,864 | |||||
| CU4 | 0.825 | 29,581 | |||||
| Ease of use | EO1 | 0.774 | 27,960 | 0.877 | 0.884 | 0.907 | 0.621 |
| EO2 | 0.834 | 39,925 | |||||
| EO3 | 0.818 | 35,686 | |||||
| EO4 | 0.779 | 27,734 | |||||
| EO5 | 0.818 | 37,089 | |||||
| EO6 | 0.695 | 14,603 | |||||
| Information quality | IQ1 | 0.861 | 43,953 | 0.926 | 0.930 | 0.948 | 0.820 |
| IQ2 | 0.928 | 88,819 | |||||
| IQ3 | 0.917 | 54,849 | |||||
| IQ4 | 0.914 | 63,480 | |||||
| Intention to return to the website | IR1 | 0.952 | 114,008 | 0.966 | 0.967 | 0.975 | 0.908 |
| IR2 | 0.928 | 44,796 | |||||
| IR3 | 0.973 | 182,997 | |||||
| IR4 | 0.958 | 78,820 | |||||
| Perceived control | PC1 | 0.913 | 80,785 | 0.938 | 0.939 | 0.956 | 0.844 |
| PC2 | 0.930 | 91,755 | |||||
| PC3 | 0.920 | 89,280 | |||||
| PC4 | 0.912 | 71,321 | |||||
| Perceived flow | PF1 | 0.909 | 74,597 | 0.893 | 0.897 | 0.933 | 0.824 |
| PF2 | 0.932 | 106,859 | |||||
| PF3 | 0.881 | 50,650 | |||||
| Purchase intention | PI1 | 0.951 | 105,532 | 0.962 | 0.963 | 0.976 | 0.930 |
| PI2 | 0.970 | 177,271 | |||||
| PI3 | 0.972 | 190,928 | |||||
| Satisfaction | SA1 | 0.925 | 82,634 | 0.927 | 0.934 | 0.948 | 0.822 |
| SA2 | 0.927 | 102,152 | |||||
| SA3 | 0.840 | 28,827 | |||||
| SA4 | 0.931 | 114,582 | |||||
| Website evaluation | Aesthetics | 0.790 | 24,756 | 0.892 | 0.894 | 0.920 | 0.698 |
| Content | 0.848 | 40,512 | |||||
| Customization | 0.833 | 40,261 | |||||
| Ease of use | 0.867 | 52,389 | |||||
| Information quality | 0.837 | 37,856 | |||||
| Behavioural e-loyalty | Intention to return to the website | 0.915 | 61,930 | 0.831 | 0.838 | 0.922 | 0.855 |
| Purchase intention | 0.934 | 102,260 |
| Factor | F1 | F2 | F3 | F4 | F5 | |
|---|---|---|---|---|---|---|
| F1. | Perceived control | 0.919 | 0.805 | 0.897 | 0.838 | 0.665 |
| F2. | Perceived flow | 0.740 | 0.908 | 0.890 | 0.830 | 0.742 |
| F3. | Satisfaction | 0.835 | 0.816 | 0.906 | 0.900 | 0.781 |
| F4. | Website Evaluation | 0.769 | 0.745 | 0.820 | 0.835 | 0.700 |
| F5. | Behavioural e-loyalty | 0.590 | 0.644 | 0.691 | 0.603 | 0.924 |
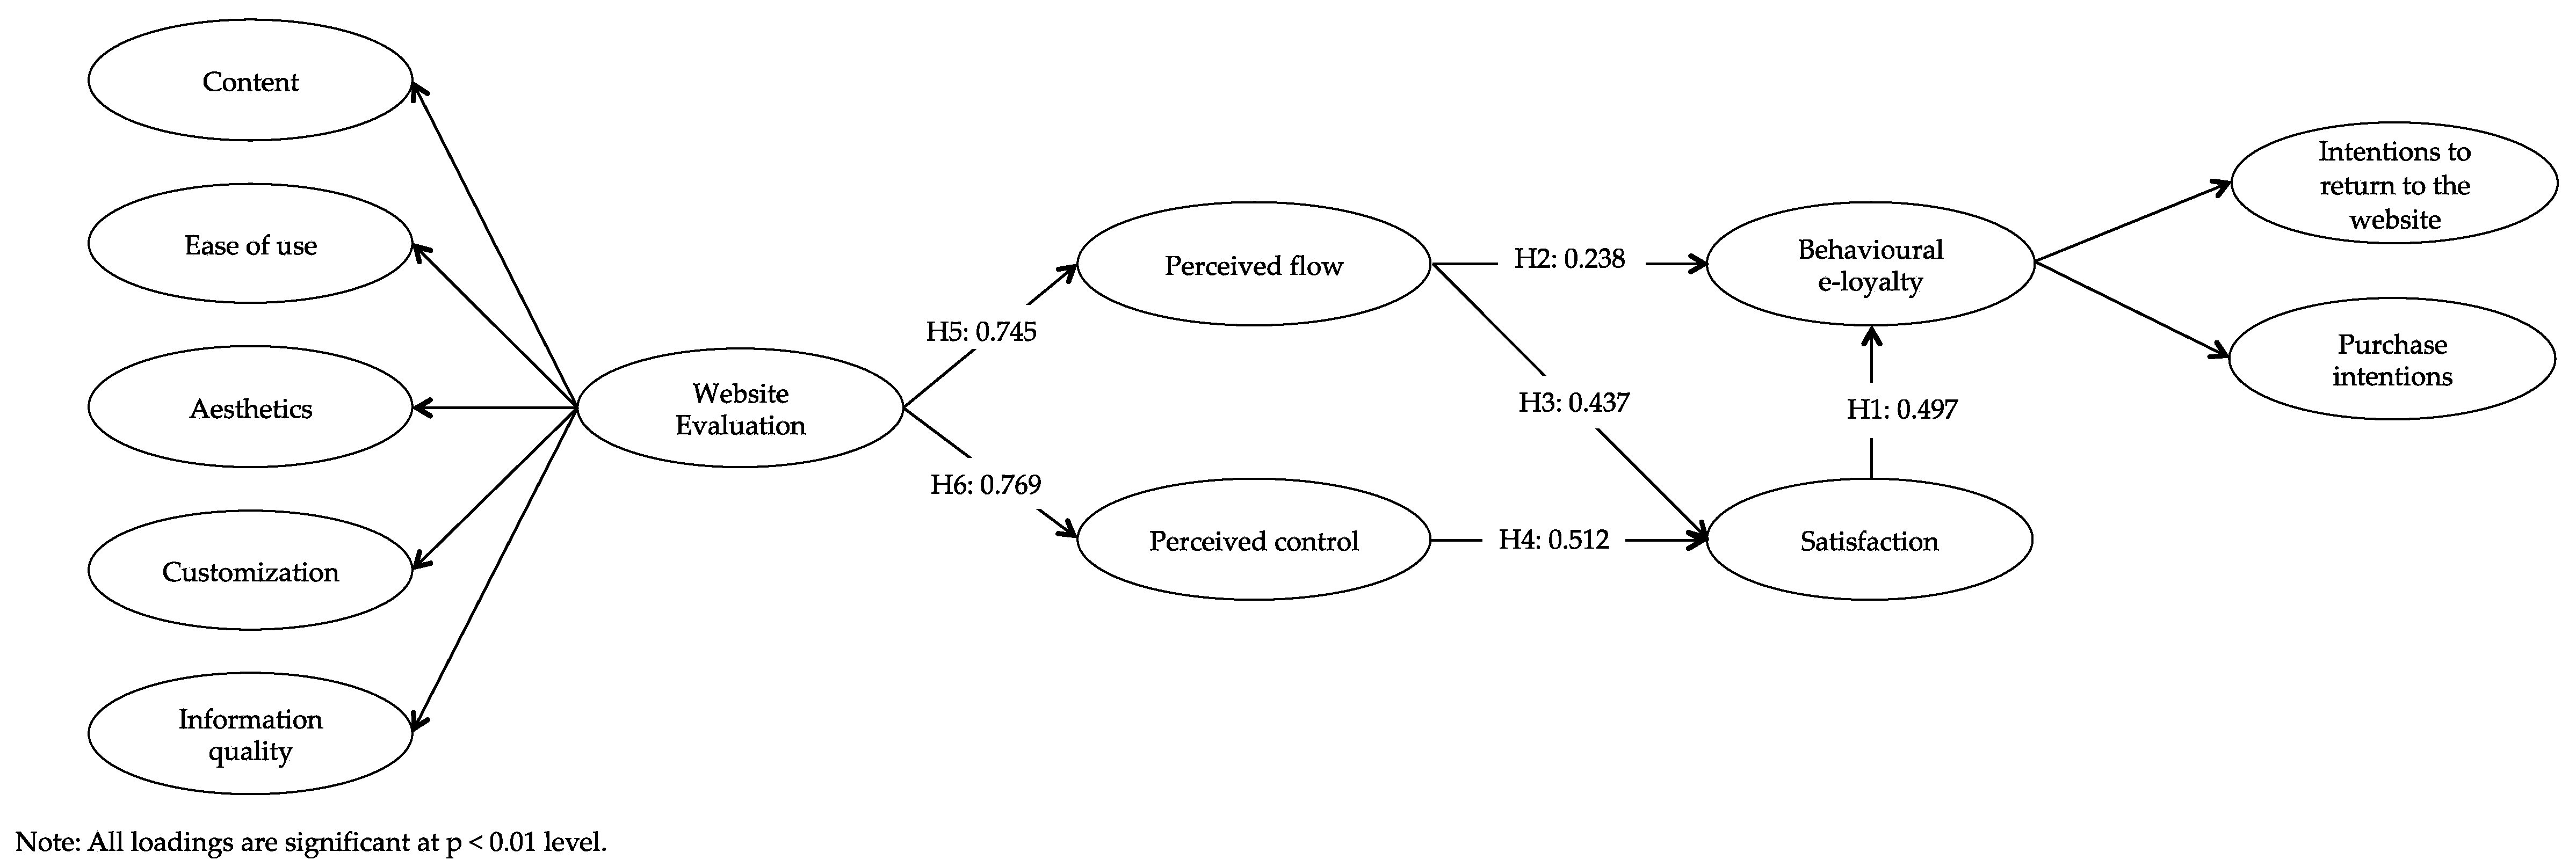
| Hypothesis | Standardized Beta | t-Value (Bootstrap) | |
|---|---|---|---|
| H1 | Satisfaction → Behavioural e-loyalty | 0.497 | 6266 |
| H2 | Perceived flow → Behavioural e-loyalty | 0.238 | 3161 |
| H3 | Perceived flow → Satisfaction | 0.437 | 8306 |
| H4 | Perceived control → Satisfaction | 0.512 | 9454 |
| H5 | Website Evaluation → Perceived flow | 0.745 | 27,411 |
| H6 | Website Evaluation → Perceived control | 0.769 | 28,474 |
| Paths | Standardized Beta | t-Value (Bootstrap) | VAF | Partial/Full Mediation |
|---|---|---|---|---|
| Perceived control → Satisfaction → Behavioural e-loyalty | 0.547 | 6786 | 0.926 | Full |
© 2018 by the authors. Licensee MDPI, Basel, Switzerland. This article is an open access article distributed under the terms and conditions of the Creative Commons Attribution (CC BY) license (http://creativecommons.org/licenses/by/4.0/).
Share and Cite
Blasco Lopez, M.F.; Recuero Virto, N.; San-Martín, S. Local Food Shopping: Factors Affecting Users’ Behavioural E-Loyalty. Adm. Sci. 2018, 8, 47. https://doi.org/10.3390/admsci8030047
Blasco Lopez MF, Recuero Virto N, San-Martín S. Local Food Shopping: Factors Affecting Users’ Behavioural E-Loyalty. Administrative Sciences. 2018; 8(3):47. https://doi.org/10.3390/admsci8030047
Chicago/Turabian StyleBlasco Lopez, Maria Francisca, Nuria Recuero Virto, and Sonia San-Martín. 2018. "Local Food Shopping: Factors Affecting Users’ Behavioural E-Loyalty" Administrative Sciences 8, no. 3: 47. https://doi.org/10.3390/admsci8030047
APA StyleBlasco Lopez, M. F., Recuero Virto, N., & San-Martín, S. (2018). Local Food Shopping: Factors Affecting Users’ Behavioural E-Loyalty. Administrative Sciences, 8(3), 47. https://doi.org/10.3390/admsci8030047