1. Introduction
Tourism destinations operate in increasingly competitive environments in which attracting first-time visitors alone may be insufficient to sustain destination performance. Destinations must also cultivate favorable post-visit responses that encourage tourists to revisit and recommend them to others. Destination loyalty intention is therefore strategically important because it can support repeat demand, reduce dependence on continuous visitor acquisition, and strengthen destination competitiveness. Although loyalty is associated with several post-consumption evaluations, meta-analytic evidence identifies tourist satisfaction as one of its strongest correlates, together with experience quality, perceived value, perceived quality, and tourist motivation (
Wang & Li, 2023). Nevertheless, a satisfaction-centered explanation may not fully capture the multiple destination-related considerations associated with tourists’ intentions to revisit and recommend a destination.
Tourists may develop loyalty intentions not only because they are satisfied with destination attributes, but also because they perceive the destination as distinctive and memorable or consider its tourism services accessible, affordable, and convenient. These considerations suggest that loyalty may have symbolic, functional, and evaluative foundations. The symbolic foundation concerns the beliefs, meanings, and affective associations through which tourists interpret and differentiate a destination. The functional foundation concerns the tourism offerings, access arrangements, service encounters, delivery processes, and physical conditions that facilitate destination consumption. The evaluative foundation reflects tourists’ post-consumption assessments of destination attributes and experiences. Distinguishing these foundations provides a more differentiated framework for examining the factors associated with tourists’ post-visit loyalty intentions.
Destination image represents the symbolic foundation because it integrates tourists’ cognitive beliefs and affective impressions into a meaningful representation of a place (
Baloglu & McCleary, 1999;
Beerli & Martín, 2004). Before visitation, destination image is shaped by promotional communication, social information, media representations, and prior knowledge. Following visitation, it becomes increasingly grounded in tourists’ direct encounters with the destination’s attractions, culture, residents, infrastructure, and services (
Beerli & Martín, 2004;
Chen & Tsai, 2007). A favorable post-visit image may correspond with greater satisfaction when tourists’ experiences confirm or exceed their expectations. It may also be directly associated with loyalty intention by making the destination more distinctive, memorable, and preferable than competing alternatives (
Chen & Tsai, 2007;
Chi & Qu, 2008;
Prayag & Ryan, 2012). Destination image therefore provides a symbolic basis for understanding what the destination represents to tourists and how it is positioned in their memories and future destination choices.
The extended service marketing mix represents the functional foundation of the destination experience. Its seven components, namely product, price, place, promotion, people, process, and physical evidence, describe the conditions through which tourism offerings are developed, communicated, accessed, delivered, and experienced. Collectively, these components can communicate value, reduce practical barriers, facilitate tourism consumption, and increase the perceived feasibility of future visitation. Unlike destination image, which captures a holistic and meaning-based representation of the place, the service marketing mix concerns the operational functioning of its tourism service system. Because the seven components fulfil distinct and potentially non-interchangeable roles, however, their relevance to tourists’ evaluations may differ across destinations, visitor segments, and service contexts (
Rahman et al., 2019).
Tourist satisfaction represents the evaluative foundation of loyalty intention. In the present study, satisfaction is assessed through tourists’ evaluations of destination attributes, including attractions, product quality and price, accessibility and facilities, tourism information, and service encounters. It is therefore interpreted as an aggregate attribute-level evaluation of tourists’ experiences in Pai rather than as a purely global measure of satisfaction. This evaluative foundation differs conceptually from the symbolic and functional foundations because it reflects tourists’ judgments of experienced destination attributes, whereas destination image captures the broader meaning assigned to the destination and the service marketing mix captures the conditions supporting tourism consumption.
The three foundations are theoretically expected to exhibit related but distinguishable associations with loyalty intention. Destination image represents the symbolic basis of the framework because destination distinctiveness, memorability, and preference may correspond with tourists’ future orientation toward Pai. Favorable service-marketing conditions represent the functional basis because accessibility, affordability, information, and service delivery may correspond with the perceived feasibility of revisiting or recommending the destination. Satisfaction represents the evaluative basis because favorable assessments of previous experiences may correspond with future destination choices. Destination image and service-marketing conditions may also be associated with satisfaction, while remaining directly associated with loyalty intention when satisfaction is considered. These relationships constitute the study’s theoretically proposed routes. The cross-sectional analysis evaluates whether the observed associations are consistent with this framework but does not establish temporal ordering or distinct causal mechanisms.
This distinction is particularly relevant to Pai District in Mae Hong Son Province, northern Thailand. Pai is a small inland destination associated with natural landscapes, cultural diversity, a relaxed atmosphere, and backpacker-oriented tourism. Its identity has developed through multiple, partly competing representations, including ethnic tourism, international backpacking, and Thai romantic tourism (
Pongajarn et al., 2014). These representations distinguish Pai symbolically from larger urban, island, and resort destinations. At the same time, tourists’ experiences depend on functional conditions such as the availability and affordability of tourism offerings, destination accessibility, promotional communication, service personnel, delivery processes, and physical facilities. Pai therefore provides an appropriate setting for examining how symbolic destination meaning and functional destination support are associated with attribute-level satisfaction and loyalty intention among Thai domestic tourists.
Despite extensive research on destination loyalty, three gaps remain. First, although previous studies have established relationships among destination image, satisfaction, and loyalty, less attention has been given to how symbolic destination meaning operates alongside the functional organization of the destination service system (
Chen & Tsai, 2007;
Chi & Qu, 2008;
Prayag & Ryan, 2012). Second, destination image and the extended service marketing mix have generally developed within separate research streams. Consequently, limited evidence explains their respective relationships with post-visit satisfaction and loyalty intention when both are incorporated into the same destination-level framework. Third, prior studies frequently position satisfaction as the principal intervening construct connecting destination evaluations with loyalty. Although satisfaction is an important correlate of loyalty (
Wang & Li, 2023), this perspective may understate the direct associations of symbolic distinctiveness and functional destination support with tourists’ intentions to revisit and recommend a destination.
To address these gaps, this study develops a symbolic–functional framework of destination loyalty intention. Within this framework, destination image represents symbolic destination meaning, the service marketing mix represents functional destination support, attribute-level tourist satisfaction represents tourists’ post-consumption evaluation of experienced destination attributes, and destination loyalty intention reflects tourists’ intentions to revisit and recommend Pai. The study addresses the following research questions:
How is destination image associated with tourist satisfaction and destination loyalty intention?
How is the service marketing mix associated with tourist satisfaction and destination loyalty intention?
How is tourist satisfaction associated with destination loyalty intention?
Are destination image and the service marketing mix indirectly associated with destination loyalty intention through tourist satisfaction?
By examining these relationships within a unified framework, the study assesses whether symbolic destination meaning and functional destination support demonstrate similar or differentiated associations with tourist satisfaction and loyalty intention. It also examines the specific indirect associations of destination image and functional destination support with loyalty intention through satisfaction. These indirect associations are evaluated as patterns consistent with the proposed theoretical sequence rather than as evidence of temporal or causal mediation.
This study makes three contributions to destination-loyalty research. First, it integrates image-based and service-system perspectives by examining symbolic destination meaning and functional destination support within a common framework of loyalty intention. Second, it differentiates tourists’ holistic interpretation of a destination from the operational conditions facilitating destination consumption, thereby providing a more nuanced account of the correlates of loyalty intention in a small-destination context. Third, it examines the direct associations of destination image and service-marketing conditions with loyalty intention and their specific indirect associations through tourist satisfaction. The contribution therefore lies in showing that symbolic destination meaning, functional destination support, and attribute-level satisfaction exhibit differentiated relationships with loyalty intention, rather than in establishing causal pathways among them. Managerially, these distinctions can help destination organizations coordinate image stewardship, service-system improvement, and satisfaction monitoring.
2. Literature Review and Hypothesis Development
Destination loyalty reflects tourists’ favorable future orientation toward a destination, commonly expressed through intentions to revisit and recommend it to others (
Chen & Tsai, 2007;
Chi & Qu, 2008). Although satisfaction is an established correlate of loyalty, tourists’ future intentions may also depend on the symbolic meaning they assign to a destination and their assessment of whether its tourism system supports convenient and reliable consumption. Accordingly, the present study distinguishes among three complementary routes to destination loyalty intention: symbolic destination meaning, functional destination support, and post-consumption evaluation.
Destination image represents the symbolic route because it captures the beliefs, impressions, and affective associations through which tourists interpret and differentiate a destination. The service marketing mix represents the functional route because its components describe how tourism offerings are developed, priced, communicated, accessed, delivered, and experienced. Tourist satisfaction represents the evaluative route because it reflects tourists’ post-consumption assessment of the destination attributes encountered during their visit. These mechanisms are theoretically distinct but interrelated. Symbolic meaning and functional support may correspond directly with loyalty intention, while they may also be indirectly associated with loyalty through tourists’ satisfaction with destination attributes.
Throughout this study, the term “routes” is used as an organizing theoretical metaphor. It distinguishes the symbolic, functional, and evaluative bases that may correspond with loyalty intention, but it does not imply that the cross-sectional data identify separate temporal processes or causal mechanisms. Empirically, the framework is evaluated through direct and specific indirect associations among concurrently measured constructs.
2.1. Destination Image
Destination image refers to the configuration of beliefs, impressions, and affective responses that individuals associate with a destination (
Baloglu & McCleary, 1999;
Beerli & Martín, 2004). It is generally understood as incorporating cognitive and affective components. Cognitive image concerns tourists’ knowledge and beliefs about destination characteristics, such as attractions, infrastructure, cultural resources, accessibility, and environmental conditions. Affective image concerns the feelings and emotional responses elicited by the destination. Together, these components form a broader representation that allows tourists to interpret a destination and differentiate it from competing alternatives (
Baloglu & McCleary, 1999).
Destination image develops through both indirect information and direct experience. Before visitation, it is shaped by promotional communication, media representations, social information, and prior knowledge. After visitation, tourists may revise or reinforce this image through direct encounters with the destination’s attractions, cultural environment, residents, infrastructure, and tourism services (
Beerli & Martín, 2004). Post-visit image is therefore an experience-informed representation of the destination rather than an expectation derived solely from external information. This characteristic makes it particularly relevant to tourists’ satisfaction and future behavioral intentions (
Chen & Tsai, 2007;
Chi & Qu, 2008).
Within the present framework, destination image represents symbolic destination meaning because it integrates tourists’ encounters with Pai into a broader interpretation of what the destination represents. Its symbolic function does not imply that destination image is disconnected from tangible attributes. Instead, tourists assign meaning to those attributes by interpreting Pai as attractive, distinctive, culturally meaningful, or memorable. Destination image thus transforms specific destination encounters into a holistic representation that may remain salient when tourists evaluate their completed visit or consider future destination choices.
This symbolic function differentiates destination image from the service marketing mix. Destination image concerns the meaning and comparative position tourists assign to the destination, whereas the service marketing mix concerns the operational conditions supporting destination consumption. A tourist may, for example, regard Pai as distinctive and memorable even when experiencing difficulties with transportation, pricing, or service processes. Conversely, tourists may consider a destination functionally convenient without regarding it as symbolically distinctive. Destination image and the service marketing mix may therefore demonstrate different relationships with satisfaction and loyalty intention.
2.1.1. Destination Image and Tourist Satisfaction
Tourist satisfaction is a post-consumption evaluation of tourists’ destination experiences (
Chen & Tsai, 2007;
Chi & Qu, 2008). In the present study, satisfaction is assessed through evaluations of destination attributes, including attractions, product quality and price, convenience and facilities, tourism information, and service encounters. It is therefore conceptualized as an aggregate attribute-level evaluation rather than as a purely global satisfaction judgment.
Destination image should be positively associated with tourist satisfaction because tourists’ beliefs and affective impressions provide an interpretive basis for evaluating experienced destination attributes. When visitors perceive a destination as attractive, distinctive, culturally meaningful, and environmentally appealing, they are more likely to evaluate its attractions and related tourism experiences favorably. Destination image can consequently provide a cognitive-affective frame that is theoretically relevant to how tourists organize and assess their destination encounters.
The proposed relationship can also be understood through the consistency between tourists’ expectations and direct experiences. A pre-visit image provides an initial representation of what tourists expect to encounter. Following visitation, tourists reassess this representation based on their experiences at the destination. A favorable post-visit image may be consistent with direct encounters that reinforced desirable beliefs or corresponded with favorable affective impressions. Such consistency should correspond with more positive evaluations of the destination attributes experienced during the visit.
Previous research supports a positive relationship between destination image and satisfaction.
Chen and Tsai (
2007) found that destination image contributed to tourists’ evaluative responses and behavioral intentions.
Chi and Qu (
2008) similarly identified positive relationships among destination image, attribute satisfaction, overall satisfaction, and destination loyalty. Evidence from other tourism settings also indicates that image-related characteristics, including attractiveness, uniqueness, safety, hospitality, and environmental quality, are associated with tourists’ satisfaction, although their relative relevance varies across destination contexts (
Králiková et al., 2020).
This relationship is particularly applicable to Pai because its tourism appeal is associated with its natural environment, cultural diversity, relaxed atmosphere, and distinctive small-destination identity (
Pongajarn et al., 2014). Thai domestic tourists who form favorable impressions of these characteristics should also evaluate their experiences with Pai’s destination attributes more positively. Because the present study uses cross-sectional data, the hypothesized relationship is expressed as an association rather than a causal effect. Accordingly:
H1a. Destination image is positively associated with tourist satisfaction.
2.1.2. Destination Image and Destination Loyalty Intention
Destination image may also be directly associated with destination loyalty intention. Loyalty intention reflects tourists’ willingness to maintain a favorable future relationship with a destination, particularly through intentions to revisit and recommend it (
Chi & Qu, 2008;
Prayag & Ryan, 2012). These intentions involve memory, preference, and comparisons with alternative destinations. A destination with a favorable image may be more readily recalled and preferred because it occupies a distinctive position in tourists’ memories.
The proposed relationship is based on symbolic distinctiveness and memory-based preference. Tourist satisfaction reflects an evaluation of experienced destination attributes, whereas destination image captures the broader meaning and comparative attractiveness assigned to the place. Tourists may intend to revisit or recommend a destination because of its unique atmosphere, cultural identity, natural environment, or symbolic significance, even when some attributes of their previous visit were evaluated less favorably. Destination image may therefore provide a symbolic basis for loyalty intention that remains relevant when satisfaction is included in the model.
Previous studies support the direct relationship between destination image and tourists’ behavioral intentions.
Chen and Tsai (
2007) found that destination image was associated with behavioral intentions both directly and through post-visit evaluations.
Chi and Qu (
2008) reported that destination image contributed to destination loyalty within an integrated model incorporating tourist satisfaction.
Prayag and Ryan (
2012) similarly demonstrated that destination image remained relevant to loyalty when satisfaction, place attachment, and personal involvement were considered. Collectively, these findings suggest that destination image may correspond with loyalty through tourists’ post-consumption evaluations and through the destination’s enduring symbolic attractiveness.
Pai provides an appropriate context for examining this relationship because its identity incorporates natural scenery, cultural diversity, backpacker tourism, Thai romantic tourism, and a relaxed small-town atmosphere (
Pongajarn et al., 2014). Favorable impressions of these characteristics may make Pai distinctive and memorable when tourists consider future travel or recommend destinations to others. Therefore:
H1b. Destination image is positively associated with destination loyalty intention.
2.2. Service Marketing Mix
The extended service marketing mix describes the functional arrangements through which tourism offerings are created, priced, communicated, accessed, delivered, and experienced. The traditional marketing mix consists of product, price, place, and promotion, while the extended framework incorporates people, process, and physical evidence to account for the interpersonal, procedural, and tangible characteristics of service provision. This framework is relevant to tourism because tourism offerings are predominantly experiential, involve interactions among multiple destination actors, and are evaluated through both intangible service encounters and tangible environmental conditions.
Product comprises the attractions, activities, accommodation, transportation, and supporting services available to tourists. Price encompasses tourists’ monetary expenditures and nonmonetary sacrifices, including the time and effort required to access and consume tourism offerings. Place concerns destination accessibility and the channels through which tourism services are made available, whereas promotion concerns the communication of the destination and its offerings. People include employees, residents, guides, and other actors involved in tourism encounters. Process refers to the procedures through which tourists obtain and experience services. Physical evidence includes facilities, surroundings, and other tangible cues through which tourists assess service provision (
Rahman et al., 2019).
At the destination level, the seven components are provided by a network of tourism businesses, public organizations, employees, residents, and community actors. Their combined functioning shapes whether tourists can obtain and consume destination offerings conveniently and reliably. Attractive tourism products may provide limited value when destination access is difficult, prices are unclear, promotional information is inaccurate, personnel are unresponsive, or service procedures are inconvenient. Conversely, supportive functional arrangements can reduce consumption effort, increase predictability, and facilitate tourists’ access to destination experiences.
The service marketing mix therefore represents perceived functional destination support. Its theoretical role differs from that of destination image because it concerns how the destination’s tourism system operates rather than what the destination represents symbolically. The two routes may be related because service encounters and physical conditions can contribute to tourists’ impressions of a destination. Nevertheless, they remain conceptually distinct. Destination image integrates destination attributes into broader meanings and impressions, whereas the service marketing mix represents specific functional conditions enabling tourism consumption.
The seven service-marketing components perform substantively distinct roles and should not be interpreted as conceptually identical. Product, price, place, promotion, people, process, and physical evidence represent different aspects of functional destination support, and favorable performance in one component does not necessarily guarantee equally favorable performance in another. Nevertheless, tourists may form a broader evaluative orientation toward the functioning of the destination service environment. Under this interpretation, a generally favorable perception of functional destination support is expected to correspond, on average rather than uniformly, with favorable evaluations across the seven service-marketing conditions. The primary model therefore examines the shared evaluative variance among the seven indicators while recognizing their content-specific roles. Because this reflective interpretation represents only one theoretically plausible specification, an alternative formative-composite specification was also estimated to determine whether the principal structural conclusions depended on the primary measurement assumption.
2.2.1. Service Marketing Mix and Tourist Satisfaction
The service marketing mix should be positively associated with tourist satisfaction because its components shape the benefits, costs, convenience, and service conditions tourists experience during a visit. Appropriate tourism offerings, acceptable prices, convenient access, accurate communication, responsive service personnel, manageable delivery processes, and suitable physical environments can facilitate destination consumption and support favorable evaluations of experienced destination attributes.
This relationship can be explained through perceived value and consumption effort. Perceived value reflects consumers’ assessment of what they receive relative to what they sacrifice (
Zeithaml, 1988). Product and price shape the benefits and costs associated with a destination visit, while place and process influence the time and effort necessary to obtain tourism services. Promotion can reduce informational uncertainty by communicating what is available and how it can be accessed. Service personnel can assist tourists and address problems, while physical evidence provides tangible cues through which visitors assess the quality and reliability of otherwise intangible services. Favorable evaluations of these functional conditions should therefore correspond with greater satisfaction.
Tourism research has linked service-marketing components with tourist satisfaction, although the relative importance of the individual components varies across settings (
Rahman et al., 2019). This variation is theoretically plausible because each component addresses a different aspect of tourism consumption. Tourists may, for example, evaluate Pai’s attractions favorably while being less satisfied with its accessibility or pricing. Nevertheless, when tourists perceive the destination’s functional conditions as generally supportive, they should encounter fewer practical difficulties and evaluate the corresponding attributes of their visit more favorably.
In the present study, the service marketing mix reflects tourists’ perceptions of how Pai’s tourism products, prices, accessibility, communication, personnel, service processes, and physical facilities support destination consumption. More favorable perceptions of these functional conditions should therefore correspond with higher attribute-level satisfaction. Accordingly:
H2a. The service marketing mix is positively associated with tourist satisfaction.
2.2.2. Service Marketing Mix and Destination Loyalty Intention
The service marketing mix may also be directly associated with destination loyalty intention because tourists’ future decisions depend partly on whether another visit is perceived as accessible, affordable, predictable, and manageable. Suitable tourism offerings can provide reasons to return, while reasonable prices and convenient access can reduce the anticipated monetary and nonmonetary costs of revisitation. Accurate information, dependable service personnel, efficient processes, and appropriate facilities can further increase tourists’ confidence in a future visit.
This relationship is grounded in anticipated consumption convenience and reduced behavioral uncertainty. Tourist satisfaction reflects an evaluation of the attributes experienced during a completed visit. Revisit intention, however, also requires tourists to assess whether repeating the experience is practically feasible. Functional destination conditions may reduce the anticipated effort associated with another visit. For example, accessible transportation, transparent prices, recognizable offerings, accurate tourism information, and manageable service procedures can make future destination consumption easier to plan and undertake.
Functional support may also be relevant to recommendation intention. Recommending a destination involves interpersonal risk because tourists place their credibility at stake when advising other people. Previous visitors may therefore consider whether the destination is sufficiently accessible, dependable, and navigable for others. A well-functioning tourism service system can reduce this perceived risk by increasing the predictability and manageability of the destination experience.
The service marketing mix may consequently be associated with loyalty intention independently of its relationship with satisfaction. Tourists may intend to revisit because Pai is practically accessible, affordable, and manageable, even when their evaluation of particular attributes is not uniformly favorable. Similarly, they may recommend Pai when they believe that its tourism system allows other visitors to access and consume its offerings with limited difficulty. In this respect, destination image and the service marketing mix provide complementary foundations for loyalty: image creates symbolic meaning and memorability, whereas functional support increases the feasibility of revisitation and recommendation. Accordingly:
H2b. The service marketing mix is positively associated with destination loyalty intention.
2.3. Tourist Satisfaction as an Evaluative Route to Destination Loyalty Intention
Tourist satisfaction represents a post-consumption evaluation formed through tourists’ assessments of their destination experiences (
Chen & Tsai, 2007;
Chi & Qu, 2008). The present study measures satisfaction through five attribute domains: tourism attractions, product quality and price, convenience and facilities, tourism information and promotion, and interpersonal service encounters. The construct is therefore interpreted as an aggregate attribute-level evaluation rather than as a purely global judgment of the visit.
Tourist satisfaction is conceptually distinct from both destination image and the service marketing mix. Destination image concerns the beliefs, affective impressions, and symbolic meanings associated with the destination. The service marketing mix concerns the operational conditions supporting destination consumption. Satisfaction, by comparison, captures tourists’ evaluative responses to the destination attributes encountered during their visit. Maintaining these distinctions is important because tourists may regard a destination as distinctive without evaluating every aspect favorably, or they may perceive its service arrangements as convenient without developing a strong symbolic preference for the place.
Destination loyalty incorporates attitudinal, intentional, and behavioral dimensions. The present study examines destination loyalty intention as a predominantly future-oriented favorable disposition toward Pai. Revisit and recommendation intentions constitute its core conative expressions, while a favorable overall evaluation of Pai’s tourism services provides supplementary attitudinal–evaluative coverage. The construct does not capture actual repeat visitation or observed recommendation behavior.
Satisfaction should be positively associated with loyalty intention because favorable evaluations of past experiences reduce uncertainty about future destination consumption. Tourists who evaluate their destination experiences positively have an experiential basis for expecting that another visit will also be rewarding. They may also be more willing to recommend the destination because their favorable evaluations increase their confidence that others could have a satisfactory experience.
Oliver’s (
1999) conceptualization of loyalty as developing through cognitive, affective, conative, and behavioral stages supports the relevance of favorable consumption evaluations to future commitment. Tourism research has similarly documented positive relationships between satisfaction and behavioral intentions.
Chen and Tsai (
2007) found that tourists’ post-visit evaluations were associated with their behavioral intentions, while
Chi and Qu (
2008) reported a positive relationship between satisfaction and destination loyalty. Meta-analytic evidence further identifies satisfaction as one of the strongest correlates of tourist loyalty across tourism contexts (
Wang & Li, 2023).
Within the proposed framework, satisfaction constitutes the evaluative route to loyalty intention. Destination image and the service marketing mix represent symbolic and functional foundations, respectively, whereas satisfaction reflects tourists’ evaluations of the attributes experienced during their visit. These routes are complementary rather than mutually exclusive. Tourists who evaluate their experiences with Pai’s attractions, value, facilities, information, and services more favorably should express stronger intentions to revisit and recommend the destination. Therefore:
H3. Tourist satisfaction is positively associated with destination loyalty intention.
2.4. The Indirect Role of Tourist Satisfaction
Destination image and the service marketing mix may exhibit both direct associations with destination loyalty intention and specific indirect associations through tourist satisfaction. The proposed indirect relationships are theoretically consistent with a sequence in which symbolic impressions or perceptions of functional destination support correspond with satisfaction, which in turn corresponds with loyalty intention. However, because all constructs were measured concurrently, the empirical analysis cannot establish that destination image or functional destination support temporally preceded satisfaction or that satisfaction subsequently produced loyalty intention. The indirect analyses therefore assess statistical patterns consistent with the proposed theoretical sequence rather than temporal or causal mediation.
2.4.1. Destination Image, Tourist Satisfaction, and Loyalty Intention
A favorable destination image may be indirectly associated with loyalty intention through tourist satisfaction. When tourists report more favorable interpretations of Pai as attractive, distinctive, and culturally meaningful, they may also report more favorable evaluations of its destination attributes. In turn, favorable attribute-level satisfaction may correspond with stronger revisit and recommendation intentions. This proposed sequence positions destination image as the symbolic construct, satisfaction as the evaluative construct, and loyalty intention as the future-oriented outcome. Empirically, however, the study evaluates only whether their cross-sectional associations are consistent with this theoretical ordering.
Previous studies provide theoretical and empirical support for this indirect relationship. Destination image has been associated with tourists’ satisfaction, while satisfaction has been associated with destination loyalty (
Chen & Tsai, 2007;
Chi & Qu, 2008). An observed indirect association would not establish that satisfaction temporally or causally mediates the relationship, nor would it imply that satisfaction statistically accounts for the entire association between image and loyalty intention. Destination image may remain directly relevant because symbolic distinctiveness, emotional meaning, and memorability can influence future intentions beyond tourists’ evaluations of individual destination attributes.
Accordingly, the hypothesized indirect relationship is:
H4a. Destination image is positively and indirectly associated with destination loyalty intention through tourist satisfaction.
2.4.2. Service Marketing Mix, Tourist Satisfaction, and Loyalty Intention
The service marketing mix may also be indirectly associated with loyalty intention through tourist satisfaction. More favorable perceptions of tourism offerings, pricing, accessibility, communication, personnel, service processes, and physical facilities may correspond with more favorable evaluations of related destination attributes. Satisfaction may, in turn, be positively associated with tourists’ intentions to revisit and recommend Pai.
This proposed indirect association is theoretically distinguishable from the one involving destination image. Destination image represents symbolic meaning and distinctiveness, whereas the service marketing mix represents the practical conditions supporting destination consumption. The empirical analysis assesses whether functional destination support, satisfaction, and loyalty intention exhibit an indirect pattern consistent with this theoretical sequence. It does not establish that perceptions of functional support temporally preceded satisfaction or that satisfaction subsequently caused loyalty intention.
The service marketing mix may nevertheless retain a direct association with loyalty intention because tourists can consider functional conditions when assessing the feasibility of future visitation or the suitability of recommending Pai to others. Thus, a specific indirect association through satisfaction may coexist with a direct association between functional destination support and loyalty intention. Accordingly:
H4b. The service marketing mix is positively and indirectly associated with destination loyalty intention through tourist satisfaction.
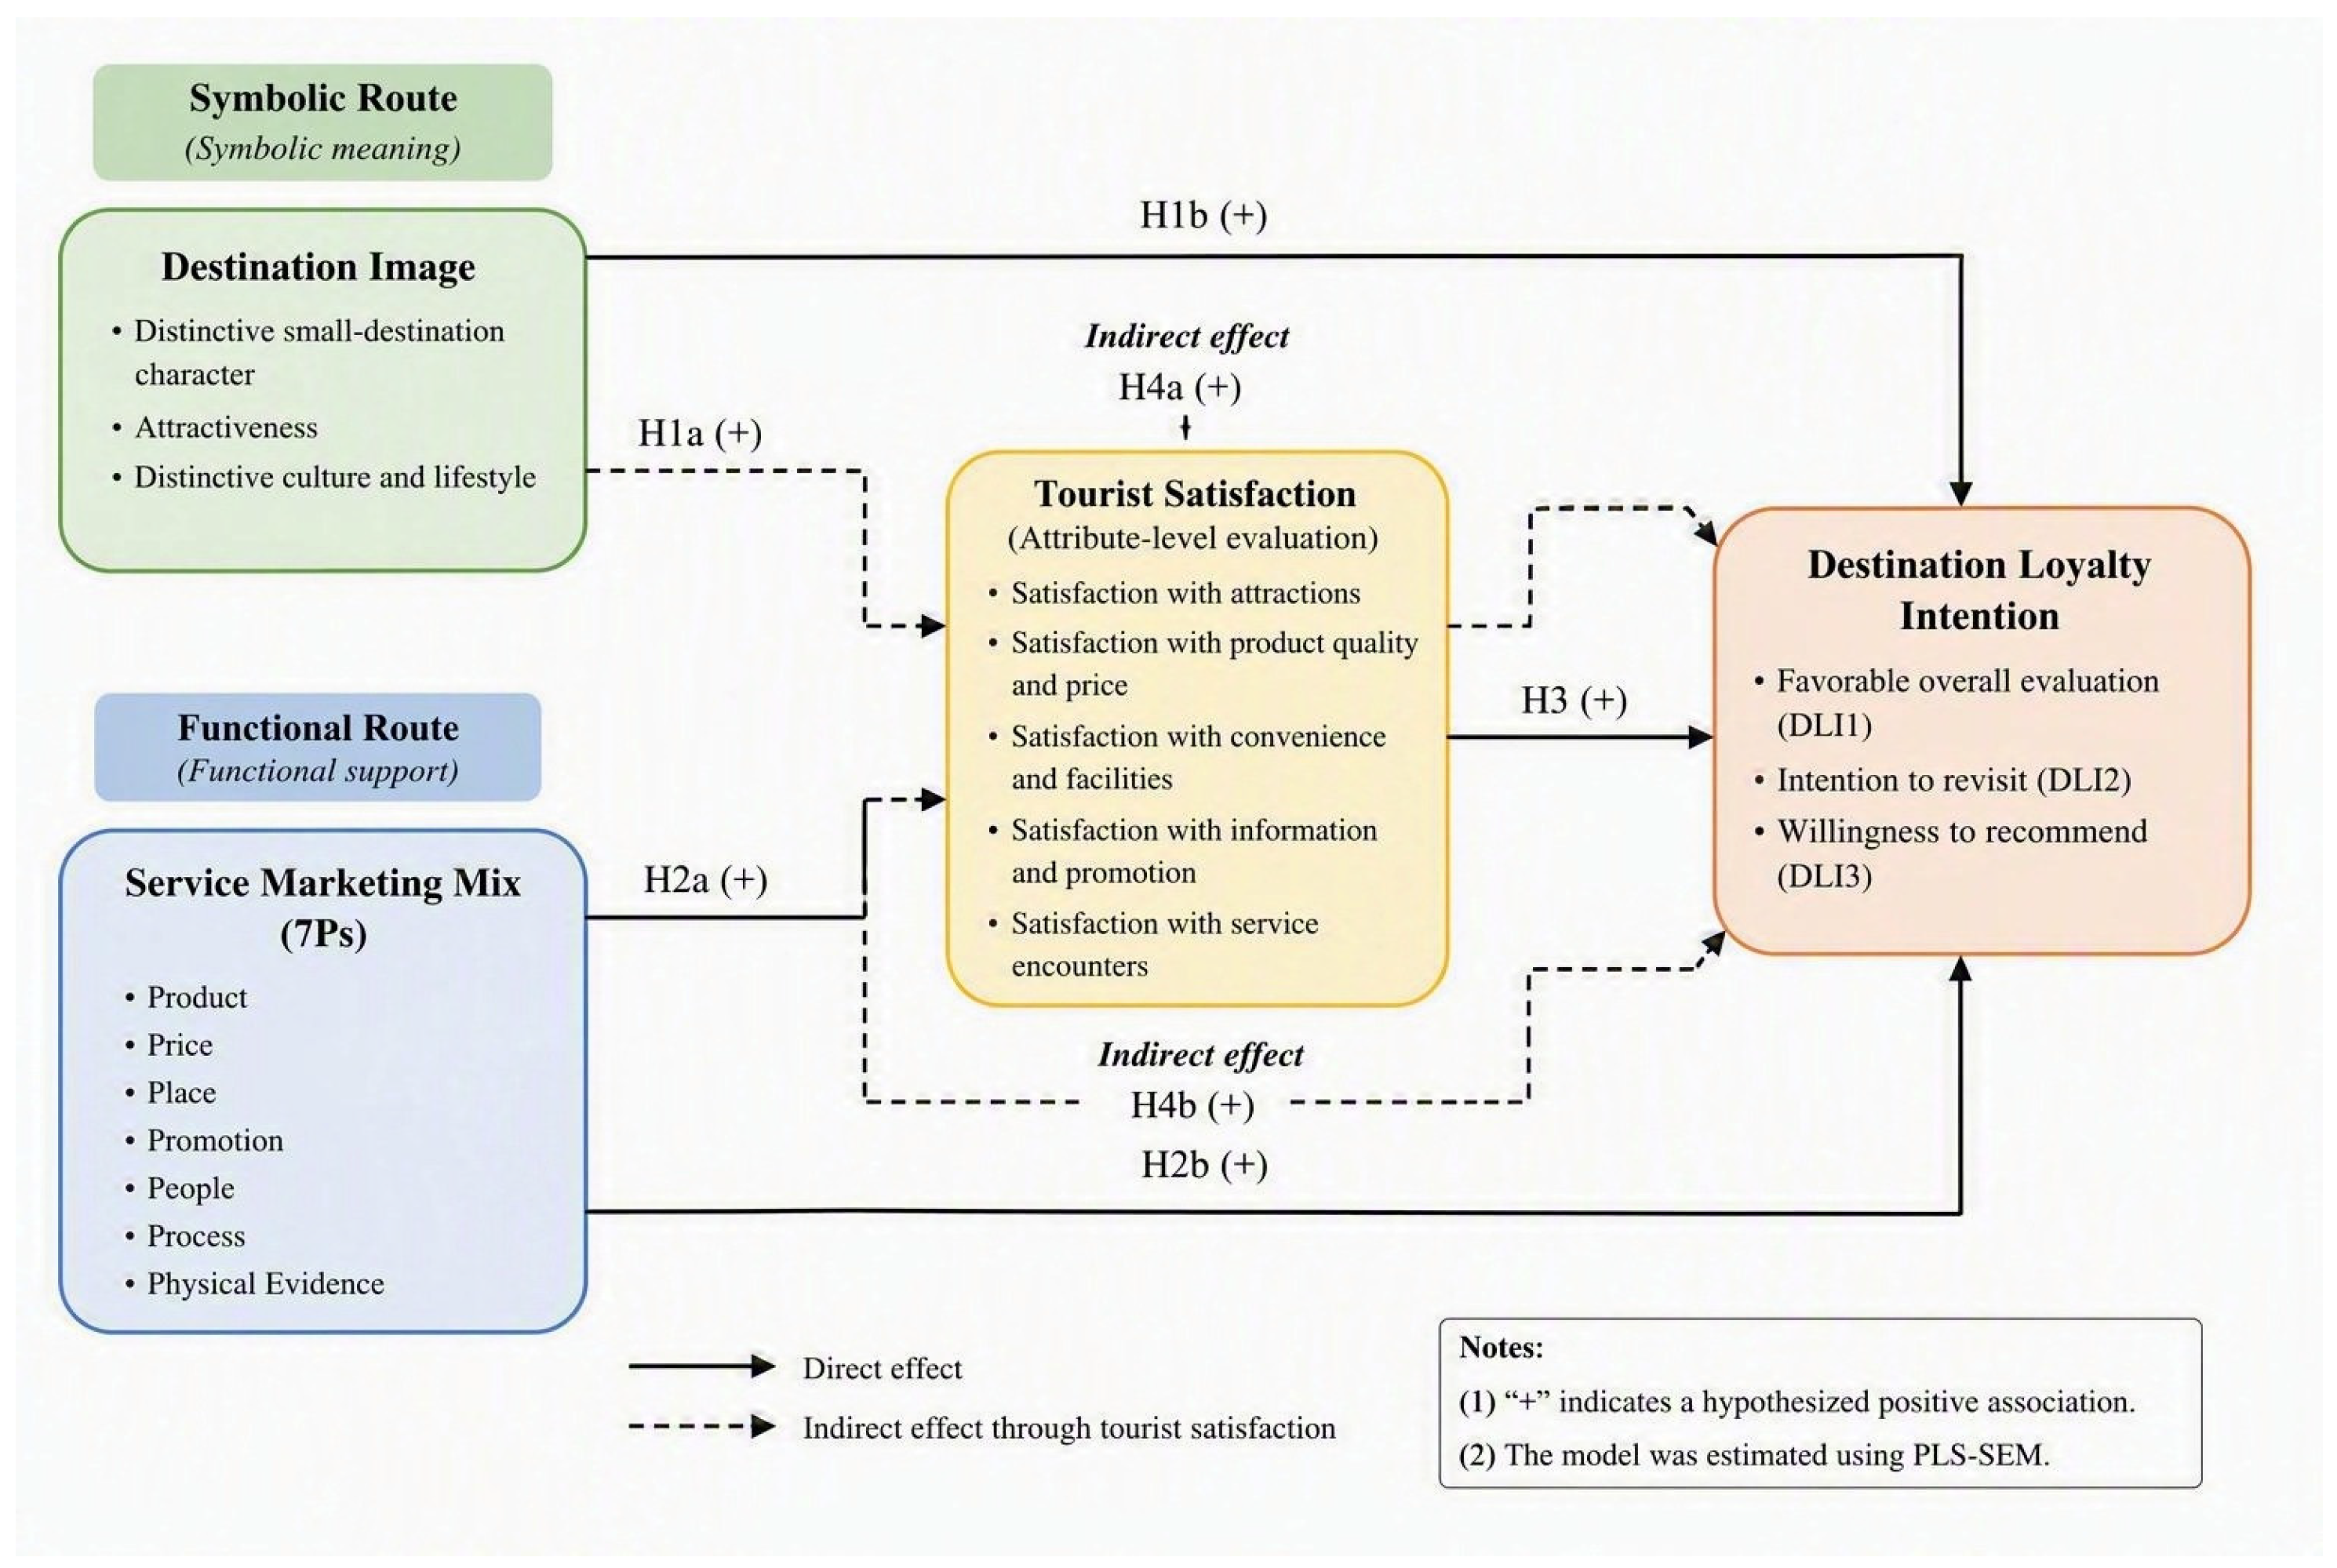
The proposed relationships are summarized in
Figure 1.
3. Methodology
3.1. Research Design and Study Setting
This study employed a quantitative, cross-sectional survey design to examine the theoretically specified associations among destination image, the service marketing mix, tourist satisfaction, and destination loyalty intention. This design was appropriate for estimating the direction and magnitude of the hypothesized relationships among the focal constructs at a single point in time. Because the temporal ordering of the constructs could not be established, the structural paths were interpreted as associations rather than causal effects.
The study was conducted in Pai District, Mae Hong Son Province, northern Thailand. Pai is a small inland tourism destination recognized for its natural attractions, cultural resources, relaxed atmosphere, and tourism economy. Previous research has characterized Pai as a destination shaped by multiple representations, including ethnic tourism, international backpacking, and Thai romantic tourism (
Pongajarn et al., 2014). Its development further reflects interactions among tourists, residents, tourism enterprises, public institutions, and community stakeholders (
Pongajarn, 2017).
Pai provides an appropriate setting for examining the proposed symbolic–functional framework because tourists’ experiences of the destination involve both symbolic meanings and functional service conditions. Its natural landscape, distinctive culture, and small-town character contribute to its destination image, whereas its tourism offerings, prices, accessibility, promotional communication, service personnel, delivery processes, and physical facilities constitute the functional environment supporting tourism consumption. This setting therefore allows the study to examine the respective associations of symbolic destination meaning and functional destination support with tourist satisfaction and destination loyalty intention.
3.2. Target Population, Sampling, and Data Collection
The target population comprised Thai domestic tourists who had previously visited Pai. Prior visitation was used as an eligibility criterion because respondents required direct experience of the destination to evaluate its image, service-marketing conditions, and tourism attributes, as well as to report their intentions to revisit and recommend Pai. International tourists were not included in the target population or analytical sample.
Data were collected from 1 to 30 November 2025 using a self-administered online questionnaire developed in Google Forms. The survey invitation was distributed through travel-related Facebook communities, including the Thailand Travel Advice group. Purposive nonprobability sampling was used to identify individuals who met the prior-visitation criterion. Because participation depended on respondents voluntarily accessing and completing the online questionnaire, the recruitment procedure also involved self-selection.
A screening question was presented at the beginning of the questionnaire to determine whether potential respondents had previously visited Pai. A total of 400 individuals answered the screening question. Of these, 231 respondents confirmed that they had previously visited Pai and were eligible to complete the substantive questionnaire. The remaining 169 individuals were excluded because they lacked direct experience of the destination. After data screening, all 231 eligible responses were retained as the final analytical sample, representing 57.8% of the individuals who answered the screening question.
The online recruitment procedure provided access to geographically dispersed domestic tourists but did not produce a sampling frame from which respondents could be randomly selected. Consequently, the sample should not be interpreted as statistically representative of all Thai domestic tourists visiting Pai. The sample also reflected voluntary participation in online travel communities, which may have increased the representation of younger and more digitally engaged tourists.
Before beginning the questionnaire, respondents received information regarding the study’s purpose, participation procedures, voluntary nature, confidentiality protections, intended use of the data, and their right to discontinue participation without penalty. Adult respondents provided electronic informed consent before proceeding to the questionnaire. Seven respondents were younger than 18 years. For each minor respondent, electronic permission from a parent or legal guardian and electronic assent from the respondent were obtained before participation. The study was determined to be exempt from full ethical review by the Khon Kaen University Ethics Committee for Human Research under exemption reference no. 1582/2567, dated 25 June 2024. The exemption applied to research involving survey procedures.
3.3. Sample-Size Justification
The minimum required sample was evaluated through an a priori statistical power analysis using G*Power 3.1. The calculation was based on the endogenous construct with the largest number of predictors. Destination loyalty intention had three predictors: destination image, the service marketing mix, and tourist satisfaction. Using a linear multiple-regression model with three predictors, a medium effect size of
f2 = 0.15, a significance level of α = 0.05, and statistical power of 0.95, the analysis indicated a minimum sample of 119 respondents. The assumed effect size followed
Cohen’s (
1992) conventional guidelines for statistical power analysis.
The final sample of 231 respondents exceeded the minimum requirement by 112 cases and was approximately 1.94 times the required sample. It was therefore considered sufficient for detecting a medium overall effect under the specified assumptions and for estimating the proposed PLS-SEM model. Nevertheless, exceeding the statistical minimum does not eliminate the limitations associated with purposive online sampling or establish the representativeness of the sample.
3.4. Questionnaire Development and Measurement
The questionnaire measured four constructs: destination image, the service marketing mix, tourist satisfaction, and destination loyalty intention. The measurement items were adapted from previous studies and contextualized to reflect Thai domestic tourists’ experiences of Pai. All substantive items were assessed using a seven-point Likert-type scale ranging from 1, “strongly disagree,” to 7, “strongly agree.”
In the primary model, all four constructs were specified reflectively. Under this specification, the indicators were interpreted as observed manifestations of their corresponding latent constructs, such that variation in an underlying construct was expected to correspond with variation across its indicators. The adequacy of the primary reflective specifications was assessed using indicator reliability, internal consistency reliability, convergent validity, and discriminant validity. Because the seven service-marketing indicators represent substantively distinct components of destination service provision, the service marketing mix was additionally re-estimated as a formative composite in a robustness analysis.
3.4.1. Destination Image
Destination image was measured using three reflective indicators adapted from
Baloglu and McCleary (
1999) and
Beerli and Martín (
2004). The indicators captured respondents’ perceptions of Pai as a distinctive small tourism destination, an attractive tourism destination, and a destination characterized by a distinctive culture and lifestyle.
Within the proposed framework, destination image represents the symbolic meaning that tourists assign to Pai following their visit. The indicators were specified reflectively because they were treated as manifestations of tourists’ broader perceptions of Pai’s attractiveness and distinctiveness. A more favorable destination image was therefore expected to be reflected in more favorable responses across the three indicators.
The measure captures selected context-specific aspects of Pai’s post-visit image rather than the complete conceptual domain of destination image. In particular, it does not provide separate comprehensive measures of cognitive and affective image. The construct should therefore be interpreted as a focused representation of Pai’s symbolic attractiveness and distinctiveness rather than as an exhaustive measurement of all destination-image dimensions.
3.4.2. Service Marketing Mix
The service marketing mix was measured using seven reflective indicators adapted from
Verma and Rathore (
2018). Each indicator corresponded to one component of the extended service marketing mix: product, price, place, promotion, people, process, and physical evidence. Collectively, the indicators assessed tourists’ perceptions of the extent to which Pai’s tourism service environment provided appropriate products, reasonable prices, convenient access, effective communication, responsive service personnel, manageable service processes, and supportive physical facilities.
In the primary model, the service marketing mix was conceptualized as tourists’ shared overall evaluation of functional destination support. The reflective specification assumes that tourists can develop a generalized perception of how effectively Pai’s tourism service environment supports destination consumption. Variation in this broader evaluation was therefore expected to correspond, on average, with evaluations of the destination’s tourism products, prices, accessibility, communication, service personnel, service processes, and physical evidence. Under this interpretation, the indicators represent related manifestations of an overall evaluative orientation toward the functioning of the destination service environment.
This specification does not imply that the seven components are conceptually identical or that favorable performance in one component necessarily guarantees favorable performance in all others. Rather, it assumes that respondents’ evaluations of the individual components may share a common evaluative basis. For example, tourists who perceive Pai’s tourism environment as generally supportive may tend to evaluate several of its service conditions favorably, even though their evaluations are not expected to be uniform across all seven components. The reflective specification therefore captures the shared variance among the component evaluations without treating their substantive content as interchangeable.
The seven service-marketing items were developed and contextualized with reference to the product, price, place, promotion, people, process, and physical-evidence components discussed in the tourism service-marketing literature, including
Verma and Rathore (
2018). Because the cited study did not provide comprehensive psychometric validation of a reflective seven-item scale, its citation supports the conceptual coverage of the 7Ps rather than prior validation of the present reflective measurement instrument.
The primary reflective specification was evaluated through indicator loadings, internal consistency reliability, convergent validity, and discriminant validity. However, because product, price, place, promotion, people, process, and physical evidence also represent distinct and potentially non-interchangeable conditions that may collectively form functional destination support, a formative-composite specification is theoretically plausible. The complete model was therefore re-estimated by specifying the seven components formatively as a robustness analysis. This alternative analysis examined whether the principal direct structural conclusions were sensitive to the reflective measurement assumption. The formative assessment considered indicator collinearity, outer weights, outer loadings, and the stability of the direct structural relationships.
3.4.3. Tourist Satisfaction
Tourist satisfaction was measured using five reflective indicators adapted from
Samith and Karnjanakit (
2022). The indicators assessed satisfaction with tourism attractions, the quality and price of tourism products and services, convenience and facilities, tourism information and promotional communication, and services provided by tourism employees and members of the local community.
The indicators were specified reflectively because they were treated as manifestations of respondents’ underlying satisfaction with the measured attributes of their experiences in Pai. Tourists with more favorable evaluations of their experiences were therefore expected to report higher satisfaction across these destination attributes.
Because the indicators refer to specific components of the tourism experience, the construct was interpreted as an aggregate attribute-level evaluation of tourists’ experiences in Pai, rather than as a purely global measure of destination satisfaction. This interpretation aligns the conceptual meaning of the construct with its observed indicators. It also distinguishes tourist satisfaction from destination image, which captures symbolic destination meaning, and from the service marketing mix, which captures tourists’ broader perceptions of functional destination support.
3.4.4. Destination Loyalty Intention
Destination loyalty intention was measured using three reflective indicators adapted from
Lamai et al. (
2020). DLI2 measured respondents’ intention to revisit Pai, while DLI3 measured their willingness to recommend Pai to other people. These two items directly capture the principal conative expressions of destination loyalty intention examined in this study. DLI1 assessed respondents’ favorable overall evaluation of Pai’s tourism services, including attractions, accommodation, restaurants, service employees, and community interactions.
DLI1 does not express a future behavioral intention as directly as DLI2 and DLI3. Instead, it captures the favorable attitudinal–evaluative orientation accompanying respondents’ stated intentions to maintain a positive future relationship with Pai. Its inclusion is based on a broader interpretation of destination loyalty intention as a future-oriented favorable disposition that is reflected principally through revisit and recommendation intentions but may also incorporate an overall positive orientation toward the destination. Under this interpretation, DLI2 and DLI3 define the construct’s primary intentional meaning, while DLI1 provides supplementary attitudinal–evaluative coverage.
The three indicators were specified reflectively because they were treated as related manifestations of respondents’ broader favorable future orientation toward Pai. This specification does not assume that favorable evaluation, revisit intention, and recommendation intention are conceptually identical. Rather, it assumes that respondents with stronger destination loyalty intentions are expected, on average, to evaluate Pai’s tourism services favorably, intend to revisit, and be willing to recommend the destination. The construct should therefore be interpreted as destination loyalty intention with an attitudinal–evaluative component, rather than as a measure composed exclusively of explicit behavioral-intention items.
The term destination loyalty intention was retained because DLI2 and DLI3 constitute the construct’s core and directly represent the two future-oriented outcomes emphasized in the conceptual definition and hypotheses. However, the inclusion of DLI1 broadens the operationalization beyond a purely conative measure. Accordingly, the structural relationships involving this construct are interpreted as associations with a predominantly intentional favorable orientation toward Pai, not as associations with actual revisit or recommendation behavior.
To assess whether the broader evaluative content of DLI1 materially influenced the substantive conclusions, the complete model was re-estimated using only DLI2 and DLI3. Removing DLI1 did not change the direction, statistical significance, or hypothesis decisions of the principal direct structural relationships. This result indicates that the findings concerning destination loyalty intention were not dependent on the inclusion of the attitudinal–evaluative item (see
Table 1).
3.5. Data Analysis
Descriptive statistics were calculated using IBM SPSS Statistics 27, while the measurement and structural models were estimated using partial least squares structural equation modeling in SmartPLS 4. PLS-SEM was selected because the study examined multiple simultaneous relationships and assessed both the explanatory and predictive performance of the proposed model (
Hair et al., 2019;
Shmueli et al., 2019). The analysis proceeded through the assessment of the reflective measurement models, structural model, indirect relationships, and out-of-sample predictive performance.
Before estimating the model, the data were screened for respondent eligibility, completeness, and potential response inconsistencies. Descriptive statistics were then used to summarize the respondents’ demographic characteristics and visitation patterns.
All four constructs were specified reflectively. The reflective measurement models were assessed using indicator loadings, internal consistency reliability, convergent validity, and discriminant validity (
Hair et al., 2019). Indicator reliability was evaluated using the standardized outer loadings. Internal consistency reliability was examined using Cronbach’s alpha, Dijkstra–Henseler’s rho_A, and composite reliability (
Dijkstra & Henseler, 2015). Convergent validity was evaluated using the average variance extracted. The measurement properties of the service marketing mix were interpreted cautiously because its seven indicators represented substantively different aspects of functional destination support.
Discriminant validity was assessed using the Fornell–Larcker criterion and the heterotrait–monotrait ratio of correlations. Under the Fornell–Larcker criterion, the square root of each construct’s average variance extracted was compared with its correlations with the other constructs. HTMT values and, where available, their bootstrapped confidence intervals were examined to determine whether the constructs were empirically distinguishable (
Henseler et al., 2015).
Indicator-level collinearity was additionally examined using variance inflation factor values. Although VIF is not a primary criterion for evaluating reflective measurement models, it was reported as a supplementary diagnostic to determine whether excessive overlap among indicators could affect the stability of the estimates. Indicator VIF values were not used as substitutes for outer loadings, internal consistency reliability, convergent validity, or discriminant validity.
After the reflective measurement models had been assessed, the structural model was evaluated. Collinearity among the predictor constructs was examined using inner-model VIF values. The hypothesized relationships were then assessed using standardized path coefficients, bootstrap standard errors, t-values, p-values, and 95% bootstrap confidence intervals. Statistical inference was based on 5000 bootstrap subsamples and a two-tailed significance level of 0.05.
The structural model’s explanatory power was assessed using the coefficients of determination, R2 and adjusted R2, for tourist satisfaction and destination loyalty intention. The relative contribution of each predictor to the explanatory power of its corresponding endogenous construct was evaluated using f2 effect sizes. Values of 0.02, 0.15, and 0.35 were used as conventional reference points for small, medium, and large effect sizes, respectively.
The indirect role of tourist satisfaction was evaluated by estimating the specific indirect associations of destination image and the service marketing mix with destination loyalty intention. The analysis reported the direct, specific indirect, and total effects, together with their bootstrap standard errors, t-values, p-values, and 95% bootstrap confidence intervals. An indirect association was regarded as statistically supported when the confidence interval generated by the selected bootstrap procedure did not include zero. Confidence intervals and p-values were drawn from the same bootstrap specification wherever possible to maintain inferential consistency. Any discrepancy between these inferential criteria was reported transparently and interpreted cautiously.
The term “mediation analysis” is used as a conventional statistical label for the estimation of specific indirect associations. Given the cross-sectional design, a statistically supported indirect association was not interpreted as evidence that the predictor temporally preceded satisfaction or that satisfaction causally produced loyalty intention.
The model’s out-of-sample predictive relevance was assessed using PLSpredict (
Shmueli et al., 2019). Q
2predict values were examined to determine whether the PLS-SEM model produced smaller prediction errors than the naïve mean-based benchmark. Root mean squared error and mean absolute error were also reported. Where linear-model benchmark results were available, indicator-level prediction errors from the PLS-SEM model were compared with those of the linear model to assess the model’s relative predictive performance. In the absence of such benchmark comparisons, positive Q
2predict values were interpreted only as evidence of basic predictive relevance rather than as evidence of high predictive power.
To assess sensitivity to the reflective specification of the service marketing mix, the complete structural model was additionally re-estimated by treating product, price, place, promotion, people, process, and physical evidence as formative components of perceived functional destination support. The formative measurement assessment examined the outer VIF values, the magnitude and statistical significance of the outer weights, and the indicators’ outer loadings. Indicators with nonsignificant outer weights were not removed automatically when their outer loadings demonstrated relevant absolute contributions and their retention was necessary to preserve the conceptual coverage of the 7Ps. The direct structural coefficients and hypothesis decisions obtained from the alternative specification were then compared with those of the primary reflective model. This analysis was conducted as a robustness assessment and did not replace the primary measurement specification.
The operationalization of destination loyalty intention was also subjected to a robustness assessment. The primary specification included DLI1, DLI2, and DLI3, with DLI2 and DLI3 representing the construct’s core revisit and recommendation intentions and DLI1 providing supplementary attitudinal–evaluative coverage. The complete model was re-estimated using only DLI2 and DLI3 to determine whether the structural conclusions were sensitive to the inclusion of DLI1. The direction, statistical significance, and hypothesis decisions of the direct structural relationships were compared across the three-item and two-item specifications.
The standardized coefficients were compared descriptively to identify their relative numerical magnitudes. However, a numerically larger coefficient was not interpreted as statistically stronger unless the difference between the relevant path coefficients was formally tested. Because the data were cross-sectional and observational, the structural paths were interpreted as theoretically specified associations rather than causal relationships. Causal terms such as “caused,” “influenced,” and “affected” were avoided except when referring to conventional statistical terms, including direct effect, indirect effect, total effect, and effect size.
3.6. Common Method Bias Assessment
Because the predictor and outcome constructs were measured through the same self-administered questionnaire and reported by the same respondents, procedural and statistical measures were used to address the possibility of common method bias.
Several procedural measures were incorporated into the survey administration. Participation was voluntary, and respondents were informed that their answers would remain confidential and would be analyzed only in aggregate form. No personally identifying information was collected. The survey instructions emphasized that there were no correct or incorrect responses and encouraged respondents to answer according to their own experiences of Pai. The measurement items were grouped according to their corresponding constructs and worded in a direct and context-specific manner to reduce ambiguity and evaluation apprehension.
Common method bias was also examined statistically using the full-collinearity assessment. In this procedure, every latent construct was treated as an endogenous construct and regressed on the remaining latent constructs. The resulting full-collinearity VIF values were examined to determine whether common variance associated with the measurement method was likely to critically distort the model estimates.
Full-collinearity VIF values below 3.3 were interpreted as indicating that pathological collinearity and substantial common method bias were unlikely to represent critical concerns. However, this diagnostic was treated as supplementary rather than definitive because no single statistical test can establish the complete absence of common method bias. The statistical results were therefore considered together with the procedural measures incorporated into questionnaire administration.
Common method bias was assessed using Harman’s single-factor test and full-collinearity VIFs. An unrotated principal component analysis of all 18 measurement indicators extracted four components with eigenvalues exceeding 1.0. The first component explained 29.655% of the total variance, below the conventional threshold of 50%. The Kaiser–Meyer–Olkin value was 0.837, and Bartlett’s test of sphericity was significant, χ2(153) = 1509.042, p < 0.001. In addition, the full-collinearity VIFs ranged from 1.083 to 1.542, below the recommended threshold of 3.3. Collectively, these findings indicate that common method bias was unlikely to materially influence the study results.
4. Findings
4.1. Respondent Characteristics
Table 2 presents the demographic characteristics and visitation frequency of the 231 Thai domestic tourists included in the analysis. The sample comprised respondents who self-identified under the questionnaire categories of female (45.9%), male (39.0%), and LGBTQ+ (15.2%). The LGBTQ+ category reproduces the self-identification option provided in the original questionnaire and should not be interpreted as a homogeneous gender category because it may encompass diverse sexual orientations and gender identities. This demographic variable was reported descriptively and was not included in the PLS-SEM estimation. Students constituted the largest occupational group (51.1%), followed by respondents reporting other occupations (14.7%), freelance workers (13.9%), office workers (13.4%), and civil servants (6.9%).
Most respondents were aged 18 to 25 years (58.9%), followed by those aged 26 to 33 years (24.7%). Seven respondents (3.0%) were younger than 18 years. Regarding monthly income, 25.1% reported earning THB 10,000 or less, while the THB 10,001 to 15,000 and THB 15,001 to 20,000 categories each accounted for 20.8% of the sample.
Most respondents reported visiting Pai once or twice during the previous year (71.4%). A further 15.2% reported three or four visits, 6.9% reported five visits, and 6.5% reported more than five visits. The sample was therefore composed primarily of young Thai domestic tourists, many of whom were students and had visited Pai relatively infrequently during the preceding year.
4.2. Primary Reflective Measurement Model
All four constructs were specified reflectively in the primary model. Their measurement properties were evaluated using standardized indicator loadings, Cronbach’s alpha, Dijkstra–Henseler’s rho_A, composite reliability, average variance extracted, and discriminant validity. Reliability coefficients of approximately 0.70 or higher and AVE values of 0.50 or higher were used as general reference criteria (
Hair et al., 2019). These criteria were interpreted as guidelines rather than rigid cut-off values, particularly for constructs measured using a small number of indicators.
4.2.1. Indicator Reliability
Standardized outer loadings were examined to assess indicator reliability. Loadings of approximately 0.708 or higher are preferred because they indicate that a construct explains at least 50% of an indicator’s variance. Indicators with loadings between 0.40 and 0.708 should not be removed automatically; retention should consider theoretical relevance, content validity, and whether deletion improves construct-level reliability and convergent validity (
Hair et al., 2022,
2019). As shown in
Table 3, the loadings ranged from 0.518 to 0.912, and no indicator loaded below 0.40. All tourist-satisfaction and destination-loyalty indicators exceeded the preferred level. For destination image, DI2 and DI3 demonstrated strong loadings of 0.912 and 0.845, respectively, whereas DI1 had a weaker loading of 0.518. DI1 was retained because it captures Pai’s distinctive small-destination identity, content not fully represented by the other image indicators, while destination image retained acceptable composite reliability and AVE. The service-marketing indicators ranged from 0.607 to 0.765. Although several fell below 0.708, all were retained because they represent the theoretically relevant product, price, place, promotion, people, process, and physical-evidence components. Removing indicators solely to improve the measurement statistics would narrow the construct’s content. Nevertheless, the moderate service-marketing loadings and AVE of 0.466 indicate that its convergent validity remained marginal. Overall, the results provided adequate but uneven support for indicator reliability and justified proceeding with the construct-level reliability and validity assessment.
4.2.2. Internal Consistency and Convergent Validity
Internal consistency reliability was assessed using Cronbach’s alpha, Dijkstra–Henseler’s rho_A, and composite reliability, while convergent validity was evaluated using the average variance extracted (AVE). Reliability coefficients of approximately 0.70 or higher and an AVE of 0.50 or higher were used as general evaluation criteria (
Fornell & Larcker, 1981;
Hair et al., 2019). These thresholds were treated as diagnostic guidelines rather than strict pass-or-fail rules because measurement quality should be evaluated by considering multiple statistical criteria, indicator performance, theoretical content, and the study context. Accordingly, the reliability and validity of each construct were assessed collectively rather than on the basis of a single coefficient.
As reported in
Table 4, destination image demonstrated satisfactory internal consistency reliability, with a Cronbach’s alpha of 0.793, rho_A of 0.877, and composite reliability of 0.814. All three coefficients exceeded the recommended value of 0.70. The construct also produced an AVE of 0.605, indicating that destination image explained 60.5% of the variance in its indicators. These results provide satisfactory evidence of both internal consistency reliability and convergent validity.
Destination loyalty intention also demonstrated satisfactory measurement properties. Its Cronbach’s alpha was 0.782, rho_A was 0.785, and composite reliability was 0.874. The AVE of 0.698 exceeded the recommended minimum of 0.50, indicating that the construct explained 69.8% of the variance in its indicators. Taken together, these results support the internal consistency reliability and convergent validity of destination loyalty intention.
The service marketing mix demonstrated satisfactory internal consistency reliability, with a Cronbach’s alpha of 0.812, rho_A of 0.817, and composite reliability of 0.859. The consistency among these coefficients provides evidence that the indicators reliably represent the service marketing mix construct. Composite reliability is particularly relevant in PLS-SEM because it accounts for differences in indicator loadings, whereas Cronbach’s alpha assumes equal indicator contributions. The agreement among all three reliability coefficients therefore supports the internal consistency of the construct.
However, the AVE of the service marketing mix was 0.466, which was slightly below the recommended value of 0.50. This result indicates that the construct explained 46.6% of the variance in its indicators and, therefore, did not fully meet the conventional criterion for convergent validity. Nevertheless, the shortfall was modest, amounting to only 0.034 below the reference value, while the three internal consistency coefficients were satisfactory.
An AVE between 0.40 and 0.50 may be interpreted cautiously when composite reliability is satisfactory because a high composite reliability value indicates that the indicators consistently represent the underlying construct, even when the average variance extracted is slightly below 0.50. In the present study, the composite reliability of 0.859 provides supporting evidence for retaining the service marketing mix construct. This interpretation does not imply that the conventional AVE criterion was fully satisfied. Instead, it indicates satisfactory reliability but marginal convergent validity.
The comparatively lower AVE may reflect the conceptual breadth of the service marketing mix. Its indicators represent product, price, place, promotion, people, process, and physical evidence, which capture distinct but theoretically related aspects of the overall service offering. Although respondents may form a general evaluation of the service marketing mix, they may not assess all seven components in an identical manner. This conceptual heterogeneity may reduce the average shared variance among the indicators, even when the construct demonstrates satisfactory internal consistency. Retaining the complete set of indicators preserves the theoretical coverage of the service marketing mix, although its comparatively weaker convergent validity should be considered when interpreting the structural-model results.
Tourist satisfaction demonstrated satisfactory internal consistency reliability, with a Cronbach’s alpha of 0.822, rho_A of 0.855, and composite reliability of 0.870. These coefficients exceeded the recommended value of 0.70. The construct also produced an AVE of 0.574, indicating that tourist satisfaction explained 57.4% of the variance in its indicators. Tourist satisfaction therefore satisfied the recommended criteria for both internal consistency reliability and convergent validity.
No indicators were removed solely to improve Cronbach’s alpha, composite reliability, or AVE. Removing indicators exclusively on statistical grounds could artificially improve the measurement criteria while reducing the conceptual coverage of the constructs. This consideration was particularly relevant to the service marketing mix because deleting an indicator would exclude one of its theoretically important components. The complete set of service marketing mix indicators was therefore retained, and the marginal AVE was considered when interpreting the subsequent structural relationships.
Overall, destination image, destination loyalty intention, and tourist satisfaction demonstrated satisfactory internal consistency reliability and convergent validity. The service marketing mix also demonstrated satisfactory internal consistency reliability, although its AVE indicated marginal rather than fully established convergent validity. Collectively, the measurement results were considered sufficient to proceed with the structural-model assessment, subject to cautious interpretation of relationships involving the service marketing mix.
4.2.3. Discriminant Validity
Discriminant validity was first examined using the Fornell–Larcker criterion, under which the square root of each construct’s AVE should exceed its correlations with the other constructs (
Fornell & Larcker, 1981). As shown in
Table 5, the diagonal values ranged from 0.683 to 0.835 and exceeded the corresponding inter-construct correlations, which ranged from 0.218 to 0.558.
The square root of the AVE for destination image, 0.778, exceeded its correlations with destination loyalty intention, the service marketing mix, and tourist satisfaction. The same pattern was observed for destination loyalty intention, service marketing mix, and tourist satisfaction. The Fornell–Larcker results therefore indicated that each construct shared more variance with its own indicators than with the other constructs.
Discriminant validity was additionally evaluated using the heterotrait–monotrait ratio of correlations (
Henseler et al., 2015). As shown in
Table 6, the HTMT values ranged from 0.241 to 0.728, remaining below the conservative threshold of 0.85. The highest HTMT values occurred between destination image and the service marketing mix, 0.728, and between destination image and destination loyalty intention, 0.726. These results provide additional evidence that the constructs were empirically distinguishable.
4.3. Indicator-Level Collinearity Assessment
Indicator-level VIF values were examined as a supplementary diagnostic for the primary reflective model. Because the constructs were specified reflectively in the primary analysis, these values were not used to assess indicator reliability or to replace the outer-loading analysis. The service-marketing VIF values were subsequently reconsidered as part of the formative measurement assessment in the alternative robustness model reported in
Section 4.10.1.
All original indicator VIF values were below the conservative threshold of 3.0, ranging from 1.035 for DI1 to 2.148 for TS4. The upper boundaries of their 95% bootstrap confidence intervals also remained below 3.0. For the service marketing mix, the VIF values ranged from 1.321 for SM1 to 1.795 for SM5. These results indicate that excessive indicator overlap was not evident in the primary model. The service-marketing VIF values also remained below the conservative criterion when the seven indicators were treated as formative components in the alternative model (see
Table 7).
4.4. Structural-Model Collinearity
Before testing the structural relationships, collinearity among the predictor constructs was examined using inner-model VIF values. As shown in
Table 8, the VIF values ranged from 1.082 to 1.422. The upper boundaries of the 95% bias-corrected confidence intervals ranged from 1.194 to 1.746. All values were substantially below the conservative threshold of 3.0, indicating that predictor collinearity was unlikely to critically distort the estimated structural coefficients (
Hair et al., 2022).
4.5. Structural Model Assessment
The hypothesized structural relationships were assessed using bootstrapping with 5000 subsamples and a two-tailed significance level of 0.05. As shown in
Table 9, four of the five direct hypotheses were supported.
Destination image was positively associated with tourist satisfaction, β = 0.199, t = 2.608, p = 0.009, supporting H1a. Destination image was also positively associated with destination loyalty intention, β = 0.330, t = 4.841, p < 0.001, supporting H1b.
The service marketing mix was not significantly associated with tourist satisfaction, β = 0.114, t = 1.252, p = 0.211. H2a was therefore not supported. However, the service marketing mix was positively associated with destination loyalty intention, β = 0.356, t = 5.464, p < 0.001, supporting H2b.
Tourist satisfaction was positively associated with destination loyalty intention, β = 0.134, t = 2.391, p = 0.017, supporting H3. Among the three predictors of loyalty intention, the service marketing mix produced the numerically largest standardized coefficient, followed by destination image and tourist satisfaction. This ordering should not be interpreted as evidence that the coefficients differed significantly unless a formal coefficient-difference test is reported.
4.6. Explanatory Power
The explanatory power of the structural model was evaluated using the coefficients of determination for the endogenous constructs. Destination image, the service marketing mix, and tourist satisfaction jointly explained 42.0% of the variance in destination loyalty intention, R2 = 0.420. This value indicates moderate explanatory power.
Destination image and the service marketing mix jointly explained 7.6% of the variance in tourist satisfaction, R
2 = 0.076. This value indicates weak explanatory power and suggests that most of the variance in tourists’ satisfaction with Pai’s destination attributes was associated with factors not included in the model (see
Table 10).
4.7. Effect-Size Assessment
The f2 effect sizes were examined to assess each predictor’s contribution to the explanatory power of its corresponding endogenous construct. Values of 0.02, 0.15, and 0.35 were used as conventional reference points for small, medium, and large effect sizes, respectively.
The service marketing mix had a medium effect size for destination loyalty intention, f2 = 0.157. Destination image had a small effect size approaching the medium reference point, f2 = 0.132. Tourist satisfaction had a small effect size for destination loyalty intention, f2 = 0.029.
Destination image had a small effect size for tourist satisfaction,
f2 = 0.031, whereas the service marketing mix had a negligible effect size,
f2 = 0.010. The effect-size pattern therefore indicates that destination image and the service marketing mix contributed more to the explained variance in loyalty intention than to the explained variance in tourist satisfaction (see
Table 11).
4.8. Predictive Relevance
The model’s out-of-sample predictive relevance was assessed using PLSpredict (
Shmueli et al., 2019). Both endogenous constructs produced positive Q
2predict values, indicating that the PLS-SEM predictions outperformed the naïve mean-based benchmark.
Destination loyalty intention produced Q
2predict = 0.387, RMSE = 0.795, and MAE = 0.642. Tourist satisfaction produced a substantially smaller positive value, Q
2predict = 0.043, with RMSE = 0.999 and MAE = 0.727. These results indicate basic predictive relevance for both endogenous constructs, with stronger predictive relevance for destination loyalty intention than for tourist satisfaction. The low Q
2predict value for tourist satisfaction is consistent with its low R
2 value of 0.076, suggesting that destination image and the service marketing mix provided limited information for predicting tourists’ satisfaction evaluations (see
Table 12).
4.9. Specific Indirect Associations Testing
The specific indirect associations of destination image and the service marketing mix with destination loyalty intention through tourist satisfaction were assessed using bootstrapping. Interpretation focused on whether the 95% bootstrap confidence interval for each indirect association included zero. A confidence interval excluding zero was interpreted as statistical support for an indirect association consistent with the proposed theoretical sequence. Because all constructs were measured concurrently, such support does not establish temporal mediation, causal ordering, or a mechanism through which one construct produced change in another (
Zhao et al., 2010).
As shown in
Table 13, destination image had a small positive specific indirect association with destination loyalty intention through tourist satisfaction, β = 0.027. The bootstrap mean was 0.030, with a small positive bias of 0.004, and the 95% bootstrap confidence interval, [0.002, 0.069], excluded zero. H4a was therefore statistically supported. This pattern is consistent with the proposed sequence linking destination image, satisfaction, and loyalty intention.
The direct association between destination image and destination loyalty intention also remained positive and statistically significant, β = 0.330, t = 4.841, p < 0.001. In conventional mediation terminology, the coexistence of positive direct and indirect associations corresponds statistically to complementary mediation. This classification is used descriptively and does not establish that destination image temporally preceded satisfaction or that satisfaction causally mediated the relationship with loyalty intention. The small magnitude of the indirect association further indicates that the supported statistical pattern was limited in size.
The specific indirect association between the service marketing mix and destination loyalty intention through tourist satisfaction was β = 0.015. The bootstrap mean was 0.019, with a bias of 0.004, and the 95% bootstrap confidence interval ranged from −0.008 to 0.059. Because the interval included zero, H4b was not statistically supported.
The direct association between the service marketing mix and destination loyalty intention remained positive and statistically significant, β = 0.356, t = 5.464, p < 0.001. In conventional mediation terminology, this combination corresponds to direct-only nonmediation. More precisely, the results show a positive direct association but no statistically supported specific indirect association through satisfaction. They do not demonstrate that the service marketing mix operates through a separate causal or temporal route.
Overall, the indirect-association analysis identified differentiated statistical patterns. Destination image exhibited both a positive direct association with loyalty intention and a small positive specific indirect association through satisfaction. The service marketing mix exhibited a positive direct association with loyalty intention, whereas its specific indirect association through satisfaction was not supported. These patterns are consistent with the symbolic, functional, and evaluative distinctions proposed by the framework, but they do not establish distinct temporal pathways or causal mechanisms.
4.10. Robustness Analyses
4.10.1. Alternative Formative Specification of the Service Marketing Mix
To assess whether the principal structural conclusions were sensitive to the reflective specification of the service marketing mix, the model was re-estimated by treating product, price, place, promotion, people, process, and physical evidence as formative components of perceived functional destination support. This alternative specification recognizes that the seven components represent distinct and potentially non-interchangeable aspects of destination service provision that collectively form the destination’s functional-support environment.
The outer VIF values for SM1 to SM7 ranged from 1.321 to 1.795, indicating that indicator collinearity was not problematic. The outer weights of SM1, SM3, SM4, and SM7 were statistically significant. Although the outer weights of SM2, SM5, and SM6 were not statistically significant, their outer loadings were positive and statistically significant. These indicators were therefore retained because they demonstrated relevant absolute contributions and represented theoretically necessary components of the extended service marketing mix.
SM3 exhibited a negative and statistically significant outer weight but a positive and statistically significant outer loading. This pattern indicates that its unique contribution, conditional on the remaining service-marketing components, differed from its positive absolute association with the composite. Given its acceptable VIF and theoretical importance to the place and accessibility component, SM3 was retained and interpreted cautiously.
The direct structural conclusions remained stable under the alternative specification. Destination image remained positively associated with tourist satisfaction, β = 0.164, p = 0.047, and destination loyalty intention, β = 0.294, p < 0.001. The service marketing mix remained positively associated with destination loyalty intention, β = 0.417, p < 0.001, whereas its association with tourist satisfaction remained statistically unsupported at the 5% level, β = 0.172, p = 0.066. Tourist satisfaction also remained positively associated with destination loyalty intention, β = 0.111, p = 0.046. Thus, the direction and hypothesis decisions of all direct relationships were unchanged under the alternative measurement specification.
These findings indicate that the principal conclusions concerning the direct structural associations were not dependent on specifying the service marketing mix reflectively. Specifically, the directions and hypothesis decisions for the direct associations among destination image, functional destination support, tourist satisfaction, and loyalty intention remained unchanged. The alternative model is presented as a robustness assessment of the direct structural relationships rather than as a replacement for the primary analytical specification (
Table 14).
4.10.2. Alternative Operationalization of Destination Loyalty Intention
The primary model operationalized destination loyalty intention using three indicators. DLI2 and DLI3 directly captured revisit and recommendation intentions, whereas DLI1 captured respondents’ favorable overall evaluation of Pai’s tourism services. Because DLI1 represents an attitudinal–evaluative orientation rather than an explicit future behavioral intention, the complete model was re-estimated after removing DLI1. In this alternative specification, destination loyalty intention was measured exclusively through revisit and recommendation intentions.
The direct structural conclusions remained substantively stable. Destination image remained positively associated with destination loyalty intention, β = 0.314, t = 4.749, p < 0.001. The service marketing mix also remained positively associated with destination loyalty intention, β = 0.327, t = 4.751, p < 0.001, and tourist satisfaction remained positively associated with destination loyalty intention, β = 0.153, t = 2.731, p = 0.006. The relationships predicting tourist satisfaction were unchanged because the operationalization of tourist satisfaction and its predictors remained the same.
Removing DLI1 did not change the direction, statistical significance, or hypothesis decisions of the principal direct relationships. The results therefore indicate that the observed associations with destination loyalty intention were not dependent on including the broader attitudinal–evaluative content of DLI1.
The three-item specification was retained as the primary model because the study adopts a predominantly intentional conception of destination loyalty in which revisit and recommendation intentions constitute the core content, while DLI1 provides supplementary coverage of the favorable attitudinal orientation accompanying those intentions. Nevertheless, the construct is not characterized as a purely conative measure, and no claim is made that DLI1 itself represents an explicit behavioral intention.
5. Discussion
The findings provide partial support for the proposed symbolic–functional framework of destination loyalty intention. Destination image was positively associated with tourist satisfaction and destination loyalty intention, while the service marketing mix was positively associated with loyalty intention but not satisfaction. Tourist satisfaction was also positively associated with loyalty intention. The specific indirect association involving destination image was statistically supported, whereas the corresponding indirect association involving the service marketing mix was not. These findings indicate differentiated patterns of direct and indirect association among symbolic destination meaning, perceived functional destination support, attribute-level satisfaction, and loyalty intention. The terms symbolic, functional, and evaluative “routes” organize these theoretical distinctions and do not imply that the cross-sectional results establish separate temporal or causal mechanisms.
5.1. Destination Image as a Symbolic Route
Destination image was positively associated with tourist satisfaction, supporting H1a. This finding is consistent with previous research demonstrating that tourists’ cognitive beliefs and affective impressions are related to their post-visit evaluations (
Chen & Tsai, 2007;
Chi & Qu, 2008). Within the context of Pai, favorable perceptions of the destination’s attractiveness, distinctive small-destination character, and culture and lifestyle corresponded with more favorable evaluations of its tourism attributes.
The result is consistent with the proposed symbolic interpretation because destination image captures a broader representation of what Pai means to tourists. Visitors who perceive Pai as attractive and distinctive may evaluate its attractions, value, accessibility, information, and service encounters more favorably. Destination image may therefore be theoretically relevant as an interpretive frame associated with tourists’ assessments of destination attributes. However, the cross-sectional design does not establish the temporal direction of this relationship. It is also plausible that favorable experiences with destination attributes contributed to respondents’ reported images of Pai. The finding should consequently be interpreted as an association between favorable destination image and attribute-level satisfaction rather than as evidence that image caused satisfaction.
Destination image was also positively associated with destination loyalty intention, supporting H1b. This result is consistent with evidence that destination image remains related to revisit and recommendation intentions when tourist satisfaction and other evaluative variables are included in the model (
Chen & Tsai, 2007;
Chi & Qu, 2008;
Prayag & Ryan, 2012). A favorable image may make Pai more readily recalled, symbolically meaningful, and distinguishable from competing destinations. Its natural landscape, cultural identity, and relaxed small-town character may create memorable associations that remain relevant when tourists consider future travel or recommend destinations to others.
The coefficient for destination image was numerically larger for loyalty intention than for tourist satisfaction. This pattern is compatible with the proposed argument that symbolic meaning may have particular relevance to tourists’ future orientation toward Pai. However, the difference between these coefficients was not formally tested. It should therefore not be interpreted as evidence that destination image had a statistically stronger association with loyalty intention than with satisfaction. The findings establish that both relationships were positive and statistically significant, but not that their magnitudes differed significantly.
The effect-size results provide further context. Destination image had a small effect size for tourist satisfaction, f2 = 0.031, but a larger, although still small, effect size for destination loyalty intention, f2 = 0.132. In addition, destination image and the service marketing mix jointly explained only 7.6% of the variance in satisfaction. These findings indicate that symbolic destination meaning represents only one component of tourists’ satisfaction evaluations. Other factors, such as perceived value, experience quality, authenticity, safety, crowding, environmental quality, and expectation confirmation, may account for substantial additional variance.
5.2. Service Marketing Mix as a Functional Route
Contrary to H2a, the service marketing mix was not significantly associated with tourist satisfaction. This finding differs from research reporting that service-marketing components are related to tourist satisfaction, although the relevance of individual components varies across tourism settings (
Rahman et al., 2019). The nonsignificant relationship should not be interpreted as evidence that Pai’s tourism products, prices, accessibility, communication, service personnel, processes, and physical facilities are unimportant. Instead, it indicates that respondents’ shared overall evaluation of these conditions did not have a statistically significant association with their attribute-level satisfaction after destination image was included in the model.
One plausible explanation concerns the heterogeneity of the seven service-marketing components. Product, price, place, promotion, people, process, and physical evidence represent substantively different aspects of destination service provision. Tourists may evaluate some components favorably and others less favorably. For example, a respondent may appreciate Pai’s attractions and prices while experiencing difficulties with transportation, tourism information, or physical facilities. This heterogeneity creates a plausible alternative interpretation in which the seven components collectively form functional destination support rather than reflect a homogeneous underlying factor. However, the formative robustness analysis produced the same direct hypothesis decision: the association between functional destination support and satisfaction remained statistically unsupported at the 5% level. Thus, the nonsignificant relationship was not attributable solely to the primary reflective specification, although its magnitude varied across the two specifications.
In contrast, the service marketing mix was positively associated with destination loyalty intention, supporting H2b. This finding is consistent with the proposition that functional destination conditions may be directly relevant to tourists’ future behavioral intentions. Accessible tourism offerings, reasonable prices, useful information, effective service processes, responsive personnel, and appropriate physical facilities may reduce the practical uncertainty associated with revisiting Pai or recommending it to others (
Abdullah et al., 2025;
Rahman et al., 2019).
The formative robustness analysis reinforced this direct finding. When the seven service-marketing conditions were treated as formative components, functional destination support remained positively associated with loyalty intention, and the hypothesis decision was unchanged. This consistency indicates that the observed direct association was not an artifact of requiring the seven components to operate as reflective manifestations of a homogeneous construct. At the same time, the variation in outer weights confirms that the components did not contribute uniformly to the alternative composite and should not be interpreted as functionally interchangeable.
The functional interpretation proposed in this study distinguishes evaluations of the completed visit from perceptions relevant to the feasibility of future destination consumption. Tourists may report stronger intentions to revisit when Pai is perceived as accessible, affordable, recognizable, and manageable, even when these functional perceptions are not significantly associated with attribute-level satisfaction. Similarly, willingness to recommend Pai may correspond with perceptions that other visitors can access and navigate its tourism services with limited difficulty. These interpretations are theoretically plausible explanations for the observed association, but the cross-sectional design does not identify the process through which functional conditions become related to loyalty intention.
5.3. Tourist Satisfaction as an Evaluative Route
Tourist satisfaction was positively associated with destination loyalty intention, supporting H3. This result is consistent with previous research identifying satisfaction as an important correlate of tourists’ intentions to revisit and recommend destinations (
Chi & Qu, 2008;
Prayag & Ryan, 2012;
Wang & Li, 2023). Favorable evaluations of attractions, value, accessibility, tourism information, facilities, and interpersonal services may reduce uncertainty regarding future visits and increase tourists’ confidence when recommending Pai to other people.
This finding is consistent with the evaluative route proposed in the framework. Here, the evaluative route denotes the theoretical relevance of tourists’ post-consumption assessments to loyalty intention rather than a temporally demonstrated process. Destination image captures the symbolic meaning assigned to Pai, and the service marketing mix captures respondents’ shared perceptions of functional destination support. Tourist satisfaction, by comparison, reflects respondents’ evaluations of the attributes experienced during their visits. The significant relationship between satisfaction and loyalty intention shows that these post-consumption evaluations were positively associated with loyalty intention when symbolic and functional destination assessments were simultaneously considered.
The interpretation of this relationship should recognize that the primary loyalty-intention construct includes a supplementary attitudinal–evaluative indicator. DLI2 and DLI3 directly capture revisit and recommendation intentions, whereas DLI1 reflects respondents’ favorable overall evaluation of Pai’s tourism services. Importantly, the positive association between satisfaction and destination loyalty intention remained statistically supported when DLI1 was removed. This robustness result reduces concern that the observed relationship was driven primarily by conceptual overlap between tourist satisfaction and the evaluative content of DLI1.
5.4. Indirect Relationships Through Tourist Satisfaction
The analysis provided partial support for the proposed indirect associations. Destination image exhibited a small positive specific indirect association with destination loyalty intention through tourist satisfaction, β = 0.027, 95% bootstrap CI [0.002, 0.069]. H4a was therefore statistically supported. The direct association between destination image and loyalty intention also remained positive and statistically significant, β = 0.330, t = 4.841, p < 0.001. In conventional statistical terminology, this combination corresponds to complementary mediation. However, the cross-sectional data do not establish that destination image preceded satisfaction or that satisfaction subsequently produced loyalty intention. The result should therefore be interpreted as a small indirect association consistent with, but not proof of, the proposed symbolic–evaluative sequence.
The specific indirect association between the service marketing mix and destination loyalty intention through tourist satisfaction was not supported, β = 0.015, 95% bootstrap CI [−0.008, 0.059]. H4b was therefore not supported. The service marketing mix nevertheless retained a positive direct association with loyalty intention, β = 0.356, t = 5.464, p < 0.001. This pattern is conventionally classified as direct-only nonmediation. More precisely, the findings show a positive direct association between functional destination support and loyalty intention but no statistically supported indirect association through satisfaction.
Overall, satisfaction was involved in a statistically supported indirect association for destination image but not for the service marketing mix. These differentiated patterns are consistent with the framework’s symbolic, functional, and evaluative distinctions. They should not be interpreted as evidence that tourists followed separate temporal pathways or that satisfaction operated as a causally established mediator.
5.5. Explanatory and Predictive Interpretation
The model explained 42.0% of the variance in destination loyalty intention, indicating moderate explanatory power. In comparison, it explained only 7.6% of the variance in tourist satisfaction. This contrast is consistent with the proposed framework’s greater ability to explain tourists’ future orientation toward Pai than their evaluations of specific destination attributes.
The PLSpredict results followed a similar pattern. Both endogenous constructs produced positive Q
2predict values, indicating basic predictive relevance. Destination loyalty intention produced a substantially higher Q
2predict value of 0.387 than tourist satisfaction, which produced a value of 0.043. The results therefore indicate stronger out-of-sample predictive relevance for loyalty intention than for satisfaction. However, without indicator-level comparisons against an appropriate linear-model benchmark, the predictive performance should not be classified as low, medium, or high (
Shmueli et al., 2019).
The limited explanatory and predictive performance for satisfaction further indicates that destination image and the aggregate service marketing mix do not capture the full range of factors informing tourists’ evaluations of Pai. This outcome is theoretically plausible because satisfaction may be associated with numerous experiential and contextual factors that were not included in the model. The weak explanatory power should therefore be recognized as a boundary of the framework rather than treated only as a statistical limitation.
5.6. Overall Interpretation of the Symbolic–Functional Framework
Overall, the observed associations were partially consistent with the symbolic–functional framework. Destination image was positively associated with both attribute-level satisfaction and destination loyalty intention. The service marketing mix was positively associated with loyalty intention but not satisfaction. Tourist satisfaction was also positively associated with loyalty intention. The specific indirect association involving destination image was supported, whereas the one involving the service marketing mix was not. Accordingly, the evidence supports differentiated patterns of association among the constructs, rather than confirming separate temporal or causal routes.
These findings suggest that symbolic meaning, perceived functional support, and attribute-level satisfaction should not be treated as interchangeable explanations of loyalty intention. Destination image captures tourists’ interpretation of what Pai represents, the service marketing mix captures their shared evaluation of how its tourism system supports consumption, and satisfaction captures their evaluations of experienced destination attributes. Their differentiated cross-sectional associations suggest that loyalty intention corresponds with multiple post-visit considerations. However, the design does not determine whether these considerations occur sequentially, simultaneously, or reciprocally over time.
The robustness analysis further confirmed that the differentiated direct associations were maintained when destination loyalty intention was measured exclusively through revisit and recommendation intentions. Thus, although DLI1 broadens the primary construct by adding an attitudinal–evaluative element, the substantive direct conclusions were not dependent on that item. The primary construct should therefore be understood as predominantly intentional rather than exclusively intentional.
6. Conclusions and Implications
6.1. Conclusions
This study examined the associations among destination image, the service marketing mix, attribute-level tourist satisfaction, and destination loyalty intention among 231 Thai domestic tourists who had previously visited Pai. Destination image was positively associated with both tourist satisfaction and loyalty intention. The service marketing mix was positively associated with loyalty intention but not with satisfaction, while tourist satisfaction was positively associated with loyalty intention.
In the primary specification, destination loyalty intention was represented principally by revisit and recommendation intentions, with DLI1 providing supplementary attitudinal–evaluative coverage. The direct structural conclusions remained stable when DLI1 was excluded, indicating that the findings were not dependent on combining explicit behavioral intentions with an overall service evaluation.
The findings provide partial support for the proposed symbolic–functional framework. Destination image exhibited a positive direct association with loyalty intention and a small positive specific indirect association through tourist satisfaction. The service marketing mix exhibited a positive direct association with loyalty intention, whereas its specific indirect association through satisfaction was not supported. These patterns are consistent with differentiated symbolic, functional, and evaluative correlates of loyalty intention. They do not establish that the constructs operate through separate temporal routes or causal mechanisms.
Overall, the study extends satisfaction-centered accounts of destination loyalty by integrating destination image, functional destination support, and attribute-level satisfaction within a common framework and showing that their relationships with loyalty intention are not identical. These conclusions concern differentiated correlates rather than causal pathways and should be interpreted cautiously given the cross-sectional design, nonprobability sample, and measurement limitations.
6.2. Theoretical Implications
This study makes three theoretical contributions. First, it integrates destination-image and service-marketing perspectives within a common framework. Whereas destination-loyalty research has predominantly examined destination image and satisfaction, the extended service marketing mix has generally developed within a separate research stream. Bringing these constructs together shows that symbolic destination meaning, perceived functional destination support, and attribute-level satisfaction exhibit differentiated associations with loyalty intention. The contribution lies in their theoretical integration and empirical differentiation rather than in establishing causal pathways among them.
Second, the findings clarify the theoretical distinction among symbolic, functional, and evaluative routes to loyalty intention. Destination image was associated with both satisfaction and loyalty intention, and it also exhibited a small positive specific indirect association through satisfaction. The service marketing mix was associated with loyalty intention but not satisfaction, and its specific indirect association through satisfaction was unsupported. These results are consistent with differentiated symbolic, functional, and evaluative patterns of association. They do not establish that these constructs operate through distinct temporal processes or that functional destination support directly changes tourists’ future intentions.
This interpretation remains qualified because the seven service-marketing components were aggregated into a single reflective construct in the primary model and the construct’s AVE was below the conventional criterion. However, the alternative formative-composite specification produced the same directional and inferential conclusions for the direct structural relationships. This robustness result indicates that the principal direct findings were not dependent on treating the seven components as reflective manifestations of a common underlying evaluation. Nevertheless, the formative outer weights varied across the components, confirming that product, price, place, promotion, people, process, and physical evidence did not contribute uniformly to the composite. The analysis therefore supports cautious use of an overall functional-support construct without implying that all seven components operate identically. Future research should compare reflective, formative, multidimensional, and higher-order specifications using measurement instruments specifically designed to distinguish among these alternatives.
Third, the study qualifies satisfaction-centered accounts of destination loyalty. Satisfaction was positively associated with loyalty intention, and the specific indirect association linking destination image with loyalty intention through satisfaction was statistically supported. However, the indirect association was small, and the corresponding indirect association involving the service marketing mix was unsupported. Satisfaction therefore did not participate in a consistently supported indirect pattern for both destination-level predictors. These findings indicate that symbolic distinctiveness and functional feasibility remain relevant correlates of loyalty intention alongside evaluations of previous destination experiences (
Sann et al., 2026;
Sann & Siripipattaworn, 2024).
The study also clarifies the operational meaning of destination loyalty intention. Revisit intention and recommendation intention constitute the construct’s core conative content, while favorable overall evaluation provides supplementary evidence of respondents’ broader positive orientation toward Pai. Because the principal direct relationships remained stable after excluding the evaluative item, the findings cannot be attributed solely to conceptual overlap between destination evaluations and loyalty intention.
6.3. Practical Implications
Pai’s destination stakeholders should coordinate symbolic image stewardship with targeted improvements to its tourism service environment. Protecting Pai’s natural landscape, cultural character, local atmosphere, and small-destination identity may preserve the distinctive associations related to tourists’ revisit and recommendation intentions. Destination communication should accurately represent these characteristics so that promotional imagery remains consistent with tourists’ on-site experiences.
Functional improvement should focus on specific service-marketing components rather than assuming that the 7Ps perform uniformly. Destination managers should independently monitor tourism-product quality, pricing transparency, transportation and accessibility, information accuracy, service responsiveness, visitor processes, signage, sanitation, and physical facilities. Component-level assessment can identify whether functional weaknesses are concentrated in particular areas and prevent favorable performance in one component from obscuring deficiencies in another.
Tourist satisfaction should also be monitored at both attribute and global levels. The present study assessed satisfaction with attractions, value, convenience, facilities, information, and interpersonal service. These evaluations can help identify operational priorities, but they should be supplemented with a direct measure of tourists’ overall satisfaction. Combining attribute-level diagnostics with global evaluation would allow destination organizations to distinguish specific service problems from tourists’ overall judgments of Pai.
The low explained variance in satisfaction indicates that destination managers should also examine factors beyond image and the service marketing mix. Potential areas include perceived authenticity, crowding, environmental quality, safety, experience quality, expectation confirmation, and perceived value. These factors may be especially important in a small destination where rapid tourism development could affect local identity, environmental conditions, and the quality of visitor experiences.
6.4. Limitations and Future Research
Several limitations define the boundaries of the findings. First, the cross-sectional design prevents conclusions regarding temporal ordering or causality because destination image, service-marketing perceptions, satisfaction, and loyalty intentions were measured simultaneously. Longitudinal or repeated-measure studies should examine how pre-visit image, on-site perceptions, post-visit satisfaction, and subsequent behavior develop over time.
Second, purposive online sampling and respondent self-selection limit generalizability. The sample comprised only Thai domestic tourists and was concentrated among younger respondents and students. The findings therefore should not be generalized to all visitors to Pai, particularly international tourists, older travelers, or individuals who do not participate in online travel communities. Future studies should employ destination-based or probability-oriented sampling and compare domestic and international visitor segments.
Third, the measurement properties of destination image and the service marketing mix require further refinement. Although destination image demonstrated satisfactory internal consistency and convergent validity, it was measured using only three context-specific indicators, one of which exhibited a comparatively weak outer loading. Future studies should employ broader measures that distinguish cognitive, affective, and overall destination image. The service marketing mix demonstrated satisfactory internal consistency in the primary reflective model, although its AVE indicated marginal convergent validity. Because the seven components represent substantively distinct and potentially non-interchangeable service conditions, the construct was also estimated formatively in a robustness analysis. The direct structural conclusions remained unchanged under this alternative specification, reducing concern that the principal findings were artifacts of the reflective assumption. Nevertheless, the variation in indicator weights, including the negative conditional weight for the place and accessibility component, indicates that the internal composition of functional destination support requires further investigation. Future research should compare reflective, formative, multidimensional, and higher-order specifications using instruments developed explicitly for the intended measurement model and, where possible, include an appropriate global criterion for redundancy analysis.
Fourth, the original questionnaire included LGBTQ+ as a combined self-identification option alongside female and male. Although this inclusive option enabled respondents outside the binary categories to identify themselves, it did not distinguish sexual orientation from gender identity. Future research should measure sex assigned at birth, current gender identity, and sexual orientation through separate items and provide nonbinary, self-describe, and prefer-not-to-answer options.
Fifth, tourist satisfaction was measured through attribute-level evaluations rather than a global assessment. Future studies should distinguish between attribute-level and global satisfaction and examine whether they perform different explanatory or mediating roles. Destination loyalty intention was measured principally through revisit and recommendation intentions, together with one supplementary item capturing respondents’ favorable overall evaluation of Pai’s tourism services. Although the inclusion of DLI1 broadens the attitudinal coverage of the construct, it also means that the primary measure is not composed exclusively of explicit behavioral-intention items. The two-item robustness model showed that the principal direct conclusions remained stable when DLI1 was removed. Future research should nevertheless employ broader multi-item measures that separately assess revisit intention, recommendation intention, destination preference, attitudinal commitment, and actual loyalty behavior.
Sixth, the model explained only 7.6% of the variance in tourist satisfaction, indicating that important antecedents were omitted. Future research should incorporate perceived value, experience quality, authenticity, safety, environmental quality, crowding, destination attachment, and expectation confirmation to provide a more comprehensive explanation of satisfaction formation.
Finally, the indirect-association findings require replication using designs capable of establishing temporal ordering. Although the percentile bootstrap confidence interval supported a small indirect association between destination image and loyalty intention through satisfaction, this cross-sectional pattern does not establish that destination image preceded satisfaction or that satisfaction subsequently produced loyalty intention. The indirect association involving the service marketing mix was not supported. Future research should use longitudinal, time-lagged, repeated-measure, or experimental designs to test the proposed temporal sequence and should report direct, indirect, and total associations with corresponding confidence intervals. Additional studies should also examine alternative intervening constructs, including perceived value, destination attachment, memorable tourism experience, and perceived service quality.