Abstract
This study explores the relationship between multidimensional technology adoption and utilization with exports, focusing on textile and clothing firms in Indonesia. Grounded by self-selection and learning-by-exporting hypotheses, this study uses binomial probit and ordinary least squares (OLS) models with data from 376 firms to estimate a two-way link between a granular technology index, export propensity, and export intensity. The findings show that firms adopting and utilizing advanced technology effectively in administrative and production functions are more likely to self-select into exporting. Upon entering export markets, firms significantly increased their adoption and utilization of technologies, primarily in production functions. However, as export intensity increased, production technology upgrading increased slowly, while administrative technology adoption and use decreased. These results provide nuanced insights into how technology evolves across different stages of export activity and underscore targeted technology upgrading programs that address acquisition or routine utilization in every export activity to foster competitiveness.
1. Introduction
Adopting advanced technologies is a fundamental driver of technological change, enhancing innovation and competitiveness (Ogbo & Han, 2024; Vărzaru & Bocean, 2024). Firms are primarily motivated by this adoption to increase efficiency, productivity, and profitability (Mohammed et al., 2024; Oh & Kim, 2023). Firms that adopt advanced technologies are more likely to enter export markets, as these technologies enhance competitiveness and operational capabilities (Cirera et al., 2023; Esaku, 2020). Subsequently, such firms then intensify their export intention to remain competitive in the global market and boost export performance by enhancing their technology to produce more innovative and high-quality products (Alegre et al., 2022; Ding et al., 2025; Li et al., 2025; Sala-Ríos & Torres-Solé, 2021; Zheng & Li, 2024). This phenomenon can be explained by two prominent concepts: self-selection and learning by exporting. Self-selection refers to the phenomenon in which more productive and innovative firms are more likely to enter export markets, while learning by exporting explains the phenomenon in which firms enhance their productivity and innovation capabilities after entering and increasing their intensity in export markets because of their exposure to new knowledge and technology (Alvarez & López, 2005).
While recent studies have attempted to explain these phenomena, most of them have focused on firms’ capabilities, innovation, and productivity (Benkovskis et al., 2020; Hosseini et al., 2024; Kim & Chung, 2024; Sahoo et al., 2022; Segarra-Blasco et al., 2022; Tandrayen-Ragoobur, 2022). Furthermore, the existing literature has concentrated mainly on advanced technologies, such as ICT (Añón Higón & Bonvin, 2022; Nguyen & Choi, 2025), digital transformation (Ding et al., 2025; Wang & Huang, 2025; Xu et al., 2025), automation, robotics, artificial intelligence, and other types of 4.0 technology (Alguacil et al., 2022; Cao et al., 2025; Cugno et al., 2024; Ing & Zhang, 2022; Kim & Chung, 2024; Naglič et al., 2020; Xu & Tian, 2025), without explicitly linking them to the self-selection and learning-by-exporting hypotheses. Many studies also tend to oversimplify their methodologies, using binary variables to represent export or technology adoption (Cirera et al., 2023; Kim & Chung, 2024; Tandrayen-Ragoobur, 2022), which can reduce estimation accuracy, limit granularity, and obscure the nuances of technology–export dynamics (Bortolotti, 2018; Giles, 2022). Moreover, focusing only on advanced technologies is sometimes unsuitable for developing countries, where such technologies are not yet widespread or introduced (Cirera et al., 2022). A further limitation is the lack of differentiation between types of technologies used in different business functions, despite the fact that firms use different technologies for different tasks. This lack of granularity overlooks how export engagement might differently affect administrative versus production technologies (Cirera et al., 2023). In resource-constrained environments, it is essential not only to understand which technologies are adopted but also their utilization in designing effective industrial and export promotion policies (Chakraborty & Dey, 2025; Chen et al., 2024; Lee & Kim, 2021; Maharani et al., 2024).
Utilizing data from 376 textile and apparel industries in Indonesia and their adoption of 60 types of technologies, this study fills a crucial gap by providing a more comprehensive understanding of learning by exporting versus self-selection into export in four ways. First, this study examines how technology in administrative and production activities, differentiated by extensive (adoption) and intensive (utilization) margins, enhances the likelihood of firms entering the export market (self-selection). Second, it analyzes how export propensity and export intensity affect technology indices with the same granularity (learning effects). This bidirectional link offers nuanced insights into how firms adopt and utilize technology at different stages of exporting. Third, this study treats technology not as a dummy but rather as a technology index encompassing technology from the most basic to the most sophisticated. This approach provides a more granular and accurate measure of a firm’s technological sophistication, allowing a better understanding. Fourth, focusing on textiles and clothing as the study’s sector illustrates how the role of exports in technology within this labor-intensive sector provides valuable insights for developing nations. This study also provides empirical evidence for policymakers when designing technology capacity-building programs to encourage firms to enter export markets, and export incentives can further accelerate technology diffusion.
The remainder of this paper is organized as follows: Section 2 presents the literature review, and Section 3 describes the research methods used in this study. Section 4 presents the results, and Section 5 presents a discussion, managerial implications, and recommendations for future research. Finally, Section 6 presents the conclusions and limitations of this study.
2. Literature Review
This section explores two major hypotheses, self-selection and learning by exporting, to determine the causal relationship between firms’ exports and technology adoption. This provides a foundational understanding and research gap for this study.
2.1. The Self-Selection Hypothesis and Learning-by-Exporting Hypothesis
The self-selection hypothesis posits that more productive and efficient firms are more likely to enter export markets (Bernard & Jensen, 1999; Melitz, 2003). The second strand is learning by exporting, which suggests that firms can enhance their productivity and innovation by engaging in export activities (Bernard & Jensen, 1999; Clerides et al., 1998). Recent studies exploring a single hypothesis in one study are from Ayob et al. (2022), showing that firm-specific innovation capabilities (technological and non-technological managerial innovation) matter for explaining export propensity in ASEAN countries. Duc Tran et al. (2023) found that innovation activities, primarily driven by adopting new technology or processes, are positively associated with the probability of engaging in export activities in Vietnam. Haddoud et al. (2023) found that foreign technology licensing and R&D expenditure distinctively affect innovation and increase export intensity. The learning-by-exporting hypothesis and its relation to technology were studied by Wang and Tao (2019), who found an indirect effect of export on innovation by increasing the likelihood of adopting imported technology. Cao et al. (2025) found that robot adoption significantly promotes firm export, including the value and intensity of export. This effect is stronger in labor-intensive industries than in non-labor-intensive ones.
More complex studies have examined the two-way link in one study. For example, the study by Bernard and Jensen (1999) found that more productive firms become exporters, and exporters have significantly increasing productivity but with slower rates; Alvarez and López (2005) found increases in productivity after firms begin to export and increased productivity in becoming exporters; Tandrayen-Ragoobur (2022) found a causal relationship whereby highly innovative firms self-select into the export markets and export positively influences the innovative performance of enterprises; Sahoo et al. (2022) found that exports are significantly and positively related to manufacturing firms’ productivity in India, but in terms of self-selection, the study does not provide any substantial evidence because of the lag effect; Hosseini et al. (2024) found that the effect of productivity on export propensity was positive and bidirectional, but stronger for the self-selection mechanism. In terms of export intensity, this study shows that productivity benefits are gained before companies take up exports and that it has no advantage among continuous exporters.
2.2. Technology Granularity and Multidimensionality
However, most studies do not detail the interplay between self-selection and learning by exporting with multidimensional technology adoption and utilization in particular activities. To the best of the author’s knowledge, the research that has measured the relationship between exports and multidimensional technology adoption is that of Cirera et al. (2022, 2023). Using data from the cross-sectional Firm-level Adoption of Technology (FAT) survey with the OLS method, it was found that exporters are likely to have larger technology indices in general business functions (GBFs), both extensive (EXT) and intensive (INT) margins, and sector-specific business functions (SBFs) in the extensive margin, compared to non-exporters. In other words, exporters not only adopt more advanced technologies but also intensively use such technologies to perform general business functions. They also adopt advanced technologies for sector-specific business functions, but these technologies may not be used intensively. Cirera et al. (2023) also analyzed his findings with differences in differences to overcome endogeneity problems. Both studies provide a granular understanding of learning-by-exporting hypotheses on technology, but do not provide self-selection and export intensity.
Therefore, this study aims to enhance previous research by examining empirical evidence related to self-selection and learning by exporting with the technology index multidimensionally. It focuses on more detailed variables, including export status and export intensity, as well as a granular technology index divided by GBF and SBF across extensive and intensive margins within the textile industry in Indonesia.
3. Methods
These sections involve three main stages: first, identifying the technology index, export status, and export intensity; second, assessing the impact of technological sophistication on export probability using probit regression, and then measuring export status and export intensity impact with the technology adoption index using ordinary least squares (OLS); and finally, conducting robustness and endogeneity tests to ensure the estimation. The details of this study are as follows.
3.1. Research Sample
This study utilized cross-sectional data from the Indonesian textile and clothing firms. Indonesia was a key player in the global textile market, ranking among the top 10 countries for textile and clothing production and 12th for exports. Its significant role in the global supply chain makes it an ideal subject for studying technology adoption and industrial dynamics.
Technology adoption was measured using the Firm-level Adoption of Technology (FAT) survey questionnaire administered to 376 textile and clothing firms in Indonesia. This sample size meets the minimum requirement based on the World Bank sampling (World Bank, 2022) for a 90% confidence interval with a precision level of 7.5%. The sample was stratified by sector, region, and firm size and then randomly selected for analysis.
3.2. Measurement of Key Variables
3.2.1. The FAT Survey
The FAT survey was designed to assess technology adoption within firms. It differentiates between general business functions (GBFs) and sector-specific business functions (SBFs), as structured in Appendix A.1. GBFs encompass technology use in common business operations across all firms, including business administration, human resources, and financial management, production or service planning, procurement and supply chain management, and sales and payment methods. In contrast, SBFs pertain to technology usage relevant only to specific sectors, such as sewing in apparel or encapsulation in pharmaceuticals. The survey also produces two indices: the extensive margin (EXT) for technologies adopted and the intensive margin (INT) for the most frequently utilized technology. This dual measurement allows for a detailed assessment of technology adoption and utilization (Cirera et al., 2020). Appendix A.2 and Appendix A.3 illustrate the detailed business functions and technology grid for GBFs and SBFs in textiles, clothing, and apparel.
3.2.2. Technology Index
The technology index for both the EXT and INT ranges from 1 to 5, reflecting levels of sophistication from basic (manual processes) to cutting-edge, calculated using the following formula:
and
where is the index of the most advanced technology used in business function f within firm j. is the index of the most widely used technology, where and are the sophistication ranks of the technology identified by the firm as the most advanced technology used and the most widely used for the business function, and Rf is the maximum technology rank in the function.
3.2.3. Export Status and Export Intensity
Using data from the FAT survey, a dummy variable for export status was constructed (1 if the firm exported its products directly or through trading firms within the last three years (2021–2023) and 0 otherwise), following Cirera et al. (2023). Export intensity was calculated as the ratio of a firm’s exports to total sales, following Sahoo et al. (2022) and Segarra-Blasco et al. (2022).
3.3. Econometric Models
This study uses cross-sectional FAT data from the Indonesian textile and garment industry to examine how export status and intensity relate to technology adoption.
3.3.1. Probit Model for Export Propensity (Self-Selection)
A probit model was used to analyze the probability of a firm becoming an exporter after adopting more sophisticated technology, addressing the concept of self-selection. This relationship is estimated using the following equation:
where represents the probability of firm i becoming an exporter (export dummy variable equals 1). Si is measured using a technology index that captures four technology dimensions for firm i: GBF EXT, GBF INT, SBF EXT, and SBF INT. Xi represents a set of firm-specific characteristics, including sector, size, age, multinational status, innovation status, formal incentives, financial constraints, and overseas experience of managers. These control variables are consistent with those also used in the OLS model.
3.3.2. Ordinary Least Squares (OLS) for Technology Adoption (Learning by Exporting)
OLS regression was employed to analyze the “learning-by-exporting” phenomenon, following the analytical pattern of export status and technology adoption established by Cirera et al. (2023). Linear regression analysis was performed to estimate this relationship using the following equation:
Exporti is a dummy for export propensity or the ratio of a firm’s exports to export intensity. Si is the technology index, and Xi represents the same control variables used in Equation (3).
3.4. Robustness and Endogeneity
Robust estimation was performed to enhance the reliability of the estimation results. We employed heteroscedasticity-consistent standard errors (HC1), as developed by White, to improve the standard errors for each parameter, making the updated model robust to heteroscedasticity. Sensitivity analysis is also provided to strengthen the findings.
To address potential endogeneity issues arising from contemporaneous shocks, omitted variables, and reverse causality, we utilized an instrumental variable (IV). First, a weak instrument test is conducted to determine whether the instruments strongly correlate with endogenous variables to predict their potential endogeneity. Then, Wu–Hausman tests are applied to ensure the robustness of findings regarding the endogeneity issue and to discuss the origin of the effects. For Equation (3), the exogenous variable is a dummy of firms that received duty exemption facilities for imported machinery between 2021 and 2023 (1 if received and 0 otherwise). This variable is chosen based on the literature suggesting that reducing tariffs on capital goods lowers technology prices, stimulating direct investment in new technologies (Bas & Berthou, 2016; Meleshchuk & Timmer, 2024). The variable does not directly influence exports but has an effect through technology. For Equation (4), a dummy variable for the bonded zone status was employed as an exogenous variable (1 if the firm is in the bonded zone and 0 otherwise). Bonded zone facilities are provided as a mediator of imported material input and increase the number of exporters and their volume (Situmorang et al., 2024; Wicaksono & Mangunsong, 2023).
4. Results
This section presents empirical results, detailing the differences in technological sophistication between exporters and non-exporters, followed by the probit and OLS regression findings.
4.1. Descriptive: Exporting Status and Technology Index
To better understand the technology gap between exporters and non-exporters across different types of business functions, a descriptive analysis of general business functions and averages of extensive and intensive margins of disaggregated business functions is illustrated in Figure 1. Panel (a) represents the extensive margin and shows that exporters generally possess a higher level of technological sophistication across nearly all business functions, except the payment function. Larger gaps are in business administration, production planning, and quality control. Panel (b), representing the intensive margin, indicates a lower average in sophistication both for exporters and non-exporters. This suggests that exporters use advanced technology more intensively than non-exporters.
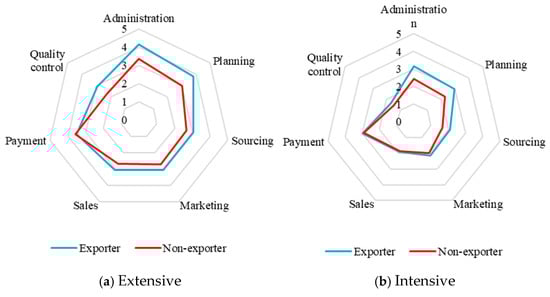
Figure 1.
Technology sophistication and export status. Note: The technology index ranges from 1 to 5, reflecting levels of technology sophistication from basic (manual processes) to cutting-edge.
4.2. Regression Results: Probit and OLS Models
4.2.1. Export Probability Through Technology (Self-Selection)
A probit model was employed to investigate how technology adoption influences a firm’s probability of entering the export market. Table 1 presents the results of this probit for all technology indices. These results consistently indicate that technology sophistication significantly increases a firm’s probability of exporting, particularly at the extensive margin for GBF EXT and SBF EXT, but only GBF INT in the intensive margin. In more detail, the coefficient for GBF EXT was 0.3059 (p-value = 0.009), and for SBF EXT, it was 0.2521 (p-value = 0.0247). This suggests that each unit increase in the technology index boosts the export probability z-score by approximately 0.25–0.31 times. Converting this to marginal effects at the mean yields an increase in export probability of approximately 4–6 percentage points (pp), providing strong evidence that the acquisition of advanced technology in GBF EXT and SBF EXT directly enhances access to export markets.

Table 1.
Results for probit models: technology sophistication and export probability.
Furthermore, GBF INT exhibits a higher and more significant coefficient than SBF EXT and GBF EXT. Although GBF INT has the largest coefficient influencing export probability, its significance is weaker. This is likely because this index measures the depth of technology usage in GBFs for daily operations, not only acquisition, but is heavily influenced by other factors like managerial practices, leading to greater data variance and increased standard errors. The higher coefficient for GBF INT reflects the readiness to implement a digital administrative infrastructure supporting order visibility, financial integration, and quality assurance as the key differentiating factors for international buyers when placing orders. In contrast, SBF INT, which captures the depth of routine production technology utilization, shows a weaker and insignificant coefficient. This implies that frontier capability is more crucial to enter export markets, as foreign buyers seem to prioritize “readiness” or front-end capabilities over the intensity of production machinery utilization.
4.2.2. OLS Regression: Export Propensity Impact on Technology Index (Leaning by Exporting)
Further analysis was conducted using OLS regression to determine in which activities the technology improved after firms entered the export market and increased export intensity. Table 2 summarizes the regression results of the impact of the export status on the technology index, controlling for firm characteristics as control variables. The OLS results consistently show that exporting firms positively influence the level of the technology index, particularly at the extensive margin for both GBFs and SBFs. This indicates that export-oriented firms are driven to adopt more sophisticated technologies in administrative and production processes to meet the demands of a highly competitive global market. Furthermore, for GBF INT, the coefficient is also significant, driven by global buyers’ requirements that necessitate digitized management of orders, customs documents, multi-currency finance, and global logistics. Consequently, exporters are compelled to use digital technology such as enterprise resource planning (ERP), supply chain management (SCM), and e-procurement more frequently, leading to significant coefficients of GBF INT (Etemad, 2024; Rana et al., 2024). Conversely, the influence of export status decreases and becomes insignificant at SBF INT. This suggests that while exporters may have adopted more advanced technologies, they do not necessarily utilize them routinely in their production processes.
Table 2.
OLS result export propensity impact on the technology index.
The order of the export status coefficients on technology adoption reveals an interesting pattern in firms’ technology adoption and utilization. The most significant coefficient for GBF EXT indicates that exporters are initially driven to acquire or adopt the most advanced technologies in general business functions. This is a logical first step, as general functions are typically easier to standardize, entail lower investment risks and costs, and often serve as the starting point for digitalization (Di Carlo et al., 2021; Waldman-Brown, 2020). The SBF EXT coefficient is also significant, although slightly smaller than GBF EXT, suggesting a strong impetus for adopting advanced technologies in production functions. However, the smaller coefficient of advanced technology adoption in production lines generally requires larger investments, more complex process changes, and a higher risk of failure than general business functions. GBF INT ranks third, with a smaller coefficient than the two extensive margins. This indicates that even when firms possess advanced technology in general business functions, not all firms utilize it immediately. Finally, SBF INT has the smallest coefficient, which illustrates that the routine of technology use in production functions faces significant challenges from implementation constraints, operational costs, and market demands that do not yet necessitate intensive technology use. Furthermore, the intensive use of technology in SBFs requires human resource readiness, supporting infrastructure, and organizational culture changes, which are sometimes difficult to achieve rapidly. Consequently, exporting firms might find it sufficient to possess advanced technology as a “showcase” or fulfill audit requirements in the short term, before substantially utilizing it in daily work (Fiolleau et al., 2024; Xin et al., 2024).
Based on these regression results, technological lag is also highly probable when observing the difference between exporting firms’ extensive and intensive margins. This technological lag is evident in the time gap between when a firm adopts or acquires new technology and when it integrates into daily business processes (Müllmer & Nečas, 2024).
4.2.3. Export Intensity Impact on Technology Adoption (Learning by Exporting)
Export intensity represents the extent to which a firm pushes its output into international markets. Table 3 shows positive coefficients across all models, indicating that a higher export orientation correlates with more sophisticated technology adoption. However, the strength of export intensity is highly affected by the specific business function coefficients for both the extensive and intensive margins. This finding indicates that global buyers frequently demand specific levels of precision, consistency, and production capacity, thereby driving direct technology investments in production lines (Pop et al., 2022). Conversely, the effect of export intensity on the GBF is considerably weaker and insignificant.
Table 3.
OLS results in the export intensity impact on technology adoption.
Export intensity offers a more in-depth analysis than a simple export dummy for export propensities. This is because if export propensity is merely proxied by a dummy variable, all exporting firms are considered equal; a firm exporting 10% of its output is grouped with a giant exporter of 90%. The export ratio captures the gradient of this pressure, whereas the dummy variable captures only the existence of a relationship. In the dummy model, the coefficient is positive, but its value is consistently smaller than the export ratio and loses significance in the GBF.
4.2.4. Robustness and Sensitivity for Probit and OLS Models
To enhance the reliability of the estimates, heteroscedasticity-consistent standard errors (HC1), as developed by White, were employed. Overall, this robustness check improved the standard errors for each parameter, making the updated model robust to heteroscedasticity. Nevertheless, after the robustness check, the overall significance levels were not substantially different from standard probit and OLS regression. This suggests that the robust analysis did not significantly alter the interpretation of the regression model results. Sensitivity tests were also conducted across all models. When the control variables, firm size and firm age, were excluded from the models, the coefficient of the technology index consistently increased and improved its significance, meaning the positive association between technological sophistication and export performance across different stages of export.
4.2.5. Control Variable Results for Probit and OLS Models
The control variables provide further insights into the context of industrial heterogeneity. Firm age consistently shows a positive and significant effect, supporting the argument that accumulated experience expands networks and reputation in export markets (Sulimowska-Formowicz et al., 2024). Firm scale also increases export probability, confirming the presence of economies of scale (Wagner, 2020). Foreign ownership is also positive, reflecting the strong connection to global marketing networks (Faroque et al., 2021). Conversely, the textile industry has a negative and significant coefficient, meaning this sector is more challenging to export than apparel. Managers’ overseas experience is also significant with positive coefficients. This finding reflects that managers’ international experiences substantially increase a firm’s export probability (Eximbank et al., 2018; Kuppusamy & Anantharaman, 2021). Finally, policy and internal innovation enrich the narrative, where firms that receive government incentives consistently show a positive and significant effect, indicating a complementary policy effect. Innovation status only approaches near significance, suggesting that innovation status needs to be detailed, because the impact of innovation on export performance can vary across firms (Tandrayen-Ragoobur, 2022). More details about the coefficient results of the control variables from probit and OLS are in Appendix A.2; Table A1, Table A2 and Table A3.
4.3. Endogeneity and IV Results
To address potential endogeneity, we applied an instrumental variable (IV) using bonded zone status and the duty exemption facility as instruments. Bonded zone status passed weak instrument tests in all OLS models; however, the duty exemption facility was found to be a weak instrument in GBF EXT and GBF INT. The Wu–Hausman results confirmed the presence of endogeneity in almost all models except for GBF EXT in the OLS export intensity model; so we rely on IV-based estimates where endogeneity is detected. The Sargan test could not be performed because each endogenous variable is instrumented only with one variable. A summary of the weak instrument and Wu–Hausman tests is shown in Appendix A.3 Table A4.
A summary of the IV probit results, after correcting for endogeneity, is presented in Table 4. This result demonstrates that technological sophistication for GBFs and SBFs in extensive and intensive margins significantly increases the firm’s probability of entering the export market. Compared to the standard probit, the IV estimates are larger and more significant, suggesting that the standard model underestimated the impact of technology on export participation. By leveraging the machinery import duty exemption facility as the instrumental variable, IV isolates the causal component of technology adoption unrelated to unobserved firm capabilities, thereby producing stronger and more reliable estimates. These findings reinforce the self-selection hypothesis, showing that firms with higher technology adoption are more likely to access export markets, and highlight that trade facilitation policies play a key role in amplifying the importance of technological readiness for internationalization.
Table 4.
Result for IV from probit models.
Table 5 reports on the IV results from the OLS export status to technology adoption. These results show that exporting positively correlates with technology adoption across all technological indexes. The IV coefficients are generally larger than the basic OLS estimates and increase their significance. This indicates that standard OLS may have underestimated the genuine relationship due to endogeneity biases. By employing bonded zone status as an instrument, the IV corrects these biases and provides a more reliable estimate of the causal effect of exporting on technology upgrading. These results support the learning-by-exporting hypothesis, suggesting that firms engaged in export markets tend to enhance both their administrative and production-related technologies.
Table 5.
Result for IV from OLS export propensity impact on the technology index.
The IV results from the export intensity OLS model are shown in Table 6. These results show that export intensity has a stronger and more significant impact on technology adoption once endogeneity is addressed. For SBF EXT and SBF INT, the coefficients are larger than basic OLS, and their statistical significance increases to the 0.1% level, highlighting that production-related technologies are exceptionally responsive to export deepening. Similarly, the coefficient for GBF INT increases substantially under the IV and becomes statistically significant, whereas in the basic OLS model it was not. This suggests that once endogeneity bias is corrected, the role of exporting in promoting the routine use of administrative technologies is more evident.
Table 6.
Result for IV from OLS in the export intensity impact on technology adoption.
In contrast, no endogeneity was detected for GBF EXT, so the OLS estimates are retained. The difference between the OLS and IV results reflects the correction of reverse causality and omitted variable bias. By instrumenting export intensity with bonded zone status, the IV approach isolates exogenous variation in export opportunities and provides a cleaner causal estimate. The stronger coefficients in IV models indicate that deeper integration into export stimulates more intensive technology upgrading, especially in production functions where competitive pressures and international buyer requirements are strongest.
5. Discussion
This section provides a comprehensive interpretation of the empirical results presented in Section 4. We discuss the implications of our findings for understanding the interplay between technology adoption and export behavior, identifying both the consistency with and the nuances that extend the theoretical frameworks and previous studies.
5.1. Interplay of Technology Adoption and Export from Probit and OLS
The probit and OLS results reveal an apparent asymmetry in the two-way relationship between technology adoption and exports, as illustrated by the coefficients of technology in Figure 2. The probit results show that adoption and utilization of advanced technologies in general business functions and acquisition in production exert a strong push effect, significantly increasing a firm’s probability of becoming an exporter. GBF INT is the most significant technology coefficient, which reflects the utilization of digital administrative technologies supporting order visibility, but production technologies may not be used intensively in this stage. This result supports the self-selection hypothesis, indicating that Indonesian textile and apparel firms with advanced technological capabilities are more likely to successfully penetrate foreign markets.
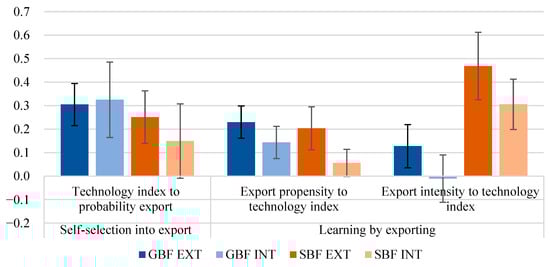
Figure 2.
Coefficient of probit and OLS for the two-way relationship of the technology index in each exporting stage.
Conversely, after firms enter the export market, the learning-by-exporting effect on technology remains positive but is marked with a smaller coefficient, providing complementary feedback for technological enhancement and serving as a pull factor. This OLS result aligns with findings from Cirera et al. (2022, 2023) showing that exporters not only adopt more advanced technologies but also intensively use such technologies to perform general business functions. They also adopt advanced technologies for sector-specific business functions, but these technologies may not be used intensively. After firms increase their export intensity, the coefficient of GBF EXT steadily declines and eventually loses statistical significance. Similarly, GBF INT, which represents the routine use of technology in general business functions, experiences an even sharper decline after firms enter the export markets. Its coefficient becomes negative and loses significance, indicating a diminished explanatory power over export intensity. This suggests that initial investments in administrative and general business technologies are crucial for export readiness. However, their ongoing, transformational boost from increased export intensity is limited once market entry is achieved. This difference in magnitude is consistent with the hypothesis that learning by exporting is real but weaker than self-selection based on advanced technology.
In contrast, the coefficient for SBF EXT was consistently significant. While the SBF EXT pattern initially slows after export market entry, it subsequently increases significantly and becomes the most important variable in export intensity. Similarly, the evolving role of SBF INT in export intensity was not significant when firms were preparing to enter or after they had entered the export market, but it subsequently became a significant variable as export intensity increased. This indicates that global buyers frequently demand specific levels of precision that meet minimum standards of quality, consistency, and production capacity, which are primarily driven by direct investment and the utilization of advanced technology in the production lines. This finding enriched the learning-by-exporting hypothesis, which states that export intensity strengthens the impetus for technology adoption within the production function (SBF EXT and INT) more than GBF.
5.2. Interplay of Technology Adoption and Export from IV
To validate the two-way relationship between technology and exports and minimize estimation bias from endogeneity, Figure 3 summarizes the coefficients from the instrumental variable (IV) regressions. These models correct for potential endogeneity arising from contemporaneous shocks, omitted variable bias, and reverse causality. The estimated coefficients and significance levels from the instrumental variable (IV) approach are generally higher than those from the probit and OLS models. These findings are similar to those highlighted by Tandrayen-Ragoobur (2022).
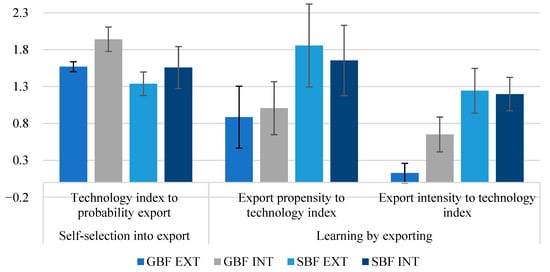
Figure 3.
Coefficient of IV for the two-way relationship of the technology index in each exporting stage.
The first set of bars in Figure 3 shows clear evidence of self-selection into export, where firms with higher levels of technology adoption, both at the extensive and intensive margins of GBFs and SBFs, have a significantly higher probability of entering export markets. This pattern is consistent across all four indices, with the most substantial effect observed for GBF INT, highlighting that administrative technologies such as ERP systems, compliance, and quality control are crucial for meeting export requirements and establishing initial export participation. This is a logical first step, as general functions are typically easier to standardize, entail lower investment risks and costs, and often serve as the starting point for digitalization (Di Carlo et al., 2021; Waldman-Brown, 2020). These findings support the self-selection hypothesis, which argues that technologically advanced, more productive, and innovative firms are more likely to overcome the barrier of entering foreign markets, aligning with previous findings from Alvarez and López (2005), Tandrayen-Ragoobur (2022), and Hosseini et al. (2024). Our findings also provide evidence that technology utilization is more important to a firm’s export entry than just acquisition. This means that acquiring technology is insufficient; firms must also be able to utilize and integrate this technology effectively. A managerial and labor adaptation process, training, and cultural change are required before technology fully integrates into daily activities (Aldaremi et al., 2024; Chourasiya & Malviya, 2025; Haepp, 2022).
The second and third bars represent the learning-by-exporting mechanism. The results from export propensity demonstrate that once firms begin exporting, they significantly increase their adoption and use of technologies, particularly in the production functions (SBF EXT and SBF INT). The lower but positive and significant coefficient for GBF INT indicates that export participation also stimulates the intensive use of administrative technologies. However, the impact is relatively higher for production technologies. The results from export intensity also show positive and significant effects on GBF INT, SBF EXT, and SBF INT. However, the coefficients are smaller compared to the export propensity models. This suggests that export status provides the most significant stimulus for technology upgrading, while the marginal gains from deepening export intensity are more gradual. These patterns reveal that self-selection effects dominate at the entry stage.
Compared to the basic probit and OLS models, the IV estimates show larger and more significant coefficients, particularly for GBF INT and the production-related indices (SBF EXT and SBF INT). This indicates that the baseline models underestimated the strength of the technology and export relationship due to endogeneity from reverse causality and omitted variables. By correcting these biases, the IV estimation provides stronger evidence for self-selection into exporting and learning by exporting, highlighting that technological capabilities are a prerequisite for export entry and are further enhanced through sustained export participation.
5.3. Alignment with Existing Literature and Key Nuances
Our results generally align with prior studies. However, our study adds crucial nuances by distinguishing between technology adoption’s extensive and intensive margins, a dimension often overlooked in previous research that focused on innovation, productivity, technology import, or licensing (Alvarez & López, 2005; Hosseini et al., 2024; Sahoo et al., 2022; Tandrayen-Ragoobur, 2022). Our findings indicate that advancements in administrative technology (GBF) and production technology (SBF) significantly contribute to the entry of exports. However, the adoption of GBF technology has a slightly greater impact. More importantly, the effective use of both technologies is crucial, as they are essential to meet international market requirements. Export propensity primarily rewards firms that deepen technology in the production line (SBF EXT and SBF INT), suggesting that the competitive pressures of exports drive a more thorough integration of production technologies. Export intensity also correlates strongly with upgrading production technology (SBF), both in adoption and routine use, but at a lower level. This finding is consistent with findings from Pane and Patunru (2021) showing that the export effect on productivity decreases once the firm becomes more experienced. This is because firms focus on a small target market and sometimes decrease the market size to learn more deeply and better match their innovations with customer preferences, aligning with prior studies from Hosseini et al. (2024). Consistent with other findings, there also seems to be a positive association between firm size, age, and exports; medium and large firms are more likely to be more advanced than small enterprises. Similarly, managers’ overseas experience also matters for exporting behavior when entering international markets (Eximbank et al., 2018; Faroque et al., 2021; Kuppusamy & Anantharaman, 2021; Sulimowska-Formowicz et al., 2024; Tandrayen-Ragoobur, 2022; Wagner, 2020).
5.4. Policy Implications
Our findings demonstrate that the relationship between technology adoption and exporting is mutually reinforcing but has different dynamics. At the entry stage, firms with higher levels of adoption and utilization in administrative technology are more likely to self-select into export markets, suggesting that policies promoting digitalization of back-office functions such as ERP, CRM, and compliance systems are crucial for lowering entry barriers and enabling firms to meet buyer requirements. Production technology is also important in this stage, but is given lower priority than administrative technologies. However, once firms gain export access, the learning-by-exporting effect becomes stronger for production-related technologies (SBF EXT and SBF INT), as international competition and buyer-driven standards push firms to modernize machinery and upgrade production processes. This pattern implies that industrial policy should adopt a two-track approach: first, strengthen administrative technology adoption to facilitate export entry, and second, sustain production upgrading as export intensity increases. By aligning support for administrative and production technologies along the export trajectory, policymakers can encourage Indonesian firms to enter global markets and remain competitive through continuous technological upgrading.
6. Conclusions
This study uses firm-level data to investigate the link between technology adoption and exports in the Indonesian textile and clothing industry from 2021 to 2023. The results provide novel and strong evidence for the self-selection and learning-by-exporting hypotheses and reveal the differences between export behavior and the adoption of different functional technologies by constructing a multidimensional technology index. We show that adopting and utilizing advanced technology in general business functions is particularly important for enabling firms to self-select into export and minimizing entry barriers. However, their role decreased and diminished as firms entered the export market and deepened their export intensity. In contrast, the adoption and utilization of production-related technologies become increasingly significant for export entry, reflecting the growing demands of international buyers for precision, quality, consistency, and production capacity. However, after intensity rises, increment is slower; these findings confirm that innovative firms are more likely to enter export markets, and export entry accelerates production upgrading. Then, the continuous export intensity grows technology incrementally.
The study highlights a strategic sequencing of policy priorities for Indonesia’s industrial development. Removing barriers to technology adoption and utilization in administrative and production functions is critical for supporting export entry. At the same time, sustained exposure to global markets should be leveraged to encourage deeper utilization of production technologies along the value chain. This two-track policy approach ensures that firms gain access to international markets and remain competitive through continuous technological upgrading.
Finally, while this study provides valuable insights, its reliance on a single wave of cross-sectional data limits the ability to trace long-term causal dynamics. Future research using panel data would allow a richer understanding of how technology adoption evolves in response to export participation and intensity. In addition, while our sampling followed standard World Bank survey protocols, we acknowledge the potential for selection bias in the sample construction and the possibility of non-response bias. Future studies should adopt more rigorous sampling and data collection methods to address these issues. While this study used instrumental variables (IV) to address endogeneity, our model was likely just identified, meaning we had an equal number of instruments and endogenous variables. To improve the study, future research should use multiple instrumental variables, including potential contemporaneous shocks like the COVID-19 pandemic. This will allow for an over-identified model that can be tested with a Sargan test to confirm the instruments’ validity, enhancing the findings’ reliability and applicability. Weak instruments in IV probit models for general business functions undermine the validity of the IV estimates, which are likely still biased. Therefore, future research should aim to identify a stronger instrument.
Author Contributions
Conceptualization: A.S., A.I.S., H.S., and H.; methodology, A.S., A.I.S., H.S., and H.; software, A.S.; writing—original draft preparation: A.S., A.I.S., H.S., and H.; writing—review and editing: A.S., A.I.S., H.S., and H.; supervision: A.I.S., H.S., and H. All authors have read and agreed to the published version of the manuscript.
Funding
This research received no external funding.
Institutional Review Board Statement
Not applicable.
Informed Consent Statement
Not applicable.
Data Availability Statement
The data presented in this study are available upon request from the corresponding author.
Conflicts of Interest
The authors declare no conflicts of interest.
Appendix A
Appendix A.1. FAT Survey Framework, GBF Structure, Textile, and Wearing Apparel SBF

Figure A1.
Firm-Level Adoption of Technology (FAT) Conceptual Framework. Source: (Cirera et al., 2021).

Figure A2.
General business function (GBF) structure. Source: (Cirera et al., 2020).

Figure A3.
Textile SBF: business functions and technologies. Source: (Cirera et al., 2020).

Figure A4.
Wearing apparel SBF: business functions and technologies. Source: (Cirera et al., 2020).
Appendix A.2. Coefficient for Control Variable in Probit and OLS Models
Table A1.
Coefficient for probit model.
Table A1.
Coefficient for probit model.
| Control Variable | Export Probability | |||
|---|---|---|---|---|
| (1) | (2) | (3) | (4) | |
| Textile | −0.7777 *** (0.2054) | −0.8244 *** (0.2032) | −0.4224 (0.2941) | −0.6301 * (0.3007) |
| Medium scale | 0.3536 (0.4126) | 0.3871 (0.4094) | 0.4952 (0.4114) | 0.5051 (0.4094) |
| Large scale | 0.6863 † (0.3989) | 0.7242 † (0.3854) | 0.7423 † (0.3870) | 0.8226 * (0.3884) |
| Age | 0.0274 *** (0.0076) | 0.0287 *** (0.0074) | 0.0278 *** (0.0076) | 0.0285 *** (0.0076) |
| Foreign-owned | 0.7411 *** (0.1712) | 0.7125 *** (0.1695) | 0.7183 *** (0.1732) | 0.7202 *** (0.1713) |
| Innovation | 0.4617 (0.2871) | 0.4021 (0.2867) | 0.4696 † (0.2744) | 0.4458 † (0.2736) |
| Formal incentives | 0.5302 * (0.2083) | 0.5211 * (0.2052) | 0.5276 ** (0.2043) | 0.5621 ** (0.2024) |
| Financial constraints | 0.1607 (0.1667) | 0.1543 (0.1695) | 0.1824 (0.1696) | 0.1712 (0.1680) |
| Studied abroad | 0.4673 ** (0.1661) | 0.5092 ** (0.1658) | 0.5145 ** (0.1670) | 0.5646 *** (0.1627) |
Note: Robust standard errors are in parentheses. *** p < 0.001, ** p < 0.01, * p < 0.05, † p < 0.1.
Table A2.
OLS result for control variables in export propensity impact on the technology index.
Table A2.
OLS result for control variables in export propensity impact on the technology index.
| Control Variable | GBF EXT | GBF INT | SBF EXT | SBF INT |
|---|---|---|---|---|
| Textile | −0.0896 (0.0775) | 0.0300 (0.0611) | −1.5552 *** (0.0873) | −1.2563 *** (0.0619) |
| Medium scale | 0.3255 * (0.1320) | 0.2151 * (0.0857) | −0.0145 (0.1192) | 0.0323 (0.0904) |
| Large scale | 0.5765 *** (0.1213) | 0.3729 *** (0.0849) | 0.4747 *** (0.1091) | 0.4107 *** (0.0836) |
| Age | 0.0053 * (0.0026) | 0.0022 (0.0021) | 0.0040 (0.0026) | 0.0031 † (0.0016) |
| Foreign-owned | −0.0444 (0.0863) | 0.0371 (0.0669) | 0.0353 (0.0978) | 0.0290 (0.0592) |
| Innovation | 0.2374 † (0.1400) | 0.2161 * (0.0893) | 0.1322 (0.1600) | 0.1546 † (0.0891) |
| Formal incentives | 0.1180 (0.1001) | 0.1347 † (0.0688) | 0.1514 (0.1022) | 0.1022 (0.0707) |
| Financial constraints | 0.0083 (0.9183) | 0.0033 (0.9564) | −0.0591 (0.5059) | −0.0589 (0.2966) |
| Studied abroad | 0.3170 *** (0.0832) | 0.1890 ** (0.0597) | 0.2345 ** (0.0871) | 0.0780 (0.0521) |
Note: Robust standard errors are in parentheses. *** p < 0.001, ** p < 0.01, * p < 0.05, † p < 0.1.
Table A3.
OLS results for control variables in the export intensity impact on technology adoption.
Table A3.
OLS results for control variables in the export intensity impact on technology adoption.
| Variable | GBF EXT | GBF INT | SBF EXT | SBF INT |
|---|---|---|---|---|
| Textile industry | −0.1116 (0.0796) | −0.0057 (0.0608) | −1.4881 *** (0.0862) | −1.1949 *** (0.0611) |
| Medium | 0.3432 ** (0.1320) | 0.2285 ** (0.0841) | −0.0083 (0.1173) | 0.0293 (0.0884) |
| Large | 0.6076 *** (0.1192) | 0.4031 *** (0.0805) | 0.4595 *** (0.1072) | 0.3854 *** (0.0811) |
| Age | 0.0070 ** (0.0025) | 0.0034 (0.0021) | 0.0046 † (0.0024) | 0.0028 † (0.0016) |
| Foreign-owned | −0.0268 (0.0911) | 0.0692 (0.0724) | −0.0321 (0.0874) | −0.0307 (0.0556) |
| Innovation | 0.2678 † (0.1409) | 0.2348 ** (0.0900) | 0.1601 (0.1603) | 0.1628 † (0.0898) |
| Formal incentives | 0.1422 (0.0980) | 0.1562 * (0.0687) | 0.1479 (0.1015) | 0.0889 (0.0717) |
| Financial constraints | 0.0175 (0.0821) | 0.0078 (0.0611) | −0.0462 (0.0889) | −0.0529 (0.0561) |
| Studied abroad | 0.3441 *** (0.0853) | 0.2167 *** (0.0606) | 0.2141 * (0.0898) | 0.0504 (0.0522) |
Note: Robust standard errors are in parentheses. *** p < 0.001, ** p < 0.01, * p < 0.05, † p < 0.1.
Appendix A.3. Endogeneity Result with Instrumental Variable
Table A4.
A summary of the weak instrument and Wald tests for probit models.
Table A4.
A summary of the weak instrument and Wald tests for probit models.
| Endogeneity Test | GBF EXT | GBF INT | SBF EXT | SBF INT | ||||
|---|---|---|---|---|---|---|---|---|
| F Statistic | p-Value | F Statistic | p-Value | F Statistic | p-Value | F Statistic | p-Value | |
| Wald Test | 2.9349 | 0.08748 † | 5.7344 | 0.01711 * | 13.3840 | 0.0002889 *** | 22.4000 | 3.109 × 10−06 *** |
| Theta | −0.9580 | −0.8730 | −0.7950 | −0.6850 | ||||
| Sargan | N/A | N/A | N/A | N/A | N/A | N/A | N/A | N/A |
Note: *** p < 0.001, * p < 0.05, † p < 0.1.
Table A5.
A summary of the weak instrument and Wu–Hausman tests for OLS Models.
Table A5.
A summary of the weak instrument and Wu–Hausman tests for OLS Models.
| Model/ Endogeneity Test | GBF EXT | GBF INT | SBF EXT | SBF INT | ||||
|---|---|---|---|---|---|---|---|---|
| F Statistic | p-Value | F Statistic | p-Value | F Statistic | p-Value | F Statistic | p-Value | |
| OLS Model (export propensity) | ||||||||
| Weak instruments | 17.06 | 4.44 × 10⁻⁵ *** | 17.06 | 4.44 × 10⁻⁵ *** | 17.06 | 4.44 × 10⁻⁵ *** | 17.06 | 4.44 × 10⁻⁵ *** |
| Wu–Hausman | 2.42 | 0.121 | 8 | 0.00406 ** | 18.12 | 2.61 × 10⁻⁵ *** | 40.14 | 6.56 × 10¹⁰ *** |
| Sargan | N/A | N/A | N/A | N/A | N/A | N/A | N/A | N/A |
| OLS Models (Export Intensity) | ||||||||
| Weak instruments | 78.459 | <2 × 10⁻¹⁶ *** | 78.459 | <2 × 10⁻¹⁶ *** | 78.459 | <2 × 10⁻¹⁶ *** | 78.459 | <2 × 10⁻¹⁶ *** |
| Wu–Hausman | 1.735 | 0.189 | 11.610 | 0.000726 *** | 8.090 | 0.00467 ** | 25.36 | 7.33 × 10⁻⁷ *** |
| Sargan | N/A | N/A | N/A | N/A | N/A | N/A | N/A | N/A |
Note: *** p < 0.001, ** p < 0.01.
References
- Aldaremi, A., Owens, J. D., & Griffiths, M. (2024). Utilization of key technologies can support managerial innovation (MI) within core business operations: Mitigate the increasing costs of global crises and supply chain issues by integrating the management. In S. A. Salman, & A. Bhaumik (Eds.), Entrepreneurship innovation and education for performance improvement (pp. 331–348). IGI Global Scientific Publishing. [Google Scholar] [CrossRef]
- Alegre, J., Ferreras-Méndez, J. L., Fernández-Mesa, A., & Strange, R. (2022). Innovation capabilities and export performance in manufacturing SMEs. TEC Empresarial, 16(3), 55–71. [Google Scholar] [CrossRef]
- Alguacil, M., Lo Turco, A., & Martínez-Zarzoso, I. (2022). Robot adoption and export performance: Firm-level evidence from Spain. Economic Modelling, 114, 105912. [Google Scholar] [CrossRef]
- Alvarez, R., & López, R. A. (2005). Exporting and performance: Evidence from Chilean plants. Canadian Journal of Economics, 38(4), 1384–1400. [Google Scholar] [CrossRef]
- Añón Higón, D., & Bonvin, D. (2022). Information and communication technologies and firms’ export performance. Industrial and Corporate Change, 31(4), 955–979. [Google Scholar] [CrossRef]
- Ayob, A. H., Freixanet, J., & Shahiri, H. (2022). Innovation, trade barriers and exports: Evidence from manufacturing firms in ASEAN countries. Journal of Asia Business Studies, 17(1), 203–223. [Google Scholar] [CrossRef]
- Bas, M., & Berthou, A. (2016). Does input-trade liberalization affect firms’ foreign technology choice? The World Bank Economic Review, 31(2), 351–384. [Google Scholar] [CrossRef][Green Version]
- Benkovskis, K., Masso, J., Tkacevs, O., Vahter, P., & Yashiro, N. (2020). Export and productivity in global value chains: Comparative evidence from Latvia and Estonia. Review of World Economics, 156(3), 557–577. [Google Scholar] [CrossRef]
- Bernard, A. B., & Jensen, J. B. (1999). Exceptional exporter performance: Cause, effect, or both? Journal of International Economics, 47, 1–25. [Google Scholar] [CrossRef]
- Bortolotti, R. (2018). Dummy coding category variables. In Handbook of statistical analysis and data mining applications (2nd ed., pp. 497–514). Elsevier. [Google Scholar] [CrossRef]
- Cao, Y., Chen, S., & Tang, H. (2025). Robot adoption and firm export: Evidence from China. Technological Forecasting and Social Change, 210, 123878. [Google Scholar] [CrossRef]
- Chakraborty, S., & Dey, O. (2025). Access to credit: Hindrance to technology transfer? Indian Economic Review. [Google Scholar] [CrossRef]
- Chen, G., Wei, J., & Zhang, C. (2024). Analysis of new technology selection strategy based on entropy weight method topsis model. In V. Palade, M. Favorskaya, S. Patnaik, M. Simic, & S. Belciug (Eds.), Artificial intelligence for future society (pp. 82–94). Springer Nature. [Google Scholar]
- Chourasiya, R., & Malviya, R. K. (2025). Factors influencing technology adoption for sustainability in manufacturing firms: An empirical analysis and literature review. Sustainable Development. early view. [Google Scholar] [CrossRef]
- Cirera, X., Comin, D., & Cruz, M. (2020). Technology within and across firms. Correspondencias & Análisis, 15018, 110. [Google Scholar]
- Cirera, X., Comin, D., & Cruz, M. (2022). Bridging the technological divide: Technology adoption by firms in developing countries. In Bridging the technological divide: Technology adoption by firms in developing countries. The World Bank. [Google Scholar] [CrossRef]
- Cirera, X., Comin, D., Cruz, M., Lee, K. M., & Martins-Neto, A. (2023). Exporting and technology adoption in Brazil. World Trade Review, 22(3–4), 334–347. [Google Scholar] [CrossRef]
- Cirera, X., Comin, D., Cruz, M., Lee, K. M., & Martins-Neto, A. S. (2021). Firm-Level Technology Adoption in Vietnam. Policy Research Working Paper; 9567. World Bank. [Google Scholar]
- Clerides, S. K., Lach, S., & Tybout, J. R. (1998). Is learning by exporting important? Micro-dynamic evidence from Colombia, Mexico, and Morocco. The Quarterly Journal of Economics, 113(3), 903–947. [Google Scholar] [CrossRef]
- Cugno, M., Castagnoli, R., Büchi, G., & Pini, M. (2024). Effects of industry 4.0 on different export dimensions: Empirical analysis on manufacturing SMEs. Journal of Manufacturing Technology Management, 36(9), 154–176. [Google Scholar] [CrossRef]
- Di Carlo, F., Mazzuto, G., Bevilacqua, M., & Ciarapica, F. E. (2021). Retrofitting a process plant in an industry 4.0 perspective for improving safety and maintenance performance. Sustainability, 13(2), 646. [Google Scholar] [CrossRef]
- Ding, Y., Sun, Y., & Li, J. (2025). The effect of digital transformation on export upgrading: Firm-level evidence from China. Emerging Markets Finance and Trade, 61(10), 3172–3192. [Google Scholar] [CrossRef]
- Duc Tran, C., Tien Thanh, P., & The Duy, D. (2023). Innovation and export: Evidence from manufacturing SMEs in a developing economy. International Journal of Development Issues, 22(2), 278–297. [Google Scholar] [CrossRef]
- Esaku, S. (2020). Investments, export entry and export intensity in small manufacturing firms. Journal of Industrial and Business Economics, 47(4), 677–697. [Google Scholar] [CrossRef]
- Etemad, H. (2024). The artificial intelligence, digital economy, and global connectivity: Implications and lessons for international entrepreneurship. Journal of International Entrepreneurship, 22(4), 409–432. [Google Scholar] [CrossRef]
- Eximbank, T., Mudurluk, G., Mah, S., & Selekler-Goksen, N. (2018). Antecedents of export performance in emerging economies: The case of Turkey Murat Parlakgul. International Journal of Business and Globalisation, 20(4), 437. [Google Scholar]
- Faroque, A. R., Gani, M. O., Faruq, M. O., Bashar, M. F. B., & Islam, N. (2021). The role of market knowledge and institutional networks in improving the export performance of apparel manufacturers in a developing country. In Upgrading the global garment industry: Internationalization, capabilities and sustainability (pp. 113–136). Edward Elgar Publishing. Available online: https://china.elgaronline.com/edcollchap/edcoll/9781789907643/9781789907643.00011.xml (accessed on 5 June 2025).
- Fiolleau, K., MacTavish, C., Osecki, E., & Thorne, L. (2024). An exploration of technological innovations in the audit industry: Disruption theory applied to a regulated industry*. Accounting Perspectives, 23(3), 403–445. [Google Scholar] [CrossRef]
- Giles, D. E. (2022). Some consequences of including impulse-indicator dummy variables in econometric models. Journal of Quantitative Economics, 20(2), 329–336. [Google Scholar] [CrossRef]
- Haddoud, M. Y., Kock, N., Onjewu, A. K. E., Jafari-Sadeghi, V., & Jones, P. (2023). Technology, innovation and SMEs’ export intensity: Evidence from Morocco. Technological Forecasting and Social Change, 191, 122475. [Google Scholar] [CrossRef]
- Haepp, T. (2022). New technologies and employee well-being: The role of training provision. Applied Economics Letters, 29(13), 1211–1216. [Google Scholar] [CrossRef]
- Hosseini, M., Brege, S., & Nord, T. (2024). When market leads innovation: The interplay of internationalisation, innovation and productivity among Swedish wood manufacturing SMEs. World Economy, 47(12), 4623–4652. [Google Scholar] [CrossRef]
- Ing, L. Y., & Zhang, R. (2022). Automation in Indonesia: Productivity, quality, and employment. In Robots and AI: A new economic era (pp. 275–309). Routledge. [Google Scholar] [CrossRef]
- Kim, K., & Chung, H. (2024). Impact of heterogenous capabilities on export performance amid the digital transformation. Journal of Asian Economics, 95, 101829. [Google Scholar] [CrossRef]
- Kuppusamy, J., & Anantharaman, R. N. (2021). The impact of managerial and firm characteristics on barriers in export businesses. International Journal of Advanced and Applied Sciences, 8(6), 110–117. [Google Scholar] [CrossRef]
- Lee, J., & Kim, S.-J. (2021). How can David orchestrate resources to enhance firm performance? A dynamic approach to coping with resource constraints. Long Range Planning, 54(4), 102090. [Google Scholar] [CrossRef]
- Li, Y., Rengifo, E. W., & Chang, Z. (2025). Can digital transformation enhance firms’ export technological sophistication? Evidence from China. Applied Economics Letters, 1–7. [Google Scholar] [CrossRef]
- Maharani, S., Noerlina, & Nadira. (2024, November 20–21). A study of MSMEs business sustainability strategies: Transforming towards industry 4.0. 2024 International Conference on Informatics, Multimedia, Cyber and Information System (ICIMCIS) (pp. 449–453), Jakarta, Indonesia. [Google Scholar] [CrossRef]
- Meleshchuk, S., & Timmer, Y. (2024). The price of capital goods, investment and labour: Micro-evidence from a trade liberalization. Canadian Journal of Economics/Revue Canadienne d’économique, 57(3), 799–835. [Google Scholar] [CrossRef]
- Melitz, M. J. (2003). The impact of trade on intra-industry reallocations and aggregate industry productivity. Econometrica, 71(6), 1695–1725. [Google Scholar] [CrossRef]
- Mohammed, B., Ojo, O. O., & Shah, S. (2024, November 4–6). Impact of digital transformation on conventional business models: A review. 2024 IEEE International Conference on Technology Management, Operations and Decisions, ICTMOD 2024, Sharjah, United Arab Emirates. [Google Scholar] [CrossRef]
- Müllmer, V., & Nečas, K. (2024). Temporal discontinuity of Defence Investment and Implementation in the Bucharest nine countries. Challenges to National Defence in Contemporary Geopolitical Situation, 437–447. [Google Scholar] [CrossRef]
- Naglič, A., Tominc, P., & Logozar, K. (2020). The impact of industry 4.0 on export market orientation, market diversification, and export performance. Organizacija, 53(3), 227–244. [Google Scholar] [CrossRef]
- Nguyen, T. T. T., & Choi, C. H. (2025). Assessing the impact of ICT on export performance: A comparative analysis of ASEAN and partner countries. Review of Development Economics. [Google Scholar] [CrossRef]
- Ogbo, N. B., & Han, T. A. (2024). Coordination dynamics in technology adoption: Lessons from an evolutionary game theoretical analysis. In Multisector insights in healthcare, social sciences, society, and technology (pp. 295–326). IGI Global. [Google Scholar] [CrossRef]
- Oh, I., & Kim, J. (2023). Frontiers and laggards: Which firms benefit from adopting advanced digital technologies? Managerial and Decision Economics, 44(2), 753–766. [Google Scholar] [CrossRef]
- Pane, D. D., & Patunru, A. A. (2021). Does Export Experience Improve Firms’ Productivity? Evidence from Indonesia. The Journal of Development Studies, 57(12), 2156–2176. [Google Scholar] [CrossRef]
- Pop, E., Campean, E., Braga, I. C., & Ispas, D. (2022). New product development of a robotic soldering cell using lean manufacturing methodology. Sustainability, 14(21), 14057. [Google Scholar] [CrossRef]
- Rana, S., Singh, J., Mishra, V., Khan, S., Quttainah, M., & Prashar, S. (2024). How digital transformation impact firm performance? The unmet needs of Indian exporting firms. Journal of Strategic Marketing, 32(8), 1317–1335. [Google Scholar] [CrossRef]
- Sahoo, P. K., Rath, B. N., & Le, V. (2022). Nexus between export, productivity, and competitiveness in the Indian manufacturing sector. Journal of Asian Economics, 79, 101454. [Google Scholar] [CrossRef]
- Sala-Ríos, M., & Torres-Solé, T. (2021). Effects of innovation on exports in Spanish cooperatives. The Empirical Economics Letters, 2(20), 1–16. Available online: http://hdl.handle.net/10459.1/72485 (accessed on 7 January 2025).
- Segarra-Blasco, A., Teruel, M., & Cattaruzzo, S. (2022). Innovation, productivity and learning induced by export across European manufacturing firms. Economics of Innovation and New Technology, 31(5), 387–415. [Google Scholar] [CrossRef]
- Situmorang, E., Nidar, S. R., Anwar, M., & Sutisna, S. (2024). The effect of government regulations through competitiveness on the the performance of textile companies. Decision Science Letters, 13(2), 391–400. [Google Scholar] [CrossRef]
- Sulimowska-Formowicz, M., Trąpczyński, P., & Szymura-Tyc, M. (2024). Export market experience, relational capital, and export performance in the context of different levels of psychic distance. Entrepreneurial Business and Economics Review, 12(4), 97–113. [Google Scholar] [CrossRef]
- Tandrayen-Ragoobur, V. (2022). The innovation and exports interplay across Africa: Does business environment matter? Journal of International Trade and Economic Development, 31(7), 1041–1071. [Google Scholar] [CrossRef]
- Vărzaru, A. A., & Bocean, C. G. (2024). Digital transformation and innovation: The influence of digital technologies on turnover from innovation activities and types of innovation. Systems, 12(9), 359. [Google Scholar] [CrossRef]
- Wagner, J. (2020). A note on the firm size ? Export relationship. In Microeconometric studies of firms’ imports and exports (pp. 25–38). World Scientific (Europe). [Google Scholar] [CrossRef]
- Waldman-Brown, A. (2020). Redeployment or robocalypse? Workers and automation in Ohio manufacturing SMEs. Cambridge Journal of Regions, Economy and Society, 13(1), 99–115. [Google Scholar] [CrossRef]
- Wang, J., & Huang, Q. (2025). The Impact of digital transformation on the export technology complexity of manufacturing enterprises: Based on empirical evidence from China. Sustainability, 17(6), 2596. [Google Scholar] [CrossRef]
- Wang, K., & Tao, W. (2019). Exploring the complementarity between product exports and foreign technology imports for innovation in emerging economic firms. European Journal of Marketing, 53(2), 224–256. [Google Scholar] [CrossRef]
- Wicaksono, T. Y., & Mangunsong, C. (2023). Export promotion policies and the performance of firms: Evidence from bonded zones in Indonesia. Bulletin of Indonesian Economic Studies, 59(1), 61–89. [Google Scholar] [CrossRef]
- World Bank. (2022). Enterprise surveys: Sampling methodology. World Bank. Available online: https://www.enterprisesurveys.org (accessed on 14 February 2025).
- Xin, J., Du, K., & Xia, Y. (2024). The impact of enterprise digital transformation on audit fees—An intermediary role based on information asymmetry. Sustainability, 16(22), 9970. [Google Scholar] [CrossRef]
- Xu, X., Chen, X., Yang, J., & Li, Q. (2025). Digital transformation and export duration: Implications for firm financial performance. Pacific Basin Finance Journal, 92, 102780. [Google Scholar] [CrossRef]
- Xu, X., & Tian, C. (2025). Does artificial intelligence improve the quality of export products? Evidence from China. Applied Economics Letters, 32(1), 9–13. [Google Scholar] [CrossRef]
- Zheng, P., & Li, Y. (2024, January 19–21). Impact of digital technologies on export competitiveness: Insights from international technology diffusion. 2024 Guangdong-Hong Kong-Macao Greater Bay Area International Conference on Digital Economy and Artificial Intelligence (pp. 170–178), Hongkong, China. [Google Scholar] [CrossRef]
Disclaimer/Publisher’s Note: The statements, opinions and data contained in all publications are solely those of the individual author(s) and contributor(s) and not of MDPI and/or the editor(s). MDPI and/or the editor(s) disclaim responsibility for any injury to people or property resulting from any ideas, methods, instructions or products referred to in the content. |
© 2025 by the authors. Licensee MDPI, Basel, Switzerland. This article is an open access article distributed under the terms and conditions of the Creative Commons Attribution (CC BY) license (https://creativecommons.org/licenses/by/4.0/).