Article

Demographic Capital and the Conditional Validity of SERVPERF: Rethinking Tourist Satisfaction Models in an Emerging Market Destination

by
Reyner Pérez-Campdesuñer
1,*,
Alexander Sánchez-Rodríguez
2,
Gelmar García-Vidal
1,
Rodobaldo Martínez-Vivar
1,
Marcos Eduardo Valdés-Alarcón
1 and
Margarita De Miguel-Guzmán
3
1
Faculty of Law, Administrative and Social Sciences, Universidad UTE, Ave. Mariscal Sucre s/n and Ave. Mariana de Jesús, Bloque A, Quito 170527, Ecuador
2
Faculty of Engineering Sciences and Industries, Universidad UTE, Ave. Mariscal Sucre s/n and Ave. Mariana de Jesús, Bloque A, Quito 170527, Ecuador
3
Faculty of Business Management, Instituto Superior Tecnológico Atlantic, Santo Domingo 230102, Ecuador
*
Author to whom correspondence should be addressed.
Adm. Sci. 2025, 15(7), 272; https://doi.org/10.3390/admsci15070272
Submission received: 14 May 2025 / Revised: 4 July 2025 / Accepted: 7 July 2025 / Published: 11 July 2025
(This article belongs to the Special Issue Tourism and Hospitality Marketing: Trends and Best Practices)

Abstract

Tourist satisfaction models typically assume that service performance dimensions carry the same weight for all travelers. Drawing on Bourdieu, we reconceptualize age, gender, and region of origin as demographic capital, durable resources that mediate how visitors decode service cues. Using a SERVPERF-based survey of 407 international travelers departing Quito (Ecuador), we test measurement invariance across six sociodemographic strata with multi-group confirmatory factor analysis. The four-factor SERVPERF core (Access, Lodging, Extra-hotel Services, Attractions) holds, yet partial metric invariance emerges: specific loadings flex with demographic capital. Gen-Z travelers penalize transport reliability and safety; female visitors reward cleanliness and empathy; and Latin American guests are the most critical of basic organization. These patterns expose a boundary condition for universalistic satisfaction models and elevate demographic capital from a descriptive tag to a structuring construct. Managerially, we translate the findings into segment-sensitive levers, visible security for youth and regional markets, gender-responsive facility upgrades, and dual eco-luxury versus digital-detox bundles for long-haul segments. By demonstrating when and how SERVPERF fractures across sociodemographic lines, this study intervenes in three theoretical conversations: (1) capital-based readings of consumption, (2) the search for boundary conditions in service-quality measurement, and (3) the shift from segmentation to capital-sensitive interpretation in emerging markets. The results position Ecuador as a critical case and provide a template for destinations facing similar performance–perception mismatches in the Global South.

1. Introduction

Tourist satisfaction research has long portrayed the evaluative response to service performance as a near-universal cognitive–affective mechanism and a reliable barometer of destination competitiveness (Oh & Kim, 2017; Lanke & Varsha Paul, 2022). Yet mounting evidence shows that the widely used SERVPERF scale, while parsimonious, displays only partial measurement invariance when exported beyond high-income destinations (Carrillat et al., 2007). Identical cues—cleanliness, safety, reliability—do not carry the same meaning for every visitor, and, in volatile, information-scarce settings, the divergences become sharper. The puzzle, therefore, is not merely a descriptive variation but also includes why performance signals splinter across visitor groups and what that implies for the presumed universality of satisfaction models. Nevertheless, destination managers often continue to rely on these universal templates when allocating scarce resources, inadvertently reinforcing a one-size-fits-all mentality that can erode competitiveness.
A skewed empirical record deepens the puzzle. Systematic reviews reveal that studies of customer satisfaction in tourism remain heavily concentrated in mature markets, with limited coverage of emerging economies or multi-segment designs (Sánchez-Rebull et al., 2018; Shyju et al., 2021). A more recent service-quality review confirms that Latin American evidence is especially sparse. Within the region —now welcoming tens of millions of international arrivals each year (J. C. González-Rodríguez & Acevedo-Navas, 2021)—most published papers still isolate a single moderator such as nationality (Campo & Garau, 2008) or focus on one service facet like lodging quality (Alfaro-Navarro & Andrés-Martínez, 2024). Classic segmentation texts have long cautioned that such additive approaches miss the interaction of motives, demographics, and context (Dolnicar, 2008), yet integrated, multi-attribute designs remain the exception rather than the rule. Meta-analyses further note that model development and validation are driven predominantly by datasets from Europe, North America, and East Asia, limiting the transferability of prescriptions to contexts where governance volatility, risk perception, and infrastructure diverge starkly from those of the Global North (Vidal-Meliá et al., 2025).
To move beyond additive segmentation, this study builds on Bourdieu and reframes age, gender, and region of origin as forms of demographic capital—durable, socially recognized resources that encode travel experience, cultural value orientations, and risk tolerance. Recent empirical work in Latin America and emerging European destinations confirms that such capital shapes how travelers interpret service cues and ultimately drives satisfaction (Carvache-Franco et al., 2023; Travar et al., 2022a). Satisfaction is thus co-produced at the intersection of service quality and traveler resources. If this mediation is real, SERVPERF’s latent structure should exhibit partial metric invariance across sociodemographic strata, a proposition still rarely tested and almost never in Latin American destinations.
Ecuador provides a critical case through which to examine these boundary conditions. The country concentrates Andean highlands, the Amazonian rainforest, and Pacific archipelagos within a compact geography, yet international arrivals have plateaued around 1.5 million, and academic inquiry remains fragmented, often confined to flagship products such as the Galápagos (García Reinoso, 2021). Crisis assessments point to perceptions of insecurity, uneven service quality, and undifferentiated marketing as chronic brakes on competitiveness (International Finance Corporation—World Bank, 2022; Bravo Macías et al., 2024). No peer-reviewed study has yet asked whether age, gender, and region of origin interact to reshape visitor satisfaction across the full bundle of destination attributes—Access, Accommodation, Extra-hotel Services, and Attractions—or whether such variation fractures SERVPERF’s factor structure in a South American setting (Martín Hernández et al., 2019; Martín & Bustamante, 2019). Addressing that omission promises insight not only for Ecuadorian stakeholders but also for other emerging destinations that face similar performance–perception mismatches.
Against this backdrop, the present work embeds twenty-six destination attributes in a SERVPERF-based multi-dimensional framework, applies multi-group confirmatory factor analysis to a representative sample of international visitors departing Quito’s main airport, and evaluates how demographic capital recalibrates the relative importance of performance dimensions in overall satisfaction. By doing so, this study (i) identifies the boundary conditions under which SERVPERF retains, distorts, or loses metric equivalence; (ii) empirically validates demographic capital as a structuring construct in an under-studied South-American context; and (iii) converts statistical patterns into segment-sensitive managerial levers, from visible safety measures for younger and Latin American guests to gender-responsive facility upgrades and dual eco-luxury versus digital-detox bundles for long-haul markets. Taken together, these insights equip policymakers with a capital-sensitive dashboard for prioritizing investments under fiscal constraints. The manuscript proceeds as follows: Section 2 reviews satisfaction measurement and demographic segmentation, articulating the research questions and conceptual framework; Section 3 details data, instrument design, and analytical procedures; Section 4 presents results; Section 5 and Section 6 discusses theoretical and managerial implications, highlighting how demographic capital challenges universalistic satisfaction models; and Section 7 concludes with limitations and avenues for future research.

2. Theoretical Framework

Tourist satisfaction theory has evolved along three intersecting threads: measurement, segmentation, and capital. This literature review follows that logic. First, we trace the shift from expectation–confirmation models to performance-only metrics, highlighting SERVPERF’s promise and limitations. Second, we examine how demographic segmentation research has responded to those measurement debates. Third, we integrate Bourdieu’s concept of capital to show why sociodemographic markers should be theorized as resources that filter performance cues. Each subsection therefore escalates the argument from what is measured to who interprets it and how interpretation restructures measurement, laying the conceptual groundwork for our empirical tests in Section 3.

2.1. Tourist Satisfaction in the Experience Economy

Tourist satisfaction has long been modeled as the cognitive–affective response that arises when travelers compare their destination experience with a constellation of expectations shaped by prior trips, marketing narratives, and sociocultural frames (Oliver, 2010). Two broad measurement traditions dominate the debate. Expectation–disconfirmation instruments such as SERVQUAL gauge satisfaction by contrasting pre-trip standards with perceived performance across reliability, responsiveness, assurance, empathy, and tangibles. While powerful in stable, information-rich settings, this approach presumes that visitors arrive with coherent benchmarks, an assumption often violated in emerging markets where institutional volatility, fragmented promotion, and uneven service records blur reference points (Shyju et al., 2021). Performance-only tools such as SERVPERF remove the expectation component and assess quality directly through delivered outcomes. Recent evidence from Sub-Saharan Africa (Mhlongo et al., 2025) and the Andean region (J. Velastegui-Hernández et al., 2024) shows that SERVPERF yields higher construct validity and more stable factor structures in low-contact or fluid environments, suggesting that it is better suited to destinations like Ecuador, where visitor baselines fluctuate and institutional signals can be opaque.
Publications on customer satisfaction span a wide range of disciplines and topics (Lanke & Varsha Paul, 2022; Oh & Kim, 2017). In the Scopus database alone, over 62,000 entries are recorded. The earliest dates back to 1925 and discusses automobile body design from the customer’s perspective (Kreusser, 1928). In the specific field of tourism, more than 1285 studies have been identified, beginning with Haywood and Muller’s (1988) pioneering evaluation of urban tourist satisfaction.
The academic interest in tourist satisfaction has experienced notable growth in recent decades. Figure 1a illustrates the annual volume of peer-reviewed publications on the topic between 1988 and 2023.
The trend is clearly upward, reflecting sustained scholarly attention and the relevance of satisfaction studies within the tourism field. To better understand the thematic structure of the literature, Figure 1b presents a keyword co-occurrence network generated from author-supplied keywords. This visual shows the main research clusters and their interrelations, highlighting frequent associations with dimensions such as loyalty, perceived quality, service experience, and behavioral intention.
Meanwhile, Figure 1c depicts the geographic distribution of publications based on the first author’s affiliation. The figure confirms that research on tourist satisfaction is globally dispersed, with significant contributions from scholars in Australia (Grechyn & McShane, 2021), Asia (Khassawneh et al., 2024; Nabi et al., 2023), Europe (Xanthopoulou & Plimakis, 2023), the Americas (Alfaro-Navarro & Andrés-Martínez, 2024), and Africa (van Zyl & van der Merwe, 2022). Together, these figures provide compelling evidence of the academic maturity and international scope of this research area, which is primarily rooted in administrative and management sciences.
Satisfaction studies are often conducted to examine how these variables influence key performance outcomes such as customer loyalty (Cankül et al., 2024), profitability (Demydyuk & Carlbäck, 2024), retention (Barusman & Rulian, 2020), corporate social responsibility (Xanthopoulou & Plimakis, 2023), and overall organizational performance. In tourism, the focus extends beyond merely assessing satisfaction levels. Researchers also aim to identify strategies that enhance service quality and competitive positioning.
Within this field, segmentation studies have gained prominence (Sánchez-Casado et al., 2023). These studies use satisfaction data to differentiate customer groups based on a range of variables. Some are general, such as tourists’ region of origin (Amoah & Amoah, 2019; Haas, 2002) or travel type (e.g., agrotourism) (Pantiyasa et al., 2023), health tourism (Toni et al., 2023), nature-based heritage tourism (Adie et al., 2023), sports tourism (Bichler & Pikkemaat, 2021), and event tourism (Borges et al., 2016). Others focus on personal factors like gender (F. Zhou et al., 2024), age (Veloso et al., 2021), psychological profile (Kocabulut & Albayrak, 2019), or the presence of a disability (Kamyabi et al., 2023).
The wide range of studies cited above agree on one central point: customer satisfaction, particularly in the tourism context, is a complex and multi-dimensional construct. One of the main challenges in defining and measuring it lies in its strong correlation with other related variables, such as perceived quality and value. This overlap often complicates efforts to isolate satisfaction as an independent factor in empirical research. Several authors, after analyzing various definitions, suggest that satisfaction can be understood as a personal judgment regarding whether a product or specific aspect of a service delivers a gratifying experience during consumption, ranging from insufficient to excessive fulfillment.
Alternatively, it is also described as a mental state arising from the comparison between the perceived outcome of a product or service and the individual’s initial expectations. In summary, customer satisfaction is the consumer’s cognitive–affective judgment that a consumption experience has provided a pleasurable level of fulfillment of personal needs, desires, and expectations (Oliver, 2010). In tourism, this judgment is crucial because the experience itself is the “product”; satisfaction therefore condenses past evaluations and shapes future loyalty, advocacy, and destination competitiveness (Sánchez-Rebull et al., 2018; Castillo Canalejo & Jimber del Río, 2018).
More recent empirical work further refines this view. Satisfaction now appears at the intersection of tourists’ two scarcest resources—money and time—and the experiential value they obtain in situ. Vena-Oya et al. (2021), analyzing 957 real-time activities through multi-level design, show that how visitors allocate both budgets is a direct antecedent of moment-to-moment satisfaction, underscoring that experiential value is co-produced as tourists consume the destination. These findings complement cognitive–affective models (Oliver, 2010) and reinforce calls to treat satisfaction as a dynamic rather than static, post-trip judgment (Tsiotsou, 2005; Sánchez-Rebull et al., 2018). For emerging destinations such as Ecuador, this evidence highlights the need to capture heterogeneous on-site spending patterns when modeling overall satisfaction. Because instruments alone cannot explain why evaluations diverge, we next examine how destination resources interact with satisfaction judgments.

2.2. Destination Competitiveness

Classic models (Dwyer & Kim, 2003; Ritchie & Crouch, 2005) conceptualize destinations as bundles of core resources (attractions, infrastructure, hospitality) and contextual qualifiers (safety, governance). Under the experience-economy paradigm (Pine & Gilmore, 1999), value emerges when those resources create memorable encounters, measured through segment-specific satisfaction indices.
Tourist satisfaction is also closely linked to another complex construct: the tourist destination itself. According to Dmitrović et al. (2009), a tourist destination is “an amalgam of tourist products, services, and public goods consumed under the same brand, thus offering the consumer an integrated experience… a blend of consumer space and tourism products that offer a holistic experience that is subjectively interpreted according to the consumer’s travel itinerary, cultural background, purpose of visit, past experiences, among others” (p. 119).
As noted by Pérez-Campdesuñer et al. (2017), four core dimensions generally influence tourists’ satisfaction with a destination: (1) access, regardless of the transportation mode (though air travel is the most common); (2) the attraction or main motivation for the trip, including the physical and environmental setting where activities occur; (3) accommodation, which is essential regardless of tourism type; and (4) non-hotel services and activities, which every tourist inevitably interacts with during their stay.
Each of the aforementioned dimensions has been the focus of numerous studies. In terms of access, research has explored topics such as airport services (Wu et al., 2021), airline choice (Huang, 2023), and alternative modes of transportation, including rail travel (Ho et al., 2010). Regarding attractions or travel motivations, a wide variety of tourism products has been examined, including golf tourism (Costa et al., 2023), wine tourism (Garner & Kim, 2022), hot springs (Ogunjinml & Binuyo, 2018), water parks (Jin et al., 2015), and spas (Petcu et al., 2021).
Accommodation is arguably the most extensively studied dimension (Ersen et al., 2023; Ghonim et al., 2024), but non-hotel services and social interactions also play a critical role in shaping satisfaction. These include perceived safety (Suryani et al., 2023), gastronomy (Pai et al., 2024), internal transportation (Bohórquez et al., 2020), and shopping opportunities (Liberato et al., 2020), among others.
Each of these dimensions comprises specific attributes that influence and potentially condition tourists’ satisfaction. For this reason, they merit investigation either independently or in conjunction with other components of the tourist experience.
According to Castillo Canalejo and Jimber del Río (2018), two predominant schools of thought are commonly recognized in the analysis of customer satisfaction. The first is the American school, led by Parasuraman et al. (1994), which conceptualizes satisfaction as the result—positive or negative—of a comparison between initial expectations and the actual service received. The most representative model of this school is SERVQUAL (Chango-Cañaveral et al., 2022; Lubis et al., 2021; Shafiq et al., 2019), which evaluates discrepancies between customer expectations and perceptions. Several derivatives of SERVQUAL have emerged, including RURALQUAL (Marković & Šebrek, 2020), SERICSAT (George et al., 2007), and PROSERV (Ciavolino et al., 2020). In conjunction with SERVQUAL, the Kano method has also been applied to classify service attributes into four categories: basic, performance, attractions, and reverse (K. Zhou & Yao, 2023).
The second school, represented by Grönroos (1997), posits that satisfaction stems solely from the actual quality of tourism products and the consumer’s perceptions of that quality. The SERVPERF model (Leong et al., 2015) reflects this approach, emphasizing performance-based evaluation rather than expectations.
Beyond these classical models, more recent approaches have emerged that incorporate advanced analytical techniques. These include text mining (T. Yang et al., 2024), machine learning (Chiny et al., 2021), and facial expression analysis (M. R. González-Rodríguez et al., 2020), among others.
The most widely used model, SERVQUAL, evaluates service quality across five core dimensions: Reliability, referring to the ability to perform services dependably and accurately; Responsiveness, indicating the willingness to help customers and provide prompt service; Empathy, which captures staff’s ability to understand and meet customer needs; Tangibles, concerning the physical facilities, equipment, and appearance of personnel; and Assurance, which relates to the knowledge and courtesy of staff and their ability to inspire trust and confidence.
Empirical findings with millennial travelers in other emerging destinations reinforce the strategic link between image, service quality, and satisfaction. In a study of Belgrade, Travar et al. (2022a) demonstrate that destination image exerts a direct effect on satisfaction and an indirect one via perceived quality—echoing the resource-based logic of Ritchie and Crouch (2005). Destinations capable of curating a coherent brand narrative and delivering consistent service encounters therefore secure a “double dividend” in satisfaction and loyalty. Coupled with evidence that underdeveloped promotion and fragmented management hamper Ecuador’s performance (International Finance Corporation—World Bank, 2022; Mestanza-Ramón et al., 2020), these results justify assessing satisfaction through the dual lens of image stewardship and service execution when evaluating destination competitiveness. Clarifying those core resources is necessary, but we must also decide how to measure their performance in volatile, information-scarce settings.

2.3. Measuring Service Quality and Satisfaction in Emerging Destinations

Having outlined the resource-based underpinnings of destination competitiveness, the next question is how service quality and satisfaction should be measured, especially in information-scarce, volatile settings where travelers lack stable reference points. Expectation–disconfirmation instruments such as SERVQUAL presume well-formed benchmarks, an assumption that often collapses in emerging economies; performance-oriented SERVPERF has therefore shown higher explanatory power in low-contact or volatile contexts (Mhlongo et al., 2025; Shyju et al., 2021).
Yet measurement is only one part of the puzzle. A growing stream of work argues that satisfaction drivers are filtered through travelers’ sociodemographic lenses, which themselves proxy deeper motivational, cultural, and experiential repertoires (Carvache-Franco et al., 2023). Age, for instance, intertwines with the travel-career pattern: younger cohorts typically pursue self-expression, novelty, and social capital, whereas older travelers gravitate toward comfort, safety, and value realization—differences amplified by digital nativity and life-cycle constraints (Travar et al., 2022b). Gender shapes risk appraisal, service expectations, and emotional-labor recognition; women generally place greater weight on cleanliness and interpersonal warmth, whereas men often privilege logistical efficiency and price—value congruence—patterns consistently observed in coastal Latin American destinations (Martín Hernández et al., 2019). Region of origin layers cultural values and sustainability imaginaries onto the evaluation process: North American tourists, steeped in conservationist discourse, reward environmental aesthetics more than Latin American visitors do, whose reference frames are anchored in regional infrastructural baselines and safety heuristics (Martín & Bustamante, 2019).
Despite these insights, most segmentation studies in Latin America examine a single moderator in isolation, which obscures interactions among demographic attributes and masks compound effects on satisfaction. Cross-moderator designs remain scarce even though integrative frameworks are urgently needed to inform granular competitiveness strategies. Moreover, the limited research that does apply a performance-based lens rarely tests whether SERVPERF’s latent dimensions remain stable when multiple visitor segments are analyzed concurrently (R. Velastegui-Hernández et al., 2024).
Positioning itself at this intersection, the present study embeds SERVPERF within a multi-component, multi-moderator framework that treats age, gender, and region of origin as simultaneous filters through which twenty-six destination attributes are appraised. In doing so, it speaks to calls for evidence that transcends descriptive audits and probes the social, cultural, and motivational logics underpinning satisfaction variance in the Global South.
By testing whether the traditional SERVPERF factors remain stable—or fragment—across demographic strata, this research further explores whether performance dimensions are universally robust or contingent upon the sociocultural makeup of the visitor pool. Ultimately, this theorization paves the way for segment-specific service-design and communication strategies calibrated to the nuanced expectations that different traveler groups bring to under-studied Latin American contexts.
With a performance-oriented measurement lens established, the following section examines how demographic factors may further reshape the satisfaction dimensions. Measurement choices still overlook who interprets performance cues; the following section therefore reviews demographic moderators of tourist behavior.

2.4. Demographic Moderators of Tourist Behavior

Multiple studies report heterogeneous satisfaction patterns linked to age, gender, and cultural background. Younger travelers privilege experiential variety and digital convenience (Amoah & Amoah, 2019); women weigh safety and accommodation quality more than men, who focus on transport reliability (Veloso et al., 2021). Regional origin shapes expectations of environmental aesthetics and service etiquette (Kusumawardani & Aruan, 2019; F. Zhou et al., 2024). These findings justify using the three demographic variables as segmentation lenses for Ecuador.
Beyond age and gender, sustainability perceptions increasingly differentiate tourist segments. Using machine-learning clustering, Vidal-Meliá et al. (2025) identify four segments that vary simultaneously in satisfaction, perceived sustainability, and socio-demographics, showing that “green enthusiasm” and age jointly shape satisfaction profiles. Similarly, an analysis of user-generated content in whale-watching tourism reveals that sustainability concerns now weigh heavily in satisfaction judgements—particularly among younger users (León et al., 2025). These insights dovetail with earlier evidence of age-, gender-, and origin-based differences (Amoah & Amoah, 2019; F. Zhou et al., 2024) and support our decision to examine Ecuadorian tourists along those demographic axes while acknowledging that sustainability salience may further nuance the segments.
These attributes manifest in various ways depending on the specific processes, services, or products with which tourists interact during their journey through a destination. For instance, environmental quality plays a crucial role (Yusof et al., 2017), as does the physical environment of airports, airlines, and hotels (Moon et al., 2016; Chung & Choi, 2019). Comfort is often highlighted as a distinctive factor influencing satisfaction (Özkul et al., 2020; Nagy & Carr, 2018), along with attention time, which is critical across all types of services (J.-S. Chen, 2017). Other key factors include the availability and clarity of information (Grechyn & McShane, 2021; Cassandra et al., 2021) and the perceived quality–price ratio (Kusumawardani & Aruan, 2019; Kim & Canina, 2015).
In summary, the literature confirms that the attributes shaping tourist satisfaction are inherently complex and diverse, reflecting the multifaceted nature of the tourism experience. These demographic patterns suggest that age, gender, and origin behave less like passive descriptors and more like resources, which we term demographic capital.

2.5. Demographic Capital: Conceptual Foundations

Scholars have long recognized that tourists do not arrive at a destination as tabulae rasae; rather, they carry enduring resources and dispositions that shape how they decode service cues and transform them into satisfaction. Building on Bourdieu’s (1984, 1986) well-known trilogy of economic, social, and cultural capital, we introduce demographic capital as a fourth, complementary form. We define demographic capital as the bundle of age, gender, and region-of-origin attributes that (a) are socially recognized, (b) confer differential access to travel resources, and (c) condition perceptual filters through which service performance is interpreted. Like Bourdieu’s other capitals, demographic capital is durable—age cohorts move together over time, gender identities are relatively stable, and regional habits are acquired early in life—yet it is also convertible, influencing and being influenced by cultural and economic capital (cf. Ahmad, 2014).

2.5.1. Positioning in the Literature

Most tourism studies still treat age, gender, or nationality as mere segmentation descriptors (Dolnicar, 2008) rather than as resources with their own structuring logic. The few exceptions—e.g., E. C. L. Yang et al. (2019) on “gendered mobility capital”, Wong and Musa (2020) on “ageing tourism capital”, and Campo and Garau (2008) on nationality effects, confirm that demographic markers alter both what tourists value and how they appraise service encounters. However, these strands have not yet been integrated into a single construct. By conceptualizing demographic attributes as capital, we extend travel-career theory (Pearce, 2005) and consumer-acculturation work (Otnes & McGrath, 2019), offering a meso-level lens that links individual dispositions to marketplace structures.

2.5.2. Distinction from Related Constructs

Demographic capital differs from human capital (Becker, 1993) in that it is ascribed rather than achieved; tourists do not earn their age or birthplace. It also diverges from cultural capital, which concerns symbolic competencies such as language or taste (Frías-Jamilena et al., 2018). While cultural capital mediates service evaluations, our focus is on baseline demographic markers that precede—and often delimit—the accrual of other capitals. Treating these markers as capital foregrounds their exchange value in tourism contexts: a North American passport (region capital) may ease border crossings, just as a younger age affords higher risk tolerance in adventure travel (Sharma et al., 2012).

2.5.3. Theoretical Implications for SERVPERF

Framing age, gender, and region as demographic capital is illuminating because performance-based scales such as SERVPERF may display moderated effects in emerging destinations. Expectation formation—the fulcrum of SERVQUAL—presumes stable reference standards, yet, in volatile contexts, travelers rely more heavily on demographic heuristics (“people like me travel this way”) to interpret service quality (R. J. C. Chen et al., 2020). Our model (Figure 2) therefore treats demographic capital as a second-order moderator that amplifies or dampens the impact of each SERVPERF dimension on overall satisfaction. Empirically, this means that the same reliability score can generate different satisfaction outcomes depending on a tourist’s capital endowment, a pattern we test via multi-group invariance.

2.5.4. Practical Relevance

Recognizing demographic capital helps destination managers move beyond surface segmentation toward capital-sensitive design. For instance, safety signage that resonates with female solo travelers leverages gender capital (Kwok et al., 2016), while eco-storytelling that aligns with North American environmental imaginaries taps region capital. Such calibration echoes Pine and Gilmore’s (1999) experience-economy dictum: value emerges when service scripts match the visitor’s embodied resources.
In sum, demographic capital provides the conceptual scaffolding that converts our descriptive moderators into theoretically meaningful dimensions. It explains why age, gender, and region do more than partition datasets; they shape the very calculus through which service performance is translated into tourist satisfaction. With demographic capital defined, the final subsection synthesizes the framework and states our research questions.

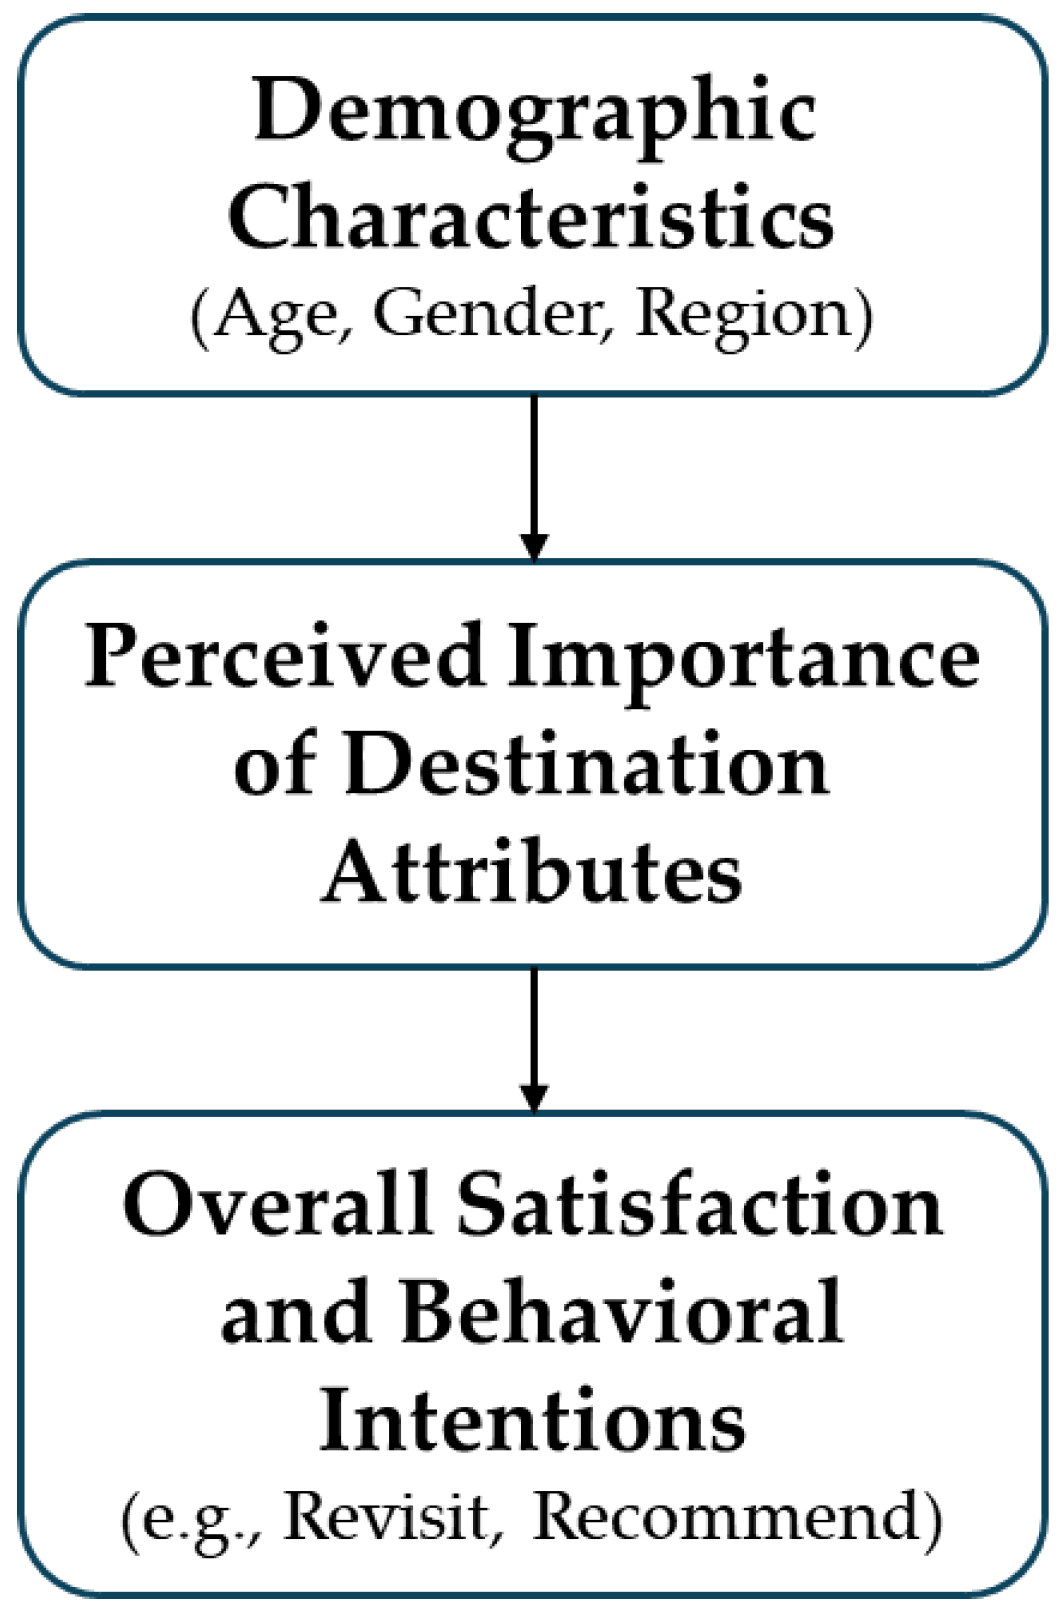
2.6. Conceptual Model and Research Questions

Tourist satisfaction has evolved from a uni-dimensional post-purchase emotion to a multi-dimensional, experience-centered judgment (Oliver, 2010). In destination studies, satisfaction summarizes the value fit between a place’s attribute bundle and the visitor’s expectations, conditioning both loyalty and place competitiveness. Classic competitiveness models (Dwyer & Kim, 2003; Ritchie & Crouch, 2005) emphasize that such value fit is not monolithic: it reflects heterogeneous expectations linked to age, gender, and cultural background. Recent empirical work indeed finds pronounced segment effects on evaluation patterns in rural (Amoah & Amoah, 2019), academic (Veloso et al., 2021), and solo-female travel (F. Zhou et al., 2024) settings. Building on this stream, Figure 2 synthesizes how demographic moderators interface with attribute perceptions and overall satisfaction, leading to the research questions that follow.
Figure 2 represents the theoretical links: demographic characteristics influence the salience of destination attributes, which in turn determine overall satisfaction and behavioral intentions.
The framework integrates Expectation–Confirmation Theory with destination-competitiveness logic. Accordingly, we ask the following:
  • RQ1. Do tourists’ overall satisfaction scores differ across age, gender, and region of origin?
  • RQ2. Does the importance and factorial structure of destination attributes vary by those demographics?
Answers to these questions guide the empirical design described in Section 3 and underpin the managerial recommendations discussed later.
This diagram clearly shows the causal logic assumed in the conceptual framework: demographic factors influence how destination attributes are evaluated, which in turn determines overall satisfaction and future tourist intention.
Taken together, Section 2.1, Section 2.2, Section 2.3, Section 2.4, Section 2.5 and Section 2.6 reveal two gaps: a theoretical gap—how demographic capital reshapes the meaning of performance cues—and an empirical gap, the lack of multi-group invariance tests in emerging destinations. We close both gaps by embedding twenty-six destination attributes in a SERVPERF framework and estimating multi-group confirmatory-factor models across age, gender, and region of origin. This design allows us to trace where SERVPERF holds, where it flexes, and how those shifts map onto demographic capital. Section 3 details the dataset, measurement instrument, and analytical procedures.

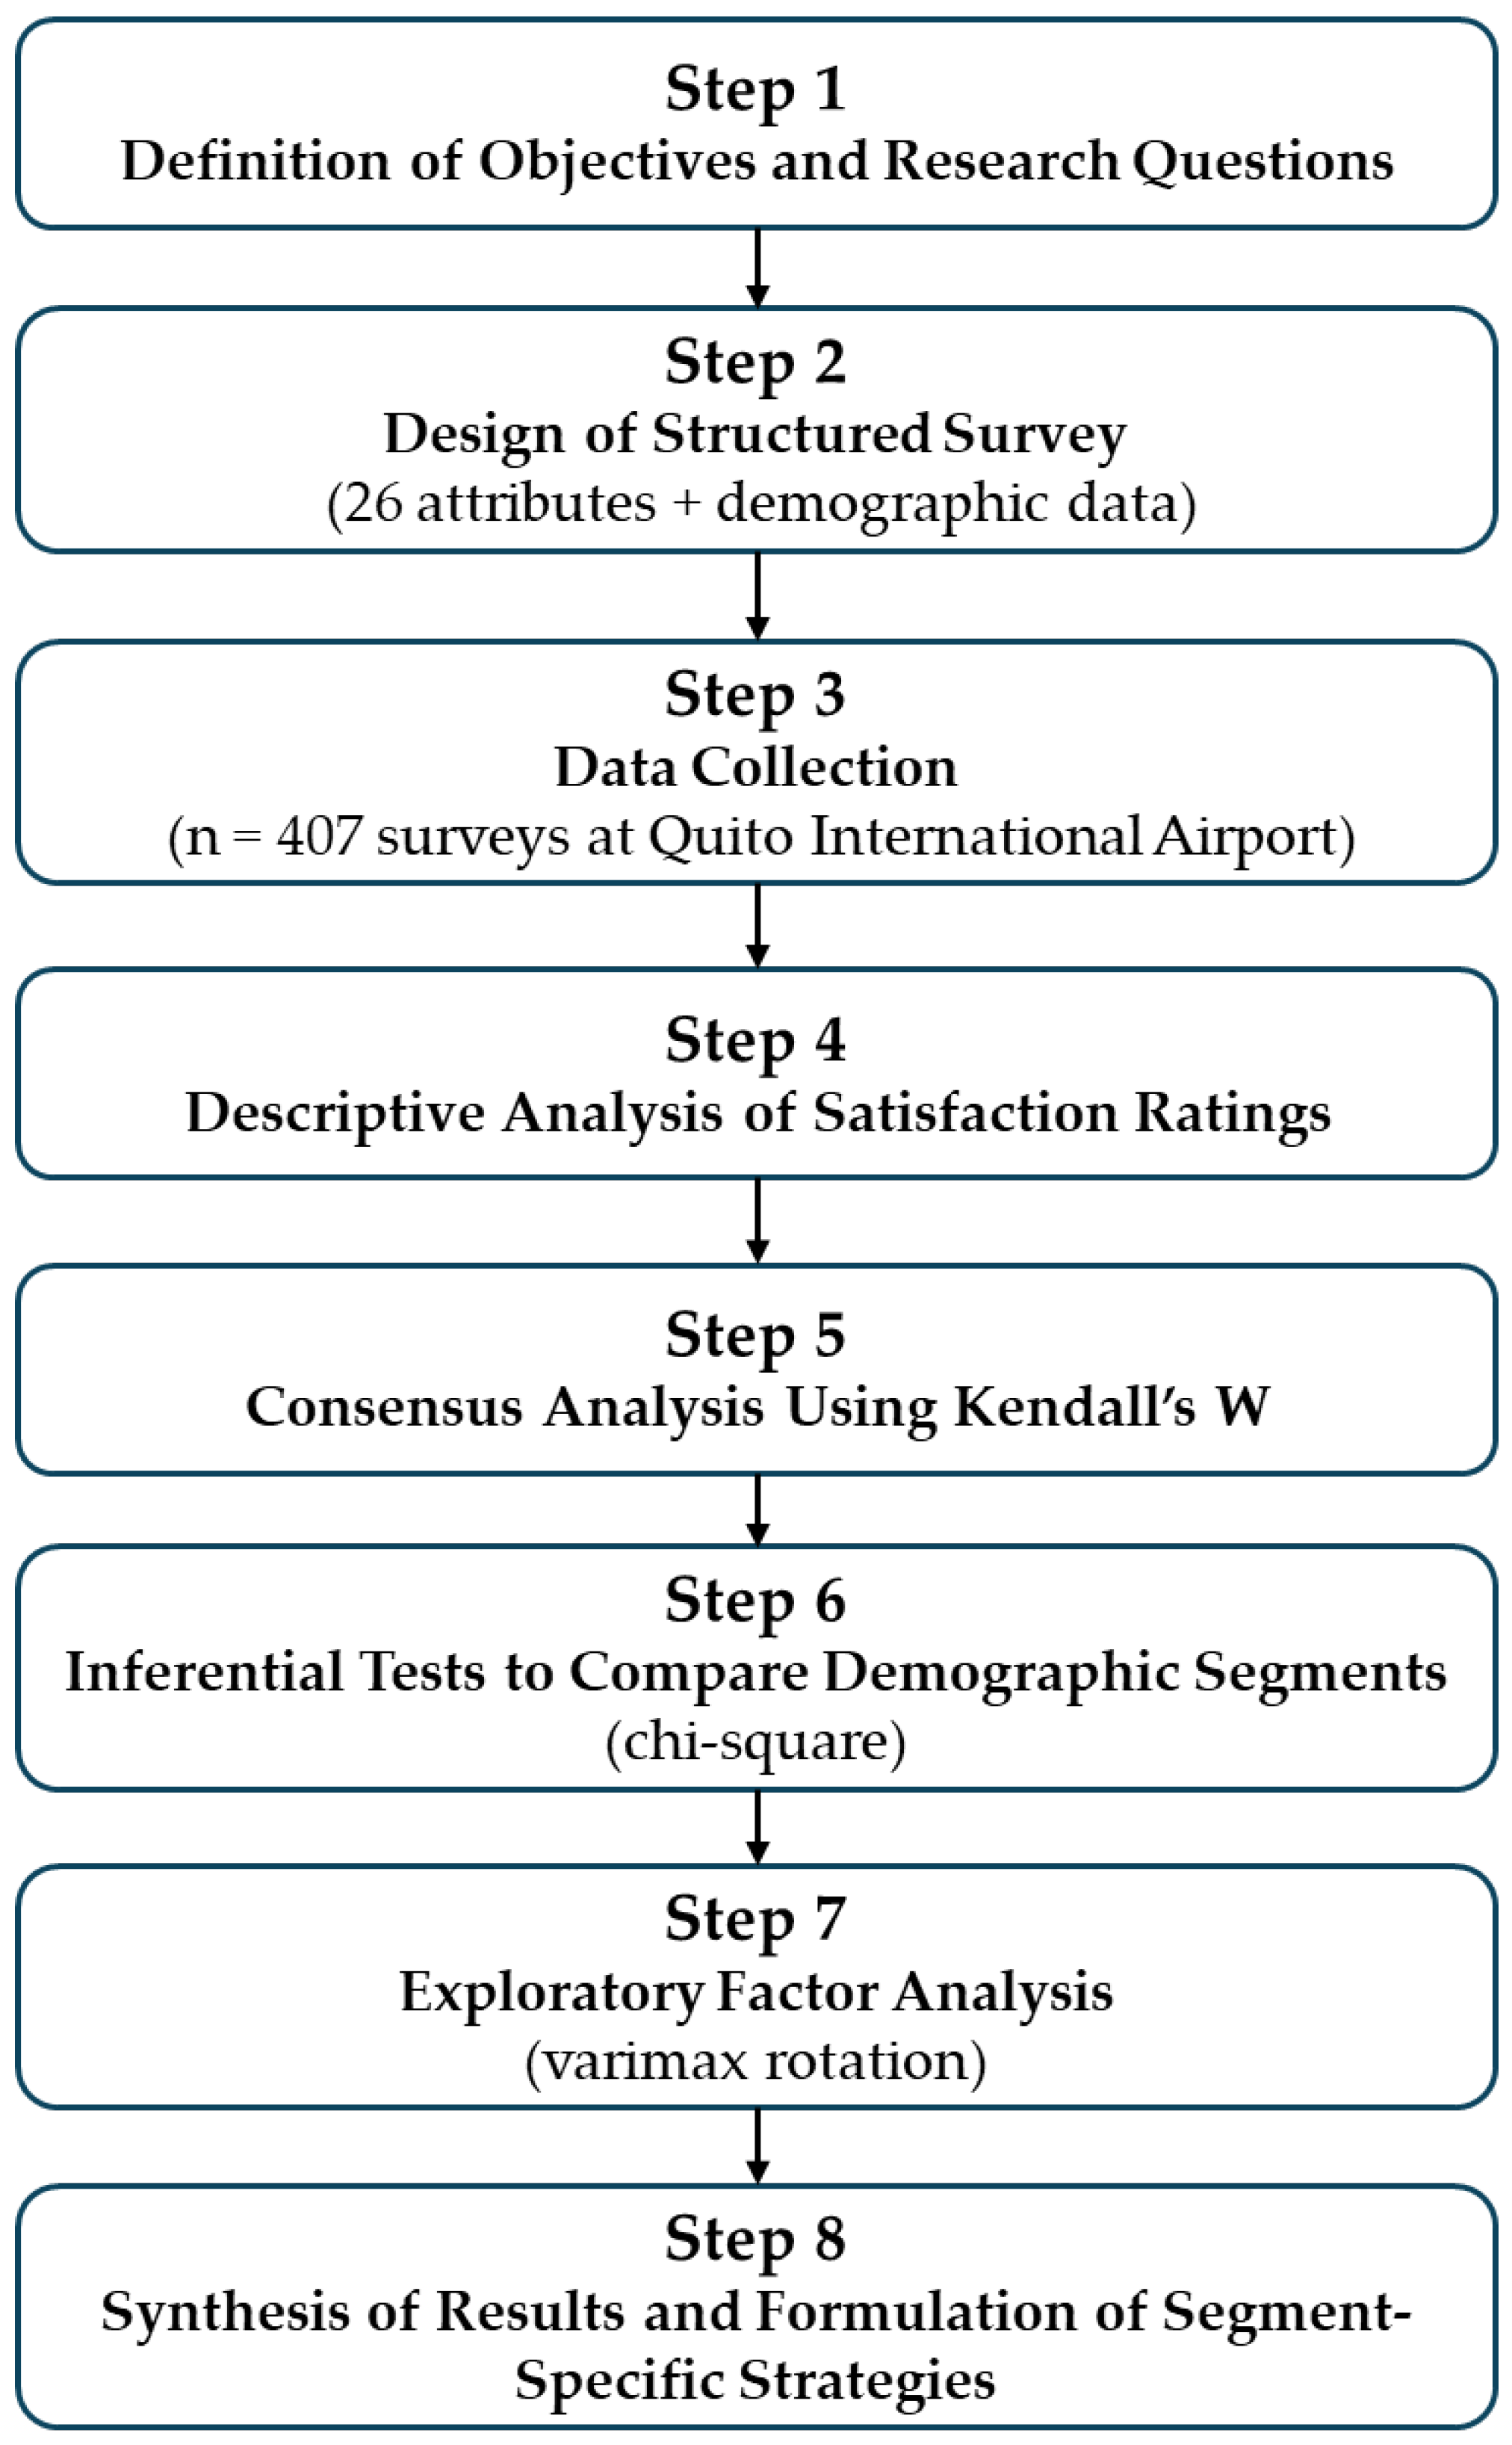
3. Materials and Methods

To determine whether tourist satisfaction in Ecuador varies by age, gender, and region of origin, we adopted a quantitative, cross-sectional design and surveyed 407 international travelers departing Mariscal Sucre International Airport (Quito) during the 2022 high seasons (June–August, December). Each respondent rated the importance and perceived performance of 26 destination attributes. Consensus priorities were derived with Kendall’s coefficient of concordance; attribute-level Customer-Satisfaction Indices (CSIs) were computed; group differences were tested with χ2 and MANOVA; and the latent structure of perceptions was explored via principal-component analysis (varimax) and validated through confirmatory and multi-group CFA. This sequence enabled the identification of segment-specific drivers and the formulation of targeted managerial recommendations.

3.1. Population and Sample Design

We employed a two-stage, proportionally stratified design that preserves the full diversity of “travel-capital” profiles arriving in Ecuador.
  • Sampling frame: All international passengers departing Mariscal Sucre Airport on commercial flights during the 2022 high-season windows, which the Ministry of Tourism identifies as yielding the broadest mix of source regions and travel purposes.
  • Selection method: Systematic interval sampling within each outbound flight, with quotas proportional to aircraft capacity, thereby avoiding carrier or time-band bias. In addition, regional strata (Latin America, North America, Europe, Asia–Pacific, Australia) were aligned with 2022 arrival shares published by National Institute of Statistics and Censuses of Ecuador—INEC (2023), in line with UNE-ISO 20252:2019 (International Organization for Standardization—ISO, 2019).
  • Sample-size rationale: Using Cochran’s finite-population correction (Equation (1)) with N = 1,264,913 inbound tourists (National Institute of Statistics and Censuses of Ecuador—INEC, 2023), a 95% confidence level (z = 1.96), p = q = 0.50, and e = 0.05 yielded a minimum of 385 cases. The final 407 usable questionnaires reduce the margin of error to 4.9% and exceed power thresholds for the subsequent MANOVA and multi-group CFA (Cochran, 1977; Daniel, 1999).
n = N p q z 2 e 2 N 1 + z 2 p q
where
  • N: Population size.
  • p: Probability of success (0.5).
  • q: Probability of failure (0.5).
  • e: Researcher error (5%).
  • z: Constant of the normal distribution is 1.96 for the 95.5% confidence level.
To capture demographic heterogeneity and enhance the validity of segmentation analysis, data collection was carried out at the Mariscal Sucre International Airport in Quito, the country’s main international gateway. This purposive sampling strategy targets tourists at their point of departure, a common technique in satisfaction studies seeking to measure retrospective perceptions of the entire destination experience (e.g., Amoah & Amoah, 2019; Travar et al., 2022a).
Table 1 shows the demographic composition of the sample. There is a slight predominance of female respondents. In terms of age, all four age groups are represented with relatively similar proportions. Regarding region of origin, the sample distribution closely mirrors the actual tourist arrival data by region reported for Ecuador in 2022, ensuring proportional representation.

3.2. Survey Instrument

To define the attributes to be assessed within each dimension, we used the findings of Pérez-Campdesuñer et al. (2018) as a starting point (see Table 2). That study identified four key dimensions of tourist destinations through factor analysis, although in a context different from Ecuador. Prior to the main survey, a bibliometric scan of the tourist satisfaction literature was performed to contextualize this study (Figure 1). All records indexed in Scopus under the query TITLE-ABS-KEY (“touristsatisf”) were downloaded on 4 January 2024. After removing duplicates and non-article items, 2846 documents remained. Yearly publication counts were plotted in R; country frequencies were mapped in QGIS; and keyword co-occurrences were visualized in VOSviewer, using a threshold of ten keyword occurrences and the LinLog algorithm. Full search string, date, software versions, and processing steps are reported in each figure caption.
Instrument reliability proved satisfactory: the 26-item pool produced Cronbach’s α = 0.92 (pilot, n = 100) and Composite Reliability (CR) values ranging from 0.88 to 0.95 in the full sample. Average Variance Extracted (AVE) exceeded the 0.50 threshold for every latent factor, and the HTMT ratios remained below 0.85, indicating discriminant validity (Hair et al., 2022).
The survey was structured into three sections:
  • Demographics: Age group (under 25, 25–44, 45 and above), gender, and region of origin (Europe, North America, Latin America, others). Segmenting the sample by age, gender, and region of origin follows recommendations from prior research highlighting how demographic moderators shape tourists’ perceptions and satisfaction (León et al., 2025; F. Zhou et al., 2024).
  • Attribute Evaluation: Tourists rated 26 destination attributes, grouped into three categories: Access attributes (e.g., airport services, transportation); Lodging attributes (e.g., cleanliness, service); and Non-hotel services (e.g., gastronomy, safety).
  • Each attribute was rated using two scales: Importance (1 = Not important, 5 = Very important) and Satisfaction (1 = Very dissatisfied, 5 = Very satisfied).
  • Open questions (optional) allowed participants to provide qualitative impressions or suggestions.
Diagnostics are reported in Table 3.
This structure allowed for both descriptive and inferential analysis, enabling the identification of demographic differences in satisfaction patterns and the extraction of underlying satisfaction dimensions across segments.
These results were submitted for evaluation by a panel of seven experts, all with over 10 years of experience in research and teaching and holding postgraduate degrees. Overall, the experts validated the findings and recommended several adjustments. Specifically, they suggested the following: (1) not treating the “reception” attribute independently but integrating it within the broader category of staff professionalism; (2) merging the “comfort of accommodation” and “cleanliness” attributes under a single “comfort” dimension; and (3) excluding the “animation” attribute, which was deemed relevant only for a limited segment of accommodations.
In the non-hotel activity category, they recommended considering “transport comfort” as part of the overall technical condition of transportation and omitting the “general information” attribute, as this is now typically accessed through mobile devices. Additionally, they advised adding the “quality–price ratio” attribute, which, although not present in the original reference study, has been widely recognized in other works (Kusumawardani & Aruan, 2019; Kim & Canina, 2015). The remaining attributes aligned with those identified in prior research.
Based on the final list of attributes, two instruments were designed: one to assess the importance of the attributes and dimensions of the destination and another to evaluate tourists’ perceptions of their actual state. In the latter instrument, tourists rated each attribute on a scale from 1 to 10. A preliminary application to 100 tourists confirmed the semantic, idiomatic, experiential, and conceptual validity of the instruments. Content validity was assessed using the Lawshe method, yielding a coefficient of 0.51, considered adequate for the number of experts consulted (García Sedeño & García Tejera, 2013). The final survey was conducted at the airport as tourists were leaving the country.

Rationale for Using SERVPERF in Volatile, Information-Scarce Contexts

Performance-only scales such as SERVPERF outperform expectation–disconfirmation measures (e.g., SERVQUAL) when visitors lack stable reference points—a pattern typical of emerging destinations where information asymmetries, institutional volatility, and media risk amplification prevail. Prior work in sub-Saharan Africa and South Asia shows that SERVPERF yields higher convergent validity and lower method bias under those conditions (Mhlongo et al., 2025; Shyju et al., 2021). Given Ecuador’s recent waves of sociopolitical unrest and heterogeneous service standards, we adopted SERVPERF to minimize expectation noise and capture perceived performance more faithfully.
A bilingual forward–backward translation procedure was implemented, followed by a content-validity panel (n = 7 experts) whose Lawshe CVR average (0.51) exceeded the 0.42 threshold for seven raters. A 100-respondent pilot confirmed semantic clarity and eliminated three redundant items, leaving 26 attributes across Access, Lodging, Extra-Hotel Services, and Attractions.

3.3. Data Processing and Analysis

Data were processed through a six-step validation and testing protocol:
  • Index Construction: A satisfaction index was calculated for each attribute by weighting satisfaction scores by importance to better reflect perceived value. The index helped identify the most influential attributes in overall tourist experience. For each respondent a Customer Satisfaction Index (CSI) was computed with Equation (2), presenting the weighted aggregation used to calculate the CSI, following methods widely adopted in tourism research (Alegre & Garau, 2010; Tsiotsou, 2005).
ISC   =   i = 1 26 I A i E i
where IAi is the importance of attribute i, and Ei is the evaluation of attribute i. The CSI was calculated as a weighted sum of the satisfaction ratings, where each attribute was multiplied by its relative importance weight.
2.
Segment comparison: Mean CSI scores and individual-attribute ratings were contrasted across the twelve demographic cells (4 age × 2 gender × 3 region) through one-way ANOVA with Games–Howell post hoc tests (α = 0.05). Partial η2 provided effect sizes, while chi-square tests served as measurement invariance checks for categorical splits.
3.
Consensus analysis: Kendall’s W quantified intra-segment agreement on attribute priorities. Values ≥ 0.70 were interpreted as strong consensus (Vidal-Meliá et al., 2025), guiding the managerial relevance of segment profiles.
4.
Exploratory factor analysis (EFA): To uncover latent structures among the 26 attributes, principal-axis factoring with Promax rotation (κ = 4) was run on the full sample (n = 407). Factor retention followed (a) eigenvalues > 1, (b) scree plot inflection, and (c) parallel analysis; sampling adequacy was confirmed by KMO ≥ 0.80 and Bartlett’s test p < 0.001.
5.
Confirmatory factor analysis (CFA) and multi-group invariance: A four-factor SERVPERF model was estimated with robust maximum-likelihood (MLR). Goodness-of-fit thresholds were CFI ≥ 0.95, TLI ≥ 0.95, RMSEA ≤ 0.06, and SRMR ≤ 0.08 (Hu & Bentler, 1999). Multi-group CFA then evaluated configural, metric, and scalar invariance across age, gender, and region; ΔCFI ≤ 0.01 signaled acceptable invariance (Cheung & Rensvold, 2002).
6.
Multivariate mean testing and validity diagnostics: MANOVA examined simultaneous mean differences in CSI and factor scores; significant omnibus effects were decomposed by Games–Howell contrasts. Common-method variance was checked with Harman’s single-factor test (<30%), multicollinearity with VIF < 3, and parameter stability with 2000-draw bootstrap standard errors.
7.
Validity and reliability diagnostics: Internal consistency and construct validity satisfied all recommended cut-offs: Cronbach’s α ranged from 0.88 to 0.94, Composite Reliability (CR) from 0.88 to 0.95, and Average Variance Extracted (AVE) from 0.53 to 0.77. Discriminant validity was confirmed through heterotrait–monotrait ratios (HTMT < 0.85). Multi-group CFA established configural, metric, and scalar invariance across age, gender, and region, with ΔCFI ≤ 0.01 in every step. Detailed coefficients and fit indices appear in Table 3 (measurement-model diagnostics) and Table 4 (invariance testing). All analyses were run in SPSS 27 and R 4.3 (lavaan, psych).
Figure 3 provides a visual summary of the methodological sequence, from the formulation of research questions to the synthesis of findings and strategic recommendations. This diagram complements the detailed descriptions provided in Section 3.1, Section 3.2 and Section 3.3.
The importance of each attribute was determined using Kendall’s coefficient of concordance, which measures the level of agreement among respondents. Perceived satisfaction for each attribute was calculated as the average of the tourists’ ratings obtained through the applied survey instrument.
Based on the behavior of the Satisfaction Index by Components (ISC), a descriptive analysis was conducted for each demographic group in the sample. These descriptive results were followed by inferential analysis: a chi-square test was applied to evaluate the statistical significance of the observed differences between the groups.
Next, an exploratory factor analysis (EFA) was carried out using the principal component extraction method with varimax rotation. This analysis aimed to identify latent dimensions underlying the observed satisfaction ratings and to validate the structural coherence of the instrument. Subsequent multi-group confirmatory factor analyses tested factorial invariance across age, gender, and region-of-origin segments to ensure that any observed differences were not artifacts of measurement.

3.4. Final Considerations

Participants gave informed, voluntary, and anonymous consent; no personal identifiers were recorded, and all procedures met institutional ethics standards. To address warnings that SERVPERF’s four-factor core can fracture across demographic strata (J. Velastegui-Hernández et al., 2024; R. Velastegui-Hernández et al., 2024), we conducted multi-group invariance tests. Configural, metric, and scalar fits remained within ΔCFI ≤ 0.01, confirming structural measurement invariance and legitimizing segment-level comparisons.
Three caveats should be noted. First, the cross-sectional design precludes causal inference. Second, airport passengers may not mirror land- or sea-border entrants, even though they represent 78% of Ecuador’s international arrivals (National Institute of Statistics and Censuses of Ecuador—INEC, 2023). Third, self-report data can carry social-desirability bias despite the anonymity assurance.

4. Results

Results are reported in seven steps: sample profile, factor structure, measurement diagnostics, invariance, segment-level satisfaction indices, hypothesis testing, and post hoc segment profiling.

4.1. Sample Profile

Table 1 and Table 2 summarize the 407 valid surveys: 54% of respondents were women, just over half were younger than 40, and Latin- and North American visitors together made up nearly three-quarters of the sample—proportions that closely track INEC’s 2022 arrival data.
Preliminary comparisons already hint at segment contrasts. Younger tourists emphasize experiential variety, women rate lodging quality higher than men, and North American visitors are especially attuned to environmental aesthetics. These initial signals foreshadow the more detailed multi-group analyses that follow and underscore why a uniform improvement strategy would miss important demographic nuances.

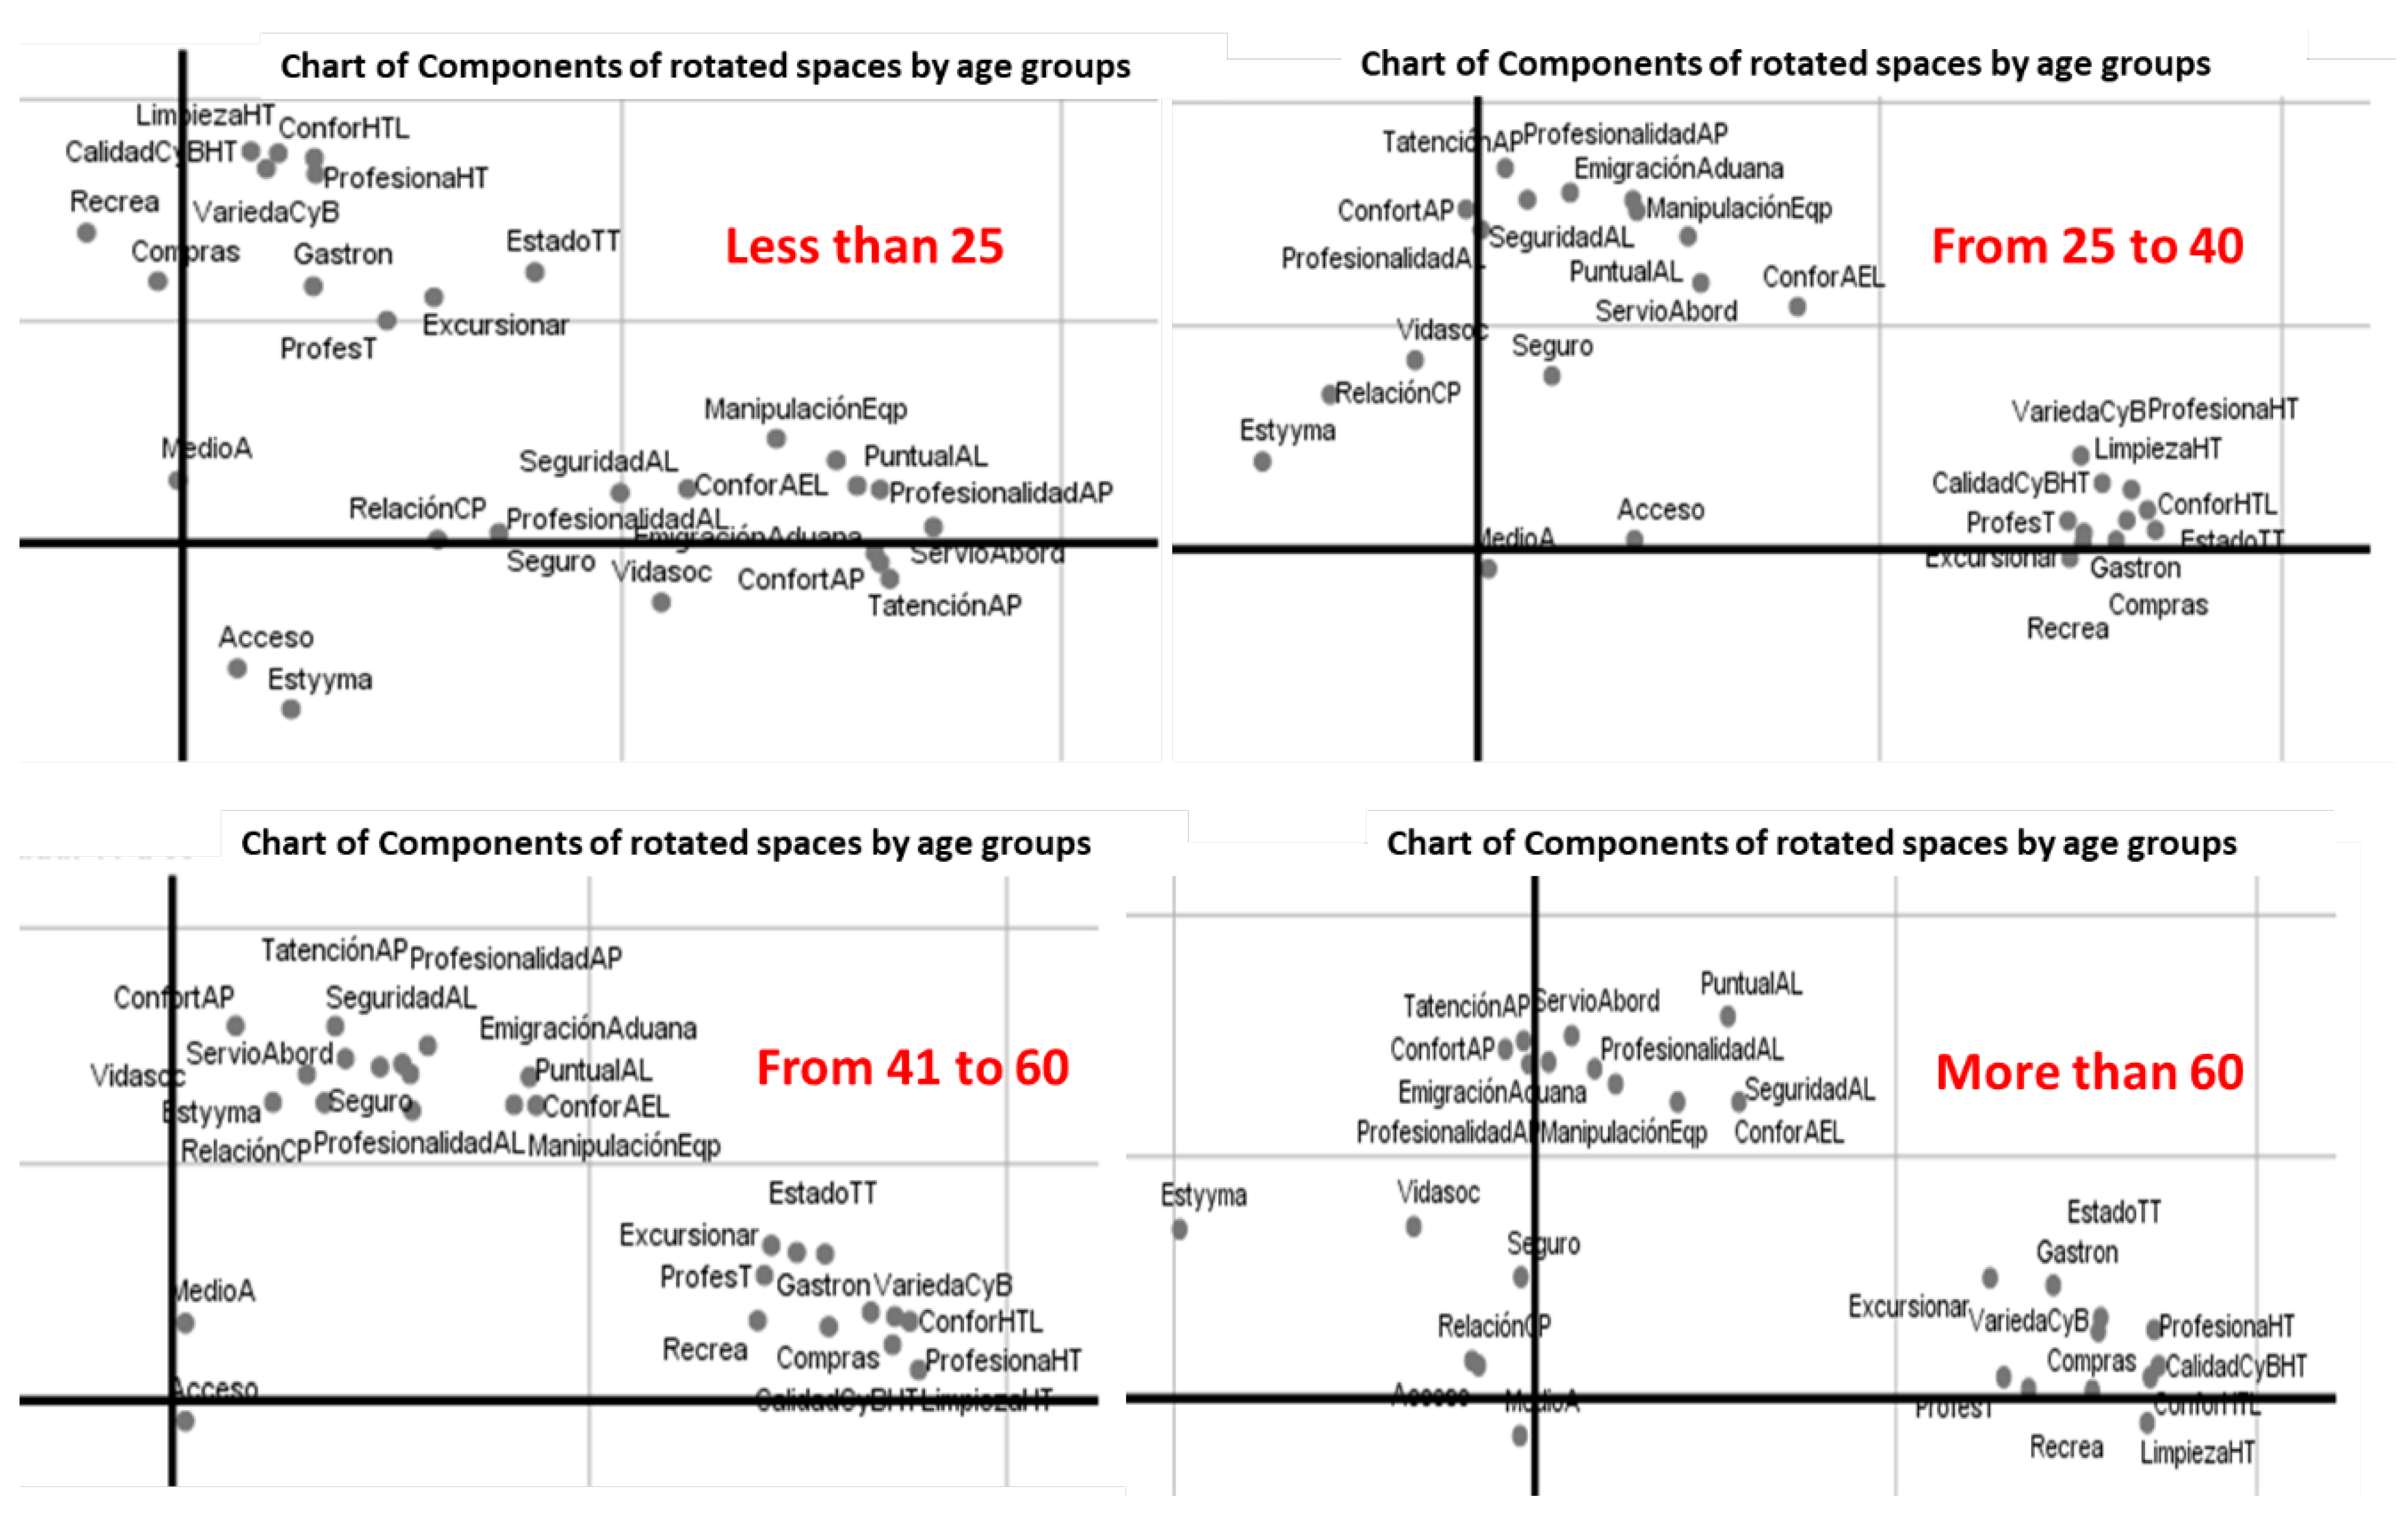
4.2. Exploratory Factor Analysis

Principal-axis factoring with Promax rotation (κ = 4) was applied to the 26 attributes. The Kaiser–Meyer–Olkin index reached 0.929, and Bartlett’s test of sphericity was significant (χ2 = 47,812; p < 0.001), confirming that the data are suitable for factor extraction. Four components emerged: Access, Lodging, Extra-hotel Services, and Attractions, replicating the structure reported by Pérez-Campdesuñer et al. (2018) and explaining 76.4% of the total variance.
To assess the measurement invariance of this solution across demographic segments, the analysis was repeated by sex, age, and region of origin.
Comparative results are summarized in Table 5:
  • KMO values ranged from 0.886 (Latin American visitors) to 0.773 (tourists under 25), all above the acceptable threshold (≥0.70).
  • In every group—except the combined Asia–Australia segment (determinant = 0.0)—the same five-factor solution was retained. Differences in explained variance suggest greater internal heterogeneity in segments with lower KMO values.
In sum, the factor model demonstrates convergent validity at the aggregate level and acceptable consistency within each subsample, with minor variations that warrant the multi-group analyses presented in the following sections.

4.3. Measurement-Model Diagnostics

The pooled confirmatory-factor analysis (CFA) for the four latent dimensions—Access, Lodging, Extra-hotel Services, and Attractions—showed an excellent overall fit (χ2/df = 2.11; CFI = 0.957; TLI = 0.945; RMSEA = 0.052; SRMR = 0.041).
  • Indicator loadings: Standardized loadings for the 26 items ranged from 0.63 to 0.88 (p < 0.001), well above the 0.50 practical-significance benchmark, yielding item reliabilities (λ2) between 0.40 and 0.77.
  • Internal consistency: Composite Reliability (CR) values fell between 0.81 and 0.93, and Cronbach’s α coefficients fell between 0.78 and 0.92, surpassing the ≥0.70 guideline for both exploratory and confirmatory work (Hair et al., 2022).
  • Convergent validity: Average Variance Extracted (AVE) exceeded the recommended 0.50 threshold for each dimension—Access = 0.55, Lodging = 0.59, Extra-hotel Services = 0.57, and Attractions = 0.62—indicating that the indicators capture more than half of the variance in their respective factors.
  • Discriminant validity: Heterotrait–monotrait ratios (HTMT) ranged from 0.31 to 0.84, all below the conservative 0.85 ceiling. The Fornell–Larcker criterion was also satisfied: for every dimension pair, the squared inter-dimension correlation was lower than the smaller of the two AVE values, confirming that each factor shares more variance with its own items than with any other latent dimension.
Collectively, these statistics demonstrate that the refined four-factor measurement model is reliable, convergent, and discriminant, providing a solid foundation for the multi-group analyses presented in Section 4.4, Section 4.5 and Section 4.6.

4.4. Descriptive Satisfaction Indices

Table 6 reports the composite satisfaction index (ISC) by age, gender, and region.
Although most group means cluster between 6.4 and 6.9, three patterns stand out. First, age effects are modest but directional: under-25s post the highest overall ISC, driven by non-hotel activities, whereas the 60-plus cohort scores highest on lodging and attractions. Second, gender gaps are small; women register marginally higher satisfaction in access, lodging, and attractions, while men edge ahead—by barely a tenth of a point—in non-hotel services. Third, regional variation is narrow (≤0.08 ISC units) yet consistent: Asia and Australia lead, while Latin America and North America lag, with the latter two segments rating access services noticeably lower than their counterparts. These descriptive contrasts set the stage for the multi-group tests that follow.

4.5. Hypothesis Testing

Following the ISC analysis by segment, a hypothesis test was conducted to determine whether the observed mean differences were statistically significant. The results, summarized in Table 7, indicate that, in most attributes, there are significant differences when comparing tourists by gender, age group, and region of origin. The only attributes for which no statistically significant differences were found are as follows: safety and service time within the access dimension; recreation within non-hotel services; and safety and accessibility within the attractions dimension.

4.6. Post Hoc Segment Profiles

Multi-group exploratory factor analyses (EFAs) were run to clarify how the 26 satisfaction attributes coalesce within each demographic stratum. In every segment except Asia–Australia and the under-25 cohort, five factors reproduced the four SERVPERF dimensions plus “Attractions and Environment”, explaining ≥ 70% of variance (see Table 5). The weaker fit in those two segments (variance ≈ 60%) signals either greater internal heterogeneity or limited cell size and is therefore interpreted cautiously.
Figure 4 illustrates the age-specific factor maps. Two contrasts are salient. First, under-25 travelers’ weight “Transport reliability” and “Perceived safety” least, pulling those variables to the periphery, whereas 45-plus tourists load most heavily on “Lodging comfort” and “Local gastronomy”, reinforcing the comfort-seeking pattern observed in the ISC means. Second, heritage interpretation and guided activities cluster near the origin for Gen-Z respondents, suggesting low salience, but move toward the experiential quadrant for older cohorts.
These age effects persist after controlling for trip purpose and length of stay (ANCOVA, F = 4.12, p < 0.01) and are directionally consistent with cohort studies that cite budgetary and time constraints as amplifiers of functional risk among emerging adults (Pasaco-González et al., 2023). Nevertheless, we acknowledge that our survey did not measure psychographics such as novelty seeking or uncertainty avoidance; any motivational inference remains tentative and is flagged as such for future research.
Overall, the post hoc profiles confirm that satisfaction drivers are segment-specific rather than universal, underscoring the managerial need for differentiated service bundles, youth-focused logistical certainty versus comfort-rich amenities for mature travelers.
After confirming significant mean differences, we conducted separate PCA solutions (varimax rotation) for each demographic stratum to see whether the 26 attributes clustered differently by segment. All strata except Asia–Australia and <25 years converged on five factors; those two outliers required six, indicating higher within-group heterogeneity (Table 5).
Figure 5 plots the two leading rotated components by age. For Gen-Z travelers (under 25), lodging and non-hotel items dominate the first component (x-axis), whereas access items load mainly on the second (y-axis). Among prime-age cohorts (25–40 and 41–60), the pattern flips: access attributes shift to the first component and service items to the second. In the oldest segment (over 60), the same two factors emerge but with higher communalities, signaling a more crystallized cognitive schema. Across all cohorts, attraction and environment variables cluster near the origin, confirming a baseline importance that is largely age-invariant.
Post hoc ANOVA shows that the <25 group reports the lowest scores for transport reliability and safety (F = 4.32, p < 0.01), whereas the 41–60 cohort scores highest on lodging comfort and gastronomy. A plausible—though provisional—interpretation is life-cycle-related: early-career travelers, working with tighter budgets and time limits, penalize logistical frictions more heavily, while mature cohorts, armed with greater “travel capital”, place extra value on tangible amenities (Pasaco-González et al., 2023). Because we did not measure psychographic dimensions (e.g., novelty seeking, uncertainty avoidance), this explanation remains tentative and is revisited in this study’s limitations.
The biplot displays the first two rotated components (Factor 1 on the x-axis, Factor 2 on the y-axis). The farther a point lies from the origin, the greater its influence on that segment’s satisfaction; proximity between points indicates similar perceptions across groups.
Figure 6 displays the gender-specific factor map. Among male travelers, most attributes spread horizontally along Factor 1 (x-axis), indicating that their satisfaction is driven chiefly by the first composite dimension, dominated by access logistics and transport reliability. For female travelers, attributes cluster vertically on Factor 2 (y-axis), showing a stronger dependence on the second dimension, which is anchored in lodging quality, staff professionalism, and perceived safety.
These structural contrasts suggest differentiated priorities: investments in safe, reliable transport and clear wayfinding will yield greater returns with male visitors, whereas enhancements in accommodation cleanliness, service empathy, and food quality are more likely to boost satisfaction among female guests.
Figure 7 plots gender-specific loadings. For men, Factor 1 (x-axis) is shaped mainly by lodging and access logistics, with minor influence from non-hotel and attractions dimensions. For women, Factor 2 (y-axis) is driven by accommodation quality and access, reinforced by staff professionalism and safety cues. Access and environmental aesthetics sit near the origin for both groups, underscoring their universal importance.
Women report higher satisfaction with cleanliness and attentive service; men value transport convenience and price-to-value ratios. Accordingly, marketing to women should foreground spotless rooms, empathetic staff, and visible safety measures, whereas messages to men should highlight seamless mobility and competitive pricing.
The two-dimensional plot shows how male and female tourists weight destination attributes. Factor 1 (x-axis) is dominated by male evaluations of access and lodging (blue), whereas Factor 2 (y-axis) captures female assessments of lodging and staff professionalism (pink).
Figure 8 plots the 26 attributes for each region of origin and confirms that visitor segments weigh destination features differently. Travelers from North America register the highest composite satisfaction—especially with scenery and infrastructure—indicating that they reward Ecuador’s natural capital when service reliability is evident. By contrast, Latin American visitors give lower marks to organization and safety, revealing a credibility gap in basic services that could be closed through clearer signage, more visible policing, and better queue management. European tourists show moderate satisfaction overall but surprisingly muted interest in digital connectivity, a pattern that may reflect a deliberate “digital detox” while traveling and thus argues for product bundles that offer both high- and low-connectivity options. Guests from Asia and Australia combine strong lodging ratings with more reserved views on attractions, suggesting that marketing should highlight ecological assets beyond the well-publicized Galápagos. Because perceived safety sits near the centroid of the factor map for all regions, destination managers must treat safety communication as a universal priority even as they tailor tactical upgrades to each market.
Figure 9 maps the 26 attributes by tourists’ region of origin. Two latent dimensions stand out: Factor 1 (horizontal) loads mainly on lodging and some access features prioritized by visitors from Australia, Asia, and Europe, whereas Factor 2 (vertical) reflects lodging priorities for Latin- and North American travelers and also highlights staff professionalism together with several access items valued across most regions. Natural scenery and basic accessibility cluster near the center of the plot, indicating broad importance irrespective of origin, while attributes linked to specific attractions appear toward the periphery, confirming that their salience varies by region.
These patterns suggest differentiated managerial emphases. For Latin American tourists, strengthening core infrastructure and making safety measures more visible should close key satisfaction gaps. North American visitors place a premium on environmental quality and consistent service, so maintaining high standards in those areas is essential. European travelers show less interest in digital amenities than expected, implying room for both highly connected and “digital detox” product bundles. Finally, for Asian and Australian markets, sustaining strong lodging performance while packaging lesser-known ecological sites could deepen appeal. Addressing each segment’s priority set in this way is likely to raise overall satisfaction and improve the efficiency of destination management investments.
Factor 1 mainly summarizes accommodation perceptions—plus some access attributes—for visitors from Australia, Asia, and Europe, while Factor 2 is driven by accommodation and staff professionalism for Latin and North American tourists.
Figure 10 brings the segment story together, mapping how the 26 attributes shift across age, gender, and region.
The contrasts are clear: younger and Latin American visitors respond most strongly to upgrades in safety and ground transport, whereas older and North American travelers value further refinements in lodging comfort. Women remain especially sensitive to cleanliness and staff empathy; men place greater weight on access logistics and price–value cues.
These differentiated patterns give managers a concrete hierarchy of actions. First, shore up visible security measures and streamline mobility for youth and regional neighbors. Second, sustain high accommodation standards, especially room comfort and food quality, for senior and long-haul markets. Third, tailor promotion and service tone to match the distinct priorities of each segment rather than relying on a one-size-fits-all message.
The convergence of these findings across multiple sub-group analyses affirms SERVPERF’s measurement invariance in a multi-segment Global South setting and supplies a data-driven blueprint for segment-specific service improvements that can boost satisfaction and competitive standing.

5. Discussion

The measurement model meets accepted reliability (CR = 0.81–0.93; α = 0.78–0.92) and validity thresholds (AVE > 0.50; max HTMT = 0.84), so all inferences rest on a solid statistical base. Treating satisfaction as demographically contingent rather than a single destination-wide score encourages scholars and managers to refine benchmarks for Ecuador and, more broadly, for emerging South American markets.
Using SERVPERF proved advantageous: its performance-only focus captured segment differences more sharply than expectation–performance hybrids such as SERVQUAL can (Leong et al., 2015; Lubis et al., 2021; Chango-Cañaveral et al., 2022). Factor analysis yielded four clear components—Access, Lodging, Extra-hotel Services, and Attractions—that together explain 76% of variance, echoing multi-dimensional service models in Wu et al. (2021) and Costa et al. (2023). Within this structure, age, gender, and region of origin systematically reweigh classic satisfaction drivers such as cleanliness, safety, and infrastructure. Hence, demographic “capital” does not merely color perception; it reshapes the very hierarchy of service attributes that define a successful destination experience.
Previous cross-national evidence shows that Latin American millennials often rank cultural immersion and digital connectivity among their top satisfiers (Travar et al., 2022b; Sánchez-Casado et al., 2023). Yet our Gen-Z subsample in Ecuador deviates from that pattern, assigning both attributes markedly lower salience. After controlling for travel purpose and length of stay (post hoc ANOVA, F = 4.32, p < 0.01), generational contrasts persisted: tourists under 25 reported the lowest satisfaction with transport reliability and perceived safety, whereas the 41-to-60 cohort posted the highest scores for lodging comfort and on-site gastronomy.
A plausible interpretation, consistent with the capital-demographic lens, is that early-career travelers operate under tighter time and budget constraints, which amplifies the impact of logistical frictions and security cues. This reading aligns with cohort research showing that “emerging adults” weigh functional risk more heavily than hedonic payoff when evaluating unfamiliar destinations (Pasaco-González et al., 2023). By contrast, older visitors’ higher satisfaction with accommodation may reflect a life-cycle shift toward comfort-seeking motives and accumulated travel expertise, both of which temper sensitivity to minor service lapses while heightening an appreciation of tangible amenities—a pattern documented in age-moderated service evaluations (Kwok et al., 2016).
We caution, however, that these explanations remain provisional because our dataset does not capture psychological dimensions such as uncertainty avoidance, novelty seeking, or a travel-career stage. Future longitudinal designs that integrate psychographics with cohort tracking would be required to adjudicate among competing mechanisms and to inform youth-centric co-creation initiatives advocated in recent participatory-design studies (León et al., 2025).
Gender effects also echo previous research: women link satisfaction more closely to perceived safety and empathetic service (F. Zhou et al., 2024), whereas men exhibit a more utilitarian, logistics-oriented profile, an affective-versus-cognitive split consistent with dual-path models of tourist evaluation (Tsiotsou, 2005; Oliver, 2010). That divergence highlights the value of blending psychographic cues with basic demographics when crafting segments and reinforces that each factor in the model captures a discrete perception set rather than overlapping sentiments, as the clean HTMT matrix confirms.
Regional contrasts tell a complementary story. North American visitors register the highest scores for scenery and service reliability, mirroring ecotourism findings for travelers from high-income markets (Amoah & Amoah, 2019) and underscoring Ecuador’s natural capital as a competitive lever—provided service delivery remains consistent. Latin American tourists, by contrast, assign lower ratings to access and safety, pinpointing where infrastructure upgrades and risk communication can yield immediate gains. Because geography alone does not equal homogeneous expectations, these differences caution against treating regional markets as interchangeable blocs.
By weaving such demographic nuance into both analysis and recommendations, this study enriches segmented-satisfaction theory and supplies much-needed evidence from South America, where fine-grained segmentation is still rare (Vidal-Meliá et al., 2025). The cross-sectional, air-traveler focus remains a constraint; future longitudinal work that adds psychographic measures could test how durable these patterns are over time.

6. Implications

6.1. Implications for Theory

This study refines tourist satisfaction theory on three intertwined fronts: (1) it demonstrates the conditional validity of SERVPERF in Global South destinations, (2) it formalizes demographic capital as a structuring construct inside performance-based satisfaction models, and (3) it reframes satisfaction as a context-mediated phenomenon rather than a universal cognitive–affective response. Together, these insights redirect debates on destination competitiveness toward more situated and segment-aware explanations.

6.1.1. Conditional Validity of SERVPERF in the Global South

SERVPERF was originally praised for parsimony and predictive power (Cronin & Taylor, 1992). Yet meta-analytic evidence shows its psychometric fit varies markedly across cultures and income levels (Carrillat et al., 2007). Our multi-group CFA confirms—and specifies—that variation: while a four-factor core held for Ecuador, several loadings shifted across age, gender, and region, revealing that SERVPERF’s dimensional measurement invariance is context-contingent. Similar cross-cultural work finds that generic service dimensions resonate differently in collectivist versus individualist societies (Furrer et al., 2000). Recent systematic reviews on emerging markets therefore call for adaptive, locally validated measurement frameworks. Theoretically, these results challenge the tacit assumption of measurement invariance that underpins much satisfaction research. Scholars must treat SERVPERF—and any performance-only index—as a template whose validity must be re-established whenever institutional volatility, infrastructural gaps, or cultural value sets diverge from the original context (Mhlongo et al., 2025; Shyju et al., 2021).

6.1.2. Demographic Capital Inside Performance-Based Models

Tourist studies routinely include sociodemographics as control variables yet treat them as analytically peripheral. We instead conceptualize age, gender, and region of origin as demographic capital, durable, socially recognized resources that shape expectations, risk perceptions, and value orientations. The idea synthesizes travel-career theory (Pearce, 2005) with segmentation findings showing gender- and age-based priority shifts in Latin America (Martín Hernández et al., 2019; Travar et al., 2022a). Empirically, our multi-group model shows that identical performance cues yield different satisfaction outcomes depending on tourists’ capital endowment. Conceptually, demographic capital bridges micro-level psychology and macro-level governance: it explains why investments in visible safety disproportionately lift satisfaction among young Latin American travelers, while eco-luxury upgrades speak more directly to North Americans’ environmental imaginaries. This reframing moves sociodemographics from descriptive tags to structuring forces that reorganize the satisfaction calculus. Future research should trace how demographic capital interacts with cultural and economic capital to shape satisfaction trajectories and loyalty pathways over time.

6.1.3. Satisfaction as a Context-Mediated Construct

Classical consumer theory casts satisfaction as an internal post-consumption judgment (Oliver, 2010). Yet evidence from volatile or resource-scarce settings shows that external factors, such as political stability, safety heuristics, and authenticity cues, co-determine that judgment (Ritchie & Crouch, 2005; Dwyer & Kim, 2003). Our data make this dependency explicit: the same SERVPERF item (“transport reliability”) depresses satisfaction among under-25s—who face tighter budgets and time constraints—far more than among retirees. Context thus mediates not only performance but also tourists’ interpretive frameworks. Achieving competitiveness therefore cannot hinge on importing service blueprints from mature markets; destinations must calibrate experience bundles to how local constraints intersect with visitor capital. For theory, the takeaway is a shift from universalist models toward situated dimensions that embed social and institutional conditions directly into satisfaction formation.

6.1.4. Directions for Future Research

These insights open several paths. Scholars should develop adaptive SERVPERF variants that capture context-specific quality cues—such as visible policing or community engagement—in Global South destinations. Longitudinal studies could track how demographic capital evolves with accumulated travel experience, revealing “tipping points” where expectation structures realign. Qualitative work in high-volatility environments can unpack how tourists negotiate satisfaction amid uncertainty, enriching quantitative models with grounded insight. Comparative work across low-, middle-, and high-income destinations would clarify the boundary conditions under which context mediation becomes the primary driver of competitiveness.
By integrating contingent measurement validity, demographic capital, and context mediation into a single framework, this study offers a more nuanced lens on tourist satisfaction, one that aligns with the heterogeneous, rapidly changing landscape of global tourism.

6.2. Implications for Practice

Our results confirm that SERVPERF is statistically sound in aggregate yet fractures once demographic strata are isolated, echoing J. Velastegui-Hernández et al. (2024) and R. Velastegui-Hernández et al. (2024). In other words, the instrument’s four-factor core is not universally invariant: attribute weights shift with age, gender, and origin. That finding challenges the long-held assumption—implicit in many destination studies—that service-quality models travel intact across contexts. Satisfaction should therefore be treated as contextually contingent, and managers should recalibrate the measurement model each time they target a new segment.
Beyond this conceptual contribution, the segment-level patterns translate into concrete managerial priorities. Younger visitors (under 25) post the lowest scores for transport reliability and safety yet show little interest in guided heritage experiences, so destinations should co-design nightlife, informal social venues, and friction-free digital touchpoints while tightening visible security protocols (León et al., 2025). Female travelers reward cleanliness, empathetic service and perceived safety more than men, making gender-responsive measures—well-lit public areas, female-led tours, and staff trained in safety communication—essential for boosting loyalty (F. Zhou et al., 2024). North American tourists register high satisfaction with scenery and infrastructure and therefore represent strong demand for eco-luxury; positioning the Galápagos, Amazon lodges, and heritage cities as premium yet sustainable products should resonate, whereas Europeans, who are neutral on connectivity, may prefer “digital-detox” packages, so offering both low- and high-connectivity tiers mitigates mismatched expectations. Older cohorts (45+) prize comfort and predictability (Bohórquez et al., 2020), which justifies continued investment in accessible transport, clear signage, and staff versed in intergenerational needs. Across segments, satisfaction is decidedly non-monolithic; aligning product design, messaging, and service protocols with these differential weights can lift both loyalty and advocacy, which are critical advantages in competitive Global South destinations.

7. Conclusions

This study establishes demographic capital—age, gender, and region of origin—as a core explanatory lens for tourist satisfaction in emerging markets. By conceptualizing these sociodemographic markers as resources rather than descriptive controls, we show that destination performance is decoded through visitors’ embodied capital, not universal service prescriptions.
Empirically, multi-group CFA confirms that SERVPERF’s four-dimension core (Access, Lodging, Extra-hotel Services, Attractions) is configurally stable across segments yet exhibits partial metric invariance: several item loadings shift systematically by cohort. The scale is therefore transferable but contingent, valid where demographic capital aligns with item meaning, and elastic where it does not. This finding refines prior cross-cultural work on service-quality models and delivers the first granular invariance test in a South American destination.
Conceptually, demographic capital sharpens satisfaction theory. Gen-Z travelers reward experiential intensity over logistical reliability; older cohorts invert that hierarchy. Women prioritize safety and cleanliness; men emphasize mobility efficiency. North American visitors amplify eco-luxury cues once reliability is evident, whereas Latin American guests remain most critical of basic organization. These patterns demonstrate that capital mediates the performance-satisfaction calculus, reordering attribute salience along social lines.
Managerially, the evidence yields a capital-sensitive action matrix: visible security and seamless transit for youth and regional markets; gender-responsive facilities; premium sustainable bundles for North Americans; and digital-detox tiers for Europeans. Targeting investments in this way converts limited budgets into segment-specific loyalty gains.
Future work should extend the design longitudinally and incorporate psychographic and mobility-capital variables to test the durability of these conditional effects under market shocks.
In sum, this study delivers three contributions: (1) it positions demographic capital as a missing bridge between traveler dispositions and destination contexts; (2) it demonstrates the conditional validity of SERVPERF via partial metric invariance; and (3) it provides a practical blueprint for capital-aligned destination management. By foregrounding capital in satisfaction models, we invite scholars and practitioners alike to rethink “one-size-fits-all” quality upgrades and craft experiences that resonate with the diverse resources that travelers bring to emerging destinations.

Author Contributions

Conceptualization, R.P.-C.; Methodology, R.P.-C., G.G.-V. and M.D.M.-G.; Software, G.G.-V.; Validation, G.G.-V., R.M.-V., M.E.V.-A. and M.D.M.-G.; Formal analysis, R.P.-C. and A.S.-R.; Investigation, R.P.-C., A.S.-R., G.G.-V., R.M.-V., M.E.V.-A. and M.D.M.-G.; Resources, R.M.-V.; Data curation, G.G.-V. and R.M.-V.; Writing—original draft, R.P.-C.; Writing—review & editing, A.S.-R.; Visualization, A.S.-R., M.E.V.-A. and M.D.M.-G.; Supervision, R.M.-V.; Project administration, M.E.V.-A. All authors have read and agreed to the published version of the manuscript.

Funding

This research received no external funding.

Institutional Review Board Statement

This study did not involve any clinical procedures, biomedical experimentation, or the collection of sensitive personal data. Instead, the data were collected through anonymous surveys and interviews voluntarily completed by adult SME owner-managers, addressing only their business perceptions and general demographic characteristics. In Ecuador, according to Acuerdo Ministerial 4883 del Ministerio de Salud Pública (Registro Oficial Suplemento 173, del 12 de diciembre de 2013), ethical review by an Institutional Review Board (IRB) or Comité de Ética de Investigación en Seres Humanos (CEISH) is required only for biomedical or clinical research that may pose physical or psychological risks to participants. Our study, being observational, non-interventional, and of minimal risk, is exempt under this regulation. Nevertheless, we affirm that all procedures complied with the ethical standards of the 2013 revision of the Declaration of Helsinki, including respect for informed consent, privacy, and voluntary participation. Participants were informed of the purpose of this study and their right to withdraw at any point without consequence. No personal or identifiable information was recorded. The above is assumed to be an exemption from the ethical compliance requirement.

Informed Consent Statement

Verbal informed consent was obtained from all participants involved in this study. Prior to participation, respondents were informed about the purpose of this research, the voluntary nature of their participation, and the confidentiality of their responses. This study involved no sensitive personal data and was conducted in full compliance with the ethical principles outlined in the Declaration of Helsinki (2013 revision).

Data Availability Statement

The original contributions presented in this study are included in this article. Further inquiries can be directed to the corresponding author.

Acknowledgments

The authors thank the anonymous reviewers of the journal for their extremely helpful suggestions to improve the quality of this article. The usual disclaimers apply.

Conflicts of Interest

The authors declare no conflicts of interest.

References

  1. Adie, B. A., Taheri, B., & Gannon, M. (2023). Natural heritage tourism: Does co-creation matter? Journal of Ecotourism, 22(1), 144–163. [Google Scholar] [CrossRef]
  2. Ahmad, R. (2014). Habitus, capital and patterns of taste in tourism consumption: A study of Western consumers in India. Journal of Hospitality & Tourism Research, 38(4), 487–505. [Google Scholar] [CrossRef]
  3. Alegre, J., & Garau, J. (2010). Tourist satisfaction and dissatisfaction. Annals of Tourism Research, 37(1), 52–73. [Google Scholar] [CrossRef]
  4. Alfaro-Navarro, J. L., & Andrés-Martínez, M.-E. (2024). Changes in guests’ hotel evaluations due to COVID-19: The case of the world heritage city of Cuenca. Tourism and Hospitality Management, 30(1), 1–13. [Google Scholar] [CrossRef]
  5. Amoah, F., & Amoah, L. N. A. (2019). Tourist experience, satisfaction, and behavioural intentions of rural tourism destinations in the Eastern Cape, South Africa. African Journal of Hospitality, Tourism and Leisure, 8(4), 1–12. [Google Scholar]
  6. Barusman, A. R. P., & Rulian, E. P. (2020). Customer satisfaction and retention and its impact on tourism in hotel industry. Utopia y Praxis Latinoamericana, 25, 117–126. [Google Scholar]
  7. Becker, G. S. (1993). Human capital (3rd ed.). University of Chicago Press. [Google Scholar]
  8. Bichler, B. F., & Pikkemaat, B. (2021). Winter sports tourism to urban destinations: Identifying potential and comparing motivational differences across skier groups. Journal of Outdoor Recreation and Tourism, 36, 100420. [Google Scholar] [CrossRef]
  9. Bohórquez, E., Pérez, M., Peña, H., & Padilla, A. (2020). Strategic direction and customer satisfaction: Case of the tourist transport company liberpesa S.A. In Á. Rocha, A. Abreu, J. de Carvalho, D. Liberato, E. González, & P. Liberato (Eds.), Advances in tourism, technology and smart systems. smart innovation, systems and technologies (Vol. 171, pp. 437–446). Springer. [Google Scholar] [CrossRef]
  10. Borges, A. P., Rodrigues, P., & Matias, Á. (2016). Customer satisfaction and expenditure behaviour in musical festivals: The optimus primavera sound case study. Tourism Economics, 22(4), 825–836. [Google Scholar] [CrossRef]
  11. Bourdieu, P. (1984). Distinction: A social critique of the judgment of taste. Harvard University Press. [Google Scholar]
  12. Bourdieu, P. (1986). The forms of capital. In J. G. Richardson (Ed.), Handbook of theory and research for the sociology of education (pp. 241–258). Greenwood Press. [Google Scholar]
  13. Bravo Macías, M. A., Cruzatty Quijije, J. S., & Hermoza Robles, C. I. (2024). Impacto de la inseguridad en el sector turístico de Ecuador. Ciencia Latina Revista Científica Multidisciplinar, 8(4), 8638–8662. [Google Scholar] [CrossRef]
  14. Campo, S., & Garau, J. B. (2008). The influence of nationality on the generation of tourist satisfaction. Tourism Analysis, 13(1), 81–92. [Google Scholar] [CrossRef]
  15. Cankül, D., Kaya, S., & Kızıltaş, M. Ç. (2024). The effect of gastronomic experience on restaurant image, customer perceived value, customer satisfaction and customer loyalty. International Journal of Gastronomy and Food Science, 36, 100908. [Google Scholar] [CrossRef]
  16. Carrillat, F. A., Jaramillo, F., & Mulki, J. P. (2007). The validity of the SERVQUAL and SERVPERF scales: A meta-analytic view of 17 years of research across five continents. International Journal of Service Industry Management, 18(5), 472–490. [Google Scholar] [CrossRef]
  17. Carvache-Franco, O., Carvache-Franco, W., & Cevallos-Sierra, C. (2023). Segmentation by motivation and tourist satisfaction in emerging urban destinations: Evidence from Latin America. PLoS ONE, 18(2), e0281234. [Google Scholar] [CrossRef]
  18. Cassandra, C., Gunawan, A., Teguh, W., Adi, S., & Gui, A. (2021). The influence of information quality, system quality, service quality on customer satisfaction for hotel online reservation. Journal of Theoretical and Applied Information Technology, 99(24), 6091–6101. [Google Scholar]
  19. Castillo Canalejo, A. M., & Jimber del Río, J. A. (2018). Quality, satisfaction and loyalty indices. Journal of Place Management and Development, 11(4), 428–446. [Google Scholar] [CrossRef]
  20. Chango-Cañaveral, P. M., Jaya-Jaramillo, D. E., Quezada-Sarmiento, P. A., & Salas-Álvarez, W. T. (2022, June 22–25). Analysis of the quality service of the hotel villa colonial through the servqual method and cloud computing tools. 17th Iberian Conference on Information Systems and Technologies (CISTI) (pp. 1–7), Madrid, Spain. [Google Scholar] [CrossRef]
  21. Chen, J.-S. (2017). A novel method for minimizing the average waiting time of visitors during an airport pickup service. Journal of Industrial and Production Engineering, 34(4), 274–282. [Google Scholar] [CrossRef]
  22. Chen, R. J. C., Kung, S.-F., & Phou, S. (2020). Expectation formation under uncertainty: Evidence from emerging tourism markets. Journal of Travel Research, 59(7), 1291–1308. [Google Scholar] [CrossRef]
  23. Cheung, G. W., & Rensvold, R. B. (2002). Evaluating goodness-of-fit indexes for testing measurement invariance. Structural Equation Modeling: A Multidisciplinary Journal, 9(2), 233–255. [Google Scholar] [CrossRef]
  24. Chiny, M., Bencharef, O., & Chihab, Y. (2021, May 19–20). Towards a machine learning and datamining approach to identify customer satisfaction factors on Airbnb. 2021 International Conference on Optimization and Applications, ICOA 2021, Wolfenbuttel, Germany. [Google Scholar] [CrossRef]
  25. Chung, H., & Choi, H. Y. (2019). Influence of physical environment and medical service quality on customer satisfaction in medical travel to Korea. Asia Life Sciences, 1, 465–476. [Google Scholar]
  26. Ciavolino, E., Lagetto, G., Montinari, A., Al-Nasser, A. D., Al-Omari, A. I., Zaterini, M. J., & Salvatore, S. (2020). Customer satisfaction and service domains: A further development of PROSERV. Quality and Quantity, 54(5–6), 1429–1444. [Google Scholar] [CrossRef]
  27. Cochran, W. G. (1977). Sampling techniques (3rd ed.). John Wiley & Sons. [Google Scholar]
  28. Costa, G., Pereira, E., Martins, R., & Mascarenhas, M. (2023). The importance of perceived quality for golf course member satisfaction and loyalty in tourism deprivation times. Journal of Global Sport Management. [Google Scholar] [CrossRef]
  29. Cronin, J. J., & Taylor, S. A. (1992). Measuring service quality: A reexamination and extension. Journal of Marketing, 56(3), 55–68. [Google Scholar] [CrossRef]
  30. Daniel, W. W. (1999). Biostatistics: A foundation for analysis in the health sciences (7th ed.). John Wiley & Sons. [Google Scholar]
  31. Demydyuk, G. V., & Carlbäck, M. (2024). Balancing short-term gains and long-term success in lodging: The role of customer satisfaction and price in hotel profitability model. Tourism Economics, 30(4), 844–875. [Google Scholar] [CrossRef]
  32. Dmitrović, T., Knežević Cvelbar, L., Kolar, T., Makovec Brenčič, M., Ograjenšek, I., & Žabkar, V. (2009). Conceptualizing tourist satisfaction at the destination level. International Journal of Culture, Tourism and Hospitality Research, 3(2), 116–126. [Google Scholar] [CrossRef]
  33. Dolnicar, S. (2008). Market segmentation in tourism. In A. Woodside, & D. Martin (Eds.), Tourism management: Analysis, behaviour and strategy (pp. 129–150). CABI. [Google Scholar]
  34. Dwyer, L., & Kim, C. (2003). Destination competitiveness: Determinants and indicators. Current Issues in Tourism, 6(5), 369–414. [Google Scholar] [CrossRef]
  35. Ersen, M., Keskin, A., & Atalan, A. (2023). A study on the analysis of customer satisfaction in hotel businesses in Istanbul with the kano model. In G. Catenazzo (Ed.), Cases on traveler preferences, attitudes, and behaviors: Impact in the hospitality industry (pp. 256–270). IGI Global. [Google Scholar] [CrossRef]
  36. Frías-Jamilena, D. M., Sabiote-Ortiz, C. M., Martín-Santana, J. D., & Beerli-Palacio, A. (2018). The effect of Cultural Intelligence on consumer-based destination brand equity. Annals of Tourism Research, 72, 22–36. [Google Scholar] [CrossRef]
  37. Furrer, O., Liu, B. S. C., & Sudharshan, D. (2000). The relationships between culture and service quality perceptions: Basis for cross-cultural market segmentation and resource allocation. Journal of Service Research, 2(4), 355–371. [Google Scholar] [CrossRef]
  38. García Reinoso, N. (2021). Segmentación por motivaciones y valoración del turismo interior en el destino Manta, Manabí, Ecuador. Innovar, 31(80), 57–72. [Google Scholar] [CrossRef]
  39. García Sedeño, M. A., & García Tejera, M. C. (2013). Estimation of content validity in a scale for assessing the degree of gender violence endured by adolescents. Acción Psicológica, 10(2), 41–58. [Google Scholar] [CrossRef]
  40. Garner, B., & Kim, D. (2022). Analyzing user-generated content to improve customer satisfaction at local wine tourism destinations: An analysis of Yelp and TripAdvisor reviews. Consumer Behavior in Tourism and Hospitality, 17(4), 413–435. [Google Scholar] [CrossRef]
  41. George, B. P., Salgaonkar, P., & Hegde, P. G. (2007). SERICSAT: The development of a preliminary instrument to measure service recovery satisfaction in tourism. International Journal of Hospitality and Tourism Administration, 8(1), 21–42. [Google Scholar] [CrossRef]
  42. Ghonim, M. A., Zakaria Elsawy, W., Elsotouhy, M. M., & Khashan, M. A. (2024). The Impact of marketing 4.0 on customer satisfaction and engagement: The distinctive role of brand interaction in the egyptian hotel industry. International Journal of Hospitality and Tourism Administration, 25(3), 475–504. [Google Scholar] [CrossRef]
  43. González-Rodríguez, J. C., & Acevedo-Navas, C. (2021). Risk diagnosis of the Latin American tourism sector from 2020 to 2022. Revista Científica General José María Córdova, 19(34), 333–355. [Google Scholar] [CrossRef]
  44. González-Rodríguez, M. R., Díaz-Fernández, M. C., & Pacheco Gómez, C. (2020). Facial-expression recognition: An emergent approach to the measurement of tourist satisfaction through emotions. Telematics and Informatics, 51, 101404. [Google Scholar] [CrossRef]
  45. Grechyn, V., & McShane, I. (2021). “Seriously, Australia, why are you so stingy with Wi-Fi?”: Customer satisfaction with Wi-Fi speed in Australian hotels and lessons for public Wi-Fi provision. Journal of Hospitality and Tourism Technology, 12(4), 730–744. [Google Scholar] [CrossRef]
  46. Grönroos, C. (1997). From marketing mix to relationship marketing: Towards a paradigm shift in marketing. Management Decision, 35(4), 322–339. [Google Scholar] [CrossRef]
  47. Haas, R. (2002). The australian country market: A European case study on marketing regional products and services in a cyber mall. Journal of Business Research, 55(8), 637–646. [Google Scholar] [CrossRef]
  48. Hair, J. F., Hult, G. T. M., Ringle, C. M., & Sarstedt, M. (2022). A primer on Partial Least Squares Structural Equation Modeling (PLS-SEM) (3rd ed.). SAGE Publications. [Google Scholar]
  49. Haywood, K. M., & Muller, T. E. (1988). The urban tourist experience: Evaluating satisfaction. Journal of Hospitality & Tourism Research, 12(2), 453–459. [Google Scholar] [CrossRef]
  50. Ho, L.-H., Chung, C.-W., Lin, S.-P., & Lin, L.-F. C. (2010). Visitors’ involvement, perceived value, satisfaction and behavioural intention on tourist express trains in Taiwan. International Journal of Services, Technology and Management, 13(3–4), 305–322. [Google Scholar] [CrossRef]
  51. Hu, L. T., & Bentler, P. M. (1999). Cutoff criteria for fit indexes in covariance structure analysis: Conventional criteria versus new alternatives. Structural Equation Modeling: A Multidisciplinary Journal, 6(1), 1–55. [Google Scholar] [CrossRef]
  52. Huang, Y.-C. (2023). Low-cost airlines not so low-cost—Exploring the relationships among travel motivation, service quality and satisfaction: The moderating roles of perceived value. Research in Transportation Business and Management, 49, 101008. [Google Scholar] [CrossRef]
  53. International Finance Corporation—World Bank. (2022). Creating markets in Ecuador: A country private sector diagnostic. World Bank Group. Available online: https://www.ifc.org/en/insights-reports/2021/cpsd-ecuador (accessed on 3 March 2025).
  54. International Organization for Standardization—ISO. (2019). Market, opinion and social research, including insights and data analytics—Vocabulary and service requirements (UNE-ISO 20252:2019). ISO.
  55. Jin, N. P., Lee, S., & Lee, H. (2015). The effect of experience quality on perceived value, satisfaction, image and behavioral intention of water park patrons: New versus repeat visitors. International Journal of Tourism Research, 17(1), 82–95. [Google Scholar] [CrossRef]
  56. Kamyabi, M., Alipour, H., & Rezapouraghdam, H. (2023). Assessing the mediating role of destination image on the perceived value and satisfaction of people with disabilities. In M. Rodrigues, & M. Carvalho (Eds.), Exploring niche tourism business models, marketing, and consumer experience (pp. 32–53). IGI Global. [Google Scholar] [CrossRef]
  57. Khassawneh, O., Mohammad, T., Bouchon, F., & Behery, M. (2024). Eco-innovation and customer satisfaction in the hospitality industry in Dubai: The role of green leadership. Journal of Human Resources in Hospitality and Tourism, 23(3), 413–438. [Google Scholar] [CrossRef]
  58. Kim, J.-Y., & Canina, L. (2015). An analysis of smart tourism system satisfaction scores: The role of priced versus average quality. Computers in Human Behavior, 50, 610–617. [Google Scholar] [CrossRef]
  59. Kocabulut, Ö., & Albayrak, T. (2019). The effects of mood and personality type on service quality perception and customer satisfaction. International Journal of Culture, Tourism, and Hospitality Research, 13(1), 98–112. [Google Scholar] [CrossRef]
  60. Kreusser, O. T. (1928). Automobile bodies, from the abstract customer’s viewpoint (Vol. 23). SAE Technical Papers. SAE International. [Google Scholar] [CrossRef]
  61. Kusumawardani, A. M., & Aruan, D. T. H. (2019). Comparing the effects of service quality and value-for-money on customer satisfaction, airline image and behavioural intention between full-service and low-cost airlines: Evidence from Indonesia. International Journal of Tourism Policy, 9(1), 27–49. [Google Scholar] [CrossRef]
  62. Kwok, S.-Y., Jusoh, A., & Khalifah, Z. (2016). The influence of service quality on satisfaction: Does gender really matter? Intangible Capital, 12(2), 444–461. [Google Scholar] [CrossRef]
  63. Lanke, P., & Varsha Paul, E. (2022). Is there anything new? Exploring the conceptual structure of customer satisfaction research in tourism and hospitality. Tourism, 70(4), 730–739. [Google Scholar] [CrossRef]
  64. Leong, L.-Y., Hew, T.-S., Lee, V.-H., & Ooi, K.-B. (2015). An SEM-artificial-neural-network analysis of the relationships between SERVPERF, customer satisfaction and loyalty among low-cost and full-service airline. Expert Systems with Applications, 42(19), 6620–6634. [Google Scholar] [CrossRef]
  65. León, C. J., González, M., & de León, J. (2025). Satisfaction and sustainability concerns in whale-watching tourism: A user-generated content model. Tourism Management, 98, 104654. [Google Scholar] [CrossRef]
  66. Liberato, D., Liberato, P., & Silva, M. (2020). Shopping tourism: Comparative analysis of the cities of oporto and lisbon as shopping destinations. In V. Katsoni, & T. Spyriadis (Eds.), Cultural and tourism innovation in the digital era (pp. 365–379). Springer Proceedings in Business and Economics. Springer. [Google Scholar] [CrossRef]
  67. Lubis, M., Lubis, A. R., Pratiwi, S. H., & Yuherisna, D. P. (2021, February 18–20). Customer satisfaction assessment coffee roaster restaurant using SERVQUAL: Utilization of customer relationship management (CRM) application. DSDE ‘21: Proceedings of the 2021 4th International Conference on Data Storage and Data Engineering (pp. 85–92), Barcelona, Spain. [Google Scholar] [CrossRef]
  68. Marković, S., & Šebrek, J. K. (2020). Service quality measurement in rural tourism: Application of RURALQUAL model. Academica Turistica, 13(2), 215–227. [Google Scholar] [CrossRef]
  69. Martín, J. C., & Bustamante, J. (2019). Service quality perceptions among domestic and foreign tourists: Evidence from Ecuador’s coastal destinations. International Journal of Housing Markets and Analysis, 12(3), 387–403. [Google Scholar] [CrossRef]
  70. Martín Hernández, J., Pérez-Gálvez, J. C., & Díaz Molina, M. (2019). Tourist loyalty and satisfaction in coastal destinations: The role of demographic factors. Journal of Hospitality and Tourism Management, 38, 16–25. [Google Scholar] [CrossRef]
  71. Mestanza-Ramón, C., Chica-Ruiz, J. A., Anfuso, G., Mooser, A., & Botero, C. M. (2020). Tourism in continental ecuador and the galapagos Islands: An Integrated Coastal Zone Management (ICZM) perspective. Water, 12(6), 1647. [Google Scholar] [CrossRef]
  72. Mhlongo, Z., Ntshangase, S. D., & Ezeuduji, I. O. (2025). Youths’ entrepreneurial intention for tourism and nontourism businesses: The influence of entrepreneurship education and gender. Journal of the International Council for Small Business, 1–22. [Google Scholar] [CrossRef]
  73. Moon, H., Yoon, H. J., & Han, H. (2016). Role of airport physical environments in the satisfaction generation process: Mediating the impact of traveller emotion. Asia Pacific Journal of Tourism Research, 21(2), 193–211. [Google Scholar] [CrossRef]
  74. Nabi, M. N. U., Khan, S. M., Misbauddin, S. M., & Fatema, K. (2023). Why is India a popular destination for Bangladeshi medical tourists? A study based on perceived justice by Bangladeshi patients. International Journal of Pharmaceutical and Healthcare Marketing, 17(3), 265–287. [Google Scholar] [CrossRef]
  75. Nagy, G., & Carr, N. (2018). Comfort and the tourism accommodation sector: A central, yet under-studied issue. International Journal of Hospitality Management, 74, 224–226. [Google Scholar] [CrossRef]
  76. National Institute of Statistics and Censuses of Ecuador—INEC. (2023). Boletín técnico de estadísticas de turismo receptivo 2022–2023. Available online: https://www.ecuadorencifras.gob.ec (accessed on 10 March 2025).
  77. Ogunjinml, A. A., & Binuyo, L. Y. (2018). Relationship between destination service quality and tourists’ satisfaction in ikogosi warm spring resort, Nigeria. Tourism, 66(4), 362–378. [Google Scholar]
  78. Oh, H., & Kim, K. (2017). Customer satisfaction, service quality, and customer value: Years 2000–2015. International Journal of Contemporary Hospitality Management, 29(1), 2–29. [Google Scholar] [CrossRef]
  79. Oliver, R. L. (2010). Satisfaction: A behavioral perspective on the consumer (2nd ed.). Routledge. [Google Scholar]
  80. Otnes, C., & McGrath, M. A. (2019). Consumer acculturation and cross-cultural marketing. Routledge. [Google Scholar]
  81. Özkul, E., Bilgili, B., & Koç, E. (2020). The Influence of the color of light on the customers’ perception of service quality and satisfaction in the restaurant. Color Research and Application, 45(6), 1217–1240. [Google Scholar] [CrossRef]
  82. Pai, A., Hassan, S., Shetty, D. K., Shenoy, S. S., Shreepathy Ranga Bhatta, B., Panwar, N., & Shetty, A. (2024). An exploratory analysis of gastronomy tourism: The impact of dining attributes on satisfaction among young adult Indian travelers. Environment and Social Psychology, 9(4), 2226. [Google Scholar] [CrossRef]
  83. Pantiyasa, I. W., Sutiarso, M. A., & Suprapto, I. N. A. (2023). Evaluation of Agriculture-based tourism products in tinggan traditional village. Jurnal Ilmiah Ilmu Terapan Universitas Jambi, 7(1), 5–10. [Google Scholar] [CrossRef]
  84. Parasuraman, A., Zeithaml, V. A., & Berry, L. L. (1994). Reassessment of expectations as a comparison standard in measuring service quality: Implications for further research. Journal of Marketing, 58(1), 111–124. [Google Scholar] [CrossRef]
  85. Pasaco-González, B. S., Campón-Cerro, A. M., Moreno-Lobato, A., & Sánchez-Vargas, E. (2023). The role of demographics and previous experience in tourists’ experiential perceptions. Sustainability, 15(4), 3768. [Google Scholar] [CrossRef]
  86. Pearce, P. L. (2005). Tourist behaviour: Themes and conceptual schemes. Channel View. [Google Scholar]
  87. Petcu, M. A., Sobolevschi-David, M. I., & Curea, S. C. (2021). Configuration of an integrated quality-social responsibility-performance management system in the hospitality industry. Case studies: Balneary tourism romania. Sustainability, 13(13), 7303. [Google Scholar] [CrossRef]
  88. Pérez-Campdesuñer, R., García-Vidal, G., Sánchez-Rodríguez, A., & Martínez-Vivar, R. (2017). Structural equation model: Influence on tourist satisfaction with destination atributes. Tourism and Hospitality Management, 23(2), 219–233. [Google Scholar] [CrossRef]
  89. Pérez-Campdesuñer, R., Sánchez-Rodríguez, A., García-Vidal, G., & Martínez-Vivar, R. (2018). Neural networks to analyse the incidence of customer satisfaction in their loyalty in a tourist destination. International Journal of Services, Economics and Management, 9(2), 95–110. [Google Scholar] [CrossRef]
  90. Pine, B. J., & Gilmore, J. H. (1999). The experience economy: Work is theatre & every business a stage. Harvard Business Press. [Google Scholar]
  91. Ritchie, J. R. B., & Crouch, G. I. (2005). The competitive destination: A sustainable tourism perspective. CABI Publishing. [Google Scholar]
  92. Sánchez-Casado, N., Navarro-Azorín, J. M., Jiménez-Medina, M. P., & Cubillas-Para, C. (2023). Use of customers’ satisfaction survey to segment the tourism market. In Teaching cases in tourism, hospitality and events (pp. 231–239). CAB International. [Google Scholar] [CrossRef]
  93. Sánchez-Rebull, M.-V., Rudchenko, V., & Martín, J.-C. (2018). The antecedents and consequences of customer satisfaction in tourism: A systematic literature review. Tourism and Hospitality Management, 24(1), 151–183. [Google Scholar] [CrossRef]
  94. Shafiq, A., Mostafiz, M. I., & Taniguchi, M. (2019). Using SERVQUAL to determine Generation Y’s satisfaction towards hoteling industry in Malaysia. Journal of Tourism Futures, 5(1), 62–74. [Google Scholar] [CrossRef]
  95. Sharma, P., Chen, I. S. N., & Luk, S. T. K. (2012). Gender and age as moderators in the service evaluation process. Journal of Services Marketing, 26(2), 102–114. [Google Scholar] [CrossRef]
  96. Shyju, P. J., Singh, K., Kokkranikal, J., Bharadwaj, R., Rai, S., & Antony, J. (2021). Service quality and customer satisfaction in hospitality, leisure, sportand tourism: An assessment of research in Web of Science. Journal of Quality Assurance in Hospitality & Tourism, 24(1), 24–50. [Google Scholar] [CrossRef]
  97. Suryani, D., Rustiawan, A., & Jannah, A. A. (2023). Factors associated with Food Safety Practices (FSP) among visitors in the Depok Beach Area in Yogyakarta, Indonesia. Public Health of Indonesia, 9(3), 105–112. [Google Scholar] [CrossRef]
  98. Toni, M., Jithina, K. K., & Thomas, K. V. (2023). Antecedents of patient satisfaction in the medical tourism sector: A review. Journal of Hospitality and Tourism Insights, 7(4), 2273–2286. [Google Scholar] [CrossRef]
  99. Travar, M., Milojica, V., & Stankov, U. (2022a). Are image and quality of tourist services strategic determinants of satisfaction? Millennials’ perspective in emerging destinations. Sustainability, 14(13), 7989. [Google Scholar] [CrossRef]
  100. Travar, M., Zekanović-Korona, L., & Perić, M. (2022b). Exploring millennial travellers’ satisfaction with destination attributes in an emerging European city. Administrative Sciences, 12(4), 165. [Google Scholar] [CrossRef]
  101. Tsiotsou, R. (2005). Perceived quality levels and their relation to involvement, satisfaction, and purchase intentions. Marketing Bulletin, 16. Available online: http://marketing-bulletin.massey.ac.nz/V16/MB_V16_N4_Tsiotsou.pdf (accessed on 25 April 2025).
  102. van Zyl, C. C., & van der Merwe, P. (2022). Critical success factors for developing and managing agri-tourism: A South African approach. In C. Silva, M. Oliveira, & S. Silva (Eds.), Proceeding of the international conference of tourism research (Vol. 15, pp. 536–545). Academic Conferences and Publishing International Limited. [Google Scholar]
  103. Velastegui-Hernández, J., Bravo, M., & Rodríguez, M. (2024). Assessing service quality in adventure tourism: An application of SERVQUAL in Ecuadorian destinations. Sustainability, 16(1), 321. [Google Scholar] [CrossRef]
  104. Velastegui-Hernández, R., Melo-Fiallos, D., Mayorga-Ases, M., Hernández-Del-Salto, S., Manobanda-Tenelema, E., & Garcia, M. V. (2024). Perceived quality of service in tourist transportation in the city of Baños de Agua Santa, Ecuador. Sustainability, 16(17), 7245. [Google Scholar] [CrossRef]
  105. Veloso, C. M., Walter, C. E., Sousa, B., Au-Yong-Oliveira, M., Santos, V., & Valeri, M. (2021). Academic tourism and transport services: Student perceptions from a social responsibility perspective. Sustainability, 13(16), 8794. [Google Scholar] [CrossRef]
  106. Vena-Oya, J., Castaneda-García, J. A., Rodríguez-Molina, M. A., & Frías-Jamilena, D. M. (2021). How do monetary and time spend explain cultural tourist satisfaction? Tourism Management Perspectives, 37, 100788. Available online: https://hdl.handle.net/10953/3512 (accessed on 25 April 2025). [CrossRef]
  107. Vidal-Meliá, L., Moliner, M. Á., Monferrer, D., Estrada, M., & Quille, K. (2025). Segmenting tourists based on perceived sustainability and satisfaction using machine learning. Journal of Marketing Analytics. Epub ahead of print. [Google Scholar] [CrossRef]
  108. Wong, A., & Musa, G. (2020). Mobility capital and ageing tourists: Insights from long-stay winter visitors in Malaysia. Tourism Management, 81, 104130. [Google Scholar] [CrossRef]
  109. Wu, Y., Zhu, Y., & Mattingly, H. (2021). Construction and Demonstration of the measurement model of tourist satisfaction in huadu airport. In S. Patnaik (Ed.), Proceeding—Smart city challenges outcomes urban transformation, SCOUT (pp. 62–66). Institute of Electrical and Electronics Engineers Inc. [Google Scholar] [CrossRef]
  110. Xanthopoulou, P., & Plimakis, S. (2023). The adoption of corporate social responsibility (CSR) policy in the tourism sector: How CSR affects consumer loyalty in the Greek hotel industry. In A. Masouras, C. Papademetriou, D. Belias, & S. Anastasiadou (Eds.), Sustainable growth strategies for entrepreneurial venture tourism and regional development (pp. 1–19). IGI Global Scientific Publishing. [Google Scholar] [CrossRef]
  111. Yang, E. C. L., Yang, M. J., & Khoo-Lattimore, C. (2019). The meanings of solo travel for Asian women. Tourism Review, 74(5), 1047–1057. [Google Scholar] [CrossRef]
  112. Yang, T., Wu, J., & Zhang, J. (2024). Knowing how satisfied/dissatisfied is far from enough: A comprehensive customer satisfaction analysis framework based on hybrid text mining techniques. International Journal of Contemporary Hospitality Management, 36(3), 873–892. [Google Scholar] [CrossRef]
  113. Yusof, Y., Awang, Z., Jusoff, K., & Ibrahim, Y. (2017). The influence of green practices by non-green hotels on customer satisfaction and loyalty in hotel and tourism industry. International Journal of Green Economics, 11(1), 1–14. [Google Scholar] [CrossRef]
  114. Zhou, F., Huang, S., & Matthews, M. (2024). Understanding solo female travellers in Canada: A two-factor analysis of hotel satisfaction and dissatisfaction using tripadvisor reviews. Tourism and Hospitality, 5(1), 167–186. [Google Scholar] [CrossRef]
  115. Zhou, K., & Yao, Z. (2023). Analysis of customer satisfaction in tourism services based on the kano model. Systems, 11(7), 345. [Google Scholar] [CrossRef]
Figure 1. (a) Annual volume of peer-reviewed articles on tourist satisfaction, 1988–2023. Note: Scopus Core Collection (search query = TITLE-ABS-KEY(“touristsatisf”), retrieved 4 January 2024). Records (n = 2846) are exported as CSV, duplicates removed, and yearly counts computed in R 4.2.3 (tidyverse package). (b) Keyword co-occurrence network of the tourist-satisfaction literature. Note: Same Scopus dataset; author keywords processed in VOSviewer 1.6.20 (minimum occurrence = 10; LinLog layout). (c) Geographic distribution of those publications by first-author affiliation. Note: Same Scopus dataset; country field geocoded and mapped with QGIS 3.34.
Admsci 15 00272 g001
Figure 2. Conceptual framework linking demographic moderators, attribute evaluations, and overall satisfaction. Note: Adapted from Expectation–Confirmation Theory (Oliver, 2010) and destination-competitiveness models (Dwyer & Kim, 2003).
Admsci 15 00272 g002
Figure 3. Flowchart of research design and methodological procedures.
Admsci 15 00272 g003
Figure 4. Components of rotated spaces by age groups.
Admsci 15 00272 g004
Figure 5. General representation of the distribution of attributes by age group. Note: Each dot represents one of the 26 destination attributes; its color shows the age segment to which the attribute loads most strongly: Blue = under 25; Green = 25–40; Grey = 41–60; and Red = over 60.
Admsci 15 00272 g005
Figure 6. Components of rotated spaces by gender.
Admsci 15 00272 g006
Figure 7. General representation of the distribution of attributes by gender. Note: Attributes plotted in gray sit near the origin or on the diagonal, signaling consensus between genders. Point size reflects each attribute’s relative importance within its dominant segment.
Admsci 15 00272 g007
Figure 8. Components of rotated spaces by region. Note: This graph depicts factor loadings for tourists from the following: Green = Australia/Asia; Blue = Europe; Orange = Latin America; and Red = North America. Natural environment and Access (gray) sit near the center, indicating similar importance across regions. Semi-transparent ellipses outline each region’s point cloud to highlight internal dispersion.
Admsci 15 00272 g008
Figure 9. General representation of the distribution of attributes by region of origin.
Admsci 15 00272 g009
Figure 10. Variation in attributes depending on demographic variables.
Admsci 15 00272 g010
Table 1. Sample composition.
VariableVariable LevelsAmount%
GenderMan18746
Women22054
AgeUnder 258821.6
25 to 409924.3
41 to 6010325.3
More than 6011728.8
RegionAustralia112.70
Asia215.16
Europe7819.16
Latin America16540.54
North America13232.43
Table 2. Factor analysis and measurement of satisfaction and quality of the attributes.
Axis IAxis IIAxis IIIAxis IV
Eigenvalues14.5%8.75%2.92%2.53%
Contribution to total variance25.80%22.02%21.93%13.17%
Cumulative percentage of explained variance25.80%47.82%69.73%82.91%
DimensionsLodgingExtra-hotel activityAccessAttractions
Front desk service0.9120.2310.056−0.013
Animation0.8990.2550.0580.003
Variety of food and drinks0.8930.2660.073−0.037
Accommodation comfort0.8920.2380.0860.085
General cleaning0.8900.2780.0760.039
Quality of food and drinks0.8820.2890.0770.023
Hotel staff professionalism0.8760.2460.0720.015
Transport staff professionalism0.2060.8020.152−0.001
Technical status of transport0.2720.7990.166−0.041
Excursions0.2340.7560.150−0.062
General information0.1880.7430.093−0.078
Gastronomy0.1510.7370.098−0.104
Recreation0.2850.7280.060−0.094
Shopping0.2600.7090.038−0.042
Transport comfort0.2680.6670.175−0.164
Airline staff professionalism0.042−0.0270.8100.154
Air safety0.0540.0740.7670.171
Customs and immigration−0.007−0.0040.7350.258
Airport staff professionalism 0.1140.2110.7120.230
Attention time0.0560.1310.7080.242
Airport comfort0.1190.1950.6760.171
Baggage handling0.0700.2000.6760.144
Service on board0.0290.1840.6730.331
Airline punctuality0.0770.2100.7790.272
Airline comfort0.1210.2280.7570.289
Social life0.166−0.1580.1810.428
Security−0.084−0.0570.0780.421
Reason for travel0.021−0.1670.2200.411
Access to facilities−0.137−0.0940.0760.385
Aesthetics and environment0.019−0.0930.1890.343
Note: Modified from Pérez-Campdesuñer et al. (2018). Cronbach’s alpha: 0.9183; KMO: 0.928; and Bartlett’s sphericity: 47.811.972 ***. Methods: Extraction: principal component analysis. Rotation: varimax with Kaiser standardization.
Table 3. Measurement-model diagnostics (full sample, n = 407).
FactorCRAVECronbach’s αHighest HTMT
Access Services0.900.560.890.78
Lodging Quality0.930.660.920.80
Extra-Hotel Services0.880.530.880.74
Attractions and Environment0.950.770.940.71
Note: CR ≥ 0.70, AVE ≥ 0.50, α ≥ 0.70, and HTMT < 0.85 indicate adequate reliability and validity (Hair et al., 2022).
Table 4. Multi-group invariance tests (MLR estimation).
ModeratorModelχ2 (df)CFIRMSEAΔCFI
Age (4 groups)Configural421.8 (216)0.9570.046-
Metric447.2 (236)0.9550.0450.002
Scalar468.5 (256)0.9520.0440.003
Gender (2 groups)Configural278.6 (216)0.9620.038-
Metric290.7 (228)0.9610.0370.001
Scalar306.4 (240)0.9600.0370.001
Region (5 groups)Configural633.9 (540)0.9490.042-
Metric664.3 (564)0.9480.0410.001
Scalar699.7 (588)0.9470.0410.001
Note: ΔCFI ≤ 0.01 (Cheung & Rensvold, 2002) supports invariance at each level.
Table 5. Behavior of the validity coefficients of the factor analysis.
VariablesOptionsKMOBartlett Sphericity SignificanceNumber of FactorsExplained Variance
GeneralGeneral0.9290.000476.353
GenderMale0.8800.000554.161
Female0.8790.000552.473
AgeLess than 250.7730.000571.140
25 to 400.8120.000571.500
41 to 600.8800.000573.230
More than 600.8290.000571.140
RegionAustralia--659.651
Asia--649.565
Europe0.8130.000578.013
Latin America0.8860.000577.283
North America0.8280.000570.884
Table 6. Determinants and variations in tourist satisfaction by age and gender.
SatisfactionStatisticiansAgeGenderRegion of Origin
<2525–4041–60>60MFAuAsEuLANA
AccessMin4.334.464.254.454.334.454.334.644.484.454.45
Mean5.986.146.236.086.066.155.716.156.136.166.06
Max7.867.998.138.107.998.137.167.857.998.138.10
Extra-hotel ServicesMin7.737.697.657.654.995.005.215.004.994.005.00
Mean7.737.697.657.656.496.436.576.656.546.426.41
Max7.737.697.657.658.008.007.007.908.008.008.00
LodgingMin4.114.274.254.804.114.504.114.364.114.504.80
Mean6.576.496.856.966.526.916.646.696.566.666.94
Max8.108.278.508.618.278.617.547.788.118.508.61
Attractions Min7.247.333.437.527.247.437.627.337.247.437.43
Mean8.168.358.338.518.268.428.098.118.278.328.49
Max9.059.129.299.489.129.488.748.909.059.299.48
GeneralMin5.004.994.005.007.657.697.737.737.697.657.65
Mean6.566.436.456.417.657.717.737.737.727.677.65
Max8.008.008.007.987.657.737.737.737.737.697.65
Note: M: male; F: female; Au: Australia; As: Asia; Eu: Europe; LA: Latin America; and NA: North America.
Table 7. Degree of significance of the chi square test on the differences in means.
DimensionsAttributesGenderAgeRegion
AccessAirline staff professionalism0.0000.0000.000
Security0.7650.2610.551
Emigration and customs0.0000.0000.000
Airport staff professionalism0.0000.0000.000
Attention time0.5210.7690.453
Airport comfort0.0000.0000.000
Baggage handling0.0000.0000.000
Onboard services0.0000.0000.000
Punctuality0.0000.0000.000
Airline comfort0.0000.0000.000
Extra-hotel servicesTransport staff professionalism0.0000.0000.000
Technical condition of transport0.0000.0000.000
Excursions0.0000.0000.000
Gastronomy0.0000.0000.000
Recreation0.2680.5160.651
Shopping0.0000.0000.000
LodgingVariety of food and drinks0.0000.0000.000
Hotel comfort0.0000.0000.000
Cleaning0.0000.0000.000
Quality of food and drinks0.0000.0000.000
Hotel staff professionalism0.0000.0000.000
AttractionsSocial life0.0000.0000.000
Security0.4530.7420.818
Accessibility0.8180.6570.784
Environment aesthetics0.0000.0000.000
Value for money0.0000.0000.000
Disclaimer/Publisher’s Note: The statements, opinions and data contained in all publications are solely those of the individual author(s) and contributor(s) and not of MDPI and/or the editor(s). MDPI and/or the editor(s) disclaim responsibility for any injury to people or property resulting from any ideas, methods, instructions or products referred to in the content.

