Abstract
This article examines to what degree organizations use strategies that focus on maximizing shareholder value (Theory E) as opposed to strategies emphasizing the development of organizational capability (Theory O). Our main goal is to investigate the extent to which cognitive biases influenced strategic decision-making pertaining to organizational change. Strategic decision-making and organizational change both have a great impact on collaborative behavior. A survey was developed that measured different aspects of the cognitive perspective in strategic decision-making. It was distributed to managers of several medium-sized organizations in Scandinavia (n = 119). The results indicate that managers used mixed strategies (Theory E and O). The results also reveal that illusions of control together with beliefs about change processes skewed the application of strategies towards Theory E. The theoretical and practical implications of the results were finally discussed, expanding the cognitive perspective in strategic decision-making.
1. Introduction
For a long time, several social scientists have been interested in the issue of strategic decision-making (Narayanan et al., 2011). Strategic decisions are important since they have an impact on actions taken, the resources committed, or the precedents set. According to Leiblein et al. (2018), strategic decisions involve interdependence with other decisions in the organization, with the decisions of actors, and across time. They are often new, complex, and open. Moreover, they frequently extend over a long period of time, involving a number of dynamic factors. In addition, they sometimes lack clarity with regard to both the potential courses of actions and the probability of outcomes contingent on the actions.
The quality of strategic decisions is therefore often difficult to assess. This is because it is problematic to imagine what would have happened without the decision. As a result, performance is often assessed in relative rather than absolute terms, taking several measures into account (Harris & Bromiley, 2007). According to Acciarini et al. (2019), strategic decisions involve committing resources and competences to achieve strategic goals, but also to influence organizational direction structure, thus shaping the course of the organization (Eisenhardt & Zbaracki, 1992).
As noted by O’Reilly and Tushman (2013), strategic decisions are important for the firm’s ability to exploit existing resources in a successful way, and at the same time explore new technologies and markets (see also Helfat & Raubitschek, 2000; Holmqvist, 2004; March, 1991; Teece, 2006). The ability to balance these two types of opportunities constitutes the fundamental tension that directs the firm’s long-run survival (March, 1991). Recent research suggests that trade-offs are necessary to balance this tension (March, 2006; Teece, 2006; Harreld et al., 2007; Lavie et al., 2010; Lin & McDonough, 2014; Stettner & Lavie, 2014).
There are several important dimensions of a strategic decision that must be taken into account. These include the execution of a strategic plan, the allocation of resources, and the control and governance of the strategic decision-making process. As demonstrated by Walter et al. (2007), the success of collaborative projects depends on the nature of the process used to make strategic decisions (see also Walter et al., 2010). It is evident that partners are bound to make several crucial decisions during their collaboration. These decisions include the selection of a partner (Saxton, 1997), the definition of scope (Oxley & Sampson, 2004), the design of governance and monitoring systems (Das & Teng, 1998a), the allocation of resources (Das & Teng, 1998b), and the determination of dissolution procedures (Park & Ungson, 1997).
1.1. Cognitive Biases and Strategic Decision-Making
As maintained by Rau and Bromiley (2025), cognitive biases can be defined as systematic errors in decision-making with the potential for causing sub-optimal choices that do not maximize utility (see also Selart et al., 2006). Building on Acciarini et al. (2019), the term “bias” might be interpreted in different ways, but is mostly regarded as an irrational belief that influences the ability to make a specific decision based on facts and evidence (Busenwitz & Barney, 1997; Das & Teng, 1999; Simon et al., 2000).
As observed by De Martino (2006), being able to monitor trends and analyze vast amounts of information requires developed cognitive capabilities. However, potential biases might occur (Hirschleifer, 2008; Acciarini et al., 2019), such that managers tend to violate rationality in a way that affects strategic decision-making in organizations (Forbes, 2005). The biases of the most powerful actors of an organization must therefore be taken into account if we want to understand why organizations do the things they do (Hambrick, 2007; Hodgkinson et al., 2023; Powell et al., 2011).
As noted by Das and Teng (1999), cognitive biases are nearly always part of strategic decision-making. According to Calabretta et al. (2017), strategic decision-making requires both rationality and intuition (see also Selart et al., 2008), which makes it open to cognitive biases, heuristics, interpersonal dynamics, and other related factors. It thus becomes important for decision-makers to be able to build collective intuition in order to enhancing their ability to identify trends and challenges (Acciarini et al., 2019), but also to stimulate conflict, improve strategic thinking, and identify appropriate resolutions (Eisenhardt, 1999).
As indicated by Barbera-Mariné et al. (2019), biases might sometimes be useful for detecting process improvement actions. As an illustrative example, the illusion of control has been found to have a bearing on the ability to sense, seize, and reconfigure the decision-making process (Keh et al., 2002; Hodgkinson & Healy, 2011). Biased expectations may also make powerful actors more motivated and thus work harder toward a desired goal (see also Tetlock & Gardner, 2015). According to Johnson et al. (2013), biases might actually improve the decision-making process, and in line with Marshall et al. (2013), they state that cognitive biases constitute means to implement optimal behaviors, given that there exist specific constraints. Moreover, if biases can be corrected by learning or other mechanisms, the application of debiasing techniques might be considered an effective remedy (e.g., Haselton et al., 2015).
1.2. Organizational Change
According to Floyd and Wooldridge (1996, 2000), organizational change can be modeled emphasizing the cognitive processes that are played out by the change-makers. Organizational change can thus be portrayed as an ongoing cycle of sense-giving by the upper echelons, sense-making by the lower echelons, and issue selling specifically by middle managers. Sense-giving, sense-making, and issue selling can hence be regarded as the key constituents of this complex interplay.
The sense-giving provided by the upper echelons often takes the form of the articulation and provision of meaning to the change. This is accomplished through appropriate leadership acts as a means of shaping organizational interpretation (Gioia et al., 1994). According to Liebl and Schwarz (2010), assessing change is fundamental to the higher echelons in their attempts to incorporate trends within their strategic decision-making processes. The detection of change does not only depend on data and observations, but must be conceptualized cognitively by the higher echelons into their cognitive systems. It is these systems that determine how and in what way the interactions with the environment emerge (see also Walsh, 1995).
According to Geppert et al. (2003), lower echelons interpret the actions, events, and words of the upper echelons with a focus on past history and current organizational identity. As noted by Dutton et al. (2001), middle managers are most often engaged in issue selling, which, by contrast to sense-giving, involves upwards communication (Dutton & Ashford, 1993; Ocasio, 1997).
1.3. Aim of the Present Research
The main aim of this study is to investigate the impact of cognitive biases on strategic decision-making and organizational change. Following the theory launched by Beer and Nohria (2000a, 2000b), we predict that cognitive biases will play an important role in strategic decisions with regard to the choice of the change strategy. This study will contribute to the literature on cognitive biases, strategic decision-making and organizational change in three different ways. First, we demonstrate to what extent cognitive biases influence both strategic decision-making and organizational change, which is unique. There are many studies in the literature that focus on two of these three variables in isolation, but holistic integrative approaches are rare. Second, we clarify that organizations use mixed strategies, contrary to recommendations. Finally, we reveal that cognitive variables like illusions of control together with beliefs about change processes have an impact on the choice of strategy.
2. Literature Review
2.1. Beer and Nohria’s Model
Among the many models of organizational change, Beer and Nohria (2000a, 2000b) presented one based on the assumption that changes can be described in terms of six dimensions: (1) the goal, (2) the leadership, (3) the focus, (4) the process, (5) the motivational system, and (6) the use of consultants. Depending on choices made within the dimensions, one can derive two archetypical approaches to change called Theory E (economic value-driven change) and Theory O (organizational capability-driven change), based on what the goal of the change is. These are so-called theories-in-use, in that they describe what practitioners really do, and by examining the actions taken one can deduce which change strategy implicitly underlies the initiative (Beer & Nohria, 2000a, p. 3).
Neither of the theories are inherently superior to the other, but both have their distinctive advantages and limitations (Nguyen Huy, 2001; Kankanhalli et al., 2005; Nay et al., 2007; Hsu, 2008; Ates & Bititci, 2011; Pal et al., 2014). While Theory E often leads to quick results, the long-term gains tend to remain absent. In contrast, Theory O typically leads to increased effectiveness, but earnings are realized only after a long time. Most change efforts are some form of hybrid of the two, and it is indeed argued that a synthesis is the better approach if done correctly (Beer, 2001; Beer & Nohria, 2000a, 2000b). But a well-integrated approach is also more difficult to achieve, because of the innate contradictions of the two theories. Some organizations therefore choose to sequence the approaches, which can be done with an E-strategy followed by an O-strategy—in the opposite case, the benefits from the O-phase will be eradicated in the E-phase. However, many organizations end up with an arbitrary blend, encountering the drawbacks of both theories and deriving the benefits of none (Beer & Nohria, 2000a, 2000b). Table 1 exhibits the most important features of Theory E and Theory O.

Table 1.
Summary of Theory E and O on each of the dimensions of change.
2.2. Goals
The choice of goal is an important part of the change process because the goal tends to influence the strategy of the other dimensions. A Theory E strategy is characterized by a singular goal, namely, maximizing the value of the organization, usually measured by stock value (Beer, 2001; Beer & Nohria, 2000a, 2000b). This provides management with a clear purpose, and avoids distractions arising from having multiple goals whose pursuits interfere with each other (Jensen, 2000, 2002; Sundaram & Inkpen, 2004). In Theory O, the aim is to create a system that enhances employee commitment and improves performance, thereby achieving high efficiency (Beer & Nohria, 2000a). The view then may be that a firm’s context is so complex that the outcome of a change cannot be predicted with reasonable accuracy. Instead, the organization can learn to identify patterns in their environment, and understand what consequences their actions have (Marion & Uhl-Bien, 2001; Senge, 2000). To integrate Theory E and O, one must explicitly acknowledge that increasing economic value is important, but not sufficient, and that organizational capabilities must also be developed. Expectations about quick results must be met with the communication that change will require time to accomplish (Beer, 2001; Beer & Nohria, 2000a, 2000b). The goal, then, should express values and consider the interests and rights of other constituents than the shareholders (Etzioni, 1998; De Luque et al., 2008).
In goal setting, managers’ choices may be influenced by cognitive biases (Narayanan et al., 2011). One is that the financial crisis might direct managers’ attention to economic value rather than organizational capability, if falling revenue is accentuated or feared. Hence the financial crisis may make information pertaining to economic value more readily available when a goal is to be set. Also, financial goals are more tangible than goals for capability development, and therefore easier to imagine. This may lead Theory E strategies to be preferred in the goal dimension.
Change can be difficult for organizations, even in normal circumstances. Yet, when the financial crisis emerged as an indisputable fact in September of 2008, many companies were forced to do something. A majority of organizations chose change as a means to counter the financial crisis. In this context, it is interesting to learn what strategies organizations followed in order to manage their change. In addition, we ask ourselves to what extent cognitive biases could have affected their strategic decisions.
2.3. Strategic Leadership
With Theory E, change is lead from the top down, making decisions with little involvement from levels below. Consensus is not considered important, and the rest of the organization must settle with implementing the top leader’s decisions (Beer & Nohria, 2000a, 2000b). The underlying beliefs then may be that only senior executives have the strategic overview to make such decisions (Conger, 2000), that in many cases there is not time to build consensus through a participative leadership style (Beer & Nohria, 2000a), and that in crises, leaders are often expected by subordinates to act autocratically (Muczyk & Steel, 1998; Selart, 2010; Yukl, 2010). In contrast, with Theory O, executives will define core values to guide the change, but leave it to lower levels of the hierarchy to identify problems and craft solutions. Such participation is likely to increase employees’ commitment to the change (Beer & Nohria, 2000a; Yukl, 2010). An integration of Theory E and O entails top management setting direction for the change, but engaging lower hierarchal levels to engineer good solutions. That is, leaders need to retain control, but also acknowledge that they do not have all the answers (Beer & Nohria, 2000a; Yukl, 2010). Particularly in knowledge-intensive organizations, employee involvement is paramount, because they often have a better understanding of the work than their leaders (Dunphy, 2000). Leaders’ efforts to influence the change should then include indirect methods such as symbolic actions (Conger, 2000; Yukl, 2010), and developing the mental models used to comprehend the situation the organization is facing (Mumford et al., 2007).
The strategy for leading the change might also be affected by cognitive biases. For instance, the traditional image of a leader is heroic (Meindl, 1990). Managers may then believe a successful change depends on a strong leader who controls the process. Furthermore, people have an inherent need to control their environment (Langer, 1975). Both of these issues may favor Theory E strategies being selected in the leadership dimension.
2.4. Focus
According to Theory E, organizations should focus on changing “hard” components, such as the organization’s structure and systems (Beer & Nohria, 2000a, 2000b). Typical Theory E measures, then, include downsizing, new routines, or changing the formal authority of jobs. These are efforts that are under the direct control of managers (Yukl, 2008, 2010) and can be implemented swiftly (Beer & Nohria, 2000a). But many firms that have restructured their organization have failed to reap the expected benefits (Andersen & Jonsson, 2006; Cascio, 2002). In Theory O, the focus of change is on “soft” elements, most notably corporate culture (Beer & Nohria, 2000a, 2000b). Culture is ubiquitous in the organization and has significant influence over members’ behavior, and, though there may be several subcultures, some beliefs are usually shared across these (Bang, 2011; Schein, 1990, 2010; Selart & Schei, 2011). Nonetheless, organizational structure and culture are interdependent (Bang, 2011; Schein, 1990, 2010), and an integration of Theory E and O emphasizes the need to change both so that they complement each other. A new structure needs to allow for more appropriate behaviors, and a new culture must contribute to the structure functioning as intended (Beer & Nohria, 2000a, 2000b; Cohen, 2000).
Also, the focus of change could possibly be influenced by cognitive biases. First, structural efforts are among the most common responses to organizational crises, such as the financial crisis, and might therefore be considered as representative and more appropriate than what is really the case (cf. Tversky & Kahneman, 1983). Further, organizational structure is more tangible than corporate culture, which may cause the availability heuristic to favor these types of measures (Schwenk, 1984).
2.5. Process
Process means the method that is used to identify problems and implement solutions in a change initiative. Theory E strategies adhere to a clearly planned and coordinated process, under the assumption that successful change requires a structured process (Beer & Nohria, 2000a, 2000b). Theory O strategies, on the other hand, follow an emergent process (Beer & Nohria, 2000a, 2000b). Advocates of this view believe that organizations’ environments are too unstable for a centrally planned process to succeed (Burnes, 1996). Instead, organizations should change incrementally, and use experiments and learning to develop a better understanding of the process and reinforce what seems to work (Burnes, 1996; Weick, 2000). Nevertheless, change can have both planned and emergent elements simultaneously, or at different stages of the process (Van de Ven & Poole, 1995). Weick and Quinn (1999) claim that emergent change occurs continuously in pockets of the organizations, and that distributing such isolated innovations to the rest of the organization will be more episodic in character. As a compromise, integrating Theory E and O involves forming a plan for how people lower in the hierarchy are to proceed in exploring possible solutions, to increase engagement and leave room for spontaneity (Beer & Nohria, 2000a; Yukl, 2010).
If cognitive biases are to influence which change process is preferred, a need for and illusion of control seems the most likely to have an effect. The need for control may cause management to want to control the process, and the illusion of control may lead them to believe that the process is more controllable than it actually is (cf. Langer & Roth, 1975).
2.6. Strategic Leadership and Motivation
To motivate employees to accept and implement the change, Theory E relies primarily on financial incentives that align the employees’ and the organization’s interests (Beer & Nohria, 2000a, 2000b). A well-developed reward system can be an effective way to induce desired behavior, particularly if incentives are clearly tied to the performance that is rewarded (Lawler, 2000; Lawler & Worley, 2006; Peterson & Luthans, 2006; Stajkovic & Luthans, 2001). However, designing a system that does not adversely misguide effort is difficult (Lazear & Gibbs, 2009; Thompson, 2008). With Theory O, motivation is found through participation and commitment (Beer & Nohria, 2000a; Lines et al., 2005; Lines & Selart, 2013). To be involved in the process can be motivating if the work is challenging and allows employees to grow on a psychological level (Alderfer, 1969; Herzberg, 1968; Kaufman & Kaufman, 2009; Nohria et al., 2008). Involvement may also instil a satisfying feeling of control over the situation, even if this control is not real (Langer & Roth, 1975). An integration of Theory E and O entails using Theory E incentives in a Theory O way. Motivation should then be created through involvement, but financial incentives can be used to reward commitment (Beer & Nohria, 2000a, 2000b). Rewards can enhance the original motivation when they are perceived as validation, or involve the employees even more deeply (Amabile, 1997).
In the Nordic countries, involvement and collective participation are highly esteemed values, and individual performance is rewarded only moderately (Javidan et al., 2006). Norwegian leaders are especially inclined to adhere to beliefs that are common in the national culture (Smith et al., 2003). It is therefore plausible that when Norwegian managers consider which system of motivation is appropriate, the option of a participative strategy may appear representative and dominant.
2.7. Managerial Decision-Making
Many organizations hire consultancy firms to aid in the change process, but what role they have may vary (Selart, 2005; Furusten, 2009; Pellegrin-Boucher, 2006). In a Theory E strategy, consultants are used extensively both to analyze problems and to concoct remedies (Beer & Nohria, 2000a). The belief, then, is that successful change requires a total system perspective, with experts working on all levels of that system (Neill & Mindrum, 2000). Furthermore, managers often do not know what they really need from consultants, so leaving them to develop finished solutions may in many cases be psychologically preferred (Fincham, 1999). In Theory O, on the other hand, consultants will be restricted to helping management develop a process so that they can explore problems and solutions themselves (Beer & Nohria, 2000a). To integrate Theory E and O, the aim is to use consultants as expert resources that empower employees and contribute with technical competence to develop the change process, but without management giving up control (Beer & Nohria, 2000b). Also, the presence of consultants may in itself have a signaling effect that legitimizes and creates acceptance of the change (Pellegrin-Boucher, 2006; Smith et al., 2003).
Different cognitive biases may influence managers to both increase and decrease their use of consultants. A need for control may cause managers to feel uncomfortable leaving some of the control to consultants, and an illusion of control may lead managers to fail to recognize a real need for assistance. However, Fincham (1999) point out that consultants are skilled at impression management, such that consultants may be perceived to epitomize change. Managers relying on intuitive impressions of consultants may then come to increase their use of them.
Most of the reasoning presented above suggests that leaders will select a Theory E approach for their change. This is in accordance with the assumption that the choices made on the different dimensions of change will cluster around either a Theory E strategy or a Theory O strategy. Particularly, the choice of goal tends to influence strategy on the other dimensions (Beer & Nohria, 2000a). Since the theory proposes that most leaders will choose Theory E goals, Theory E might be the principal strategy used among organizations. However, some firms may have applied the outside view (cf. Lovallo & Kahneman, 2003) when they evaluated their options. This method is supposed to reduce the occurrence of cognitive biases.
3. Methodology
3.1. Research Design and Method
The purpose of this paper was (1) to map which strategies for change organizations had used, and (2) to investigate if cognitive biases may have affected their choice of strategy. In order to answer this, we selected a hypothetico-deductive approach and a survey strategy with an online questionnaire designed in the software QuestBack (spring release 2018). Survey strategies are common when the respondents are executives—a group difficult to reach by any other method (Friedrich et al., 2009). QuestBack was chosen because it allows for the automatic filtering of questions, and because data collected with QuestBack come ready to analyze in the statistics software SPSS 25.0. We used email to distribute a link to the online questionnaire, since email is a cost-efficient way to reach many respondents. The email message functioned as a covering letter. In attempted to increase response rates, the covering letter accentuated that the topic at hand may be of personal interest for the respondents (Anseel et al., 2010; Bryman, 2012; Groves et al., 2004), and that they were assured anonymity (jf. Anseel et al., 2010). Respondents were also offered an executive summary of the findings as an added incentive (cf. Groves et al., 1992). Also, two reminders were sent out three work days apart.
3.2. Data Collection
The target population for this investigation consisted of executives in organizations that had instigated changes. The size of the population was unknown, but an initial survey conducted at the Norwegian School of Economics found that about 80% of Norwegian businesses were adversely affected by the financial crisis. The study also showed that around 45% of businesses had changed their investments in organizational development or employee’s skills, and that nearly 50% of businesses had changed their investments in tangible assets. It is not clear what percentage of businesses had changed both types of investments or how many businesses had not made any such changes.
The database www.proff.no contained 1,333,251 companies, based on official registers. We considered it appropriate to restrict our target population to companies that met the following criteria:
- (1)
- The organization must not be a public service entity, because maximizing profit must be a real potential purpose for the organization’s existence;
- (2)
- The organization must have at least 25 employees, because Beer and Nohria’s (2000a, 2000b) change model is developed primarily with large companies in mind, and we wished to examine organizations with few restrictions on which change measures were available to them (e.g., that they had the opportunity to downsize without ceasing their existence);
- (3)
- The organization must have been established before 2007, such that the financial crisis may have been experienced as an interruption of normal operations.
This filtering returned a list of 8272 organizations. Based on Lien’s (2011) findings, we estimated that about two thirds of organizations had initiated change, which provides a calculated target population of 5542 organizations.
Sample Size and Sampling Method
To achieve a representative sample, we assumed that we needed approximately 100 responses from organizations that had initiated change. Because questionnaires administered over the Internet usually achieve lower response rates than other survey methods (Anseel et al., 2010; Couper, 2000; Manfreda et al., 2008), and executives generally provide lower rates than other populations (Anseel et al., 2010; Bryman, 2012), we considered it reasonable to expect a response rate of about 15% for our survey. By taking into account that around two out of every three organizations had instigated change, the smallest necessary sample size (S) is found by
100 = S × 0.15 × 0.67
S = 100/(0.15 × 0.67) ≈ 995
S = 100/(0.15 × 0.67) ≈ 995
The selection of sample units started by ordering the 8272 companies on the list alphabetically, and assigning them a number corresponding to their position on the list. Then, 1100 random numbers were drawn using Microsoft Excel. After deleting duplicates, 1044 unique numbers remained, each representing an organization on the list. A request was then sent by email to these 1044 organizations, with instructions to direct the inquiry to the top management. A few of the organizations did not have any email address disclosed, and these companies were replaced with the organization following them on the list, until 1044 organizations had been contacted.
3.3. Data Analysis
Due to the nature of our investigation, we decided to develop our own questionnaire. The operationalization of change strategies consisted of developing closed questions about which change actions the organization had undertaken, except for on the goal dimension, where respondents also had the opportunity to answer with their own words. Answers were categorized with the help of a scale, with a low score representing a “pure” Theory O response and a high score representing a “pure” Theory E response. This approach allowed us to differentiate between Theory E strategies, Theory O strategies and combination strategies on each of the change dimensions. However, we were not able to distinguish between different types of combinations (e.g., integration or arbitrary blend). Such a distinction would require an examination of each organization that was beyond the capacity of this investigation, so we limited our ambition to map strategies in terms of the “degree of” Theory E or O.
Cognitive biases are difficult to measure on an ex-post basis using a questionnaire, so our intention was to measure respondents’ beliefs and attitudes. Our assumption was that if cognitive biases had affected leaders’ choice of strategy in the decision moment, the impression created by the bias may have persisted. This is because public decisions, such as choices about organizational changes, are likely to cause a strong need to appear consistent (Cialdini, 2001). The operationalization of cognitive biases therefore entailed forming a range of statements, where respondents would indicate their degree of agreement on a seven-point Likert scale. Statements that served to measure cognitive biases were developed for each of the hypotheses, in addition to statements serving to measure optimism and inside/outside views. An overall assessment of the questionnaire resulted in around 65 items being selected for further development, which was considered an appropriate amount, with an expected completion time of about 15–20 min.
3.4. Methodological Limitations
The questions designed to measure cognitive biases were tested in a pilot study on 11 college students. Their responses were subject to an initial factor analysis in SPSS and tested for convergent validity (i.e., connected items should load on the same factor) and discriminant validity (i.e., items should not load on more than one factor). As a rule of thumb, convergent validity items should load at least 0.5, whereas discriminant validity items should load no more than 0.3 (Sannes, 2004). The initial factor analysis resulted in some improvements and the final instrument consisted of 67 items. The responses from the actual survey were also subject to a factor analysis, and the result from this did not differ from that of the pilot test. Questions regarding change strategies were not tested in the pilot study because of their objective nature.
The final factors were tested for reliability using Cronbach’s alpha (α). Cronbach’s alpha can be viewed as a confirmation of the factor’s strength (Cortina, 1993). Ordinarily, an alpha value above 0.7 (α > 0.7) indicates a stable factor (Cortina, 1993; Sannes, 2004), but for psychological concepts, values below 0.7 are not unreasonable to expect, due to the diversity that the concepts are forming a measure of (Field, 2009). Furthermore, α tends to increase with the number of items (Cortina, 1993; Field, 2009). This also suggests that α > 0.7 might be difficult to achieve for our factors, because many of them consist of very few items, due to the necessary limitation of our questionnaire’s length. The tests also showed this to be the case, with seven factors achieving α > 0.7, four factors achieving 0.7 ≥ α ≥ 0.5, and another seven factors failing to achieve α ≥ 0.5. All factors were retained for statistical analysis, but any results involving factors with α < 0.5 should be interpreted with caution.
4. Results
Altogether, 122 respondents replied to the questionnaire, but 3 of these were removed after inspecting their answers. These three responses contained almost exclusively answers in the extremes of the Likert scales, and appeared as outliers on many items. They were therefore considered to be insincere. All analyses were performed on the remaining 119 responses, which yielded a response rate of 11.4%. Among these, 113 (95%) were provided by the CEO or a member of the top management team, and 83 (69.7%) belonging to organizations that had instigated change. Only 16 (13.6%) of the respondents had been in their position less than two years. Table 2 provides an overview of the respondents.
Table 2.
Overview of respondents.
The organizations that had implemented change seemed to tend towards a Theory E strategy in the goal and process dimensions, but towards Theory O in the use of consultants. In the focus and leadership dimensions, organizations appeared to have used some form of combination strategy, while reward systems were rather evenly distributed across the possible degrees of strategies. The frequency distributions of strategies are shown below. Scales are coded so that a high score indicates Theory E usage and a low score indicates Theory O application. The reason the scales of the dimensions are of varying length is that for some dimensions, a finer nuance was considered appropriate. Table 3 reveals the frequency distribution of strategies in the change dimensions.
Table 3.
The frequency distribution of strategies in the change dimensions.
The cognitive bias items were combined into a total of 18 factors based on the factor analysis. All items were coded so that a high score indicated a high presence of the relevant factor. For example, a high score on the factor “Consultants: negative impressions” shows that the respondent has relatively strong negative attitudes towards consultants. All cognitive factors are summarized below. Table 4 exhibits a summary of the independent variables.
Table 4.
Summary of cognitive factors (independent variables).
4.1. Analysis of Response Distributions
How responses are distributed on a variable is important because many of the statistical tests rely on a number of parametric assumptions, including that variables are normally distributed (Field, 2009; Sannes, 2004). The standard deviation can be seen as a measure of how well the mean represents the data (Field, 2009), and in this case the deviation may be considered as fairly large (i.e., low precision). Skewness tells us whether responses are clustered in one end of the scale (Field, 2009), and though our responses are not highly clustered, a slight tendency towards the upper ends of the scales was observed. Kurtosis is a measure of the shape of the distribution curve, whereby positive kurtosis indicates a pointed curve with heavy tails and negative kurtosis indicates a flatter curve with lighter tails (De Carlo, 1997; Field, 2009). For skewness and kurtosis, a value of ±1.96 is often considered acceptable (Sannes, 2004), which suggests that our data set was not particularly problematic in this regard.
To test if variables are distributed significantly differently (p > 0.05) from a normal distribution, Kolmogorov–Smirnov tests were conducted on each variable. The results show that only five of the cognitive factors were normally distributed, as follows: (a) cultural beliefs, (b) beliefs—intrinsic motivation, (c) consultants—negative impressions, (d) consultants—illusion of control, and (e) outside view. Since the hypotheses were tested with multiple regression analysis and ANOVA, the primary limitation deriving from a lack of conformity is to what degree the results may be generalized to the population (Field, 2009).
4.2. Correlations
Cognitive factors correlated little with strategies. Of interest here is that “process—illusion of control” correlated with strategy on the process dimension (r = 0.295, p < 0.01), and the use of consultants correlated with both positive (r = 0.252, p < 0.05) and negative (r = −0.400, p < 0.01) impressions of consultants. Cultural beliefs correlated with strategy in the focus dimension (r = −0.205, p < 0.10), as well.
4.3. Regression Analyses
Multiple regression with leadership as the outcome variable did not reveal significant results with either illusion of control or heroic views of leadership as predictor variables, which means the hypothesis lack support. One model containing the number of employees as the input variable provided the strongest result, with R2 = 0.065 and F(1, 81) = 5.645, p < 0.05. The effect was negative, which suggests that the involvement of employees in decisions about change tended to increase with the number of employees. Table 5 reveals the multiple regression analysis on the leadership dimension.
Table 5.
Multiple regression analysis on the leadership dimension.
With regard to the cognitive factors, only cultural beliefs correlated significantly with strategy on the focus dimension. Regression analysis supported this observation, F(1, 80) = 3.517, p < 0.10. Though only weakly significant, the effect was negative, which means that leaders with cultural beliefs tended toward the application of Theory O strategies. However, the model is only able to explain 4.2% of the variation, which is considered rather low. Table 6 exhibits the multiple regression analysis on the focus dimension.
Table 6.
Multiple regression analysis on the focus dimension.
A model including “illusion of control” and “beliefs of change processes” as input variables provided significant results—F(2, 75) = 5.541, p < 0.01. The latter factor was only marginally significant. The effect of illusion of control was positive, indicating that leaders who believed that they could control the change process tended towards using Theory E strategies. The two factors combined account for 12.8% of the variance. Table 7 depicts the multiple regression analysis on the process dimension.
Table 7.
Multiple regression analysis on the process dimension.
Neither leaders’ beliefs about intrinsic motivation nor incentives correlated significantly with the organization’s use of financial incentives to implement change. Moreover, none of the models analyzed provided significant results either, while “optimism” was able to explain 6.8% of the variation—F(1, 39) = 2.831, p = 0.10. The optimism scale intended to measure how well respondents perceived their own organization in various domains compared to other firms in their industry. The effect was negative, which suggests that increased optimism about the leader’s own organization tended to reduce the use of financial incentives. Table 8 shows the multiple regression analysis on the motivation dimension.
Table 8.
Multiple regression analysis on the motivation dimension.
Both positive and negative impressions about consultants correlated significantly with choice of strategy. The tested model accounted for 28.2% of the variance—F(2, 79) = 10.212, p < 0.01. The effect of illusion of control was positive, but the wording of the items indicates that leaders who felt a lack of control relied more extensively on consultants, which means that leaders who did not lack feelings of control used consultants less. However, only negative impressions of consultants achieved statistical significance. The effect is that, as expected, leaders with negative impressions reduced their use of consultants. Table 9 depicts the multiple regression analysis on the consultant dimension.
Table 9.
Multiple regression analysis on the consultant dimension.
In addition, we applied a repeated-measures ANOVA, which examined variation in conditions when the same units provided data for each condition (Field, 2009). In this context, this refers to the variation of strategy choices across the six dimensions for each respondent. Repeated-measures ANOVA rests on the assumption of sphericity, which means that the variances in differences between respondents must be equal. This was tested with Mauchly’s test, returning χ2 = 20.706(14), p > 0.10, indicating that the deviation from sphericity was not significant and that the assumption was thus not violated.
The repeated-measures ANOVA showed significant variation—F(5, 180) = 13.464, p < 0.001. Respondents’ answers on strategy choice did not cluster in one end of the scale, but instead varied across the dimensions. The test was also performed on all six combinations with only five dimensions included, to test if one dimension was particularly troublesome. All these tests achieved significant F-ratios, but three of them violated the assumption of sphericity. In these cases, the Greenhouse–Geisser and Huyhn–Feldt corrections were all statistically significant (p < 0.01), and the epsilon (ε) values were far closer to 1 than the lower limit (0.250). The violation of sphericity was therefore limited (Field, 2009), and one can conclude that there are significant variances in the choices of strategies across the change dimensions for each organization. Table 10 portraits the effects of repeated-measures ANOVA on change dimensions.
Table 10.
Effects of repeated-measures ANOVA on change dimensions.
If the outside view is to reduce the tendency of cognitive biases, cognitive biases must be considered as outcome variables, while the outside view is given the role of the predictor variable. These assumptions were tested with the application of a multivariate ANOVA (MANOVA), which, when using several dependent variables per independent variable, is a more appropriate test than using a univariate ANOVA for each dependent variable. This is because executing a series of ANOVAs increases the probability of type 1 errors (Field, 2009). The MANOVA examines all variables simultaneously and avoids this problem. The MANOVA also accounts for relationships between outcome variables, and has greater explanatory power in that it can reveal changes between groups over a combination of variables, whereas ANOVA can only discover changes along a single variable (Field, 2009).
Before the test, respondents’ scores on the outside view were set to zero decimals, since their scores consisted of the average replies to four items and MANOVA is a test of each of the different levels of the scale. A test with no adjustment would therefore have yielded many levels with very few respondents on each level. The result of the MANOVA exposed an overall significant difference between groups (p < 0.01) for all test statistics. The test also automatically performs a univariate ANOVA for each outcome variable, and the inspection of these tests revealed four outcome variables that varied significantly with the outside view when tested alone. The four variables are (a) goal—vividness, F(4, 112) = 2.449, p < 0.05; (b) focus—structural beliefs, F(4, 112) = 2.782, p < 0.05; (c) process—illusion of control, F(4, 112) = 9.163, p < 0.01; and (d) beliefs—intrinsic motivation, F(4, 112) = 7.377, p < 0.01. By examining the Pearson correlations between these variables and the outside view, we found that all these correlations were positive and significant (p < 0.05). Table 11 provides the MANOVA on cognitive factors between different levels of outside view whereas Table 12 exhibits the Pearson correlations between significant variables from the post-MANOVA ANOVA test.
Table 11.
MANOVA on cognitive factors between different levels of outside view.
Table 12.
Pearson correlations between significant variables from the post-MANOVA ANOVA test.
5. Discussion
Researchers are often bound to deal with behavioral heterogeneity when evaluating strategic theories. An important goal of strategic research is the improvement of our understanding of strategic behavior through observation in order to improve strategic theories. A common way to deal with this heterogeneity is to recognize that strategic decision-makers differ from each other in important ways, and these differences explain the differences observed in strategic behavior. The aim of this article was to improve our understanding of heterogeneous cognitive processes that have an impact on strategic behavior, with a specific focus on organizational change.
The conducted analyses provided mixed support for the hypotheses. Evidently, the organizations did not apply an overall strategy to all change dimensions. Cognitive factors were not found to affect strategy in the goal and leadership dimensions. Hence, the change could partially be explained by cultural beliefs. Optimism appeared to dampen the use of financial incentives, while a feeling of having control seemed to increase the amount of formal planning of the change process. A lack of feeling in control, the absence of negative impressions of consultants, and a large organization in terms of number of employees increased the degree of use of consultants.
5.1. Organizations’ Change Strategies
Our results reveal that most changes can be described by the six dimensions proposed by Beer and Nohria (2000a), and within the dimensions, an organization’s strategy to change can be found to belong to Theory E, Theory O, or a combination of these. Our results indicate that organizations do not utilize one overall strategy across dimensions, but rather mix their approach. For the most successful change, organizations seek to integrate Theory E and O. If this is beyond their capability, they will be better off sticking to either Theory E or Theory O than using a mixed approach, because a mixed approach is believed to result in the detriments of both theories and the benefits of neither. Though it is beyond the scope of this paper to evaluate the success of organizations’ change efforts, the deviation from Beer and Nohria’s (2000a, 2000b) recommendation is noteworthy. This may be interpreted as organizations lacking the competence to change, but more empirical data are needed to establish the accuracy of Beer and Nohria’s framework before such a conclusion can be made. Moreover, more studies of what change strategies organizations employ should also be conducted.
5.1.1. Goals
Respondents’ answers about the goal of their change corresponded best with the description of Theory E. Many claimed that reducing the organization’s costs was a central feature of the change, and a substantial number indicated the aim of changing the organization’s strategic position. Both of these goals can be interpreted as Theory E goals. In contrast, the most commonly indicated Theory O goal was to introduce more efficient operations. Our analysis did not reveal any cognitive biases that had an impact on organizations’ choice of goal. This implies either that cognitive bias had little impact, or that cognitive biases were not properly examined. Another interpretation is that the wrong biases were examined. An alternative explanation for why organizations tended towards Theory E goals is that this helped prioritize between alternatives (Jensen, 2000, 2002; Sundaram & Inkpen, 2004). Put differently, executives might have been encouraged to incentive systems favoring Theory E goals, or that potential gains from Theory O goals might have been particularly low in this particular context. Still, Theory E strategies are generally not optimal. Learning is not emphasized, which may give rise to challenges for firms in volatile environments (Marion & Uhl-Bien, 2001; Senge, 2000). Furthermore, goals that highlight the company’s bottom line are not directly motivating for employees, so firms with this approach may have had greater difficulties evoking effort (De Luque et al., 2008).
5.1.2. Strategic Leadership
When it comes to leadership approach, many organizations evidently selected a form of combination of Theory E and O, and very few engaged in the maximal or minimal involvement of subordinates in the decision-making process. Our analysis also indicates that involvement tended to increase with the number of employees in the organization. An advantage of combining top-down and bottom-up approaches is that management may use their strategic overview to set direction (Conger, 2000), but subordinates’ operational knowledge can still be utilized to determine what changes should be implemented and how (Dunphy, 2000; Yukl, 2009). Participation may also contribute to developing a shared mental model to understand the organization’s situation (Mumford et al., 2007; Yukl, 2008). The results also suggest that at least one in three firms operate with teams in order to run the organization. This allows for team members to have complementary skills, and no member needs a full view of all parts of the firm, which makes challenges more manageable (Miles & Watkins, 2007). In solving complex problems, a leadership team can also exploit simultaneous thought processes that allow them to process more information and potentially identify better solutions than a single leader would have been able to (Cialdini, 2007; Thompson, 2008).
There may be many reasons for why most organizations seem to have selected a combination strategy in the application of their leadership. Cognitive bias is one possible reason, but our analysis did not discover this to be the case. Much research shows that the national culture influences the leadership style (e.g., Hofstede, 1980; Javidan et al., 2006). In Scandinavian countries, leaders generally apply a more participative leadership style compared to other parts of the world. Cooperation is encouraged and power distance between leaders and subordinates is low (Javidan et al., 2006). Smith et al. (2003) found that Scandinavian managers are especially non-authoritarian in their leadership style.
5.1.3. Focus
The setting of elements of the organizations that would be the focus of change turned out to be a combination of measures from both Theory E and Theory O, but with a slight leaning towards Theory E. The three most common measures indicated were (a) downsizing, (b) reduced overtime, and (c) employees’ change attitudes. The first two belong to Theory E, while the third belongs to Theory O. Other typical measures included changing the organizational structure (n = 32), new routines for control (n = 32), and developing employees’ knowledge and skills (n = 37). Most organizations had combined elements from both Theory E and Theory O, but a few more selected a majority of E measures than selected a majority of O measures. An advantage of Theory E measures is that they can readily be changed by management (Beer & Nohria, 2000a; Yukl, 2008, 2010), but a one-sided focus may have adverse effects (Cascio, 2002; Kets de Vries & Balazs, 1996). Organizational culture also affects behavior (Bang, 2011; Schein, 1990, 2010), and an unhealthy culture may hinder profitability (Nohria et al., 2003). Around half of the companies that downsized had also implemented measures to alleviate the workload on remaining employees. Most of the companies that changed their structure had also attempted to modify their culture. This suggests that many organizations’ change efforts have been well balanced. The results from our analysis indicate that one explanation of organizations’ choices of strategy may be the extent to which leaders are concerned about culture’s effects on behavior, but the effect was weak. Clearly, other factors account for much more of the variation in strategy.
5.1.4. Process
The results from the questionnaire show that most organizations have implemented changes according to a defined plan—that is, they tend towards a Theory E strategy. Planning is useful to clarify ex ante what the organization should do, and to evaluate progress underway, but such estimates about future conditions are always encumbered with uncertainty. Furthermore, the more detailed such estimates are, ceteris paribus, the more probable it becomes that the estimate is wrong. Since planning (like all activities in organizations) takes up scarce resources, the amount of planning undertaken should be at an optimal level. In other words, planning has a utility and a cost. If the primary resource required for planning is time, a hypothetical cost function can be assumed to be linear, with a constant marginal cost function. A hypothetical utility function, on the other hand, may be assumed to be concave, with a declining marginal utility function. This is because increased planning (i.e., more detailed plans) will be subject to more uncertainty.
Our analysis attempted to explain organizations’ choice of strategy in the process dimension via leaders’ need for and illusion of control, and the results provide some support for this. A regression model that also includes leadership ideas about how changes should be implemented was able to account for 12.8% of variation in strategy (F(2, 75) = 5.541, p < 0.01). This, of course, suggests a full 87.2% of variation is explained by other factors. To elaborate, people have an inherent need to control their environments (Langer, 1975), and even the act of planning may provide a confirming and comforting (but potentially false) feeling of control (Hogarth & Makridakis, 1981). If planning causes leaders to feel an increased level of control of the situation, this is analogous to them perceiving an increased utility of planning. Thus the illusion of control may cause a leader’s implicit image of the hypothetical utility function to shift outwards. This would lead them to select higher degrees of planning than would be permitted by the real control they have over the situation. This point is illustrated graphically in Figure 1.
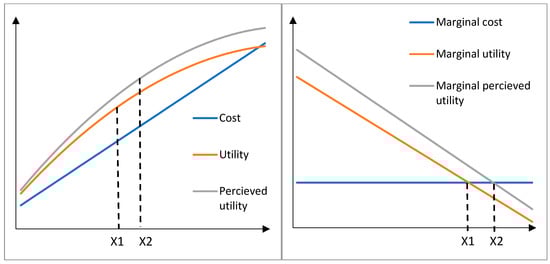
Figure 1.
Hypothetical utility and cost functions of planning. To the left, hypothetical functions of utility and cost of planning are illustrated. Illusion of control may inflate leaders’ perceptions of the utility of planning to above the real level. Maximum utility is at the point where the marginal cost of planning equals the marginal utility of planning, X1. An inflated sense of control could cause leaders to believe this point is at X2, where marginal cost is higher than the real marginal utility.
5.1.5. Strategic Leadership and Motivation
When organizations design their motivational systems to contribute to a successful change process, they have the option to utilize financial incentives in a prominent or supportive role (Beer & Nohria, 2000a). In our sample, only a minority used incentives in any way, and of these, no pattern seemed to emerge to suggest that either Theory E or Theory O strategies have been more widespread in the motivation dimension. Lawler (2000) believes incentives should be used to make employees acquire skills that will be needed when the change is completed. Additionally, some respondents seemed to have used financial incentives to support positive attitudes and involvement in the change, as is recommended in an integration of Theory E and O (Beer & Nohria, 2000a, 2000b), and a fraction of the organizations used incentives as direct motivation.
There may be many causes of organizations’ choices of motivation strategy to implement change. Financial incentives are known as an effective way to induce desired behavior in employees (Lawler & Worley, 2006; Lazear & Gibbs, 2009; Peterson & Luthans, 2006; Stajkovic & Luthans, 2001), but designing an incentive system with few adverse effects may be difficult (Lazear & Gibbs, 2009). Knowledge of this may have deterred some organizations from wielding incentives to motivate change. Interestingly, we postulated that the motivation strategy might be affected by leaders’ intuitive impression about the use of incentives, which is likely to be influenced by the Scandinavian culture, wherein involvement and collective participation is seen as more important than rewarding individual performance (Javidan et al., 2006). Interestingly, neither leaders’ beliefs about extrinsic motivation nor intrinsic motivation were found to have significant effects. Instead, it was found that leaders’ optimism about their firm’s capability had a weak significant effect. The effect was negative, which suggests that optimism tends to reduce the use of incentives, but the observed effect was only able to account for 6.8% of the variation (F(1, 39) = 2.831, p = 0.10). The fact that optimism seems to dampen the use of incentives suggests that leaders who have great faith in their organization may not see a need for incentives—an impression that may or may not be correct. Since the average score on optimism was 4.36 on a 7-point scale (i.e., slightly above the middle of the scale), it seems possible that at least some of the respondents were overoptimistic.
5.1.6. Managerial Decision Making
Organizations’ use of consultants was surprisingly low, even though reliance on consultants is commonly quite low in the Scandinavian culture (Smith et al., 2003). Only a minority of the organizations used consultants at all, and only two used consultants extensively. Apparently, few of the leaders have seen a necessity to draw on consultants’ knowledge of change processes (e.g., Neill & Mindrum, 2000). Organizations’ strategies in the consultant dimension then resemble Theory O more than Theory E. Interestingly, we found that leaders having an illusion of control also restricted their use of consultants. Our regression analysis did support this assumption. A feeling of control does indeed decrease leaders’ involvement of consultants. The opposite effect (i.e., that leaders will use consultants more) was hypothesized to occur in leaders with intuitive impressions of consultants. Intuitive impressions of consultants were conjectured to be favorable, because consultants are excellent at impression management (Fincham, 1999).
The analysis also indicated that the number of employees in the organization had a significant effect, and that larger firms appeared to use consultants less than smaller firms. A model including the three significant factors (i.e., illusion of control, negative impressions, and number of employees) was able to account for 28.2% of the variation in strategy in the consultant dimension (F(2, 79) = 10.212, p < 0.01). This is a relatively large effect, considering (a) that the negative impressions of consultants do not necessarily reflect reality, and that such subjective opinions tend to be robust to contradictory evidence (Anderson et al., 1980); and (b) how easily an illusion of control may arise (Hogarth & Makridakis, 1981; Langer & Roth, 1975; Lovallo & Kahneman, 2003). Both of these cognitive biases are serious, because both may potentially make leaders fail to receive help from consultants, even though their own organization may lack the necessary competence. Thus, leaders may be subjected to a tendency of change-related errors, which could potentially harm the firm’s profitability.
5.2. Cognitive Biases and Perspectives
Our analysis suggests that illusion of control and intuitive impressions may have an effect on organizations’ choice of strategy in the process and consultant dimensions. Also, leaders with cultural beliefs seem to approach Theory O in the focus dimension, and optimism may have a dampening effect on organizations’ use of financial incentives to motivate change. If leaders’ decisions are influenced by one or more of these factors, it may have adverse consequences for organizations’ profitability, because these biases can stray decisions from what is optimal.
Kahneman and Lovallo (1993; Lovallo & Kahneman, 2003) proposed that leaders should use the statistical approach they call the outside view. The supposition that the outside view will reduce cognitive bias was adopted and tested with MANOVA. The results indicate that the outside view does have an effect on cognitive bias, and a follow-up ANOVA revealed that four cognitive factors—vividness of goals, beliefs about organizational structure, illusion of control over the change process, and beliefs about intrinsic motivation—correlated significantly. However, the effects on all four factors were positive, which seems to suggest that the outside view increases the tendency of these cognitive biases. This conflicts with Kahneman and Lovallo’s (1993; Lovallo & Kahneman, 2003) prediction.
At first glance, this may seem dramatic. However, when examining how the four factors that were affected by the outside view-influenced strategy, only the illusion of control over the change process was significant. Why was this bias apparently reinforced by the outside view? One possible explanation is that the outside view is a planning activity. Organizations that use the outside view will collect statistics and information, and analyze their project in relation to the collected data (Lovallo & Kahneman, 2003). It seems likely that this activity comes in addition to at least some aspects of the more automatic inside view. The firms that take the outside view may then be engaging in more planning than those who stick with the inside view. This could mean two things. Firstly, it may mean that the outside view actually gives leaders more control, and makes them more able to evaluate projects and identify poor investments. Of course, this is the argument for using the outside view in the first place. However, secondly, involvement in a planning activity in itself can increase one’s sense of control (Hogarth & Makridakis, 1981; Langer, 1975). Even the erroneous use of the outside view (e.g., establish poor reference classes) may increase the feeling of control. Also, some leaders may take the outside view, but emphasize information that supports their original assumptions and downplay the relevance of conflicting information. In this way, the outside view may potentially increase both real and illusory control.
5.3. Implications
The findings from our survey have several implications for both academics and practitioners. However, prior to illuminating this, a commentary on the method seems in order.
5.3.1. Commentary on the Method
For the findings from the survey to be generalizable to the population, the sample must be representative of it. Our sample was drawn randomly from the sampling frame, which reduces the probability of systematic differences between the organizations in the sample and the organizations in the population (Bryman, 2012; Saunders et al., 2009). Further, a comparison of the number of employees in organizations in the sample and in the population shows that while some differences exist, these are not substantial, as is illustrated in Figure 2. The sample is characterized by a somewhat higher amount of large companies than what is found in the estimated population. Likewise, there are only small deviances between our sample and the sample drawn by Lien (2011), which was found to be representative, in terms of how the organizations experienced being affected by the financial crisis. For these reasons, we believe our results may also apply to other medium and large organizations in Norway.
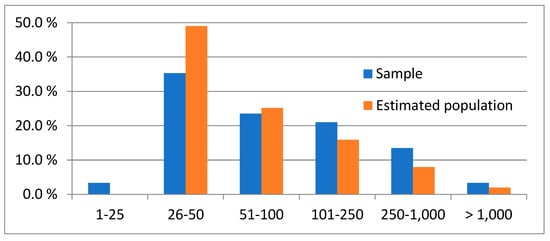
Figure 2.
Size of organizations in the sample compared to the population.
Nevertheless, two circumstances in particular in our survey merit caution in terms of the interpretation of their results. One is that there are some issues with the internal validity, primarily due to the weaknesses in the instrument. The questionnaire was developed from scratch because of the specific need for data, but several of the factors that emerged from the factor analysis failed to reach sufficient reliability, as measured by Cronbach’s alpha. This was in part caused by the low number of items of which many factors consisted, which again was a necessary consequence of limiting the questionnaire’s length to an acceptable level. The chosen number of items, then, was a trade-off between reliability and response rate. Unfortunately, the result of reducing the number of items was somewhat more prominent than hoped for in advance.
The second circumstance is that data about both dependent and independent variables were collected through the same method (i.e., questionnaire) and from the same source (i.e., the individual respondent). The results are therefore subjected to some common method biases, which may produce stronger relationships between variables than what is the true effect, because the same measurement errors influence the variables equally (Friedrich et al., 2009; Podsakoff et al., 2003). Two potential origins of such errors that may be especially relevant in this survey are (a) social desirability and (b) the need for consistency. Some respondents may have given answers that reflect what is more socially acceptable rather than their own opinions, especially if some items clearly reflect desirable attitudes (Podsakoff et al., 2003). Also, many people feel a strong need to appear consistent with themselves (Cialdini, 2001), and this may lead respondents to adapt their answers so that they match each other (Podsakoff et al., 2003). Ideally, data about independent and dependent variables should be collected from different sources—for example, data about cognitive factors from leaders, and data about strategies from employees or the organizations’ internal documents. However, this would require much more resources and was deemed unfeasible for our survey.
5.3.2. Implications for Practitioners
Collaborative behavior is bound to have implications for a multitude of change processes in the organization. Our findings on collaborative behavior may thus be relevant to many medium-sized and large organizations that plan to implement changes of any magnitude. It seems that most organizations do not adhere to one strategy, but rather mix Theory E, Theory O, and combination strategies rather arbitrarily. The survey did not attempt to determine the firms’ success, but the deviation from normative theory is noteworthy, because the application of mixed strategies is deemed to have the lowest chance of success (Beer & Nohria, 2000a, 2000b). This suggests that many organizations have the potential to implement changes in a better way (Ciborra, 1991). By making more consistent strategy choices in the future, organizations may increase profitability more than if they stick to mixed strategies.
One possible reason why organizations have evidently chosen inappropriate approaches is that they lack competence in their change processes. Implementing changes in situations such as during the financial crisis is a rare occurrence. It is remarkable, then, that so few of the organizations obtained help from consultants, which supposedly are in possession of this competence. Consultancy firms can accumulate the demand for change competence from a large number of companies, and therefore they have a greater use for this competence than companies that only need this competence sporadically to implement internal change. Our analysis indicates that leaders who rely on their perceptions of control and the intuitive impressions of consultants tend to use consultants less, and possibly less than what they should, considering the competence the organization is likely to gain internally. This may cause firms to initiate changes they are unable to execute profitably. Thus, leaders should pay particular attention to these cognitive biases and take steps to correct them. For example, they can appoint a devil’s advocate to challenge assumptions.
5.3.3. Implications for Theory
Much is already written on the topics covered in this paper—change management (e.g., Beer & Nohria, 2000a; Burnes, 1996), decision-making and cognitive biases in general (e.g., Langer, 1975), and cognition in organization contexts in particular (e.g., Mumford et al., 2007; Schwenk, 1984). Our study may be seen as having contributed in three areas. First, a basic mapping was made of what change strategies organizations have used. It seems that the goal of most changes in organizations is to increase organizational value. Organizations have apparently led this change by involving subordinates in decisions to a moderate extent, and focused on changing both the organizational structure and culture. The change process seems to have been planned in advance, and consultants’ involvement has mostly been minute. No clear majority of any strategy was found in the motivation dimension. The finding that organizations do not adopt one overall strategy across all dimensions, but instead seem to mix strategies arbitrarily, suggests many organizations have a potential to implement changes more effectively than they have done. More research is needed to provide clearer instructions on how to best implement changes.
Second, we tested hypotheses to see if cognitive biases may have influenced organizations’ change strategies. Some issues with validity limit this contribution, but among the more robust results, we found that (a) leaders with a strong sense of control engage in more planning than leaders with a weaker sense of control; (b) leaders’ perceptions of control and impressions of consultants parallel the extent to which consultants are involved in the change, and (c) the use of an outside view does not appear to lessen the propensity for cognitive biases, but rather increases the feeling of control in the planning process. This may be explained by the shear amount of planning these organizations undertake, which in itself can increase leaders’ feelings of control (Hogarth & Makridakis, 1981; Langer, 1975).
The third contribution is of a more methodological character, in that our questionnaire may be viewed as a first step towards a better instrument for researching this type of phenomena. Particularly, the questions regarding optimism and perspectives seem promising and may be further developed productively. Additionally, organizations’ numbers of employees were discovered as significant variables in the leadership and consultant dimensions. This must be given consideration in future investigations, and should then be included as a control variable.
Much remains for future research to uncover. Examining change strategies with other research designs, for example in a multiple-case study, might be fruitful. This should provide more complete data on the change strategies employed, for example, with a clearer differentiation between strategies that integrate Theory E and Theory O and strategies that just mix elements from both theories. One may then also better avoid common method biases, by collecting data from predictor and outcome variables from different sources and derived through different methods. Such research may endeavor to develop a strong instrument to measure Theory E and O. Further, it may be of interest to examine in more detail how cognitive biases can affect change strategies. One remedy for some issues in our study may be to restrict the investigation to only a few of the change dimensions, if using a questionnaire to collect data. More items per factor may then be included, which should improve reliability and validity. One goal of future research should be to develop an instrument to measure cognitive bias in organizational contexts. Much of the prior research on heuristics and cognitive biases has been conducted in laboratory settings and is somewhat difficult to generalize to “the real world” (Bryman, 2012; Eysenck & Keane, 2010).
5.3.4. Limitations
It is important to note some limitations. First, the survey was based on self-reported data, which might have been subject to social desirability issues. Another potential limitation is that results based on self-reported data might also be inaccurate due to the participants having misunderstood questions knowingly or unknowingly.
Other limitations refer to measurement, in the sense that the six dimensions of strategic change could have been defined more thoroughly, as well as the 18 cognitive bias factors. More information could also have been provided on how the Likert scale items were created and validated. We could also have provided a more elaborate discussion on the results of the Kolmogorov–Smirnov test, with a focus on the impact of non-normality on regression and ANOVA validity.
5.3.5. Recommendations for Future Research
In times of organizational change, the process of analysis often becomes challenging due to the great amount of information available. Since information overload has the potential to influence strategic decisions, the emergence of big data and data-driven organization might be seen as a threat to the balance between rational and intuitive decision-making (Calabretta et al., 2017; Selart et al., 2008). Hence, it becomes imperative for future research to study in which situations cognitive biases produce a limitation to strategic decisions. This is important since the role of cognitive biases in decision-making processes might be altered by the introduction of big data and digitalization (see also Helbing et al., 2018).
Future research could also further clarify how each cognitive bias factor impacts on strategic decision-making. Such research could ideally consider incorporating more recent contexts, such as digital transformation, post-pandemic recovery, and economic uncertainty. It could also focus on different industries using alternative methodologies or examining the long-term effects of strategic choices.
6. Conclusions
To summarize, we have discussed some of the areas and unresolved issues that must be addressed if the research on cognitive biases is to maximize its contribution to strategic decision-making and organizational change. We have identified research from the literature and highlighted its contribution to strategic management theory and practice. In doing so, we have integrated the literature on strategic decision-making within a conceptual framework that distinguishes between two fundamentally different theories (Theory E and Theory O), capturing both their structures and processes.
The Beer and Nohria hypothesis states that strategic decision-makers choose either Theory E or Theory O as a means of adaptation in their planning processes. The results presented in this article are not clearly in line with this hypothesis. We examined to what degree organizations used strategies that focused on maximizing shareholder value (Theory E), or if they used strategies emphasizing the development of organizational capability (Theory O). Our main goal was to investigate to what extent cognitive biases influenced strategic decision-making with implications for organizational change. Strategic decision-making and organizational change both have great impacts on alliances and collaborative behavior. Our results indicate that managers used mixed strategies (Theory E and O), contrary to recommendations. The results also reveal that illusions of control together with beliefs about change processes skewed the application of strategies towards Theory E. The theoretical and practical implications of the results were finally discussed, expanding the cognitive perspective in strategic decision-making.
Author Contributions
Conceptualization, K.M. and M.S.; software, K.M.; methodology, K.M.; Writing—original draft preparation, K.M. and M.S.; writing—review and editing, M.S.; supervision, M.S.; project administration, M.S. All authors have read and agreed to the published version of the manuscript.
Funding
The research received no external funding.
Institutional Review Board Statement
Not applicable.
Informed Consent Statement
Not applicable.
Data Availability Statement
Please take contact with the first author for possible access to the data.
Conflicts of Interest
The authors declare no conflict of interest.
References
- Acciarini, C., Brunetta, F., & Boccardelli, P. (2019). Cognitive biases and decision-making strategies in times of change: A systematic literature review. Management Decision, 39, 638–652. [Google Scholar] [CrossRef]
- Alderfer, C. P. (1969). An empirical test of a new theory of human needs. Organizational Behavior and Human Performance, 4, 142–175. [Google Scholar] [CrossRef]
- Amabile, T. (1997). Motivating creativity in organizations: On doing what you love and loving what you do. California Management Review, 40(1), 39–58. [Google Scholar] [CrossRef]
- Andersen, J. A., & Jonsson, P. (2006). Does organization structure matter? On the relationship between the structure, functioning and effectiveness. International Journal of Innovation and Technology Management, 3(3), 237–263. [Google Scholar] [CrossRef]
- Anderson, C. A., Lepper, M. R., & Ross, L. (1980). Perseverance of social theories: The role of explanation in the persistence of discredited information. Journal of Personality and Social Psychology, 39(6), 1037–1049. [Google Scholar] [CrossRef]
- Anseel, F., Lievens, F., Schollaert, E., & Choragwicka, B. (2010). Response rates in organizational science: A meta-analytical review and guidelines for survey researchers. Journal of Business and Psychology, 25(3), 335–349. [Google Scholar] [CrossRef]
- Ates, A., & Bititci, U. (2011). Change process: A key enabler for building resilient SMEs. International Journal of Production Research, 49, 5601–5618. [Google Scholar] [CrossRef]
- Bang, H. (2011). Organisasjonskultur. (4. utgave). Universitetsforlaget. [Google Scholar]
- Barbera-Mariné, M. G., Cannavacciuolo, L., Ippilito, A., Ponsiglione, C., & Zollo, G. (2019). The weight of organizational factors on heuristics: Evidence from triage decision making processes. Management Decision, 57, 2890–2910. [Google Scholar] [CrossRef]
- Beer, M. (2001). How to develop an organization capable of sustained high performance: Embrace the drive for results-capability development paradox. Organizational Dynamics, 29(4), 233–247. [Google Scholar] [CrossRef]
- Beer, M., & Nohria, N. (Eds.). (2000a). Breaking the code of change. Harvard Business School Press. [Google Scholar]
- Beer, M., & Nohria, N. (2000b). Cracking the code of change. Harvard Business Review, 78(3), 133–141. [Google Scholar]
- Bryman, A. (2012). Social research methods (4th ed.). Oxford University Press. [Google Scholar]
- Burnes, B. (1996). No such thing as… a “one best way” to manage organizational change. Management Decision, 34(10), 11–18. [Google Scholar] [CrossRef]
- Busenwitz, L. W., & Barney, J. B. (1997). Differences between entrepreneurs and managers in large organizations: Biases and heuristics in strategic decision-making. Journal of Business Venturing, 12, 9–30. [Google Scholar] [CrossRef]
- Calabretta, G., Gemser, G., & Wijnberg, N. M. (2017). The interplay between intuition and rationality in strategic decision-making. A paradox perspective. Organization Studies, 38, 365–401. [Google Scholar] [CrossRef]
- Cascio, W. F. (2002). Strategies for responsible restructuring. Academy of Management Executive, 16(3), 80–91. [Google Scholar]
- Cialdini, R. B. (2001). Harnessing the science of persuasion. Harvard Business Review, 79(9), 72–79. [Google Scholar]
- Cialdini, R. B. (2007). How to get the best solutions from your team. Harvard Management Update, 12(5), 2–4. [Google Scholar]
- Ciborra, C. U. (1991). Alliances as learning experiments: Cooperation, competition, and change in high-tech industries. In L. K. Mytelka (Ed.), Strategic partnerships: States, firms and international competition. Pinter Publishers. [Google Scholar]
- Cohen, A. R. (2000). Initiating change: The anatomy of structure as a starting point: A commentary on Galbraith and Hirschhorn. In M. Beer, & N. Nohria (Eds.), Breaking the code of change (pp. 177–191). Harvard Business School Press. [Google Scholar]
- Conger, J. A. (2000). Effective change begins at the top. In M. Beer, & N. Nohria (Eds.), Breaking the code of change (pp. 99–112). Harvard Business School Press. [Google Scholar]
- Cortina, J. M. (1993). What is coefficient alpha? An examination of theory and applications. Journal of Applied Psychology, 78(1), 98–104. [Google Scholar] [CrossRef]
- Couper, M. P. (2000). Web surveys: A review of issues and approaches. Public Opinion Quarterly, 64(4), 464–494. [Google Scholar] [CrossRef]
- Das, T. K., & Teng, B. S. (1998a). Between trust and control: Developing confidence in partner cooperation in alliances. Academy of Management Review, 23, 491–512. [Google Scholar] [CrossRef]
- Das, T. K., & Teng, B. S. (1998b). Resource and risk management in the strategic alliance making process. Journal of Management, 24, 21–42. [Google Scholar] [CrossRef]
- Das, T. K., & Teng, B. S. (1999). Cognitive biases and strategic decision processes: An integrative perspective. Journal of Management Studies, 36, 757–778. [Google Scholar] [CrossRef]
- De Carlo, L. T. (1997). On the meaning and use of kurtosis. Psychological Methods, 2(3), 292–307. [Google Scholar] [CrossRef]
- De Luque, M. S., Washburn, N. T., Waldman, D. A., & House, R. J. (2008). Unrequited profit: How stakeholder and economic values relate to subordinates’ perceptions of leadership and firm performance. Administrative Science Quarterly, 53(4), 626–654. [Google Scholar] [CrossRef]
- De Martino, B. (2006). Frames, biases, and rational decision making in the human brain. Science, 313, 684–687. [Google Scholar] [CrossRef] [PubMed]
- Dunphy, D. (2000). Embracing paradox: Top-down versus participative management of organizational change: A commentary on Conger and Bennis. In M. Beer, & N. Nohria (Eds.), Breaking the code of change (pp. 123–135). Harvard Business School Press. [Google Scholar]
- Dutton, J. E., & Ashford, S. J. (1993). Selling issues to top management. Academy of Management Review, 18, 397–428. [Google Scholar] [CrossRef]
- Dutton, J. E., Ashford, S. J., O’Neill, R. M., & Lawrence, K. A. (2001). Moves that matter: Issue selling and organizational change. Academy of Management Journal, 44, 716–736. [Google Scholar] [CrossRef]
- Eisenhardt, K. M. (1999). Strategy as strategic decision making. Sloan Management Review, 40, 65. [Google Scholar]
- Eisenhardt, K. M., & Zbaracki, M. J. (1992). Strategic decision making. Strategic Management Journal, 13, 17–37. [Google Scholar] [CrossRef]
- Etzioni, A. (1998). A communitarian note on stakeholder theory. Business Ethics Quarterly, 8(4), 679–691. [Google Scholar] [CrossRef]
- Eysenck, M. W., & Keane, M. T. (2010). Cognitive psychology: A student’s handbook (6th ed.). Psychology Press. [Google Scholar]
- Field, A. (2009). Discovering statistics using SPSS (and sex and drugs and rock ‘n’ roll) (3rd ed.). SAGE Publications. [Google Scholar]
- Fincham, R. (1999). The consultant-client relationship: Critical perspectives on the management of organizational change. Journal of Management Studies, 36, 335–351. [Google Scholar] [CrossRef]
- Floyd, S. W., & Wooldridge, B. (1996). The strategic middle manager: How to create and sustain. Jossey-Bass. [Google Scholar]
- Floyd, S. W., & Wooldridge, B. (2000). Building strategy from the middle: Reconceptualize strategy process. Sage. [Google Scholar]
- Forbes, D. P. (2005). Are some entrepreneurs more confident than others? Journal of Business Venturing, 20, 623–640. [Google Scholar] [CrossRef]
- Friedrich, T. L., Byrne, C. L., & Mumford, M. D. (2009). Methodological and theoretical considerations in survey research. Leadership Quarterly, 20(2), 57–60. [Google Scholar] [CrossRef]
- Furusten, S. (2009). Management consultants as improvising agents of stability. Scandinavian Journal of Management, 25(3), 264–274. [Google Scholar] [CrossRef]
- Geppert, M., Williams, K., & Matten, D. (2003). The social construction of contextual rationalities in MNCs: An Anglo-German comparison of subsidiary choice. Journal of Management Studies, 40, 617–641. [Google Scholar] [CrossRef]
- Gioia, D. A., Thomas, J. B., Clark, S. M., & Chittipaldi, K. (1994). Symbolism and strategic change in academia: The dynamics of sensemaking and influence. Organization Science, 5, 363–383. [Google Scholar] [CrossRef]
- Groves, R. M., Cialdini, R. B., & Couper, M. P. (1992). Understanding the decision to participate in a survey. Public Opinion Quarterly, 56(4), 475–495. [Google Scholar] [CrossRef]
- Groves, R. M., Presser, S., & Dipko, S. (2004). The role of topic interest in survey participation decisions. Public Opinion Quarterly, 68(1), 2–31. [Google Scholar] [CrossRef]
- Hambrick, D. C. (2007). Upper echelons theory: An update. Academy of Management Review, 32, 334–343. [Google Scholar] [CrossRef]
- Harreld, J. B., O’Reilly, C. A., & Tushman, M. L. (2007). Dynamic capabilities at IBM: Driving strategy into action. California Management Review, 49, 21–43. [Google Scholar] [CrossRef]
- Harris, J. D., & Bromiley, P. (2007). Incentives to cheat: The influence of executive compensation and firm performance on financial misrepresentation. Organization Science, 18, 350–367. [Google Scholar] [CrossRef]
- Haselton, M. G., Nettle, D., & Andrews, P. W. (2015). The evolution of cognitive bias. In D. M. Buss (Ed.), The handbook of evolutionary psychology (pp. 724–746). Wiley. [Google Scholar]
- Helbing, D., Frey, B. S., Gigerenzer, G., Hafen, E., Hagner, M., Hofstetter, Y., van der Hoven, J., Zicari, R. V., & Zwitter, A. (2018). Will democracy survive big data and artificial intelligence? In D. Helbing (Ed.), Towards digital enlightenment: Essays on the dark and light sides of the digital revolution (pp. 73–98). Springer. [Google Scholar]
- Helfat, C. E., & Raubitschek, R. S. (2000). Product sequencing: Co-evolution of knowledge, capabilities, and products. Strategic Management Journal, 21, 961–979. [Google Scholar] [CrossRef]
- Herzberg, F. (1968). One more time: How do you motivate employees? Harvard Business Review, 46(1), 53–62. [Google Scholar]
- Hirschleifer, D. (2008). Psychological bias as a driver of financial regulation. European Financial Management, 14, 856–874. [Google Scholar] [CrossRef]
- Hodgkinson, G. P., & Healy, M. P. (2011). Psychological foundations of dynamic capabilities: Reflexion and reflection in strategic management. Strategic Management Journal, 32, 1500–1516. [Google Scholar] [CrossRef]
- Hodgkinson, G. P., Burkhard, B., Foss, N. J., Grichnik, D., Sarala, R. M., Tang, Y., & Van Essen, M. (2023). The heuristics and biases of top managers: Past, present, and future. Journal of Management Studies, 60, 1033–1063. [Google Scholar] [CrossRef]
- Hofstede, G. (1980). Motivation, leadership, and organization: Do American theories apply abroad? Organizational Dynamics, 9(1), 42–63. [Google Scholar] [CrossRef]
- Hogarth, R. M., & Makridakis, S. (1981). Forecasting and planning: An evaluation. Management Science, 27(2), 115–138. [Google Scholar] [CrossRef]
- Holmqvist, M. (2004). Experiential learning processes of exploitation and exploration within and between organizations: An empirical study of product development. Organization Science, 15, 70–81. [Google Scholar] [CrossRef]
- Hsu, I. C. (2008). Knowledge sharing practices as a facilitating factor for improving organizational performance through human capital: A preliminary test. Expert Systems with Applications, 35, 1316–1326. [Google Scholar] [CrossRef]
- Javidan, M., Dorfman, P. W., de Luque, M. S., & House, R. J. (2006). In the eye of the beholder: Cross-cultural lessons in leadership from project GLOBE. Academy of Management Perspectives, 20(1), 67–90. [Google Scholar] [CrossRef]
- Jensen, M. C. (2000). Value maximization and the corporate objective function. In M. Beer, & N. Nohria (Eds.), Breaking the code of change (pp. 37–57). Harvard Business School Press. [Google Scholar]
- Jensen, M. C. (2002). Value maximization, stakeholder theory, and the corporate objective function. Business Ethics Quarterly, 12(2), 235–256. [Google Scholar] [CrossRef]
- Johnson, D. D. P., Blumstein, D. T., Fowler, J. H., & Haselton, M. G. (2013). The evolution of error: Error management, cognitive constraints, and adaptive decision-making biases. Trends in Ecology and Evolution, 28, 474–481. [Google Scholar] [CrossRef] [PubMed]
- Kahneman, D., & Lovallo, D. (1993). Timid choices and bold forecasts: A cognitive perspective on risk taking. Management Science, 39(1), 17–31. [Google Scholar] [CrossRef]
- Kankanhalli, A., Tan, B. C. Y., & Wei, K. K. (2005). Contributing knowledge to electronic knowledge repositories: An Empirical investigation. MIS Quarterly, 29, 113–143. [Google Scholar] [CrossRef]
- Kaufman, G., & Kaufman, A. (2009). Psykologi i organisasjon og ledelse (4th ed.). Fagbokforlaget. [Google Scholar]
- Keh, H. T., Der Foo, M., & Lim, B. C. (2002). Opportunity evaluation under risky conditions: The cognitive processes of entrepreneurs. Entrepreneurship, Theory, and Practice, 27, 125–148. [Google Scholar] [CrossRef]
- Kets de Vries, M. F. R., & Balazs, K. (1996). The human side of downzising. European Management Journal, 14(2), 111–120. [Google Scholar] [CrossRef]
- Langer, E. J. (1975). The illusion of control. Journal of Personality and Social Psychology, 32(2), 311–328. [Google Scholar] [CrossRef]
- Langer, E. J., & Roth, J. (1975). Heads I win, tails it’s chance: The illusion of control as a function of the sequence of outcomes in a purely chance task. Journal of Personality and Social Psychology, 32(6), 951–955. [Google Scholar] [CrossRef]
- Lavie, D., Stettner, U., & Tushman, M. L. (2010). Exploration and exploitation within and across organizations. The Academy of Management Annals, 4, 109–155. [Google Scholar] [CrossRef]
- Lawler, E. E., III. (2000). Pay system change: Lag, lead, or both? a commentary on Wruck, Ledford, and Heneman. In M. Beer, & N. Nohria (Eds.), Breaking the code of change (pp. 323–336). Harvard Business School Press. [Google Scholar]
- Lawler, E. E., III, & Worley, C. G. (2006). Winning support for organizational change: Designing employee reward systems that keep on working. Ivey Business Journal, 70(4), 1–5. [Google Scholar]
- Lazear, E. P., & Gibbs, M. (2009). Personnel economics in practice (2nd ed.). John Wiley & Sons. [Google Scholar]
- Leiblein, M. J., Reuer, J. J., & Zenger, T. (2018). What makes a decision strategic? Strategy Science, 3, 558–573. [Google Scholar] [CrossRef]
- Liebl, F., & Schwarz, J. O. (2010). Normality of the future: Trend diagnosis for strategic foresight. Futures, 42, 313–327. [Google Scholar] [CrossRef]
- Lin, H.-E., & McDonough, E. F. (2014). Cognitive frames, learning mechanisms, and innovation ambidexterity. Journal of Product Innovation Management, 31, 170–188. [Google Scholar] [CrossRef]
- Lines, R., & Selart, M. (2013). Participation and organizational commitment during change: From utopist to realist perspectives. In R. Lewis, S. Leonard, & A. Freeman (Eds.), HHandbook of the psychology of leadership, change, and organizational development. Wiley-Blackwell. [Google Scholar]
- Lines, R., Selart, M., Espedal, B., & Johansen, S. T. (2005). The production of trust during organizational change. Journal of Change Management, 5, 1–24. [Google Scholar] [CrossRef]
- Lovallo, D., & Kahneman, D. (2003). Delusions of success. Harvard Business Review, 81(7), 56–63. [Google Scholar]
- Manfreda, K. L., Bosnjak, M., Berzelak, J., Haas, I., & Vehovar, V. (2008). Web surveys versus other survey modes: A meta-analysis comparing response rates. International Journal of Market Research, 50(1), 79–104. [Google Scholar] [CrossRef]
- March, J. G. (1991). Exploration and exploitation in organizational learning. Organization Science, 2, 71–87. [Google Scholar] [CrossRef]
- March, J. G. (2006). Rationality, foolishness and adaptive intelligence. Strategic Management Journal, 27, 201–214. [Google Scholar] [CrossRef]
- Marion, R., & Uhl-Bien, M. (2001). Leadership in complex organizations. Leadership Quarterly, 12(4), 389–418. [Google Scholar] [CrossRef]
- Meindl, J. R. (1990). On leadership: An alternative to conventional wisdom. Research in Organizational Behavior, 12, 159–203. [Google Scholar]
- Miles, S. A., & Watkins, M. D. (2007). The leadership team. Harvard Business Review, 85(4), 90–98. [Google Scholar] [PubMed]
- Muczyk, J. P., & Steel, R. P. (1998). Leadership style and the turnaround executive. Business Horizons, 41(2), 39–46. [Google Scholar] [CrossRef]
- Mumford, M. D., Friedrich, T. L., Caughron, J. J., & Byrne, C. L. (2007). Leader cognition in real world settings: How do leaders think about crises? Leadership Quarterly, 18(6), 515–543. [Google Scholar] [CrossRef]
- Narayanan, V. K., Zane, L. J., & Kemmerer, B. (2011). The cognitive perspective in strategy: An integrative review. Journal of Management, 37, 305–335. [Google Scholar] [CrossRef]
- Nay, R., Corley, K. G., & Gioia, D. A. (2007). The intersection of organizational identity, knowledge and practice: Attempting strategic change via knowledge grafting. Academy of Management Journal, 50, 821–847. [Google Scholar]
- Neill, T., & Mindrum, C. (2000). Human performance that increases business performance: The growth of change management and its role in creating new forms of business value. In M. Beer, & N. Nohria (Eds.), Breaking the code of change (pp. 339–359). Harvard Business School Press. [Google Scholar]
- Nguyen Huy, Q. U. Y. (2001). Time, temporal capability, and planned change. Academy of Management Review, 26, 601–623. [Google Scholar] [CrossRef]
- Nohria, N., Groysberg, B., & Lee, L. (2008). Employee motivation: A powerful new model. Harvard Business Review, 86(7/8), 78–84. [Google Scholar]
- Nohria, N., Joyce, W., & Robertson, B. (2003). What really works. Harvard Business Review, 81(7), 42–52. [Google Scholar]
- O’Reilly, C. A., & Tushman, M. L. (2013). Organizational ambidexterity: Past, present, and future. Academy of Management Perspectives, 27, 324–338. [Google Scholar] [CrossRef]
- Ocasio, W. (1997). Towards an attention-based view of the firm. Strategic Management Journal, 18, 187–206. [Google Scholar] [CrossRef]
- Oxley, J. E., & Sampson, R. C. (2004). The scope and governance of international R&D alliances. Strategic Management Journal, 24, 723–749. [Google Scholar]
- Pal, R., Torstensson, H., & Mattila, H. (2014). Antecedents of organizational resilience in economic crises: An empirical study of Swedish textile and clothing SMEs. International Journal of Production Economics, 147, 410–418. [Google Scholar] [CrossRef]
- Park, S. H., & Ungson, G. R. (1997). The effect of partner rationality, organizational dissimilarity, and economic motivation on the dissolution of joint ventures. Academy of Management Journal, 39, 279–307. [Google Scholar] [CrossRef]
- Pellegrin-Boucher, E. (2006). The symbolic functions of consultants. Journal of General Management, 32(2), 1–16. [Google Scholar] [CrossRef]
- Peterson, S. J., & Luthans, F. (2006). The impact of financial and nonfinancial incentives on business-unit outcomes over time. Journal of Applied Psychology, 91(1), 156–165. [Google Scholar] [CrossRef]
- Podsakoff, P. M., MacKenzie, S. B., Lee, J., & Podsakoff, N. P. (2003). Common method biases in behavioral research: A critical review of the literature and recommended remedies. Journal of Applied Psychology, 88(5), 879–903. [Google Scholar] [CrossRef]
- Powell, T. C., Lovallo, D., & Fox, C. R. (2011). Behavioral strategy. Strategic Management Journal, 32, 1369–1386. [Google Scholar] [CrossRef]
- Rau, D., & Bromiley, P. (2025). A review of cognitive biases in strategic decision-making. Long Range Planning, 58(3), 102529. [Google Scholar] [CrossRef]
- Sannes, R. (2004, March 26). Dataanalyse og statistikk—Kvantitativ tilnærming. Available online: http://home.bi.no/fgl88001/metode/Kvantitativ_datanalyse_v3-11.pdf (accessed on 19 April 2011).
- Saunders, M., Lewis, P., & Thornhill, A. (2009). Research methods for business students (5th ed.). Pearson Education. [Google Scholar]
- Saxton, T. (1997). The effects of partner and relationship characteristics on alliance outcomes. Academy of Management Journal, 40, 443–461. [Google Scholar] [CrossRef]
- Schein, E. H. (1990). Organizational culture. American Psychologist, 45(2), 109–119. [Google Scholar] [CrossRef]
- Schein, E. H. (2010). Organizational culture (4th ed.). Jossey-Bass. [Google Scholar]
- Schwenk, C. R. (1984). Cognitive simplification processes in strategic decision-making. Strategic Management Journal, 5(2), 111–128. [Google Scholar] [CrossRef]
- Selart, M. (2005). Understanding the role of locus of control in consultative decision making. Management Decision, 43, 397–412. [Google Scholar] [CrossRef][Green Version]
- Selart, M., Kuvaas, B., Boe, O., & Takemura, K. (2006). The influence of decision heuristics and overconfidence on multiattribute choice: A process-tracing study. European Journal of Cognitive Psychology, 18, 437–453. [Google Scholar] [CrossRef]
- Selart, M. (2010). A leadership perspective on decision making. Cappelen Damm. [Google Scholar]
- Selart, M., Nordström, T., Kuvaas, B., & Takemura, K. (2008). Effects of reward on self-regulation, intrinsic motivation and creativity. Scandinavian Journal of Educational Research, 52, 439–458. [Google Scholar] [CrossRef]
- Selart, Marcus, & Schei, V. (2011). Organizational culture. In M. A. Runco, & S. R. Pritzker (Eds.), Encyclopedia of creativity (2nd ed., vol. 2, pp. 193–196). Academic Press. [Google Scholar]
- Senge, P. M. (2000). The puzzles and paradoxes of how living companies create wealth: Why single-valued objective functions are not quite enough. In M. Beer, & N. Nohria (Eds.), Breaking the code of change (pp. 59–81). Harvard Business School Press. [Google Scholar]
- Simon, M., Houghton, S. M., & Aquino, K. (2000). Cognitive biases, risk perception, and venture formation: How individuals decide to start companies. Journal of Business Venturing, 15, 113–134. [Google Scholar] [CrossRef]
- Smith, P. B., Andersen, J. A., Ekelund, B., Graversen, G., & Ropo, A. (2003). In search of Nordic management styles. Scandinavian Journal of Management, 19(4), 491–507. [Google Scholar] [CrossRef]
- Stajkovic, A. D., & Luthans, F. (2001). Differential effects of incentive motivators on work performance. Academy of Management Journal, 4(3), 580–590. [Google Scholar] [CrossRef]
- Stettner, U., & Lavie, D. (2014). Ambidexterity under scrunity: Exploration and exploitation via internal organization, alliances, and acquisition. Strategic Management Journal, 35, 1903–1929. [Google Scholar] [CrossRef]
- Sundaram, A. K., & Inkpen, A. C. (2004). The corporate objective revisited. Organization Science, 15(3), 350–363. [Google Scholar] [CrossRef]
- Teece, D. J. (2006). Reflections on “Profiting from innovation”. Research Policy, 35, 1131–1146. [Google Scholar] [CrossRef]
- Tetlock, P. E., & Gardner, D. (2015). Super forecasting: The art and science of prediction. Random House. [Google Scholar]
- Thompson, L. L. (2008). Making the team: A guide for managers (3rd ed.). Pearson Education. [Google Scholar]
- Tversky, A., & Kahneman, D. (1983). Extensional versus intuitive reasoning: The conjunction fallacy in probability judgment. Psychological Review, 90(4), 293–315. [Google Scholar] [CrossRef]
- Van de Ven, A. H., & Poole, M. S. (1995). Explaining development and change in organizations. Academy of Management Review, 20(3), 510–540. [Google Scholar] [CrossRef]
- Walsh, J. P. (1995). Managerial and organizational cognition: Notes from atrip down memory lane. Organization Science, 6, 280–320. [Google Scholar] [CrossRef]
- Walter, J., Kellermanns, F. W., & Lechner, C. (2010). Decision making within and between organizations: Rationality, politics, and alliance performance. Journal of Management, 38, 1582–1610. [Google Scholar] [CrossRef]
- Walter, J., Lechner, C., & Kellermanns, F. W. (2007). Disentangling alliance management processes: Decision making, politicality, and alliance performance. Journal of Management Studies, 45, 530–560. [Google Scholar] [CrossRef]
- Weick, K. E. (2000). Emergent change as a universal in organizations. In M. Beer, & N. Nohria (Eds.), Breaking the code of change (pp. 223–241). Harvard Business School Press. [Google Scholar]
- Weick, K. E., & Quinn, R. E. (1999). Organizational change and development. Annual Review of Psychology, 50, 361–386. [Google Scholar] [CrossRef]
- Yukl, G. (2008). How leaders influence organizational effectiveness. Leadership Quarterly, 19(6), 708–722. [Google Scholar] [CrossRef]
- Yukl, G. (2009). Leading organizational learning: Reflections on theory and research. Leadership Quarterly, 20(1), 49–53. [Google Scholar] [CrossRef]
- Yukl, G. (2010). Leadership in organizations (7th ed.). global edition. Pearson Education. [Google Scholar]


Disclaimer/Publisher’s Note: The statements, opinions and data contained in all publications are solely those of the individual author(s) and contributor(s) and not of MDPI and/or the editor(s). MDPI and/or the editor(s) disclaim responsibility for any injury to people or property resulting from any ideas, methods, instructions or products referred to in the content. |
© 2025 by the authors. Licensee MDPI, Basel, Switzerland. This article is an open access article distributed under the terms and conditions of the Creative Commons Attribution (CC BY) license (https://creativecommons.org/licenses/by/4.0/).