Destination Image and Brand Value as Predictors of Tourist Behavior: Happiness as a Mediating Link

 and
and
Abstract
1. Introduction
2. Literature Review
2.1. Destination Image
2.2. Brand Value
2.3. Tourist Happiness
2.4. Intention to Revisit and Recommend
2.5. Hypothesis Development
3. Methodology
3.1. Research Design
3.2. Instruments
3.3. Sampling and Data Collection
3.4. Data Analysis
4. Results
4.1. Sample Characterization
4.2. Theoretical Model Analysis
4.3. Testing the Hypotheses
5. Discussions and Conclusions
6. Limitations and Future Research
Author Contributions
Funding
Institutional Review Board Statement
Informed Consent Statement
Data Availability Statement
Conflicts of Interest
References
- Abbasi, G. A., Kumaravelu, J., Goh, Y.-N., & Dara Singh, K. S. (2021). Understanding the intention to revisit a destination by expanding the theory of planned behaviour (TPB). Spanish Journal of Marketing—ESIC, 25(2), 282–311. [Google Scholar] [CrossRef]
- Akgün, A. E., Senturk, H. A., Keskin, H., & Onal, I. (2020). The relationships among nostalgic emotion, destination images and tourist behaviors: An empirical study of Istanbul. Journal of Destination Marketing and Management, 16, 100355. [Google Scholar] [CrossRef]
- Ampountolas, A. (2019). Peer-to-peer marketplaces: A study on consumer purchase behavior. Journal of Hospitality and Tourism Insights, 2(1), 37–54. [Google Scholar] [CrossRef]
- Anton, C., Camarero, C., & Laguna-Garcia, M. (2021). Culinary tourism experiences: The effect of iconic food on tourist intentions. Tourism Management Perspectives, 40, 100911. [Google Scholar] [CrossRef]
- Bagheri, F., Guerreiro, M., Pinto, P., & Ghaderi, Z. (2024). From tourist experience to satisfaction and loyalty: Exploring the role of a sense of well-being. Journal of Travel Research, 63(8), 1989–2004. [Google Scholar] [CrossRef]
- Bimonte, S., & Faralla, V. (2012). Tourist types and happiness a comparative study in Maremma, Italy. Annals of Tourism Research, 39(4), 1929–1950. [Google Scholar] [CrossRef]
- Bimonte, S., & Faralla, V. (2015). Happiness and outdoor vacations appreciative versus consumptive tourists. Journal of Travel Research, 54(2), 179–192. [Google Scholar] [CrossRef]
- Bose, S., Pradhan, S., Bashir, M., & Roy, S. K. (2022). Customer-based place brand equity and tourism: A regional identity perspective. Journal of Travel Research, 61(3), 511–527. [Google Scholar] [CrossRef]
- Byrne, B. M., & Byrne, B. M. (2013). Structural equation modeling with EQS (2nd ed.). Routledge. [Google Scholar] [CrossRef]
- Cham, T.-H., Cheah, J.-H., Ting, H., & Memon, M. A. (2022). Will destination image drive the intention to revisit and recommend? Empirical evidence from golf tourism. International Journal of Sports Marketing and Sponsorship, 23(2), 385–409. [Google Scholar] [CrossRef]
- Chan, A., Suryadipura, D., Kostini, N., & Miftahuddin, A. (2021). An integrative model of cognitive image and city brand equity. Geojournal of Tourism and Geosites, 35(2), 364–371. [Google Scholar] [CrossRef]
- Chan, W.-C., Wan Ibrahim, W. H., Lo, M.-C., Mohamad, A. A., Ramayah, T., & Chin, C.-H. (2022). Controllable drivers that influence tourists’ satisfaction and revisit intention to Semenggoh Nature Reserve: The moderating impact of destination image. Journal of Ecotourism, 21(2), 147–165. [Google Scholar] [CrossRef]
- Chang, W.-J. (2021). Experiential marketing, brand image and brand loyalty: A case study of Starbucks. British Food Journal, 123(1), 209–223. [Google Scholar] [CrossRef]
- Chen, C.-J., & Li, W.-C. (2020). A study on the hot spring leisure experience and happiness of Generation X and Generation Y in Taiwan. Asia Pacific Journal of Tourism Research, 25(1), 39–51. [Google Scholar] [CrossRef]
- Chen, X., Zhang, K., & Huang, Y. (2023). Effect of social loneliness on tourist happiness: A mediation analysis based on smartphone usage. Sustainability, 15(11), 8760. [Google Scholar] [CrossRef]
- Chi, N. T. K., & Pham, H. (2022). The moderating role of eco-destination image in the travel motivations and ecotourism intention nexus. Journal of Tourism Futures, 10, 317–333. [Google Scholar] [CrossRef]
- Collier, J. E. (2020). Applied structural equation modeling using AMOS; basic to advanced techniques. Routledge. [Google Scholar]
- Cruz-Tarrillo, J. J., Haro-Zea, K. L., & Tarqui, E. E. A. (2023). Personality and image as predictors of the intention to revisit and recommend tourist destinations. Innovative Marketing, 19(1), 175–185. [Google Scholar] [CrossRef]
- Cuesta-Valiño, P., Gutiérrez-Rodríguez, P., & Núnez-Barriopedro, E. (2022). The role of consumer happiness in brand loyalty: A model of the satisfaction and brand image in fashion. Corporate Governance, 22(3), 458–473. [Google Scholar] [CrossRef]
- Dam, S. M., & Dam, T. C. (2021). Relationships between service quality, brand image, customer satisfaction, and customer loyalty. Journal of Asian Finance, Economics and Business, 8(3), 585–593. [Google Scholar] [CrossRef]
- Fayzullaev, K., Cassel, S. H., & Brandt, D. (2021). Destination image in Uzbekistan–heritage of the Silk Road and nature experience as the core of an evolving Post Soviet identity. Service Industries Journal, 41(7–8), 446–461. [Google Scholar] [CrossRef]
- Galiano-Coronil, A., Blanco-Moreno, S., Tobar-Pesantez, L., & Gutiérrez-Montoya, G. (2023). Social media impact of tourism managers: A decision tree approach in happiness, social marketing and sustainability. Journal of Management Development, 42(6), 436–457. [Google Scholar] [CrossRef]
- Gholipour, H. F., Tajaddini, R., & Foroughi, B. (2022). International tourists’ spending on traveling inside a destination: Does local happiness matter? Current Issues in Tourism, 26, 2027–2043. [Google Scholar] [CrossRef]
- Godovykh, M., Ridderstaat, J., & Fyall, A. (2023). The well-being impacts of tourism: Long-term and short-term effects of tourism development on residents’ happiness. Tourism Economics, 29(1), 137–156. [Google Scholar] [CrossRef]
- Gong, T., & Yi, Y. (2018). The effect of service quality on customer satisfaction, loyalty, and happiness in five Asian countries. Psychology & Marketing, 35(6), 427–442. [Google Scholar] [CrossRef]
- Güçer, E., Bağ, C., & Altınay, M. (2017). Consumer behavior in the process of purchasing tourism product in social media. Journal of Business Research-Turk, 9(1), 381–402. [Google Scholar] [CrossRef]
- Hair, J. B., William, J. B., & Rolph, A. (2020). Multivariate data analysis (Vol. 12). Prentice Hall. [Google Scholar]
- Heydari Fard, M., Sanayei, A., & Ansari, A. (2021). Determinants of medical tourists’ revisit and recommend intention. International Journal of Hospitality and Tourism Administration, 22(4), 429–454. [Google Scholar] [CrossRef]
- Huang, Z., Huang, S., Yang, Y., Tang, Z., Yang, Y., & Zhou, Y. (2021). In pursuit of happiness: Impact of the happiness level of a destination country on Chinese tourists’ outbound travel choices. International Journal of Tourism Research, 23(5), 713–725. [Google Scholar] [CrossRef]
- Jawahar, D., & Muhammed, M. K. A. (2022). Product–place image and destination brand equity: Special reference to “Kerala is an ayurvedic destination”. Journal of Place Management and Development, 15(3), 248–263. [Google Scholar] [CrossRef]
- Kaur, S., & Kaur, M. (2020). Behavioral intentions of heritage tourists: Influential variables on recommendations to visit. Journal of Heritage Tourism, 15(5), 511–532. [Google Scholar] [CrossRef]
- Lacárcel, F. (2025). Digital technologies, sustainable lifestyle, and tourism: How digital nomads navigate global mobility? Sustainable Technology and Entrepreneurship, 4(2), 100096. [Google Scholar] [CrossRef]
- Lee, C.-C., Olasehinde-Williams, G., & Akadiri, S. S. (2021). Geopolitical risk and tourism: Evidence from dynamic heterogeneous panel models. International Journal of Tourism Research, 23(1), 26–38. [Google Scholar] [CrossRef]
- Lee, J., & Park, C. (2022). Customer engagement on social media, brand equity and financial performance: A comparison of the US and Korea. Asia Pacific Journal of Marketing and Logistics, 34(3), 454–474. [Google Scholar] [CrossRef]
- Li, F., Shang, Y., & Su, Q. (2023). The influence of immersion on tourists’ satisfaction via perceived attractiveness and happiness. Tourism Review, 78(1), 122–141. [Google Scholar] [CrossRef]
- Li, Y., He, Z., Li, Y., Huang, T., & Liu, Z. (2023). Keep it real: Assessing destination image congruence and its impact on tourist experience evaluations. Tourism Management, 97, 104736. [Google Scholar] [CrossRef]
- Liang, S.-H., & Lai, I. K. W. (2023). Tea tourism: Designation of origin brand image, destination image, and visit intention. Journal of Vacation Marketing, 29(3), 409–427. [Google Scholar] [CrossRef]
- Liang, X., & Xue, J. (2021). Mediating effect of destination image on the relationship between risk perception of smog and revisit intention: A case of Chengdu. Asia Pacific Journal of Tourism Research, 26(9), 1024–1037. [Google Scholar] [CrossRef]
- Lieven, T., & Hildebrand, C. (2016). The impact of brand gender on brand equity: Findings from a large-scale cross-cultural study in ten countries. International Marketing Review, 33(2), 178–195. [Google Scholar] [CrossRef]
- López-Sanz, J., Penelas-Leguía, A., & Cuesta-Valiño, P. (2021). Application of the multiple classification analysis for the study of the relationships between destination image, satisfaction and loyalty in rural tourism. Journal of Tourism and Heritage Research, 4(2), 247–260. [Google Scholar]
- Luvsandavaajav, O., Narantuya, G., Dalaibaatar, E., & Zoltan, R. (2022). A Longitudinal Study of Destination Image, Tourist Satisfaction, and Revisit Intention. Journal of Tourism and Services, 13(24), 128–149. [Google Scholar] [CrossRef]
- Majeed, S., Zhou, Z., & Kim, W. G. (2024). Destination brand image and destination brand choice in the context of health crisis: Scale development. Tourism and Hospitality Research, 24(1), 134–151. [Google Scholar] [CrossRef]
- Manhas, P., Manrai, L., & Manrai, A. (2016). Role of tourist destination development in building its brand image: A conceptual model. Journal of Economics, Finance and Administrative Science, 21(40), 25–29. [Google Scholar] [CrossRef]
- Manyangara, M. E., Makanyeza, C., & Muranda, Z. (2023). The effect of service quality on revisit intention: The mediating role of destination image. Cogent Business and Management, 10(3), 2250264. [Google Scholar] [CrossRef]
- Marques, C., Vinhas da Silva, R., & Antova, S. (2021). Image, satisfaction, destination and product post-visit behaviours: How do they relate in emerging destinations? Tourism Management, 85, 104293. [Google Scholar] [CrossRef]
- Mimaki, C. A., Darma, G. S., Widhiasthini, N. W., & Basmantra, I. N. (2022). Predicting post-COVID-19 tourist’s loyalty: Will they come back and recommend? International Journal of Tourism Policy, 12(1), 1–23. [Google Scholar] [CrossRef]
- Mohanan, P. (2024). Revitalizing ancient sites: Sustainable tourism strategies for preservation and community development. In Building community resiliency and sustainability with tourism development (pp. 171–195). IGI Global. [Google Scholar] [CrossRef]
- Moraga, E. T., Artigas, E. A. M., & Irigoyen, C. C. (2012). Desarrollo y propuesta de una escala para medir la imagen de los destinos turísticos (IMATUR). Revista Brasileira de Gestao de Negocios, 14(45), 400–418. [Google Scholar] [CrossRef]
- Nunes, S., Agúndez, A. D. M., da Fonseca, J. F., & Chemli, S. (2020). Impacts of positive images of tourism destination exhibited in a film or TV production on its brand equity: The case of Portuguese consumers’ perspective. Transnational Marketing Journal, 8(2), 271–295. [Google Scholar] [CrossRef]
- Oliveira, T., Araujo, B., & Tam, C. (2020). Why do people share their travel experiences on social media? Tourism Management, 78, 104041. [Google Scholar] [CrossRef]
- Peng, J., Yang, X., Fu, S., & Huan, T. (2023). Exploring the influence of tourists’ happiness on revisit intention in the context of Traditional Chinese Medicine cultural tourism. Tourism Management, 94, 104647. [Google Scholar] [CrossRef]
- Pinho, M., & Leal, F. (2024). AI-enhanced strategies to ensure new sustainable destination tourism trends among the 27 European Union member states. Sustainability, 16(22), 9844. [Google Scholar] [CrossRef]
- Primananda, P., Yasa, N., Sukaatmadja, I., & Setiawan, P. (2022). Trust as a mediating effect of social media marketing, experience, destination image on revisit intention in the COVID-19 era. International Journal of Data and Network Science, 6(2), 517–526. [Google Scholar] [CrossRef]
- Ragb, H., Mahrous, A. A., & Ghoneim, A. (2020). A proposed measurement scale for mixed-images destinations and its interrelationships with destination loyalty and travel experience. Tourism Management Perspectives, 35, 100677. [Google Scholar] [CrossRef]
- Rodrigues, S., Correia, R., Gonçalves, R., Branco, F., & Martins, J. (2023). Digital Marketing’s Impact on Rural Destinations’ Image, Intention to Visit, and Destination Sustainability. Sustainability, 15(3), 2683. [Google Scholar] [CrossRef]
- Satrya, I., Herdono, I., Sudiarta, I., Karya, D., & Cahyanto, I. (2024). Factors influencing revisit cycling tour in Bali, Indonesia: The role of tourist engagement, destination attribute, memorable tourist experience and environmental concern. International Journal of Sustainable Development and Planning, 19(8), 2861–2872. [Google Scholar] [CrossRef]
- Senese, A., Ahmad, A., Maugeri, M., & Diolaiuti, G. (2025). Assessing the carbon footprint of the 2024 Italian K2 expedition: A path towards sustainable high-altitude tourism. Sustainability, 17(1), 344. [Google Scholar] [CrossRef]
- Soliman, M. (2021). Extending the theory of planned behavior to predict tourism destination revisit intention. International Journal of Hospitality and Tourism Administration, 22(5), 524–549. [Google Scholar] [CrossRef]
- Tang, H., Wang, R., Jin, X., & Zhang, Z. (2022). The effects of motivation, destination image and satisfaction on rural tourism tourists’ willingness to revisit. Sustainability, 14(19), 11938. [Google Scholar] [CrossRef]
- Tasci, A. D. A. (2020). Exploring the analytics for linking consumer-based brand equity (CBBE) and financial-based brand equity (FBBE) of destination or place brands. Place Branding and Public Diplomacy, 16(1), 36–59. [Google Scholar] [CrossRef]
- Todd, L., Leask, A., & Ensor, J. (2017). Understanding primary stakeholders’ multiple roles in hallmark event tourism management. Tourism Management, 59, 494–509. [Google Scholar] [CrossRef]
- Tran, P. K. T., Nguyen, V. K., & Tran, V. T. (2021). Brand equity and customer satisfaction: A comparative analysis of international and domestic tourists in Vietnam. Journal of Product and Brand Management, 30(1), 180–194. [Google Scholar] [CrossRef]
- Vittersø, J., Prebensen, N. K., Hetland, A., & Dahl, T. (2017). The emotional traveler: Happiness and engagement as predictors of behavioral intentions among tourists in northern Norway. Advances in Hospitality and Leisure, 13, 3–16. [Google Scholar] [CrossRef]
- Wang, Y., & Guo, R. (2025). How does the metaverse tourism experience form tourists’ happiness: A mixed-methods study. Journal of Vacation Marketing. [Google Scholar] [CrossRef]
- Woyo, E., & Slabbert, E. (2023). Competitiveness factors influencing tourists’ intention to return and recommend: Evidence from a distressed destination. Development Southern Africa, 40(2), 243–258. [Google Scholar] [CrossRef]
- Xiao, X., Fang, C., Lin, H., & Chen, J. (2022). A framework for quantitative analysis and differentiated marketing of tourism destination image based on visual content of photos. Tourism Management, 93, 104585. [Google Scholar] [CrossRef]
- Zhang, Y., Yang, L., Jiang, L., Yang, Z., & Xu, H. (2024). Exploring the relationship between tourist involvement and the tourists’ authentic happiness from the perspective of constructive-developmental theory. Journal of Resources and Ecology, 15(3), 782–792. [Google Scholar] [CrossRef]


| Variables | Categories | F | % |
|---|---|---|---|
| Sex | Male | 206 | 48.5% |
| Female | 219 | 51.5% | |
| Level of education | Primary | 5 | 1.2% |
| Secondary | 53 | 12.5% | |
| University | 344 | 80.9% | |
| Postgraduate | 23 | 5.4% | |
| Type of tourist | Local | 127 | 29.9% |
| Regional | 135 | 31.8% | |
| National | 145 | 34.1% | |
| Foreign | 18 | 4.2% | |
| Family income level | <USD 263 | 141 | 33.2% |
| USD 264–$394 | 97 | 22.8% | |
| USD 395–526 | 60 | 14.1% | |
| PEN 527–657 | 44 | 10.4% | |
| >USD 657 | 83 | 19.5% | |
| Working condition | Dependent | 154 | 36.2% |
| Independent | 122 | 28.7% | |
| Unemployed | 9 | 2.1% | |
| Duration of the tourist trip | Student | 140 | 32.9% |
| <24 h | 182 | 42.8% | |
| Between 2 and 3 days | 134 | 31.5% | |
| >3 days | 109 | 25.6% | |
| Daily spending | <USD 14 | 168 | 39.5% |
| USD 15–27 | 130 | 30.6% | |
| USD 28–40 | 63 | 14.8% | |
| >USD 40 | 64 | 15.1% | |
| Who did you travel with? | Only me | 117 | 27.5% |
| With my partner | 79 | 18.6% | |
| With my friends | 93 | 21.9% | |
| With the family | 136 | 32.0% |
| Scales of Research | M | OF | α | ω | IM | VM | FT | IVV | GO |
|---|---|---|---|---|---|---|---|---|---|
| Destination image (DI) | 4.72 | 1.66 | 0.993 | 0.993 | - | ||||
| Brand value (BV) | 4.43 | 1.52 | 0.984 | 0.985 | 0.870 ** | - | |||
| Tourist happiness (TH) | 4.86 | 1.69 | 0.989 | 0.989 | 0.852 ** | 0.901 ** | - | ||
| Intention to revisit (IRV) | 4.99 | 1.78 | 0.979 | 0.979 | 0.789 ** | 0.821 ** | 0.900 ** | - | |
| Intention to recommend (IRM) | 4.99 | 1.85 | 0.981 | 0.981 | 0.764 ** | 0.799 ** | 0.866 ** | 0.866 ** | - |
| Adjustment Measures Absolute | Values Acceptable | Values of the Model |
|---|---|---|
| Chi-squared | - | 464,903 |
| p-value | <0.05 | 0.000 |
| GFI | ≥0.80 | 0.894 |
| AGFI | ≥0.80 | 0.863 |
| RMSEA | ≤0.08 | 0.072 |
| NFI | >0.90 | 0.968 |
| RFI | >0.90 | 0.962 |
| IFC | >0.90 | 0.977 |
| TLI | >0.90 | 0.974 |
| IFI | >0.90 | 0.978 |
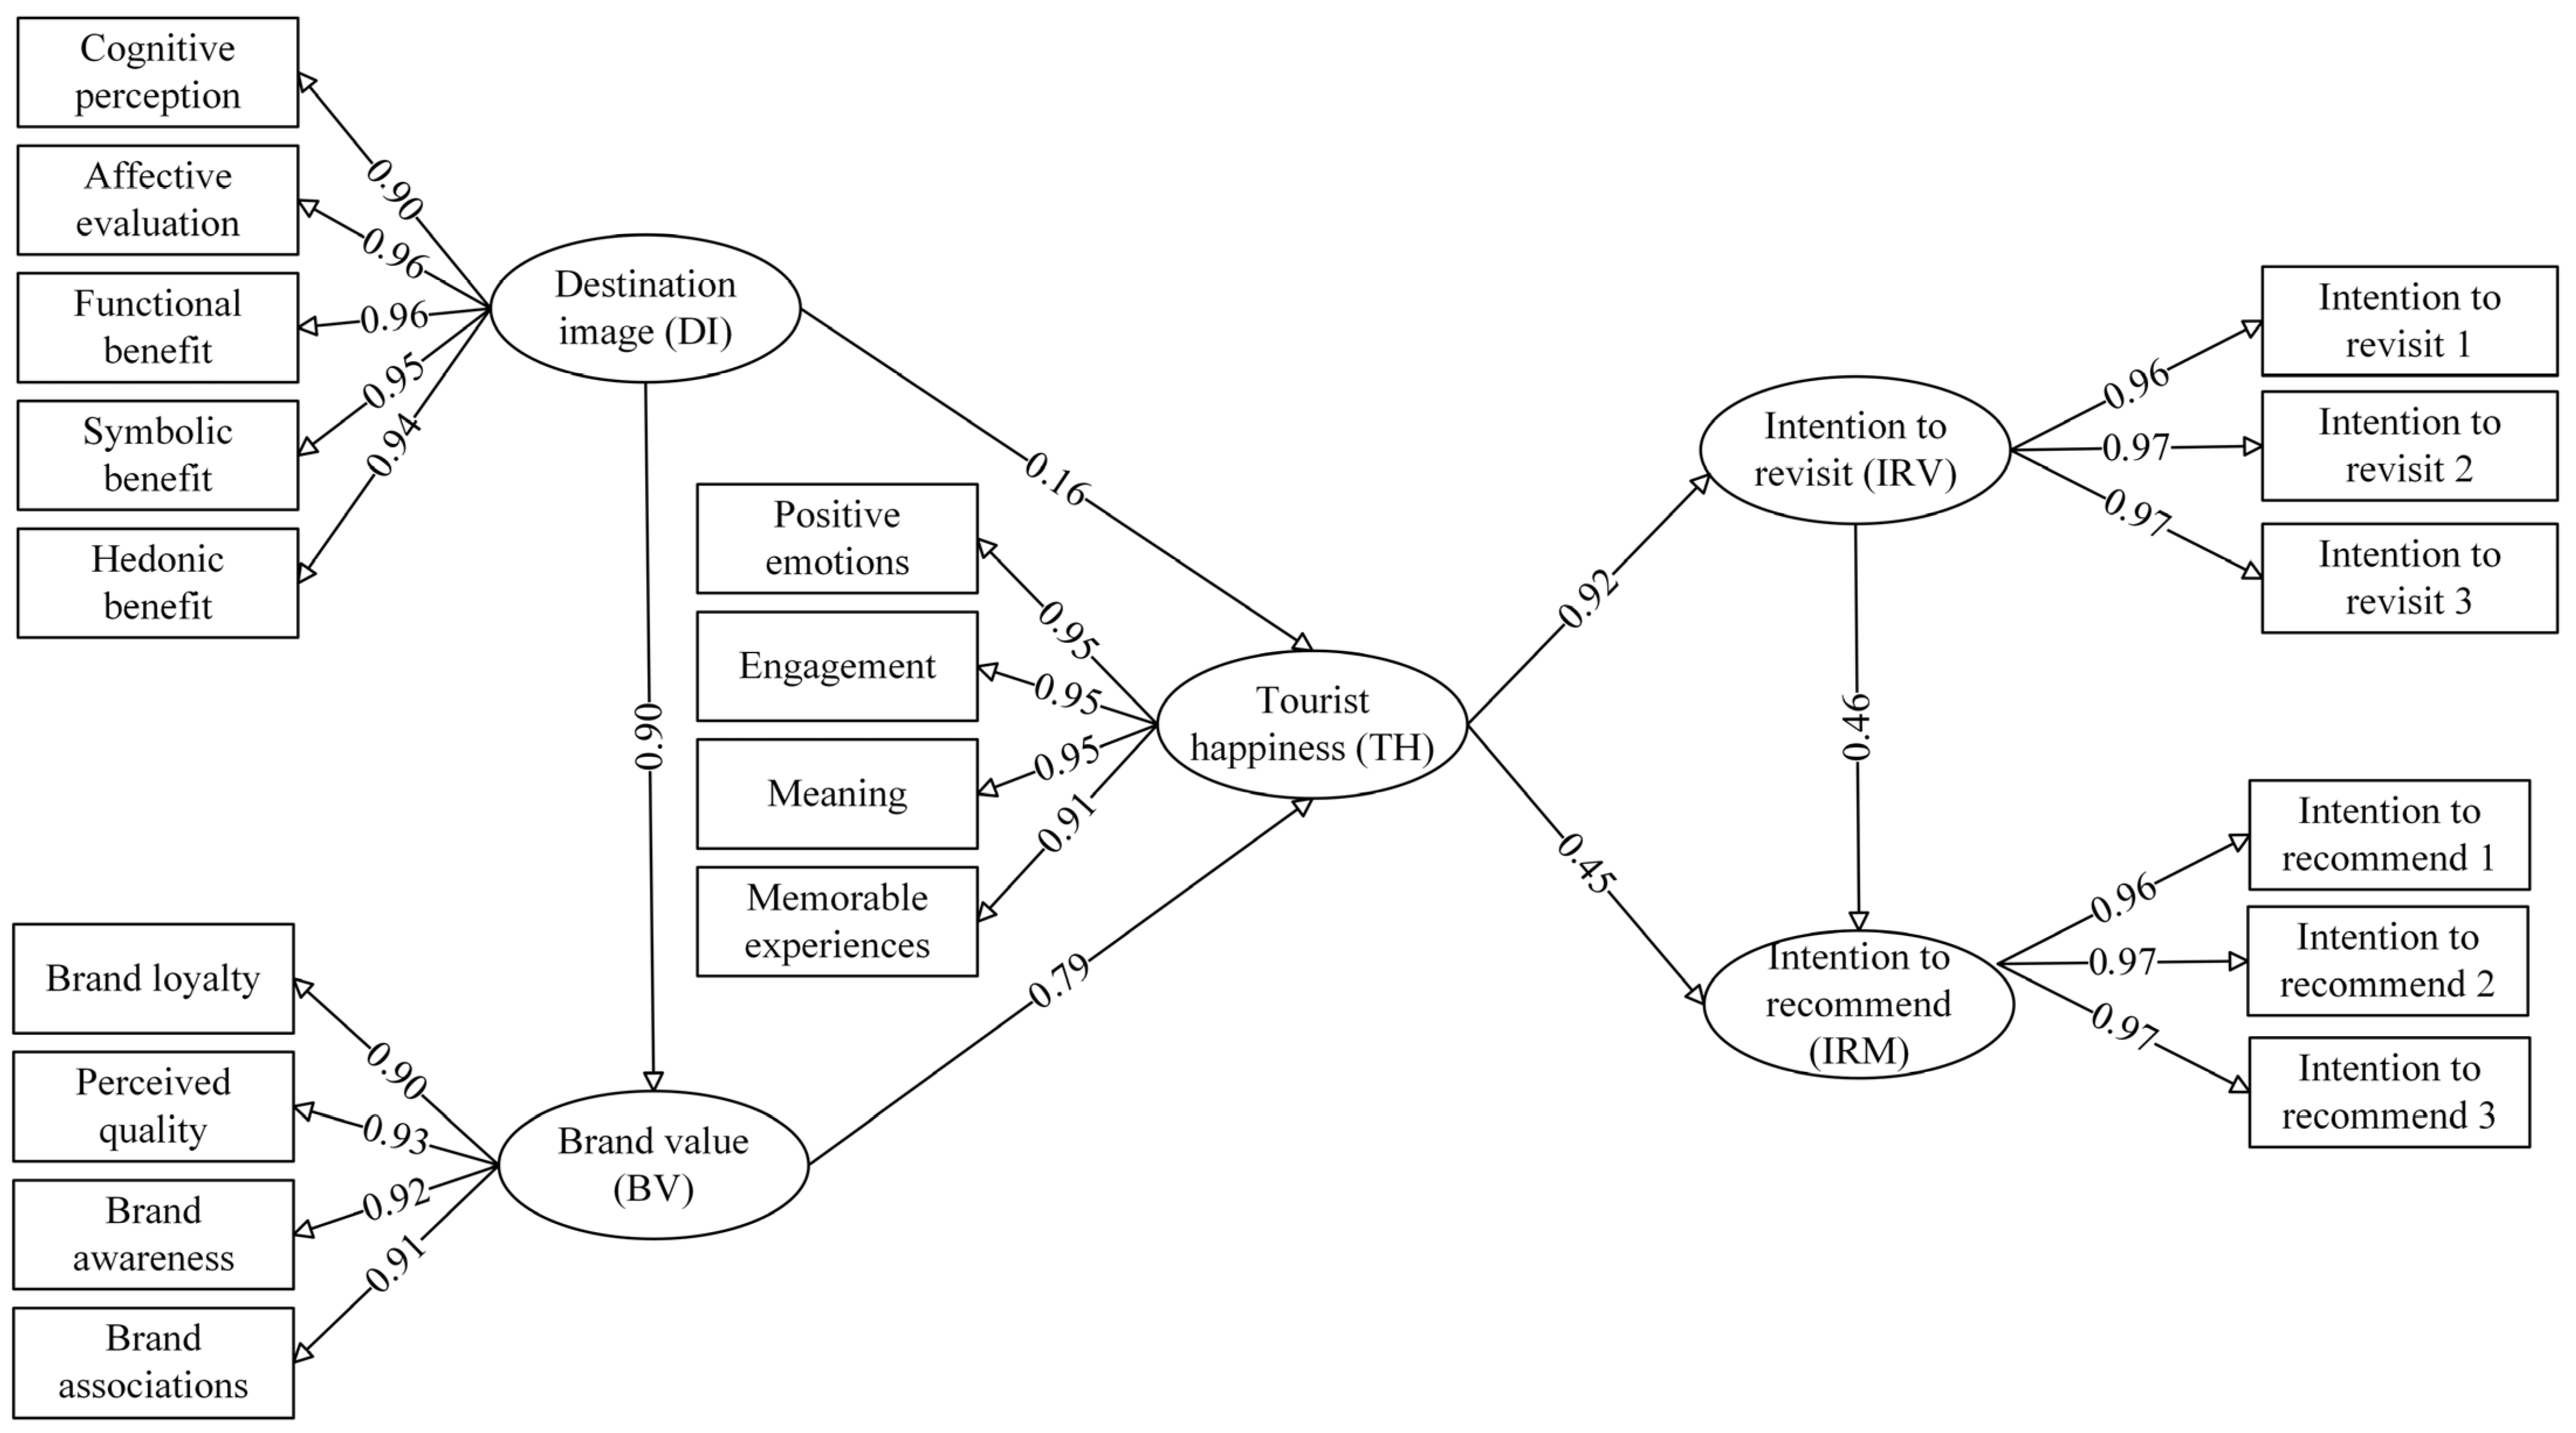
| Research Hypothesis Testing | Path Coefficient | p-Value | Decision | |||
|---|---|---|---|---|---|---|
| H1 | Image of the tourist destination | → | Brand value | 0.899 | *** | Accepted |
| H2 | Image of the tourist destination | → | Tourist happiness | 0.161 | 0.003 | Accepted |
| H3 | Brand value | → | Tourist happiness | 0.792 | *** | Accepted |
| H4 | Tourist happiness | → | Intention to revisit | 0.921 | *** | Accepted |
| H5 | Tourist happiness | → | Intention to recommend | 0.451 | *** | Accepted |
| H6 | Intention to revisit | → | Intention to recommend | 0.464 | *** | Accepted |
Disclaimer/Publisher’s Note: The statements, opinions and data contained in all publications are solely those of the individual author(s) and contributor(s) and not of MDPI and/or the editor(s). MDPI and/or the editor(s) disclaim responsibility for any injury to people or property resulting from any ideas, methods, instructions or products referred to in the content. |
© 2025 by the authors. Licensee MDPI, Basel, Switzerland. This article is an open access article distributed under the terms and conditions of the Creative Commons Attribution (CC BY) license (https://creativecommons.org/licenses/by/4.0/).
Share and Cite
Jimenez-García, D.; Espinoza Heredia, O.; Cruz Lizana, E.; Cruz-Tarrillo, J.J.; Millones-Liza, D.Y. Destination Image and Brand Value as Predictors of Tourist Behavior: Happiness as a Mediating Link. Adm. Sci. 2025, 15, 176. https://doi.org/10.3390/admsci15050176
Jimenez-García D, Espinoza Heredia O, Cruz Lizana E, Cruz-Tarrillo JJ, Millones-Liza DY. Destination Image and Brand Value as Predictors of Tourist Behavior: Happiness as a Mediating Link. Administrative Sciences. 2025; 15(5):176. https://doi.org/10.3390/admsci15050176
Chicago/Turabian StyleJimenez-García, Deyber, Ovet Espinoza Heredia, Eduar Cruz Lizana, Jose Joel Cruz-Tarrillo, and Dany Yudet Millones-Liza. 2025. "Destination Image and Brand Value as Predictors of Tourist Behavior: Happiness as a Mediating Link" Administrative Sciences 15, no. 5: 176. https://doi.org/10.3390/admsci15050176
APA StyleJimenez-García, D., Espinoza Heredia, O., Cruz Lizana, E., Cruz-Tarrillo, J. J., & Millones-Liza, D. Y. (2025). Destination Image and Brand Value as Predictors of Tourist Behavior: Happiness as a Mediating Link. Administrative Sciences, 15(5), 176. https://doi.org/10.3390/admsci15050176