1. Introduction
The release of non-financial information regarding the policies, results, and risks related to environmental, social, and governance (ESG) aspects that complement annual financial reports has become a necessity for all companies aiming to achieve positive performance indicators. Thus, not only the quantity of information matters, but also its quality (
Ioannou & Serafeim, 2019), resulting from the transparency of disclosures to stakeholders. Enhancing credibility in a company’s business model is supported by the communication of information regarding interest in the company’s environmental impact, as well as an analysis of the influence of external factors on the organization within the value creation process.
There must be connectivity between sustainability information and performance indicators that meets stakeholders’ requirements while ensuring high transparency in communications (
IFRS Sustainability, 2024). Companies are interested in reporting sustainability performance and choosing more sustainable business models, considering all the risks and opportunities they present. Taking into account the possibility of easier access to financing credits, knowing the requirements of partners throughout the value chain, securing the long-term future of the business by attracting new customers and investors, and the active involvement of stakeholders, it can be said that proactive acceptance of sustainability brings long-term benefits to any organization (
Accountancy Europe, 2024).
Given that Eurobarometer surveys conducted in December 2019 show that 94% of citizens from all member states of the European Union pay special attention to environmental protection, and in Romania, the survey (conducted by interviewing 1081 people) revealed that 87% of Romanians agree that environmental issues are very important, all organizations are interested in achieving financial performance in line with fulfilling sustainability requirements (
European Commission, 2023c).
Environmental protection aspects, as an important pillar of ESG (Environmental, Social, and Governance) issues, have come to the attention of companies as a factor influencing financial performance. According to Xue, the complex relationship between outcome-based environmental performance has implications for the adoption of managerial decisions in strategy and risk management, as well as in the development of environmental regulation policies (
Xue et al., 2020).
The company’s environmental performance considers the efforts it undertakes for the efficient and rational use of resources, reducing the impact of its activities on environmental objectives, and enhancing the quality of environmental management actions where the company operates. A study conducted by Ifada revealed that environmental performance has a significant positive effect on financial performance, resulting in organizations being more focused on environmental issues to strengthen their company’s profitability (
Ifada et al., 2021). Similarly, a study by Hanjani and Kusumadewi confirmed the existence of a positive relationship between environmental performance and financial performance, as well as between the actions of the Audit Committee, firm characteristics, ISO 14001 (
ISO, 2021) Certification (International standard for environmental management systems -EMS), and environmental performance (
Hanjani & Kusumadewi, 2023). Some studies have analyzed financial performance based on environmental issues (such as the effects of waste emissions, greenhouse gas reduction), with results varying according to the preferences of stakeholders. Thus, shareholders and investors focus on a company’s long-term financial performance, while consumers and business partners are not interested in short-term environmental management (
Iwata & Okada, 2011). Additionally, studies on the relationship between elements of corporate governance and financial and environmental performance suggest that these factors have a moderating effect on the relationship between financial and environmental performance (
Nguyen et al., 2021). Empirically, most studies have focused on the effects of various variables related to ESG issues, either taken together or combined in pairs, on a company’s financial performance. These studies have differently examined the relationship between sustainability and financial performance, most often considering financial performance as dependent variable, expressed through several profitability indicators. However, there are also studies that view environmental performance as a dependent variable in relation to predictors characterizing the governance structure. Based on the existing information in the specialized literature, as briefly presented above, the authors of this paper have identified a knowledge gap. Using diagnostic analysis (the evaluation grid method) to determine the non-financial (environmental) performance score brings added value and originality to our research. Environmental performance (environmental score) is less commonly used in the specialized literature as a dependent variable, and the analysis of the correlation between it and financial factors was less widely addressed during the pandemic period (2019–2021).
The present study effectively addresses the knowledge gap in the existing literature by offering comprehensive insights into both financial and non-financial indicators that clarify the relationship between financial and non-financial (environmental) performance.
Sustainability and environmental responsibility reporting has become a crucial topic in the context of international regulations and investor requirements. European directives, such as Directive 2014/95/EU (
European Union EUR-Lex, 2021) on non-financial reporting (NFRD) and EU Regulation 2022/2464 on corporate sustainability reporting (CSRD), have prompted companies in Romania to implement transparency practices when reporting their environmental impact (
Mihai & Aleca, 2023). According to a study conducted by Mihai and Aleca, while the industrial sector is more sensitive to reporting requirements and faces greater challenges (
Sierra-Garcia et al., 2018), research generally indicates that the industrial sector does not significantly influence corporate sustainability policies. This suggests that sustainability concerns are equally important for all companies. Aligning a sustainability strategy with a global business strategy and incorporating sustainability (non-financial) reporting requirements are key concerns for top companies in Romania (
Petrescu et al., 2020). The academic literature provides diverse perspectives on sustainability reporting implementation (
Pasko et al., 2021). On one hand, some authors argue that institutional pressures and legislative regulations are the primary drivers of adopting these practices (
Marinescu, 2020b), while others contend that internal motivations, such as business reputation advantages and access to sustainable financing, play a significant role (
Piciu, 2019). Government legislation, investor and stakeholder expectations, and voluntary international sustainability reporting initiatives have led to an increased demand for sustainability-related information (
Fleacă et al., 2023). The importance of sustainability reporting frameworks is also reflected in the standardized reporting of general sustainability aspects related to business models, particularly from the perspective of the GRI reporting framework (
Bunget et al., 2024). In Romania, the most frequently used frameworks are the GRI (Global Reporting Initiative) and EU standards (
EFRAG, 2023). By taking proactive measures, companies can turn ESG compliance from a regulatory burden into a strategic advantage in terms of enhancing sustainability. Studies show an increasing ESG commitment among large Romanian companies, but there are still significant areas that require improvement (
Dănilă & Nancu, 2023).
This study examines the relationship between environmental performance and financial performance using data from financial and sustainability reports of companies listed on the Bucharest Stock Exchange (BVB) and the listefirme.ro website. The analyzed period covers 2019 to 2021. Multiple regression analysis was used as a statistical method to evaluate the relationship between environmental performance and financial performance indicators, such as Return on Assets (ROA), Return on Equity (ROE), Solvency Ratio (SOLV), Asset Turnover Ratio (ATR), and Financial Leverage (DER), among others.
The purpose of the present paper is to calculate the environmental responsibility and performance of the companies included in the sample and examine the correlation between financial and non-financial performance (environmental performance).
In addition, the paper aims to answer research questions related to the categories of information included in sustainability reports, the performance indicators relevant to environmental performance, and the link between environmental policies and strategies and environmental performance.
Additionally, there is increased interest among the investigated firms to invest in retooling and modernization to achieve environmental objectives. There is also growing concern regarding the creation of environmental strategies. The present study’s findings are relevant to managers in Romania and beyond, providing them with the necessary framework to develop strategic plans for sustainable environmental strategies.
This paper includes five sections:
Section 2 presents a literature review and some preliminary data;
Section 3 presents the methods used, along with the research methodology, while
Section 4 highlights the main results;
Section 5 consists of discussions and conclusions. The final paragraph presents the limitations and further research.
3. Materials and Methods
This study relies on data collected from the Bucharest Stock Exchange website (
Bucharest Stock Exchange, 2022a), supplemented with data from website Romanian Companies (
Romanian Companies, 2020). Based on the general objective of the paper, we selected companies with at least 500 employees which were mandated to address environmental, social, and employee-related aspects, as well as human rights and anti-corruption measures in the administrator’s report when preparing financial statements (OMFP 3456/2018, point 8). For the financial year 2021, environmental reports had to address objectives such as climate change mitigation and adaptation to climate change (
Ministry of Public Finance, 2024), as mentioned in Article 9(a) and (b) of Regulation (EU) 2020/852 of the European Parliament and the Council.
The database was composed of 675 companies from Romania, which were analyzed according to the research questions of this paper. Companies that presented incomplete or missing information were eliminated. For the remaining 668 Romanian companies, observations were converted into financial and non-financial indicators, such as Turnover, Net profit, Debts, Fixed assets, Current assets, Equity, Employees, Total assets, for the 2019–2021 period. The establishment of these indicators was carried out using the SMART (
Smarters, 2025) principle. Also, their availability in the databases, their relevance to the objectives established in the paper, and their publication in the specified time interval were prerequisites. The indicators used are those used in the literature, with the addition of extra indicators; the justification for their choice was also the criteria they met in addition to the SMART criterion, namely, applicability in all sectors of activity, transparency, their independent verifiability, their correspondence with the objectives pursued, and their compatibility with the specifics of the company. The companies are distributed by activity sectors as follows: Services (including a small number in financial services)—253 companies (37.48%); Production (Manufacturing and Industrial)—248 companies (36.47%); Trade—86 companies (12.74%); Transportation—42 companies (6.22%); Energy/Utilities—39 companies (5.78%); and Agriculture—7 companies (1.04%). This distribution demonstrates that the sample included diverse industries, with a balanced representation of manufacturing and service-oriented businesses. Financial and insurance companies represented only a small fraction of the service sector and did not significantly influence our findings.
By capturing a broad range of industries, the sample ensured that the insights derived from the analysis were not confined to a single sector but reflected cross-industry trends. However, we acknowledge that sectoral differences may have influenced specific outcomes, and we now explicitly discuss these implications in the revised manuscript.
The purpose of the chosen methodology is two-fold. On one hand, we sought to fit a statistical (linear regression) model that contained financial indicators as regressors and a score obtained from the non-financial indicators as a dependent variable. On the other hand, we attempted to explain the relationship between financial performance indicators and non-financial performance score (environmental performance).
To determine the environmental score, a diagnostic analysis method was used, specifically, the evaluation grid method. This involves:
Setting up the analysis criteria and assigning grades between 1 and 5 in order to assess the state or gradual change of the procedural components;
The allotment of importance coefficients for each criterion in conformity to its position in the analysis grid;
Rating the generic state of the component as an average score
where n
i is the grade awarded to each component and p
i is the importance coefficient (
Achim & Borlea, 2009).
The criteria analyzed in each environmental report and the corresponding importance coefficient for each can be found in
Table 1.
The conducted research used Environmental Performance (EP) as the main dependent variable and employed the content analysis method to measure EP, taking into account studies such as those of
Ntim et al. (
2013) and
Ntim and Soobaroyen (
2013).
Every effort was made to ensure that EP was a valid and reliable measure of environmental performance by reiterating the coding process three times.
In the first coding stage, two independent coders computed the environmental performance for an initial sample of 50 companies and then analyzed and discussed the criteria used by the scoring method and the allocated importance coefficients (
Table 1).
In the second stage, the two coders eliminated inconsistencies from the coding process.
In the final coding round, following
Krippendorff’s (
2004) recommendations, another 50 companies were coded by two independent coders and a new independent coder with experience in using content analysis and reading financial and non-financial reports.
No inconsistencies or mistakes were identified; therefore, the EP was considered as a valid and reliable measure reflecting the environmental performance reported by companies in Romania.
Based on the specialized literature and the coding process using the scoring method, EP included an analysis based on ten analysis criteria (
Table 1). Each analysis criterion was rated between 1–5 based on the qualitative or quantitative reporting of environmental performance in the sample companies’ annual and corporate social responsibility reports (
Tîrnoveanu, 2018), and then the final EP value was determined. The score varied between each element due to differences in quantitative information. As a result, the optimal score was five and expressed a measure for EP (
Nguyen et al., 2021).
After all these coding and pretesting stages, the authors created a database comprising 668 companies for the three analyzed years. Thus, 2004 valid observations emerged.
To understand the contribution of each financial indicator (or predictor) to the non-financial indicators combined to form the environmental performance score (EP), an economic explanation of these indicators is provided.
Return on Assets (ROA) refers to the efficiency of capital allocated in the total assets (fixed assets and current assets) of the company and reflects the company’s profitability relative to its total assets. The calculation method of this indicator did not consider the sources of capital (equity or borrowed) and thus did not take into account the relevant financing policy (
Țilică & Ciobanu, 2019).
Return on Equity (ROE) is a financial performance metric that highlights a company’s ability to generate profit using its available equity. Since the difference between the value of total assets and liabilities represents equity, ROE signifies the profitability of net assets. Investors use ROE to assess whether their investment is profitable or not (
Robu et al., 2014).
Financial Leverage (DER) signifies the degree of total indebtedness of a company relative to its equity. If the indicated value is greater than two, it reflects over-indebtedness of the company due to its use of external financing sources much more than internal (own) sources.
The Solvency Ratio (SOLV), determined by dividing total assets by total liabilities, should present a value larger than 0.3. A value below 0.3 indicates significant prudence from creditors, with the company’s condition being semi-bankrupt.
The Asset Turnover Ratio (ATR), calculated by comparing total revenues to the total value of assets, signifies the efficiency in utilizing the company’s assets (
Niculescu, 2003). A company with a high asset turnover ratio indicates high operational efficiency compared to its competition.
A lower ATR signifies a company’s potential inefficiency in leveraging its assets to generate revenue. It is crucial to acknowledge that the ATR can exhibit substantial variability across different industries. For example, retail businesses typically possess smaller asset bases yet achieve higher sales volumes, resulting in an elevated ATR. In manufacturing or construction enterprises, the value of assets is high, and they record much lower turnover.
The analyzed database included companies from various industries, and the average recorded for this indicator was 3.24 (in the retail sector, a ratio of 2.5 or higher is considered good) (
GoCardless, 2022).
Labor Productivity (LP) is a dynamic economic indicator reflecting the efficiency with which labor is utilized. The extension of labor productivity hinges on three primary factors: the accumulation and investment in physical capital, the advent of new technologies, and the development of human capital.
Capital Intensity (CAP) signifies the large capital input invested in a business process across different industries. The need for investments in fixed assets (land, buildings, installations, and equipment) is higher in special activities (oil extraction, chemical and oil plants, aircraft production, etc.). Industries requiring large capital investments are recognized as capital-intensive businesses.
The Equity Multiplier (EQM) represents the quantitative relation between a company’s total assets and its equity, reflecting the portion of the company’s assets financed by equity. An elevated ratio denotes increased financial leverage (total debt to equity), whereas a diminished ratio signifies reduced financial leverage.
The performance indicators (model variables) ROA, ROE, DER, SOLV, ATR, LP, CAP, and EQM were determined by using simple indicators (Turnover, Net Profit, Debt, Fixed Assets, Current Assets, Equity, Employees and Total Assets).
The initial hypothesized model chosen for the conducted regression analysis is:
The variables are described in
Table 2.
The following methods were employed: coefficient of variation analysis [cv], t-tests on the Beta (b
i) coefficients of the regression, coefficient of variation R Squared, F test on the set of the ten aforementioned regressors, Tolerance Analysis for identification of multicollinearity, forward variable selection, backward variable selection, as well as the Durbin Watson test (
Bobbit, 2024).
4. Results
The study results indicated that the fit of the linear regression model with EP as a response variable and the ten indicators (turnover, number of employees, ROA, ROE, DER, CAP, LP, SOLV, ATR, and FA) as explanatory variables was good (α = 0.01% and R = 0.21). This implies that the variability in the values of EP could be partially explained by the variability in the values of any of the ten indicators. Moreover, the findings of the study indicated a significant positive correlation between turnover and environmental performance, suggesting that increased turnover corresponds with higher environmental performance values.
For the application of the Durbin Watson Test, the tabulated values were d1 = 1.891 and d2 = 1.901 for the significance level α = 1%, and dcal = 0.75, so dcal < d1, resulting in the declining of the null hypothesis of residue independence, i.e., the errors exhibited autocorrelation.
According to the descriptive statistics (
Table 3), there was a moderate variation in the score for the environmental performance (EP) indicator [10% < cv < 20%] and a high variation [cv > 20%] for the indicator’s turnover, number of employees, total assets, ROA, ROE, DER, CAP, EQM, LP, SOLV, ATR, and FA.
The descriptive statistics revealed several key characteristics of the dataset: Outliers and Extreme Values. Some variables exhibited a wide range and extreme values, particularly ROE (range: 340, minimum: −280, maximum: 60), DER (range: 3556, minimum: −251, maximum: 3306), and EQM (range: 3561, minimum: −280, maximum: 3281).
These extreme values suggest potential outliers that could have influenced regression estimates and require appropriate treatment.
Skewed Distributions: Several financial variables, such as ST (Short-term liabilities), TA (Total Assets), and LP (Liquidity Position), exhibited high standard deviations relative to their means. This suggests a right-skewed distribution, likely driven by a few large firms.
Negative Values: Variables like ROA, ROE, FA, and CAP included negative values, which may indicate financial distress or specific accounting treatments in certain firms. These values were carefully considered in our model specification to ensure that they did not introduce unintended biases.
Economic Implications: The solvency ratio (SOLV), with a maximum value of 122 and a mean of 3.22, suggests that while most firms maintained reasonable solvency, a few exhibited extremely high values, likely distorting the distribution. Similarly, the ATR (Asset Turnover Ratio) had a mean of 1.86 but reached a maximum of 13, implying variability in operational efficiency among firms.
To mitigate the potential impact of extreme values, we conducted further analyses by testing different thresholds for outlier exclusion. Additionally, we assessed model robustness until we reached the final regression model.
An important statistical indicator of interdependencies is the coefficient of variation (cv), proposed by K. Pearson. To study the potential associations among the economic-financial indicators, a correlation matrix was calculated (
Table 4).
Pearson’s coefficient of variation assumes that the data are measured on a ratio scale with a meaningful zero point and that the underlying distribution is approximately normal when making inferential comparisons. However, in this analysis, model selection was employed to determine the most relevant regressors, ultimately defining the threshold for inclusion. At this stage, the primary purpose of the correlation table was to serve as an initial diagnostic tool for identifying potential collinearity among explanatory variables, rather than to assess the strength of individual relationships.
Upon examination of the correlation matrix, it was evident that there were statistically significant correlations among the variables studied, both positive and negative, as follows:
EP was positively correlated with ST (sales turnover) (r = 0.16 ***), NoE (number of employees) (r = 0.09 ***), LP (labor productivity) (r = 0.07 ***), FA (firm age) (r = 0.07 ***) and negatively with: ATR (r = −0.09 ***);
Sales turnover (ST) was positively correlated with Number of employees, Total assets (TA), LP (correlation coefficients range between 0.24 and 0.44);
Number of employees was correlated with Total assets, ROA, LP and ATR, exhibiting both positive and negative associations;
TA (Total assets) was correlated with LP, SOLV, ATR, involving positive as well as negative interconnections;
ROA was correlated with ROE, CAP, and ATR, having bidirectional correlations;
ROE is correlated with DER and EQM (very strong negative correlations);
DER was positively correlated with EQM, indicating a strong straight connection between these two variables, implying a strong linear dependence;
SOLV was negatively correlated with ATR.
The correlation matrix suggested high collinearity between EQM and DER and between EQM and ROE. Therefore, we eliminated the regressor EQM (Equity Multiplier) in the regression model, retaining DER and ROE to obtain:
For the aforementioned equation, we then tested the analysis of variance of the response EP (
Table 5).
The F-statistic (8.857) and the very low p-value (<0.001) suggested that the regression model was statistically significant. This means that the independent variables collectively explained a significant portion of the variance in the dependent variable.
The regression coefficient estimation is shown in
Table 6.
The magnitude of the standardized coefficients reflects the importance of the independent variables in predicting the EP indicator. The larger the absolute value of the Beta coefficient, the stronger the effect of the corresponding independent variable on the dependent variable, while a positive Beta suggests a direct relationship and a negative Beta indicates an inverse relationship. In this case, ST is the most influential variable, followed by ATR (in the negative direction) with CAP having the least negative impact on EP.
The multiple correlation coefficient (R) (
Table 7) signifies the extent of association between the dependent variable, environmental performance (EP), and the array of independent variables, with a recorded value of 0.216. An R value near 0 denotes an insignificant regression. Given that R often exaggerates the association between the variables, the more reliable metric is the coefficient of determination (R² = 0.047), which represents the square of the multiple correlation coefficient. For this model, 4.7% of the variance in EP could be explained by the independent variables (FA, CAP, NoE, DER, SOLV, LP, ROA, ATR, TA, ST, ROE). R
2 is equivalent to the F-test when it concludes whether the model is significant. R2 shows, however, the proportion of explained variance of the full model, which cannot be concluded from the t-tests for the regressors.
From the analysis of the regression coefficients (
Table 6) related to the model, it can be observed that there were only five variables with a statistically significant influence, specifically, SOLV, FA and TA, ATR and Turnover on environmental performance (EP). Hence, we applied the forward selection method to identify and validate the previous results.
Consequently, the relevant information was consolidated within multiple correlation coefficient and Durbin-Watson test values (
Table 8), F-test (
Table 9)
, regression coefficients, and collinearity statistics (
Table 10).
The coefficient of determination (R²) was then 0.044, so that 4.4% of the variance in EP could be explained by the five independent variables (ST, ATR, FA, SOLV, TA).
Corresponding to F-test, the linear relationship between the five variables and EP was statistically significant. The tabular value F0.01; 5; 1993 = 2.37 was below the F value calculated based on empirical data, Fcal = 18.306, thus supporting the hypothesis that the linear regression between EP, ST, TA, SOLV, ATR, and FA was a good fit.
The matrix helped us to understand which variables significantly impacted the dependent variable and assesses the presence of multicollinearity.
The ST variable showed the highest standardized beta (0.184), alongside a t-value of 7.556, with significance lower than 0.001 indicating a significant positive relationship with the dependent variable EP. Meanwhile VIF values were below 10, displaying no severe multicollinearity.
Regarding the linearity hypothesis, the relationships between the explanatory variables and the response variable were examined by plotting the unstandardized residuals against each explanatory variable. The resulting two-dimensional plots (
Figure 1) suggested that the relationships exhibited linearity, supporting the appropriateness of our analytical approach.
A scatter plot of residuals (obtained after fitting the identified regression model) against each explanatory variable showed that the linear assumption was correct. In these figures, we noticed that the residuals were symmetrically distributed around zero over the range of the explanatory variable in the discussion (x axis).
The correlations between Sales turnover and EP and Firm age and EP were positive, meaning that a high turnover or age of the company was associated with a high EP value. Since the correlations between ST/FA and EP were statistically significant, increasing the turnover value or the age also increased the EP value, considering that all other variables remained unchanged. The correlations between SOLV/ATR/TA and EP were negative, meaning low values of these variables corresponded to high EP values, when all the other variables remained unchanged. So, decreasing solvency or assets turnover or total assets values increased EP values.
To test the linear relationship between each explanatory variable and the response variable (EP), the t-test was applied to each regression coefficient, demonstrating whether a linear relationship existed between the variables (in this case, ST, TA, SOLV, ATR, FA, and EP). Therefore, it was applied five times, once for each regression coefficient. The F-test in
Table 9 combines these five tests into one, testing all five explanatory variables simultaneously to determine if at least one of them is not zero. The parameters in the preceding equation were estimated utilizing the least squares method.
Through the above regression equation, we aimed to see how non-financial and financial factors (ST, TA, SOLV, ATR, FA) influenced environmental performance (EP). This means that we were investigating the relationship among the five variables, i.e., turnover, number of employees, SOLV, ATR, FA, called explanatory variables, and EP, called the explained variable.
In conclusion, according to the F-test (
Table 9), the regression equation was statistically significant at the α = 0.01% level. The relationship among EP and the five variables (both non-financial and financial) could be assumed to be linear, as described by Equation (3).
The multiple correlation coefficient R (R = 0.209) was significant. The relationship between the five variables and environmental performance (EP) was robust, as indicated by the multiple correlation coefficient R (R = 0.209). The total coefficient of determination D = 0.04% [D = R² × 100 = 4.4%], which means that the variation in EP values between 2.0 and 4.65 was influenced by the five variables studied to the extent of 4.4%.
Collinearity denotes a significant correlation between the independent variables. In such cases, tolerance statistics are computed by solely considering the independent variables, excluding the dependent variable from the model. This leads to multicollinearity, where including one variable from the group in the model renders the remaining variables in the group insignificant. Simultaneously, there is an overestimation of the coefficient of determination and the dispersions of the estimated coefficients, which can distort the model interpretation and widen confidence intervals. Thus, there were two aspects to consider: determining multicollinearity and how to address multicollinearity if it existed (
Table 10 Collinearity Statistics)
In
Table 10, we show the standardized regression coefficients for each independent variable (Beta) and Tolerance for each variable x
i. A low tolerance value (ranging from 0 to 1) reflects a coefficient of determination close to 1, indicating a strong linear relationship between xi and the other independent variables. According to the tolerance values, multicollinearity was not indicated.
The variance inflation factor (VIF) measures the extent of multicollinearity. If the VIF value is below 0.2 or higher than 10, then multicollinearity is troublesome.
It was observed that VIF ⸦ (0.2; 10) as it ranged between 1.00 and 1.269; thus, the absence of multicollinearity implied that there was no significant correlation between the variables.
The Durbin-Watson test was applied for the five variables as well (
Table 8). The phenomenon of autocorrelation distorts not only the estimators—the partial regression coefficients—but also their variances, with unfavorable implications for accepting or rejecting a null hypothesis (H
0).
Thus, for a number of observations n = 2004 and a number
p = 5 of independent variables (non-financial and financial indicators), the tabulated values for d were dL = 1.891 and dU = 1.901 at a significance level α = 1% according to the Durbin-Watson significance table (
Real Statistics Using Excel, 2023). The calculated d value dcal = 0.75 was less than d1, which means the hypothesis of residual independence could be rejected. Thus, the null hypothesis H
0 was rejected, indicating that errors exhibited autocorrelation. This case is common in situations involving time series data, such as the analyzed database.
We may therefore conclude that there were statistically significant positive correlations between sales turnover (ST) and environmental performance (EP), as well as between firm age (FA) and EP.
5. Discussion
Environmental Social Governance (ESG) is a phenomenon that has become global in contemporary times. Consequently, the inclusion of sustainability regulations and standards has become necessary. Building on this idea and analyzing sustainable reporting and environmental responsibility, a case study was developed for companies operating in Romania.
The relationship between environmental performance and financial performance, widely debated in the literature, does not always show the same influence, with existing studies often reaching contradictory conclusions. Some research highlights a positive impact of sustainable practices on firms’ profitability (
Pereira et al., 2023;
Petera et al., 2021;
Junquera & Barba-Sánchez, 2018), while others suggest that green investments can generate high costs, affecting short-term profitability (
Fazli et al., 2023;
Y. S. Chen et al., 2016;
Y. Chen et al., 2021). In this context, the present study fills an important gap in the literature by analyzing not only the correlation among these variables but also the relationship between environmental financial performance and economic performance, expressed through ST, TA, SOLV, and ATR. The present research makes a theoretical contribution by expanding the conceptual framework regarding the relationship between environmental and financial performance by including multiple financial and performance indicators in the analysis.
The study provides statistical evidence on the impact of environmental performance on financial performance, using an extensive sample of companies from various economic sectors. The obtained results can guide managerial decisions regarding resource allocation for sustainability policies, demonstrating that well-managed ecological strategies can bring about significant economic benefits (
Nishitani et al., 2017;
Narula et al., 2023;
Soedjatmiko et al., 2021). Therefore, in the long run, increasing environmental protection and improving environmental performance positively influence a company’s financial performance (
Song et al., 2017;
Soedjatmiko et al., 2021;
S. Zhang et al., 2019).
Empirically, existing studies provide mixed results. For example, a study conducted by Florina-Mădălina Mocanu investigated the relationship between financial performance and corporate governance practices in Romanian banking companies, highlighting the importance of corporate governance in achieving financial performance (
Mocanu & Lungu, 2021). The impact of corporate governance practices on financial performance is also revealed by other studies (
Nguyen et al., 2021;
Ong et al., 2019;
Y. Xu & Zhu, 2024;
Nandini et al., 2022). The findings of this study have significant implications. Scientifically, they contribute to a deeper understanding of how environmental initiatives can influence financial performance, providing a foundation for future research. Practically, the results can serve as a basis for developing corporate policies and business strategies, encouraging companies to adopt sustainable practices that not only protect the environment but also enhance financial performance.
In conclusion, this research aims to clarify the complex relationship between environmental and financial performance, offering valuable insights for both the academic community and practitioners.
The study was designed as observational research aimed at identifying significant correlations among variables, which can provide valuable insights into underlying patterns and associations. Although no causal relationships were established, these findings serve as a foundation for future research that may employ experimental or longitudinal designs to investigate causality more rigorously. Establishing cause-and-effect relationships would require additional methodological approaches, such as controlled experiments or instrumental variable techniques.
Machine Learning Models in general, and Linear Regression in particular, are all designed to provide accurate results (when statistical significance is present) both for observational and experimental settings. In this paper, an observational study was pursued. This means that association results were always declared and, in no case, causality was analyzed. This was because Pearson correlation is suitable for one explanatory variable, while a group of five explanatory variables was deemed crucial in our analysis. Furthermore, correlation-only analysis is not suitable for model selection. In conclusion, the use of a linear regression model with very strong model selection technique, under correct linear assumptions, was the key to the results of the paper.
Sustainability practices are becoming increasingly important on a global scale, but there are significant differences between trends specific to Romania and international trends. Analyzing these aspects in relation to applicable strategies for Romanian companies revealed that, in Romania, the implementation of sustainability standards is progressing slowly in most areas. Regarding renewable energy, global trends show a rapid increase in investments in solar and wind energy (
Kurbatova & Perederii, 2020;
X. Xu et al., 2019;
Lanshina & Barinova, 2017;
Nejat et al., 2013;
J. Zhao et al., 2022), whereas in Romania, development in these categories is slow but growing (
Dumitrașcu et al., 2019;
Raboaca et al., 2020;
Aceleanu et al., 2018). The same applies to the implementation of circular economy actions (
Piontek, 2019;
Holwerda et al., 2024;
Topliceanu et al., 2023;
Delcea et al., 2024). Regarding ESG reporting, it is mandatory at the global level (EU and USA), while in Romania, implementation is occurring gradually and unevenly. In two other categories of sustainability practices, i.e., sustainable transport and social responsibility, initiatives in Romania are limited, especially among SMEs. For Romanian companies to remain competitive and leverage global trends, they should adopt strategies aimed at optimizing energy consumption through investments in modernizing equipment for energy efficiency and installing solar panels. Additionally, they should develop circular economy practices, such as collaborating with suppliers using recycled materials and establishing product return and reuse schemes. In terms of alignment with ESG standards, companies should focus on publishing sustainability reports (even voluntarily for SMEs) and integrating clear corporate governance and ethics policies (
Bunget et al., 2024;
Dănilă & Nancu, 2023;
Fleacă et al., 2023). Furthermore, increasing social responsibility through CSR projects in education and environmental protection, as well as partnerships with NGOs and local communities, is encouraged (
Marinescu, 2020b;
Petrescu et al., 2020;
Mihai & Aleca, 2023).
In conclusion, while Romania is gradually adopting sustainable practices, the gap compared to global trends can be reduced through proactive strategies. Romanian companies that embrace sustainability will gain a competitive advantage and enjoy easier access to green financing and international markets.
6. Conclusions
This paper aimed to identify and analyze the relationship between firms’ financial performance and non-financial performance (environmental performance) by employing a statistical model that adeptly integrates both financial and non-financial indicators. The study’s contribution lies in correlating and providing a comprehensive overview of the analyzed relationship between financial and environmental performance, notably through the application of econometric models to substantiate the findings.
To achieve the paper’s goal, a score for the dependent variable Environmental performance (criterion variable) EP was calculated and included in the model as dependent variable, along with the following financial indicators: ROA, ROE, Debt ratio, Indebtedness Degree, Capital intensity, Equity multiplier, Labor productivity (independent or predictor variables).
A key observation of this study was the statistically significant positive correlations between sales turnover and EP and firm age and EP, meaning that higher turnover or higher firm age is associated with to higher EP values. This may support the idea that as companies grow and develop, they can become more efficient in terms of resource use and innovate to reduce waste and emissions. Companies with a long history are often more aware of the importance of their reputation. They may adopt better environmental practices to protect their image and demonstrate social responsibility. Companies with higher sales are often under greater scrutiny and may be more motivated to comply with environmental regulations, leading to better environmental performance.
In summary, our analysis aimed to identify the financial indicators that significantly contribute to the environmental performance of companies subject to sustainability regulations. Thus, a model was constructed from the independent variables (predictors) that could best estimate the dependent variable (EP). In the description provided, this model was expressed by Formula (3). Collinearity among the independent variables was checked by determining tolerance statistics. In the determined model, it was acknowledged that all independent variables possessed sufficient accuracy in explaining the dependent variable. A detailed explanation of the influence of each financial indicator in the model on environmental performance (EP) supported the construction of the analysis model with the following indicators: Sales turnover (ST), Total assets (TA), Solvency ratio (SOLV), Asset turnover ratio (ATR), Firm age (FA).
The relation between SOLV and EP was negative, indicating that lower solvency corresponded to higher EP values, implying that decreasing solvency values might increase EP values. Considering that the solvency indicator refers to covering total debts from a company’s assets, this negative relationship can be explained by the company’s interest in spending more on retooling and modernization to achieve environmental goals (
W. Zhang et al., 2021). Increasing concern for creating environmental strategies to improve climate conditions, reduce emissions, recycle waste, etc., leads to securing funding sources from investors or creditors. Under these circumstances, companies may register high debts in the short term. This is understandable for the analyzed period, given that the European Directive on sustainable reporting standards (CSRD) mandates their application starting from the 2024 fiscal year for entities with over 500 employees already applying non-financial reporting (NFRD).
The relation between ATR and EP was negative, meaning that lower ATR values correspond to higher EP values, indicating that decreasing ATR values might increase EP values. Similarly, the influence of the Asset Turnover Ratio (ATR) may be explained by investments in green technologies, which are more expensive and have a long lifespan. These investments increase the total value of assets but do not immediately generate additional revenue (
Gu, 2021;
Nishitani et al., 2017), thereby reducing asset turnover. Also, higher operational costs may occur when implementing environmental protection measures, like using recycled materials or less polluting production processes.
From the regression model, one can conclude that five out of the twelve financial indicators included in the model have a statistically significant influence on environmental performance (EP), namely SOLV, FA, TA (significant), ATR, and ST (very significant).
Therefore, it can be concluded that the proposed model is significant, effectively demonstrating the statistical relationship between the five aforementioned financial indicators and the non-financial (environmental) performance of the sample companies.
7. Limitations and Further Research
While this study has outlined several limitations, this does not imply that the analysis conducted is any less valuable. The study’s results can be of real use to both the academic community and business representatives.
The calculation of an environmental performance (EP) score, utilizing the grid method, was conducted through a content analysis of sustainability reports released by companies. One limitation of this research is the potential collection of incomplete or unclear data and information. Furthermore, our analysis of the sustainability reports’ information may have been subjective, and the EP score may have been influenced by factors not identified by the authors.
In future research, we intend to conduct comparative analyses of the EP score across various sectors. Additionally, the scope of this research could be broadened by examining the relationship between ESG and the financial performance of the examined companies.
The present study faced difficulties in defining and setting out the concepts of sustainability and environmental responsibility, as these notions are often interpreted differently in the literature. This conceptual ambiguity may affect the coherence of the theoretical framework and the comparability of our results with those of other research.
Limited access to updated and reliable data on sustainability reporting practices in Romania represented a significant constraint. Many companies do not publish detailed or standardized information, which complicates empirical analyses and may lead to incomplete or biased conclusions.
The sample selection may have suffered from reduced representativeness, especially given that it included only large or publicly listed companies, neglecting small and medium-sized enterprises. This approach could limit the generalization of our results to the entire corporate sector in Romania.
The application of econometric models may have encountered issues related to incorrect model specification, the omission of relevant variables, or the presence of multicollinearity. These factors can distort estimates and result interpretations, affecting the validity of the conclusions.
Moreover, the analysis was carried out on a single country, namely Romania, albeit with potential to expand it in the future to include data from other European countries. We believe that this research could also be improved by conducting a questionnaire-based analysis to identify managers’ opinions regarding the specific strategies implemented for environmental protection.
In conclusion, while this article provides valuable insights into sustainability reporting and environmental responsibility in a Romanian context, it is essential for readers to be aware of these limitations to correctly interpret the study’s results and implications


 and
and 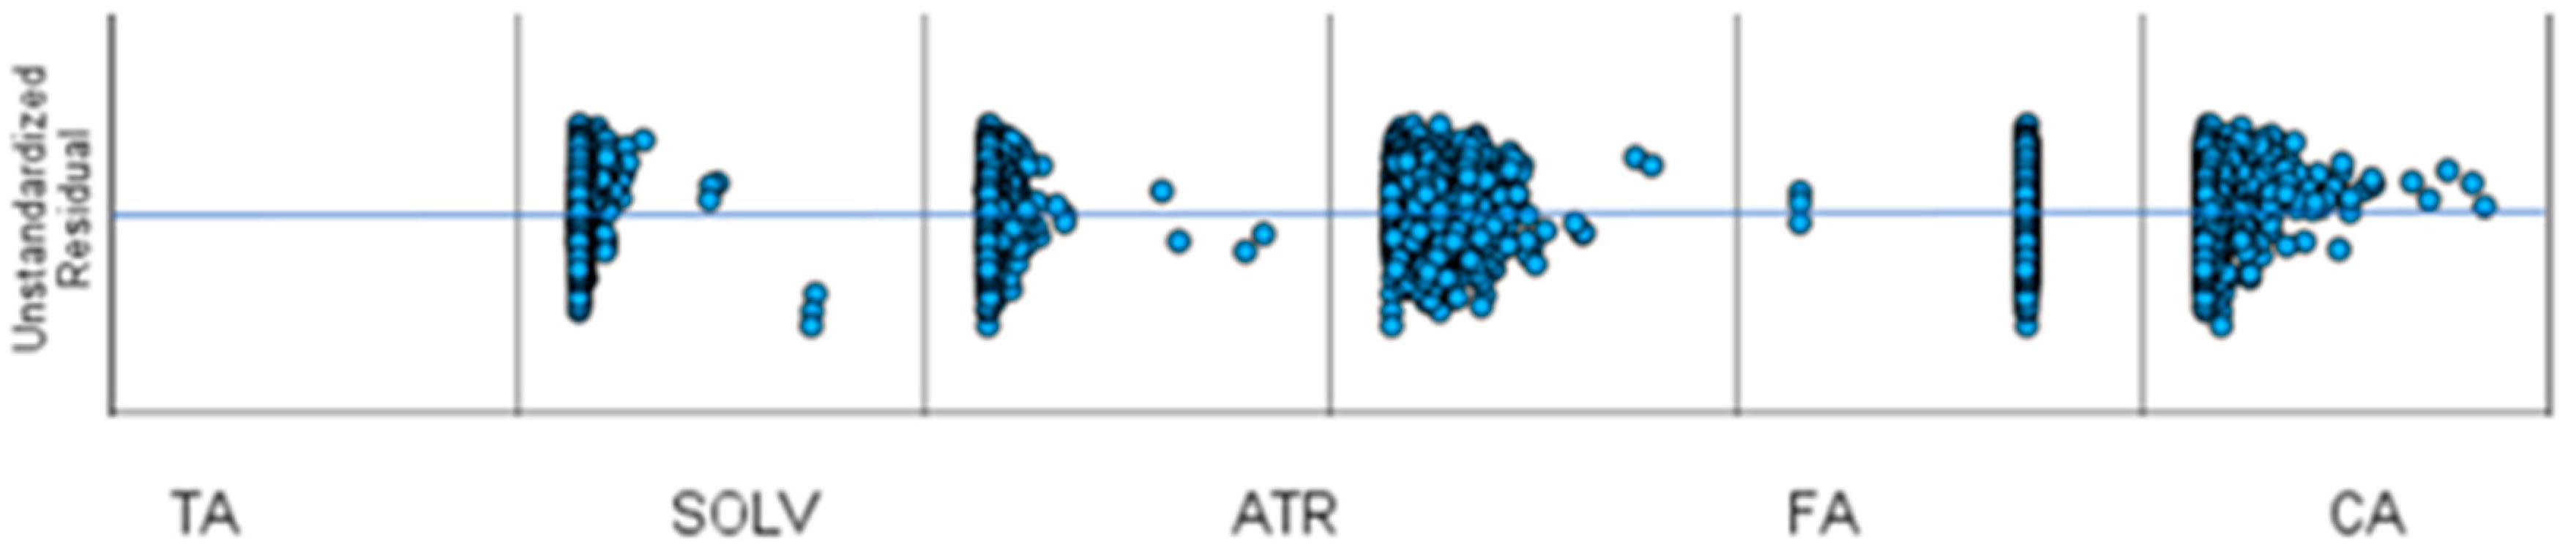
