Abstract
With sustainability becoming the new norm, the discussion about followers’ attitudes towards sustainability-oriented leadership is growing globally. Therefore, this study investigates the extent to which employees’ industry and sector background influence their perception of the ideal leader in relation to preferred sustainability orientation. This study also examines preferred sustainability leadership values and the role of culturally endorsed leadership in this process. Using the Preferred Sustainability Leadership Orientation (PSLO) survey, we gathered and analyzed data from 11 countries and 11 industry backgrounds (n = 5530). Our findings show that there is a statistical significance in followers’ valuing a leader with a high sustainability orientation most. Moreover, our results indicate that respondents working in public administration organizations value a leader with a strong sustainability orientation in addition to environmental and equality goals. While respondents associated with agriculture and real estate do not seem to place so much value on an ideal leader focusing on gender equality, in industries such as finance, manufacturing, and real estate, followers seem to value a leader with a stronger focus on profit and less emphasis on promoting gender equality. This research offers implications for the development of the PSLO (preferred sustainable leadership orientation) as a useful sustainability leadership barometer tool for measuring an organization’s sustainability culture and suggests avenues for future research.
1. Introduction
Focusing on sustainability is becoming a new normal in all aspects of each organization’s lifecycle, starting with investment all the way to product development (Amir 2023; European Parliament 2023). Moreover, sustainability is expected to encourage strategies that ensure that top business performance includes concern for both the environment and society (Jutras 2009), which leads to the integration of sustainability practices in organizations (Hoffman 2018; Singh et al. 2024).
Furthermore, research suggests that sustainability has become imperative and mainstream in today’s business world (Sanders and Wood 2024). Organizations are expected to balance the social, economic, and environmental aspects of their businesses via the responsible use of resources, giving back to society, and long-term value creation (Bressler 2024; Sanders and Wood 2024). This pressure to perform in a sustainable manner comes from diverse stakeholders, including global, regional, and local policymakers (e.g., see European Parliament 2023) all the way to customers with their rising expectations regarding sustainable production (Reichheld et al. 2023).
Naturally, this diverse set of stakeholders is continuously appraising sustainability efforts by organizations, leading to either public endorsement or criticism. Such appraisal is increasingly significant in the context of leadership, where the congruence between a leader’s actions in sustainability and public expectations becomes critical. This public scrutiny of sustainability performance is reflected not only in various reporting metrics but also in shaping the perceived values and effectiveness of leadership (Sanders and Wood 2024).
These paradigmatic shifts in business require a special kind of leadership, consequently making sustainable leadership increasingly more influential in business today (McCann and Sweet 2014). Moreover, the public’s increasing ability to scrutinize the sustainability orientation of each organization’s top management highlights the importance of leader–follower value alignment (Kristinsson et al. 2022). Here, the concept of sustainability-oriented leadership intersects with the expectations of various stakeholders, including employees.
Modeling leadership behavior according to employee expectations is an established precondition for effective leadership in the scientific literature (Mitchell and Ambrose 2007; Minelgaite et al. 2018). Indeed, the well-established leadership theory on ideal leader behavior, since its inception, suggests that followers have specific mental models about preferred leader behavior, and leaders conforming to these models are perceived as more effective, contributing to better organizational outcomes (Lord and Maher 2002; Littrell et al. 2018). While a considerable body of research has provided valuable insights into various aspects of preferred leadership, the sustainability orientation of leaders and the impact of the sector present a gap in the literature.
For example, a poor fit between a leader’s values and a follower’s Preferred Sustainability Leadership Orientation might lead to a weaker organizational culture and disengagement of staff. Consequently, paying attention to employees’ preferred sustainability-focused leadership style assures that alignment between well-established leadership theory on ideal leader behavior from its inception, suggests that followers have certain mental models about preferred leader behavior, and ensures that leaders engage in certain behaviors to achieve the company’s long-term growth and success, and so build long term value for the organization (Pulusella 2020).
Preferred Sustainability Leadership Orientation is generally defined as the degree to which a leader is valued and respected most, not only because of her/his excellent leadership skills in managing people and shareholder interests but also due to his/her ability to perform the following: (1) prioritize the environment and CSR initiatives over profit and (2) prioritize her/his initiatives to increase gender and race equality. The Preferred Sustainability Leadership Orientation (PSLO) survey instrument (Warner-Søderholm et al. 2021) is a five-item validated construct, which may be combined with the well-established LBDQ50 ideal leader behavior 50-item instrument (Warner-Søderholm et al. 2019) as a comprehensive leadership measurement tool that is reliable and valid across cultures and languages. The PSLO measurement of sustainability has a second-order level of measurement to investigate sub-elements of sustainability, as follows: (i) environmental vs. profit orientation, including measurement of corporate social responsibility orientation; (ii) equality orientation, with both gender and racial equality elements included.
We live in a cross-culturally diverse world, where globalization and competitiveness combined with sustainability issues have become a key focus in organizational life (Dirk Van Dierendonck et al. 2017). Hence, in this study, we fill a gap in contemporary administrative and leadership research by measuring industry differences in preferred leadership values. Understanding these industry differences in the context of sustainability-oriented leadership is crucial, given that different industries face distinct environmental challenges, and therefore, stakeholders in these industries might have varying expectations from leaders with regard to sustainability. For example, manufacturing or other industries with a direct impact on the environment might face greater scrutiny and, therefore, higher expectations for sustainable practices compared to service-focused industries (Bansal and Roth 2000). Moreover, regulatory pressures differ across industries, which might also have an impact on how sustainability is prioritized (Aragón-Correa et al. 2008). Therefore, to address these gaps in the literature, the purpose of this study is threefold. Firstly, we investigate to what degree the industry of employees impacts how they see the ideal leader in relation to preferred sustainability orientation. Secondly, we investigate the differences in the preferred sustainability leadership values in the public vs. private sectors. Thirdly, we assess the role of culturally endorsed leadership as a demographic control variable to assess cross-cultural invariance. By investigating the above, we offer a range of theoretical and managerial implications, including the development of the PSLO as a useful sustainability leadership barometer tool for measuring an organization’s sustainability culture.
This article is organized as follows: we first present a summary of the extant literature on sustainability, cultural influences, and relevant demographics such as industry background; based on this, our hypotheses are developed. We then present our samples, the methodological procedures we deployed to collect and process data, and the results of our analyses. Finally, we discuss the implications and limitations of our study and outline future research directions in order to set the agenda for future research on Preferred Sustainability Leadership Orientation, particularly with regard to the suggested “sustainability barometer” tool.
2. Literature Review
2.1. Sustainability Orientation within Leadership
The term sustainability is often discussed in management reporting and academic studies in various ways, yet often as a synonym for a greener economy, its impact on society, influencing today’s organizations, and even resulting in the emergence of new trends and movements, e.g., the Corporate Social Responsibility Movement (Minelgaite et al. 2021). In truth, originating from the Latin term “sub-tenere”, sustainability refers to a situation that can be upheld and maintained in the long term without damaging or detracting value from the present state of affairs (Di Fabio and Peiró 2018). Indeed, in technology, politics, economics, and ecology, the term sustainable traditionally denotes the ability to achieve current aims without endangering future ones (Di Fabio and Peiró 2018). The United Nations’ 17 sustainability development goals (United Nations 2015, 2023) mark the pressing urgency to join forces globally to ensure that the world can survive and prosper when faced with the danger of future extinction (United Nations 2015).
The UN SDGs no. 5: Gender Equality, no. 10: Reduced Inequalities, and no. 13: Climate Action, underpin this study and are, in turn, key drivers for SDG no. 8: decent work and economic growth. Globally, countries have developed unsustainable ways of life since the last industrial revolution, and this will lead to unsustainable development of technology, individual prosperity, economics, and ecology if we do not manage organizations responsibly (Warner-Søderholm et al. 2021). As a result, companies are being called upon by policymakers and organizations (e.g., environmental) to assume responsibility for their operations and their impact on the environment and society. Furthermore, companies are expected to apply principles of sustainability by making them present in all aspects of the company and its business conduct (Quinn and Dalton 2009). However, the bottom-up approach—or how employees view the sustainability orientation in leaders, presents a gap in the literature.
On a business level, the marketing literature has already established the importance of sustainability for consumers when making purchase decisions for goods (Shao and Ünal 2019) or even services (Ročkutė et al. 2018). However, in leadership literature, followers’ preferences towards the sustainability attitudes of the leader are still under-researched.
If we can better understand what followers expect of socially and environmentally responsible leaders, we can add value to society by mapping and aligning such sustainability values between followers and leaders for long-term results. This brings us back to our focus on the specific UN SDGs above, which underpin the need for the study of leadership within all industries.
2.2. Sustainability Analytics
Modeling leadership behavior according to employee expectations is an established precondition for effective leadership in the scientific literature (Mitchell and Ambrose 2007; Minelgaite et al. 2018). Therefore, understanding followers’ attitudes towards a leader´s sustainability orientation would contribute to leadership effectiveness. The following question emerges: how should these sustainability attitudes be measured?
In terms of specific measures, Choi and Yu (2014) developed 18 items to measure the influence of perceived corporate sustainability practices on employees and organizational performance. Similarly, Abdullah and Aziz (2013) developed 29 items to measure institutionalizing corporate social responsibility, including the effects on corporate reputation, culture, and legitimacy. (Di Fabio and Peiró 2018) validated a 16-item scale to measure Human Capital Sustainability Leadership to Promote Sustainable Development and Healthy Organizations. Endorsement of the New Ecological Paradigm was measured by Dunlap et al. (2000) with a 15-item scale, whilst a novel study by Eagle et al. (2015) developed a comprehensive 36-item study to measure attitudes of undergraduate business students towards the sustainability issue.
Milfont and Duckitt (2010) validated the comprehensive environmental attitudes inventory to assess the structure of environmental attitudes, with 110 items measuring 11 sets of sustainability attitudes. Moreover, Gericke et al. (2019) developed a sustainability consciousness questionnaire with 27 items, measuring the values of stakeholders working with sustainable development. On a similar inquiry line, (Yol Lee and Rhee 2007) applied 20 items to measure the change in corporate environmental strategies, whilst a 16-item sustainability survey instrument was developed and validated by Brønn and Vidaver-Cohen (2009). The 4-item Corporate Citizenship Scale was developed by Gorden et al. (1992) to map and measure employees’ positive perception of the extent to which the employer in a company is committed to social responsibility.
All in all, after the rigorous Q-sorting of the above items by the international consortium team in our project, the final list of sustainability leadership orientation questions led to the selection of the validated PSLO 5 items applied in the present study as follows:
- My ideal leader prioritizes gender equality in the workplace (developed by Abdullah and Aziz 2013)
- My ideal leader conducts many environmental CSR practices (adapted from Choi and Yu 2014)
- My ideal leader conducts many ethical CSR practices (adapted from Choi and Yu 2014)
- My ideal leader has a policy on equal opportunities among the employees (Abdullah and Aziz 2013)
- My ideal leader has the strongest focus on Profit—Environmental issues (adapted from Eagle et al. 2015)
This measurement instrument captures sustainability behavior in an ideal leader for followers across cultures and was developed and validated in 2021 as part of project FEELS (Follower Endorsed Effective Leadership and Sustainability project (Warner-Søderholm et al. 2021). Researchers may apply the above-mentioned 5-item sustainability scale to map key elements of sustainability and the expected follower values of an ideal leader. Specifically, this can measure the following: (1) how much followers value ethical practices such as CSR and environmental ethics, and (2) to what degree followers prioritize profit vs. environmental concern. These are key elements to measure and understand in this 5-item PSLO (Preferred Sustainable Leadership Orientation). Moreover, researchers can also apply the PSLO construct with the LBDQ50 field survey, as we do in this study, for a more comprehensive mapping of all 13 constructs, which is termed project FEELS.
2.3. Culturally Endorsed Leadership
Culturally endorsed leadership is a concept that is strongly related to the theme of cultural values driving organizational success in different settings (House et al. 2004; Littrell et al. 2018; Gerlich 2023). The literature shows that by understanding such ideal leader values endorsed by followers across cultures and empirical settings (House et al. 2004; Northouse 2021; Littrell et al. 2018), the prioritization of specific drivers of sustainability leadership can be better understood and aligned. A review of the cross-cultural management literature on leadership is fascinating, yet we see a gap in better understanding follower-endorsed leadership and sustainability values across cultures. Indeed, Stogdill (1974) reviewed leadership theories and research and pointed out the following:
“There are almost as many different definitions of leadership as there are persons who have attempted to define the concept”.
Twenty-five years later, in 1999, Russ-Eft concludes the following from her review:
“There was no consensus on what makes a good leader. Lists of skills and attributes differed from study to study. It seemed that every professor, management guru, and strategist had his or her view, and overlapping findings were relatively rare.”
Clearly, comparisons of sustainability management or leadership styles across cultures and industries should be made with caution in a huge range of public sector occupations; most workers are clustered into a relatively small number of areas (i.e., health, education, social work, government, and the police) and Y leadership orientations where culture is a valuable control variable for measuring cross-culture invariance. As presented earlier in this article, this study applies the LBDQ50 instrument and data to measure a follower’s preferred culturally endorsed effective leadership values as the control variable and culturally preferred leadership values. The control variable data are aggregated to the country cluster variable, applying country clusters in line with recommendations by project GLOBE (House et al. 2004).
2.4. Industry-Endorsed Attitudes
Research studies show that demographics play an essential role in understanding their predictor value and impact on the empirical data gathered (Fernandez et al. 2016). A comprehensive set of demographic questions includes characteristics such as age, gender, industry background, occupation, education, employment status, marital status, and household income and composition. Such demographics are invaluable when investigating which demographic populations act as predictor variables, moderating variables, or control variables.
The literature suggests that industries can be characterized by distinctive cultures (Phillips 1994). Therefore, followers’ preferences towards leader behavior can be affected by the industry of employment of a follower (Minelgaite 2016). According to Pizam et al. (1997), industry culture transcends the culture of one company but is narrower than societal culture.
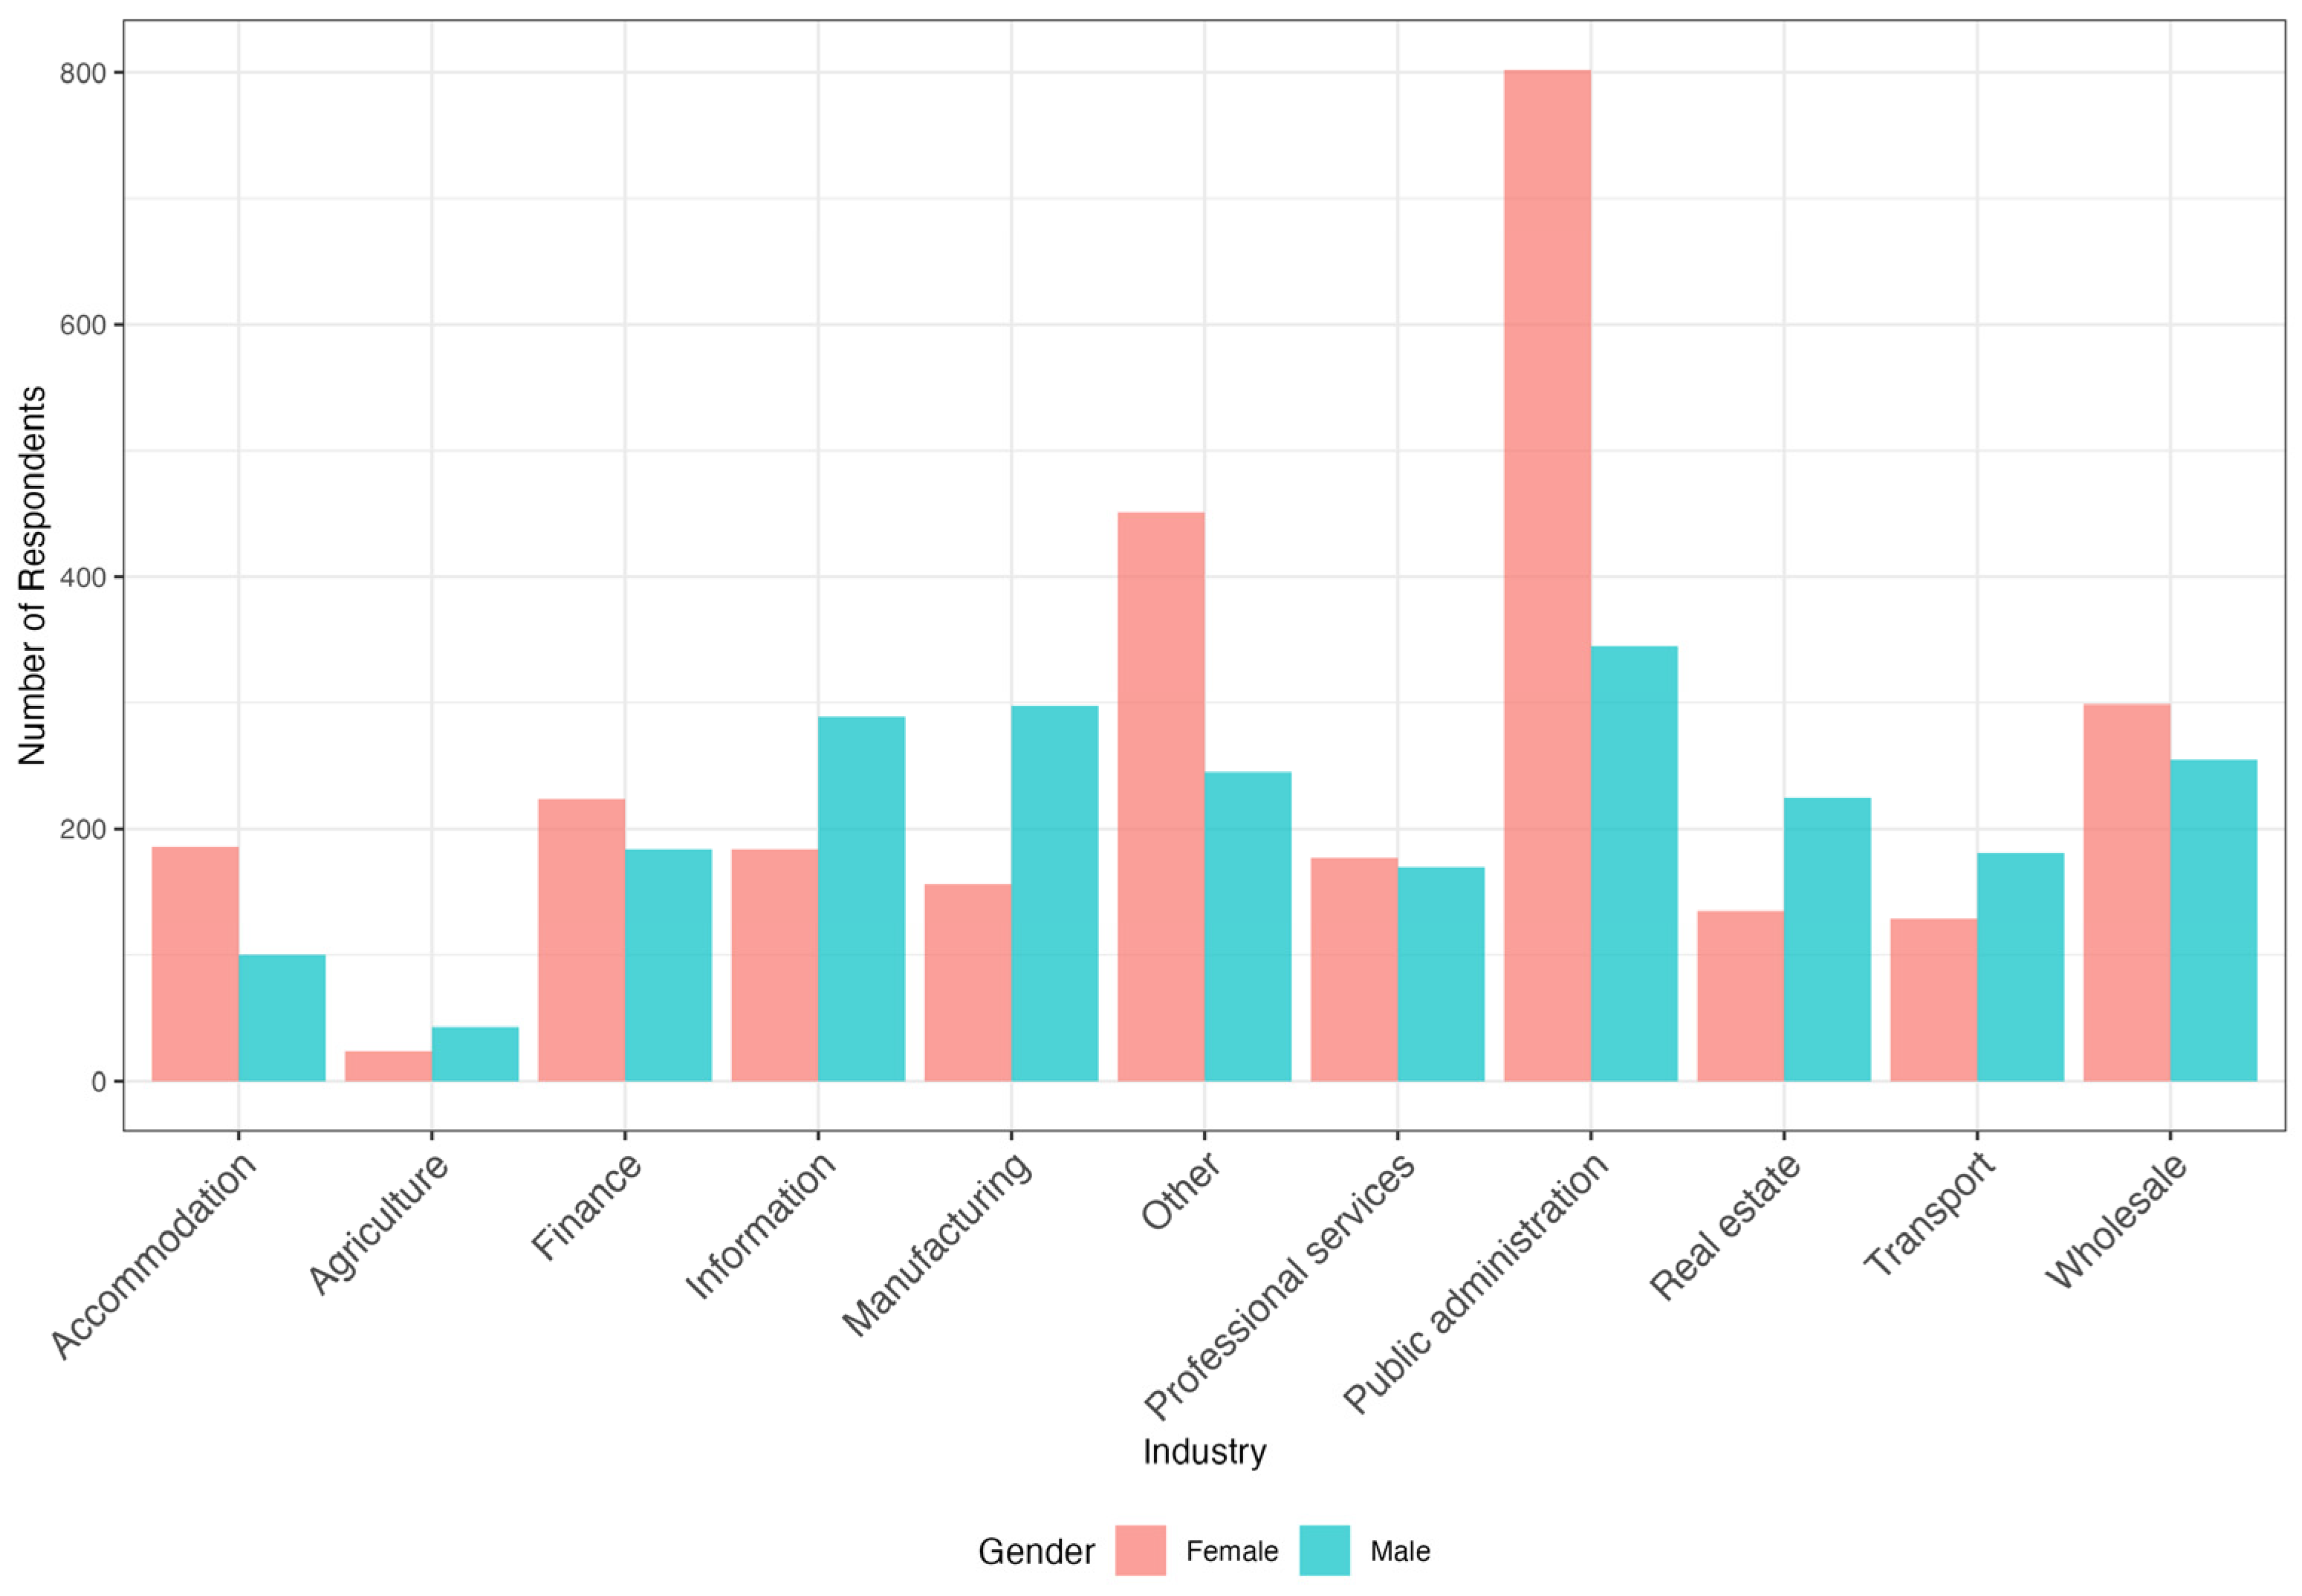
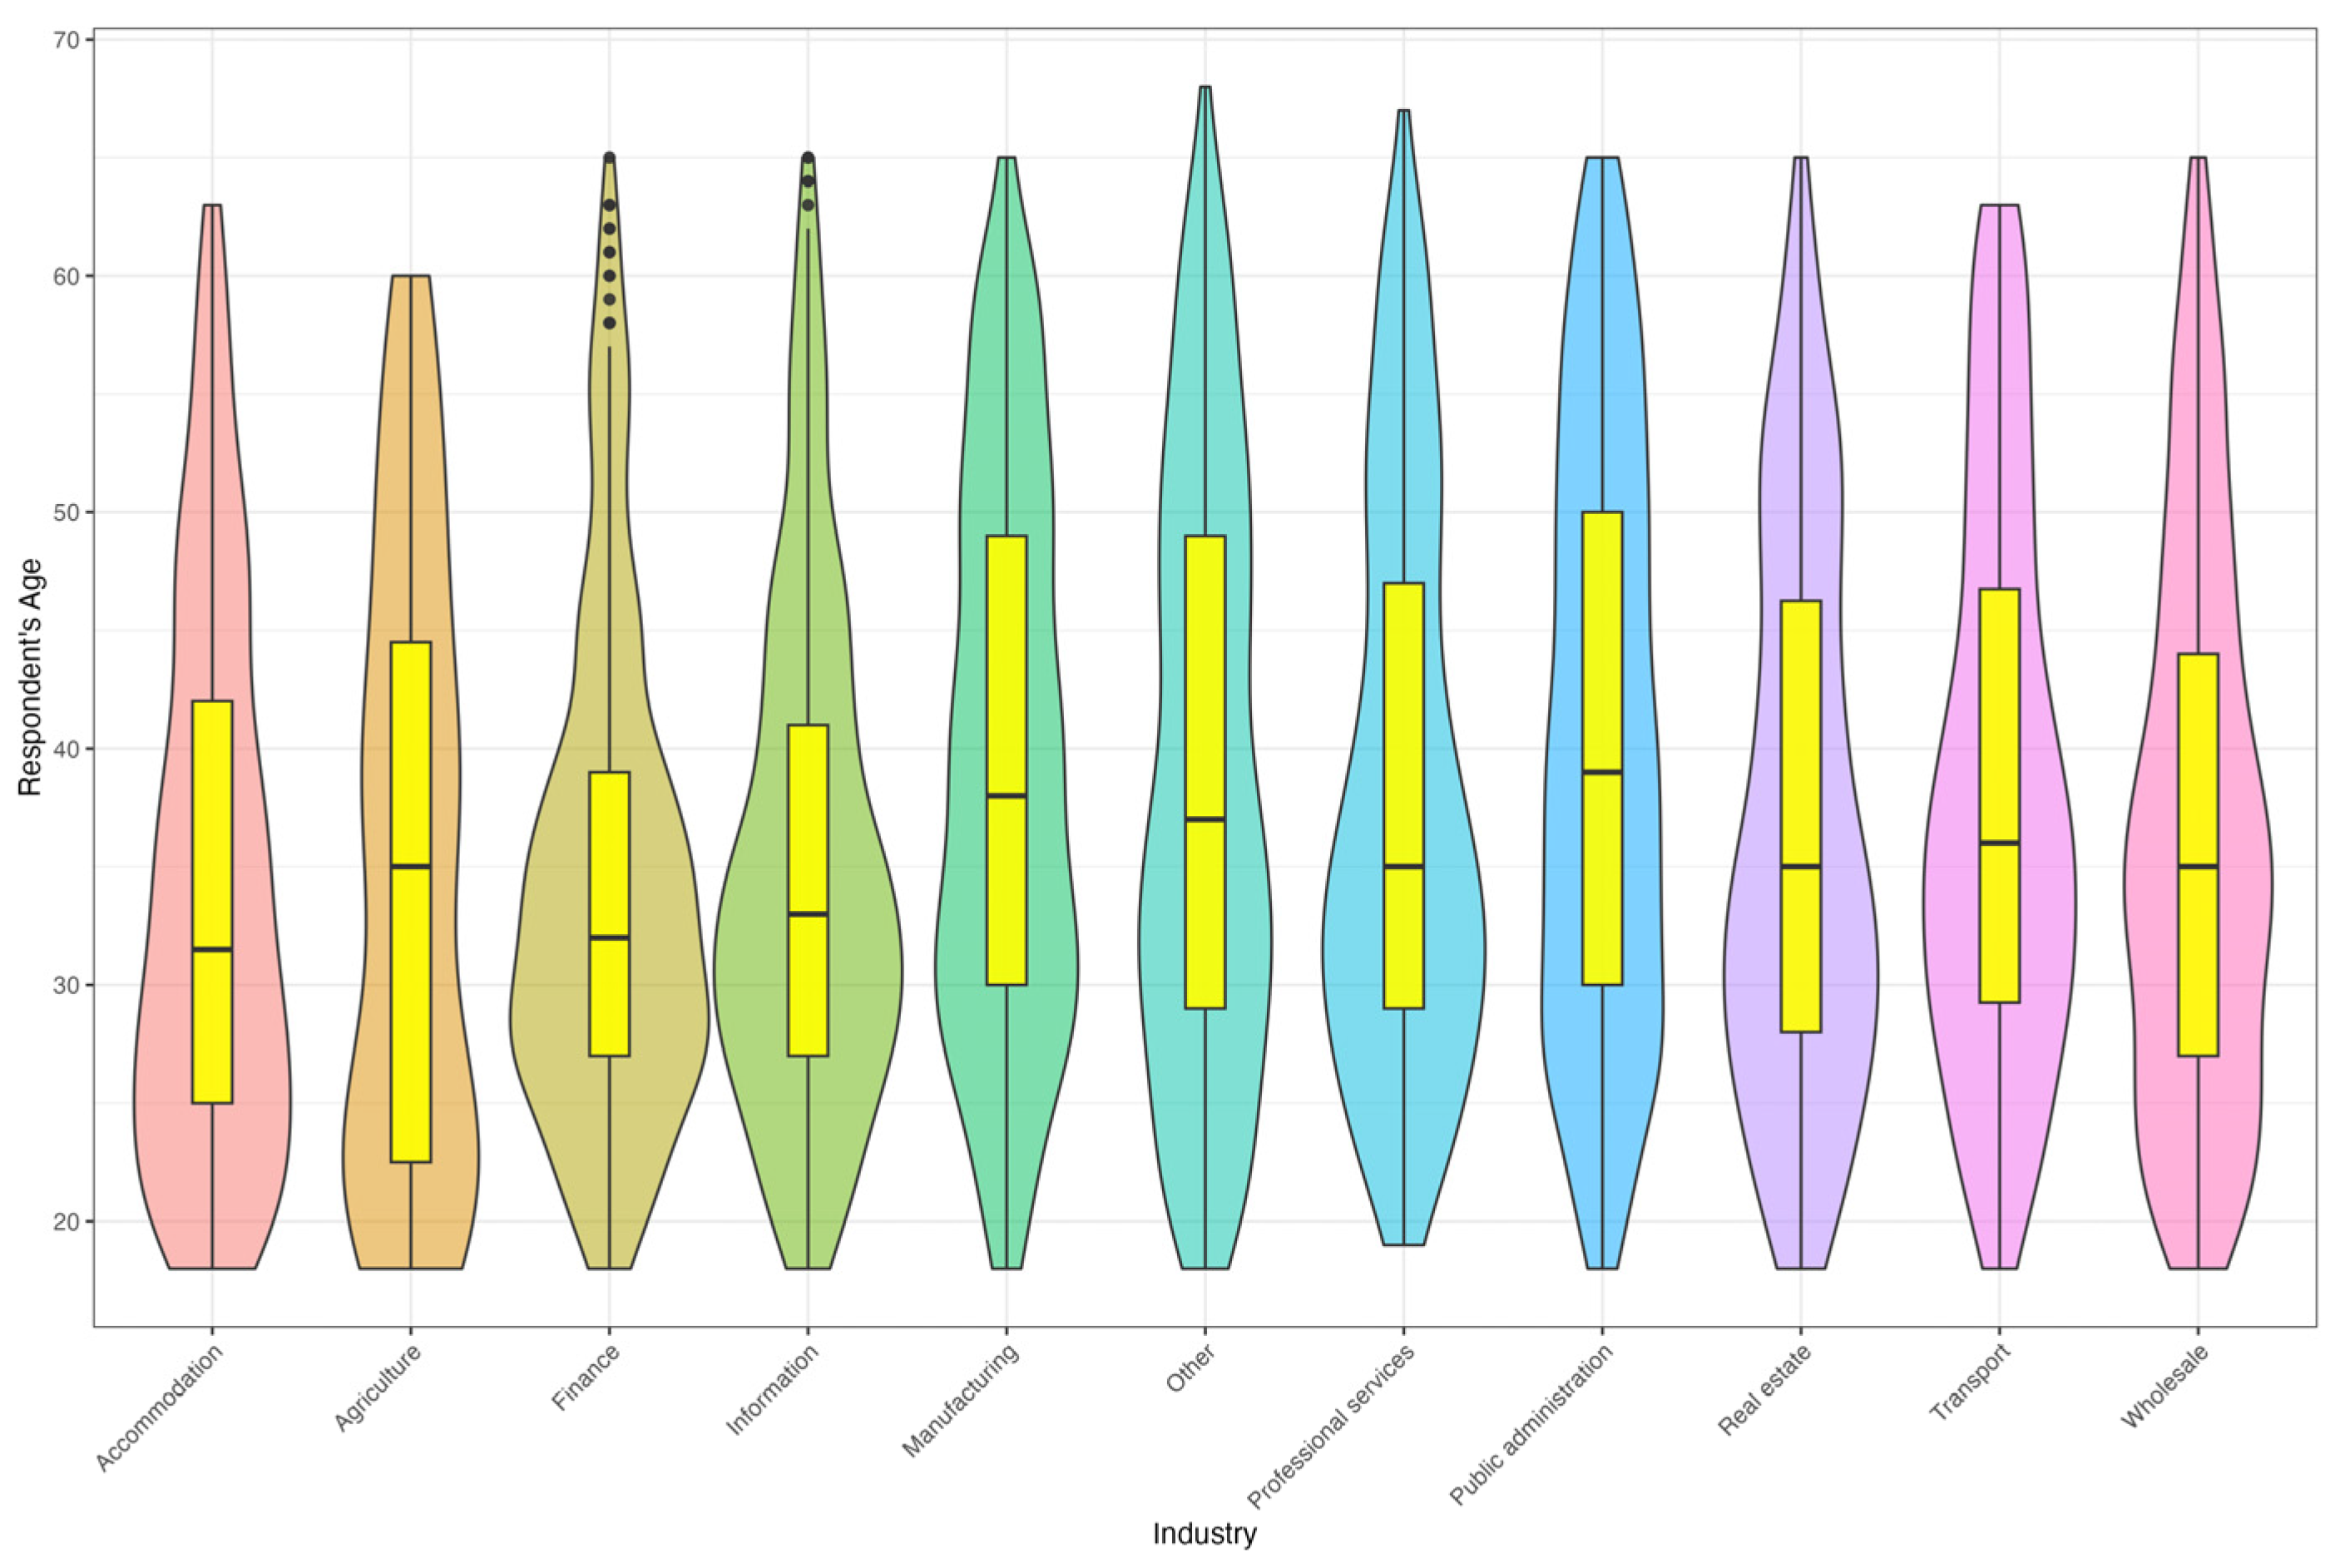
Hence, in this article, we study the role of the industrial background of employees as a predictor of preferred sustainability values, such as teachers, doctors, nurses, and cluster data as control variables. The traditional industry categories applied in this study are as follows: Agriculture, Finance, Information, Manufacturing, Professional services, Public administration, Real estate, Transport, Wholesale, Hospitality sector, and “other” as a final category. We outline the sectors briefly below.
2.4.1. Public Administration Sector
More than 300 different occupations are reported to be in the public sector (Office for National Statistics 2024). These include diverse business and administration roles, such as economists, accountants, human resources and office managers, teachers, nurses, social workers, and others. While there is a huge range of public sector occupations, most workers are clustered into a relatively small number of areas (i.e., health, education, social work, government, the police, and domestic services). Moreover, of all public sector workers in the UK, one-tenth are schoolteachers, and a quarter work in the health and social care sectors. The public sector has a much higher proportion of high-skilled jobs than the private sector. Almost twice as many public sector employees work in a highly skilled role compared with private sector employees (46% compared with 24%, respectively) (Office for National Statistics 2024). This is likely because large occupations in the public sector, such as teachers, doctors, and nurses, now require at least a degree.
2.4.2. Private Sector
Traditional demographics-related to company or industry background consist of items to help understand which industries the respondents’ primarily middle managers work in. In most management research (see House et al. 2004; Littrell et al. 2018; Stogdill 1974), the following response options are available:
- Agriculture (including forestry and fishing industries—may be state-supported in some countries)
- Finance (including banking and investment)
- Information (including communication)
- Manufacturing (including industrial manufacturing)
- Professional services (consultancy services)
- Real estate
- Transport (including logistics)
- Wholesale (including the culture of one company)
- Other
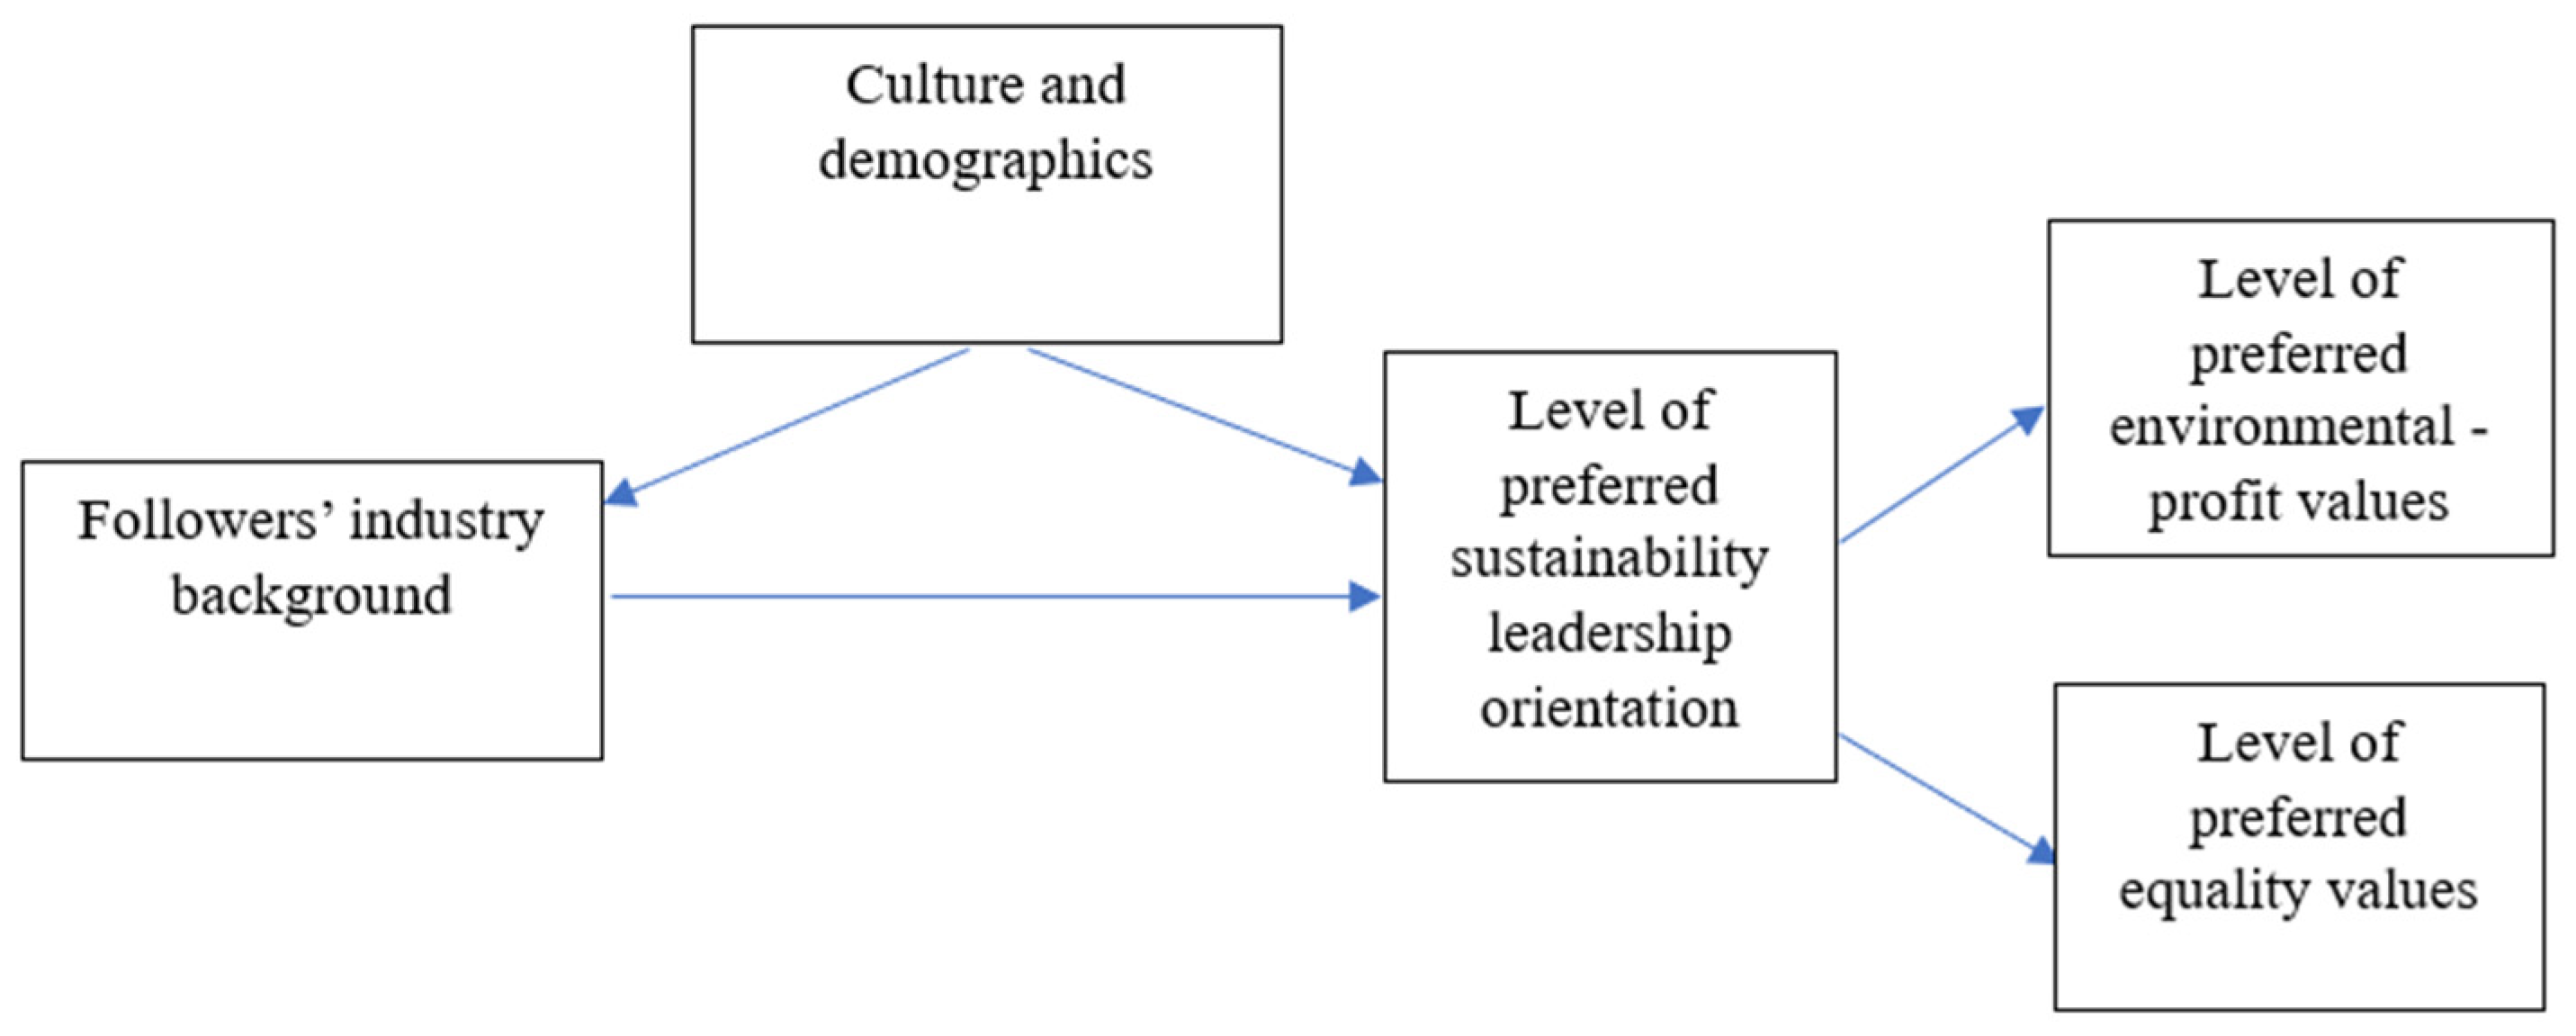
Based on the mapping of the extant literature, we developed a conceptual model (see Figure 1 below) and raised the following hypotheses:
Figure 1.
Conceptual model.
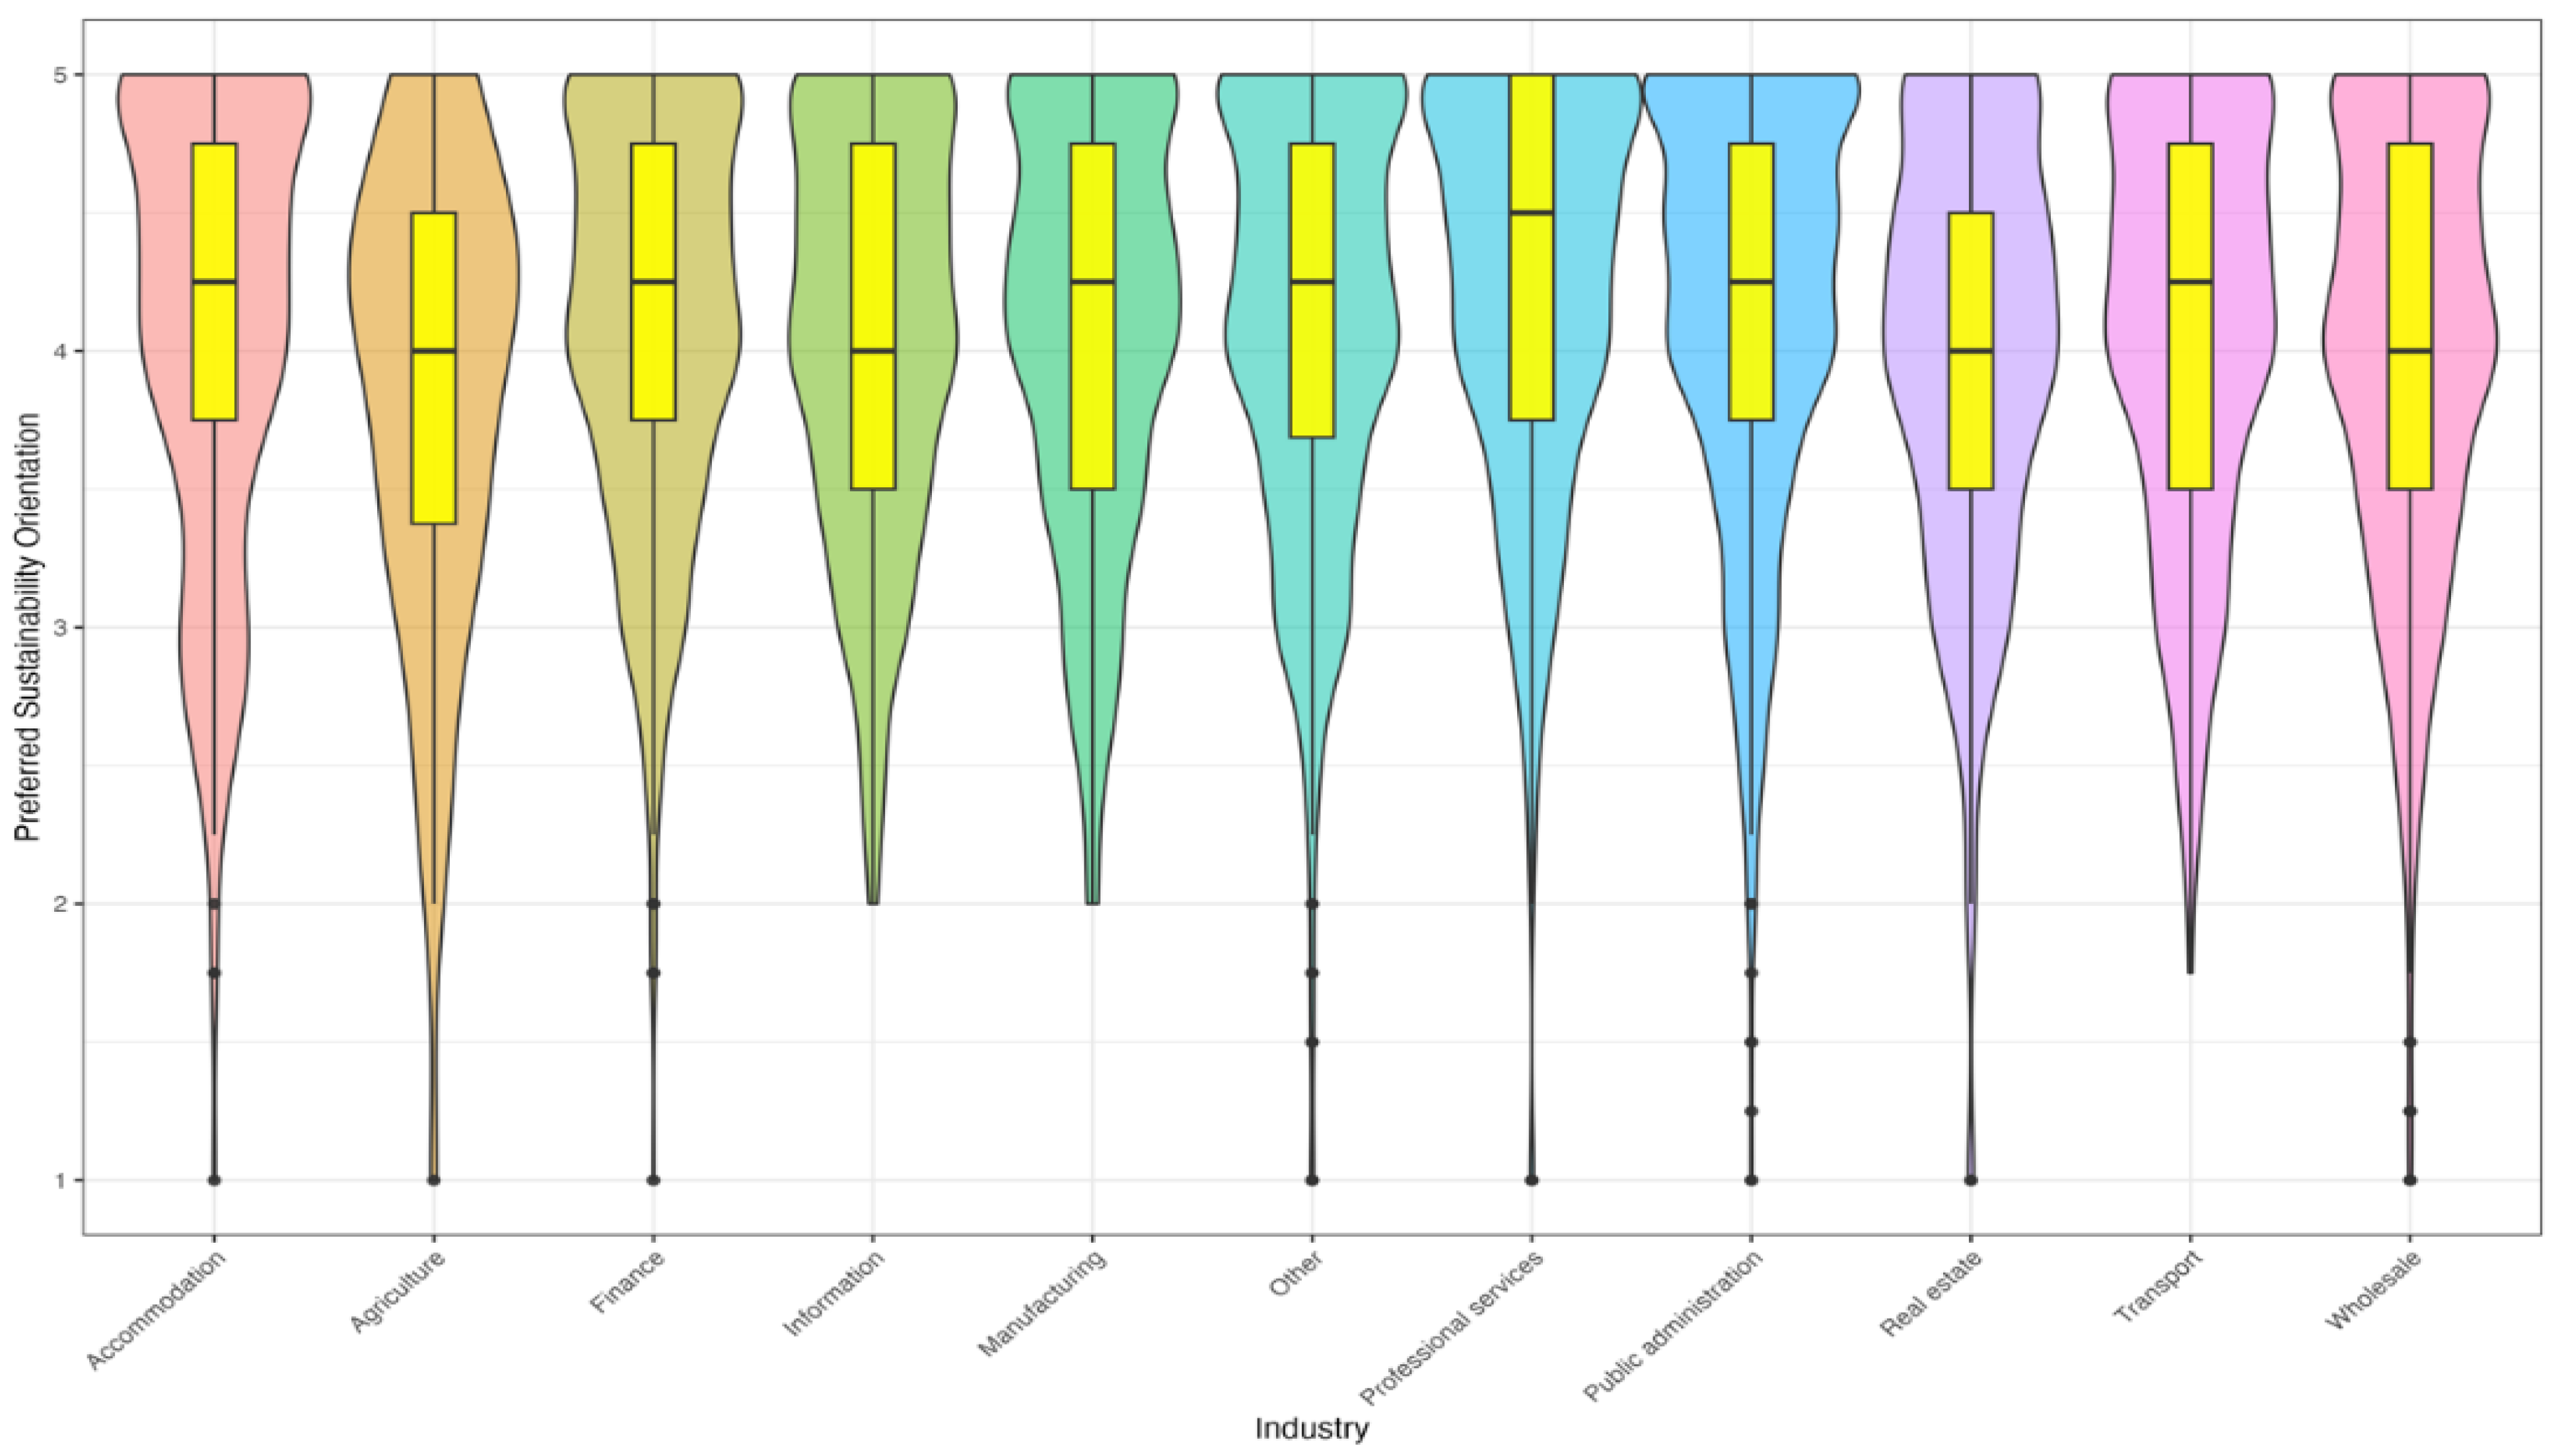
H1:
Industry background impacts a follower’s Preferred Sustainability Leadership Orientation.
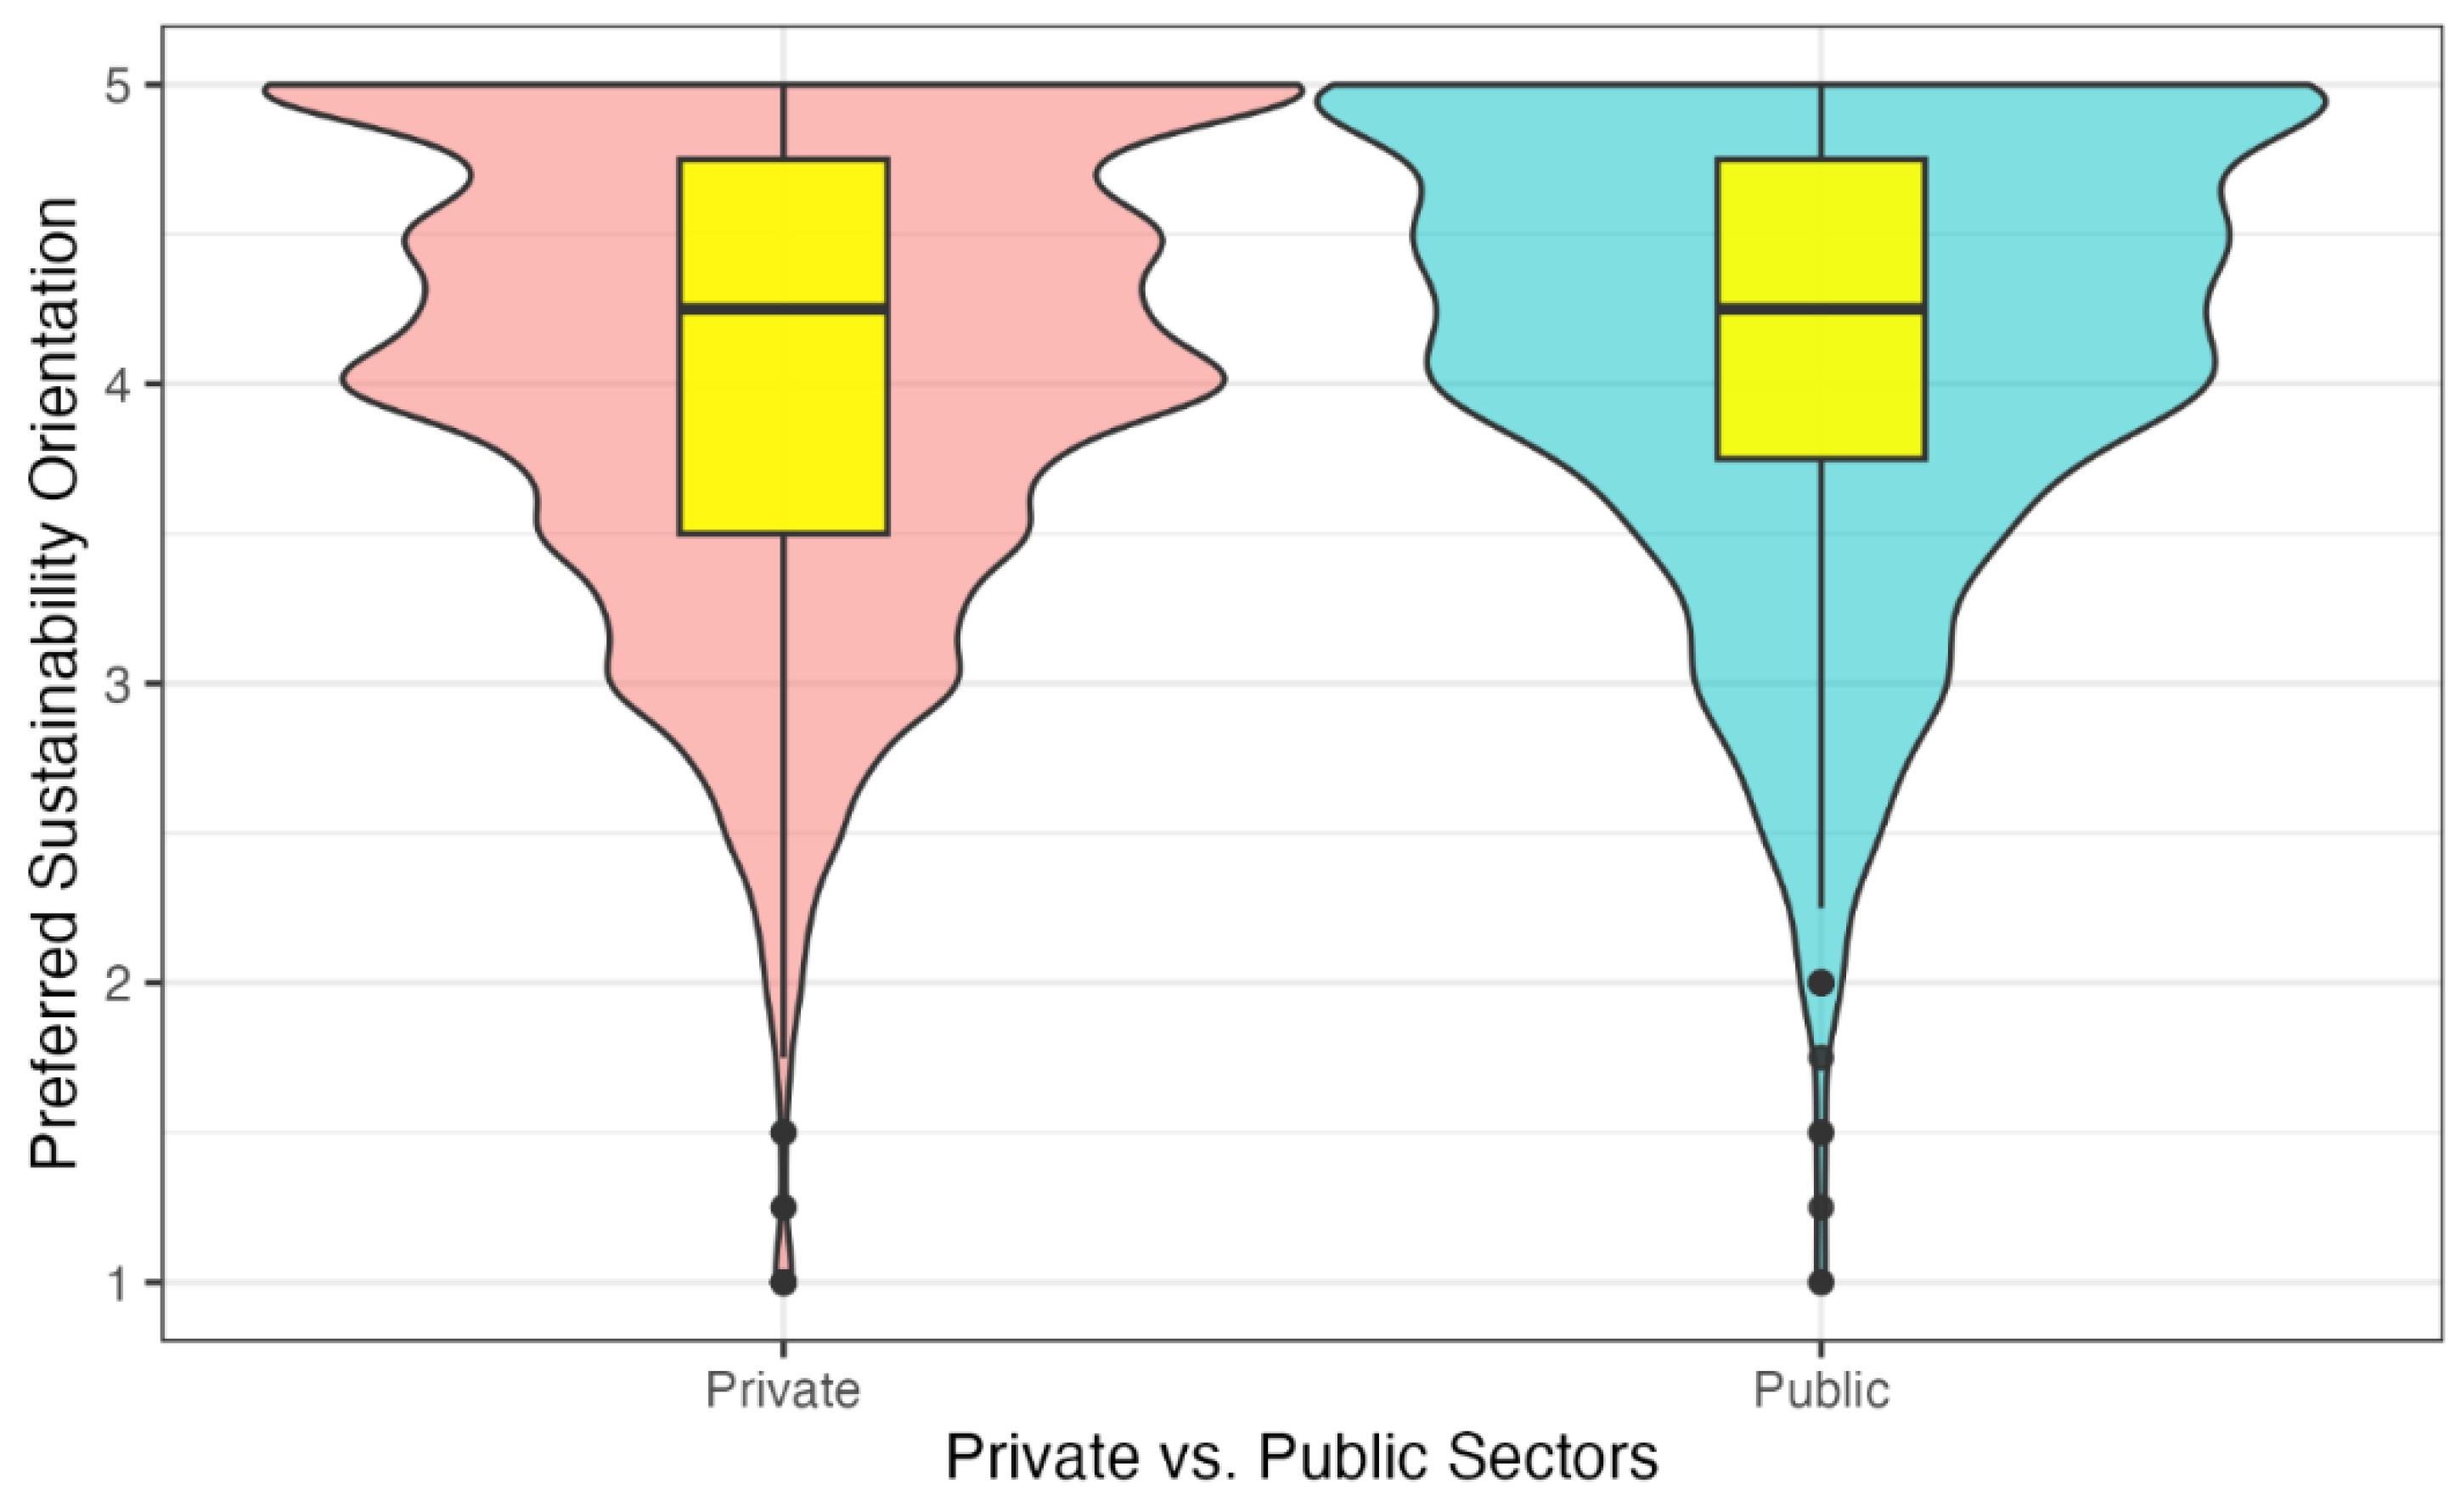
H2:
There are significant differences in preferred sustainability orientation between demographic backgrounds in public and private sector employees.
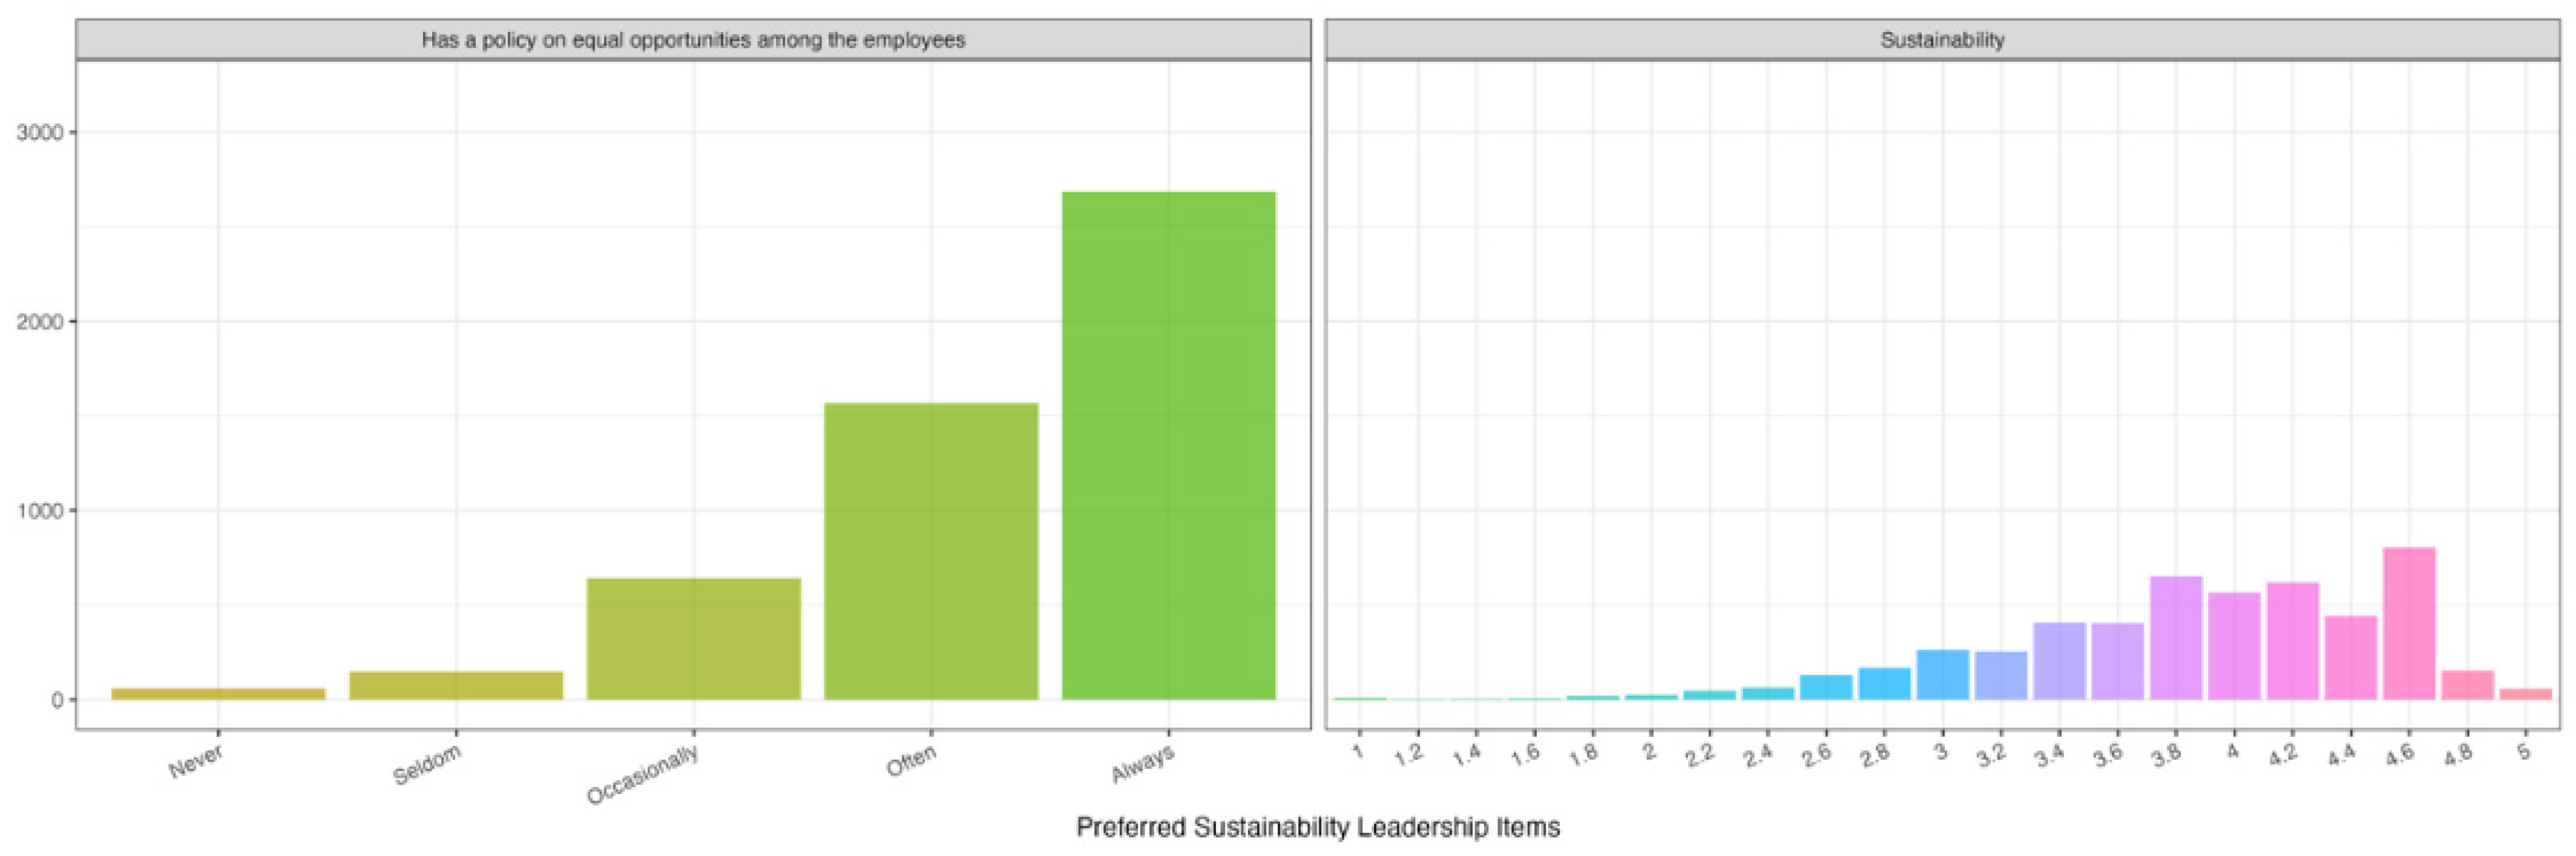
H3:
The prioritization of sustainability leadership will exhibit distinct preferences for equality over environmental values.
To sum up, the literature suggests that the sustainable way is the new reality of managing organizations. While the expectations of some stakeholders (e.g., policymakers) towards the sustainability and leadership of organizations are relatively well-expressed, the attitudes of employees towards sustainability-oriented leadership remains a domain of little knowledge. However, this knowledge is important, as followers’ attitudes towards leader behavior provide valuable insights for leadership effectiveness. Furthermore, the followers’ attitudes need to be investigated in a way that unveils the specificity of particular follower groups, as the literature suggests that differences in follower attitudes exist due to societal culture and the industry of employment.
3. Method, Sample and Procedure
Data were collected in all 11 geographically and culturally diverse countries and industry backgrounds. Surveys were distributed to individuals via online survey tools; Qualtrics and Google Forms. Rigorous data collection procedures were applied within leadership research developed by Project GLOBE (House et al. 2004). Confidentiality and anonymity were ensured as per GDPR regulations. More details on data storage and processing are available from the corresponding author upon request. In this research, we included the countries that had a minimum of 250 respondents who filled out the full survey (n = 5530). We applied random quota sampling, selecting from finite populations; in this case, employed businesspeople between the ages of 18 and 65 from the following countries: Denmark (n = 415), China (n = 549), Finland (n = 628), Germany (n = 554), Iceland (n = 297), India (n = 548), Lithuania (n = 306), Norway (n = 415), Sweden (n = 630), the UK (n = 638), and the USA (n = 550). All respondents confirmed in the initial control question in the online survey that they were citizens and residents of each specific country with a permanent full-time position in their given industry. After data collection, only participants who provided complete responses to all survey items were retained. These samples meet robust sample size requirements in leadership research and are sufficiently diverse for us to assume that they provide a broad enough sample of opinions, attitudes, and beliefs in the societies and industries covered in this study. This allows us to draw conclusions about the effects of industry on followers’ sustainability-oriented leadership preferences. When initiating this research project, we solicited country research collaborators in line with Project GLOBE research practices and ethics. Hence, we ensured the inclusion of research collaborators who were in countries yielding a cross-section of empirical, institutional, and industry settings.
Consequently, in this study, we adopt a positivist and quantitative methodological approach. Given that we employ previously developed reliable and valid field survey instruments, the Preferred Sustainability Leadership Orientation (PSLO) survey instrument (Warner-Søderholm et al. 2021) was employed in this study; this is a 5-item validated construct, combining the well-established LBDQ50 ideal leader behavior 50-item instrument plus sustainability items (Warner-Søderholm et al. 2019). A mapping of the literature on sustainability measurement items within management research revealed a database of over 300 possible survey items. A stepwise process was carried out to select survey items that measured specifically broad areas of sustainability, namely social responsibility, environmental values, equality, gender equity, and CSR ethical values preferred in a leader. Q-sorting techniques were applied to select and refine a set of valid and reliable sustainability measures in the context of the values an ideal leader should manifest.
The PSLO measurement of sustainability has a second-order level of measurement to investigate sub-elements of sustainability as follows: (i) environmental vs. profit orientation, including measurement of corporate social responsibility orientation; (ii) equality orientation, with both gender and racial equality elements included; (see Appendix I for the full set of items). For the instrument translation, we employed the Brislin model, using at least two independent bilingual translators for each translation (Brislin 1970). After this initial translation, local collaborating researchers administered pilot studies, distributing the translated survey to a smaller number of 20–50 participants for discussion about the face validity of the items and dimensions. Collected data were subjected to standard descriptive and inferential parametric statistical tests to facilitate making inferences from the analyses (see Littrell et al. 2018 for further details of the survey validation). More details regarding further survey instruments and analysis syntax are available from the corresponding author upon request.
4. Results
4.1. The Empirics: The Effect of Industries on Sustainability Items
In this section, we select and employ various statistical tests on survey data to explore the relationship between the respondent’s work activity and sustainability barometer items. The basic descriptive exploration of the data is followed by inferential statistical analysis.
4.2. Descriptive Analysis
Within the scope of quantitative analysis, we treat each item from the sustainability barometer as an individual dependent variable. However, within the descriptive portion of our study, we also integrate these items into a singular sustainability index. This index is formulated by averaging the values from the five sustainability items. This consolidated metric gives a better first look at the distribution of the data and initial intuition about the differences across different parameters.
There is a visible variation across different sustainability items. Respondents prioritize gender equality, ethics, and equal opportunities in the workplace more frequently than other sustainability items. Surprisingly, the distribution of responses for environment-related items is denser in the middle. That is, respondents seem to put less emphasis on the environment than on gender. Below is a detailed graph with bar plots for categories within each sustainability item as well as the aggregate sustainability barometer score (see Figure 2).

Figure 2.
Preferred Sustainability Leadership Items and the aggregate barometer score.
While the first look at the distinction between public-private sectors (1227 and 4184 observations accordingly) does not reveal apparent differences in the most common choice, we observe that the responses in the private sector are much more varied. We will analyze this further in the empirical section (see Figure 3).
Figure 3.
Preferred Sustainability Orientation Index by Sector. The plot features violin plots that illustrate the kernel density of responses across public-private sectors and sustainability scores. Boxplots depict key statistics for each sector, such as the minimum, median, and maximum values and the 25th and 75th quartiles.
If we break down the industries further into 11 individual categories, the differences in respondent choices are more visible. Professional Services scored highest across different sustainability items, whereas respondents associated with Agriculture chose the lowest values. The respondents from different industries seem to share different concerns regarding sustainability items (see Figure 4). The frequency tables and graphs for each sustainability item across industries are available in the Appendices (see Appendix A, Appendix B, Appendix C, Appendix D, Appendix E and Appendix F).
Figure 4.
Preferred Sustainability Orientation Index by Industry. The plot features violin plots that illustrate the kernel density of responses across different industries and sustainability scores. Boxplots depict key statistics for each industry, such as the minimum, median, and maximum values and the 25th and 75th quartiles.
To get a further sense of the distribution of the demographic characteristics within each industry, we explore variations of gender and age within each industry. There does appear to be some variation in the age of respondents across industries (see Figure 5). For example, the youngest respondents work in Accommodation, Finance, and Informational Technologies. Agriculture has the most equally spread distribution of respondents throughout the age brackets (18–65). The median age was highest for Public manufacturing and Public administration sectors.
Figure 5.
Respondents’ age by industry. The plot features violin plots that illustrate the kernel density of responses across industries and respondents’ ages. Boxplots depict key statistics for each cluster, such as the minimum, median, and maximum values and the 25th and 75th quartiles.
Similar variation is detected when we explore the distribution of male-female respondents across industries (see Figure 6). Four industries (Accommodation, Finance, Public administration, and Wholesale) feature more female respondents than male respondents. In all of the other industries (with the exception of the Other category), we have more male than female respondents. Gender imbalance in favor of men is particularly seen in Informational Technologies, Manufacturing, and Real estate.
Figure 6.
Respondents’ gender by industry. The bar charts depict the distribution of males and females within each industry in our sample.
We use the following set of variables for statistical tests:
Dependent Variables. Five sustainability items, each of which are ordinal variables measured on a five-point Likert scale:
- “Q13–51. My ideal leader has the strongest focus on”. The categories are (1) “Profit”, (2) “More on profit, little on the environmental issues”, (3) “Both profit and environmental issues”, (4) “More on the environment, little on profit issues”, (5) “Environmental issues”.
- “Q10–52. My ideal leader prioritizes gender equality in the workplace”. The categories include (1) Never, (2) Seldom, (3) Occasionally, (4) Often, (5) Always.
- “Q10–53. My ideal leader conducts many environmental CSR practices”. The categories include (1) Never, (2) Seldom, (3) Occasionally, (4) Often, (5) Always.
- “Q10–54. Conducts many ethical CSR practices”. The categories include (1) Never, (2) Seldom, (3) Occasionally, (4) Often, (5) Always.
- “Q10–55. Has a policy on equal opportunities among the employees”. The categories include (1) Never, (2) Seldom, (3) Occasionally, (4) Often, (5) Always.
Independent Variables. Employment activity category that the respondent is employed in:
- Industry: This is an ordinal variable with 11 categories, each of which is an area of the respondent’s employment activity. These include the following: (1) Professional services, (2) Information, (3) Transport, (4) Manufacturing, (5) Wholesale, (6) Finance, (7) Accommodation, (8) Public administration, (9) Real estate, (10) Agriculture, (11) Other.
- Sector: This is a binary variable that determines whether a respondent is employed in a public or private sector. The variable contains (1) public and (2) private categories.
Control Variables. We control for the set of demographic and cultural variables described earlier in this article that are known to have an effect on the leadership items described in the management and psychology literature (House et al. 2004; Stogdill 1974). These include the respondent’s age, gender, and culture, applying GLOBE’s country cluster approach (House et al. 2004).
The Model. Given the nature of our dependent variables, each of which is ordered categorical, we run ordinal logistic regression models on each of the five sustainability items. We denote our dependent variables for each sustainability item as , as our independent variables representing the ordinal industry/binary sector variables, and as our control variables. The general ordinal logistic regression model for each sustainability item is presented below as follows:
- represents the ordinal dependent variable for each of the five sustainability variables: (1) Q13–51. My ideal leader has the strongest focus on, (2) Q10–52. My ideal leader prioritizes gender equality in the workplace, (3) Q10–53. My ideal leader conducts many environmental CSR practices, (4) Q10–54. Conducts many ethical CSR practices, (5) Q10–55. Has a policy on equal opportunities among the employees.
- indexes the categories within each .
- are the category-specific intercepts for the ordinal outcome.
- represents the ordinal independent variable for either Industry or a binary independent variable for the public-private sector variable.
- the coefficient for the industry or sector (depending on the model) effect on sustainability item .
- are control variables for age, gender, and cultural clusters, respectively.
- are the coefficients for the control variables.
4.3. Empirical Analysis
One of the assumptions for ordered logit is that of proportional odds. That is, we assume that the effect of our independent variables is persistent and constant across each category. Our models do not show any signs of concern and seem to satisfy these conditions. This can be observed via the output of the model as it displays an intercept for each response category minus one. The movement is constant with each increase across the models (see Figure 5 and Figure 6). The empirical analysis proceeds as follows: first, we run models with independent variables on each of the five sustainability items, and then we run the same models but with the inclusion of demographic and cultural controls. The literature suggests using this approach to mitigate concerns about the suppression effect, or the control-variable produced increases in the magnitude of estimated effect sizes (Lenz and Sahn 2021). Each sustainability item represents a column with two sub-columns: one for a regression with no controls and the other for the regression with control variables included in the model.
4.3.1. Public vs. Private Sectors
To evaluate the difference in preferences for public and private sector employees on each sustainability barometer item, we first display a graph with odds ratios and confidence intervals for each of the five models, please see Figure 7 (note: these graphs are based on models that do not include control variables). Not surprisingly, public sector employees assign a higher value for each sustainability item over private sector employees (see Figure 5). The results are statistically significantly different from 0 for four models: “My ideal leader has the strongest focus on profit-environment”, “My ideal leader prioritizes gender equality in the workplace”, “My ideal leader conducts many ethical CSR practices”, “My ideal leader has a policy on equal opportunities among the employees”.
Figure 7.
Graphical representation of odds ratios for public-private sectors from ordinal logistic regressions on all five sustainability items.
The results can be further inspected in the regression Table 1 presented below. The regression table displays odds ratios as they are more straightforward to interpret (the regression with original coefficients is displayed in Appendix G and Appendix H). We observe that with or without controls, public sector employees are 55% (a more conservative estimate from the two models) more likely to prioritize the environment over profits and around 20% more likely to care about gender equality, ethical CSR practices, and equal opportunities among employees (see regression table below for more precise results). While the inclusion of the demographic and cultural controls reduces the scope of the effect, they remain statistically significant in two of the five models. When no control variables are included in the equation, the results are statistically significant for four of the five models as described above.
Table 1.
Odds Ratios: Ordinal Regressions for Sustainability Items.
4.3.2. Variation across Industries
Next, we evaluate the differences in respondent preferences across industries. We follow an identical approach outlined above—we run each model without including control variables and then with the inclusion of demographic and cultural controls; this enables us to evaluate whether the results are consistent and whether the controls have a strong effect on sustainability items. Several industries stick out. While respondents associated with Agriculture and Real estate do not seem to care much about sustainability items (particularly some specific items, such as gender equality), Professional services and public sector employees put a strong emphasis on and prioritize most sustainability items.
The graphical representation of the odds ratios for the industries across models reveals a strong variation (see Table 2 and Figure 8). Initial inspection reveals that employees associated with professional services and the public sector are more likely to choose higher categories across different sustainability items, whereas respondents who work in agriculture and real estate put very low priority sustainability items associated with gender equality and equal opportunities among employees.
Table 2.
Odds Ratios: Ordinal Regressions for Sustainability Items.
Figure 8.
Graphical representation of odds ratios for industries from ordinal logistic regressions on all five sustainability items.
Respondents associated with the Agriculture industry are 45% less likely to prioritize gender equality (the results are statistically significant). Professional services prioritize every single sustainability item—that is, the results remain statistically significantly different and over one for eight out of ten models. To be more specific, professional services are 15% to more than 60% more likely to choose a higher sustainability category compared to other industries. Similarly, public sector employees seem to prioritize sustainability (the results are positive or over one when reporting the odds ratios in nine out of ten models). However, the results are statistically significantly different from zero only for the first sustainability item—leaders should prioritize the environment over profits. Employees associated with Real estate are more than 20% less likely to emphasize equal opportunities among employees. Surprisingly, respondents who work in the Transport industry put a strong emphasis on environment over profits (the first sustainability item).
Overall, the results reveal interesting patterns across public and private sectors as well as different areas of employment activity and show strong support for hypotheses 1–3.
5. Discussion
This paper set out to investigate industry differences in preferred sustainability values in a leader and also investigated differences in second-order constructs of environment-CSR and equality orientation. With a composite sample of 5530 individuals, we were able to validate our conceptual model and provide findings with robust predictive values.
Although Reiche (2017) suggests that sustainability is everywhere, our research shows that it is not equally distributed in the sustainability preferences of followers regarding leadership. Our findings highlight the prioritization of gender equality and equal opportunities among respondents over other sustainability items, which may stem from the longstanding global recognition of the importance of addressing these issues (Hailemariam and Erdiaw-Kwasie 2023). The heightened focus on these issues could be a response to the growing awareness and advocacy around gender issues driven by movements like #MeToo and various international campaigns promoting women’s rights (Pellegrini 2018).
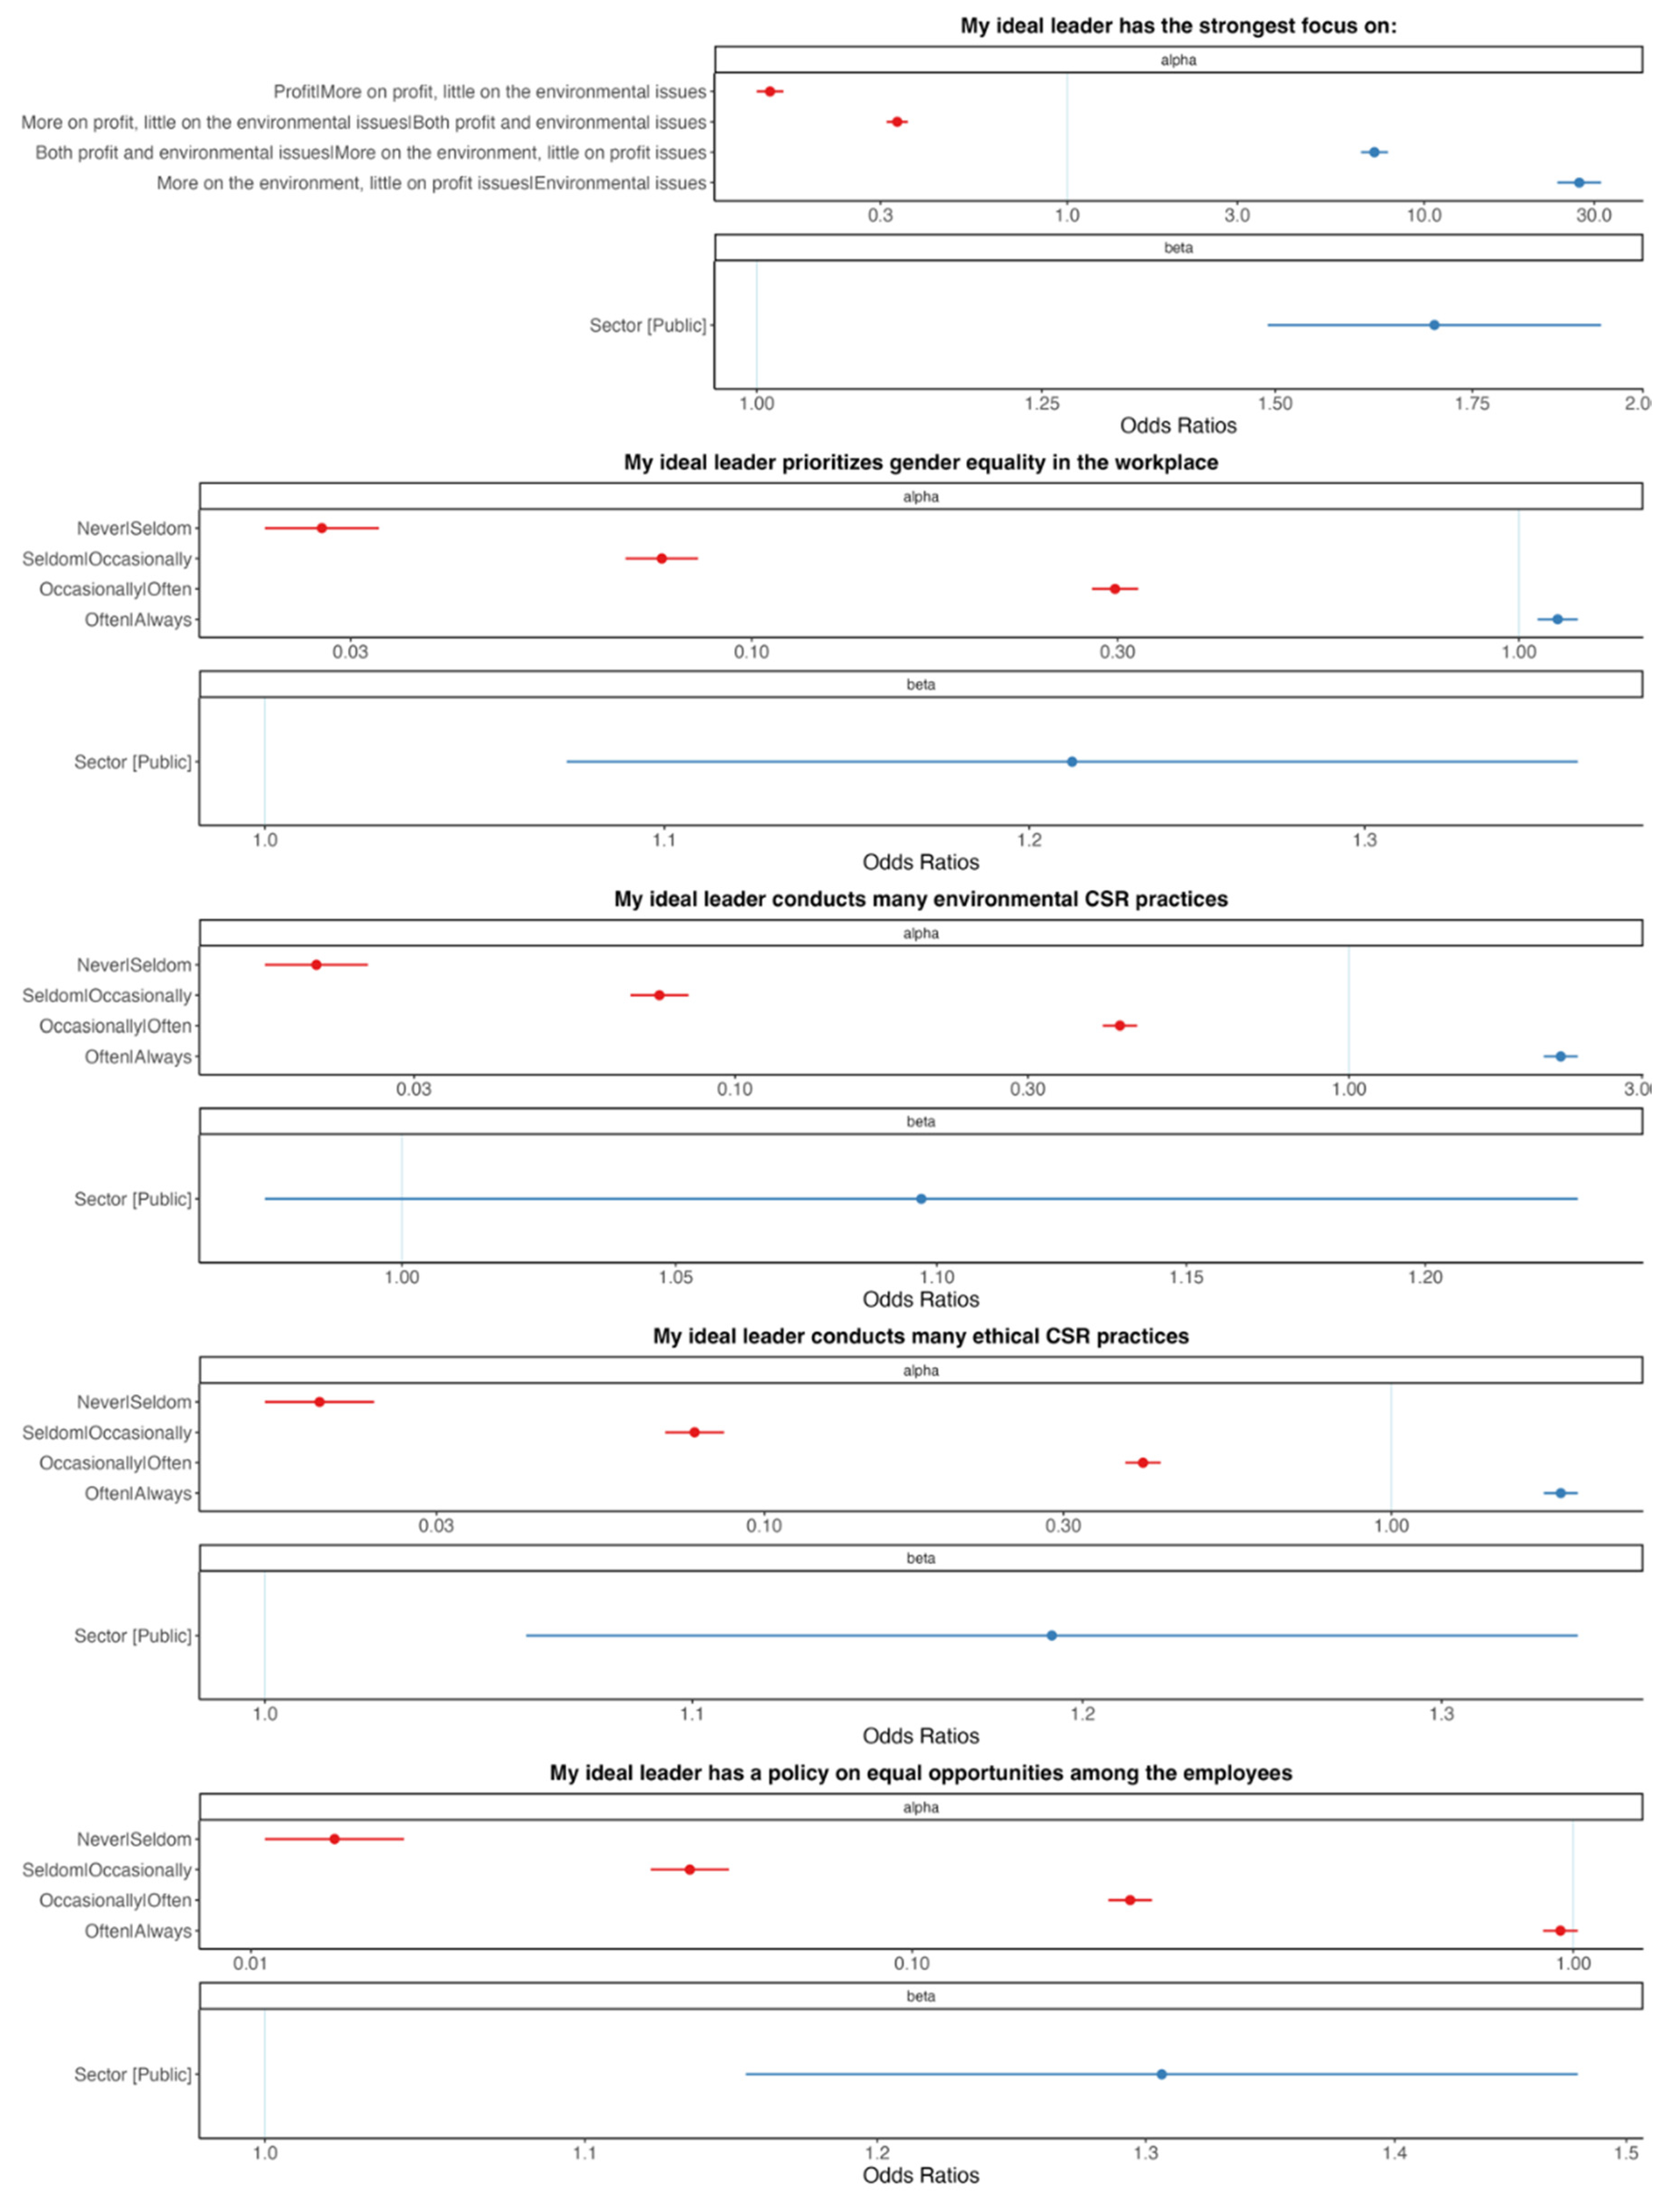
Moreover, our findings show that public sector employees assign a higher value to each sustainability item (environment focus, gender equality, ethical CSR, equal opportunities) than private sector employees. Such results align with research by Ritz et al. (2016), which suggests that employees from public service organizations have a “public service motivation” (PSM), which allows them to derive satisfaction from serving the public interest. Moreover, previous research evidenced that individuals with high PSM are more likely to seek employment in the public sector and prioritize social and communal goals over personal gain (Houston 2000; Ritz et al. 2016).
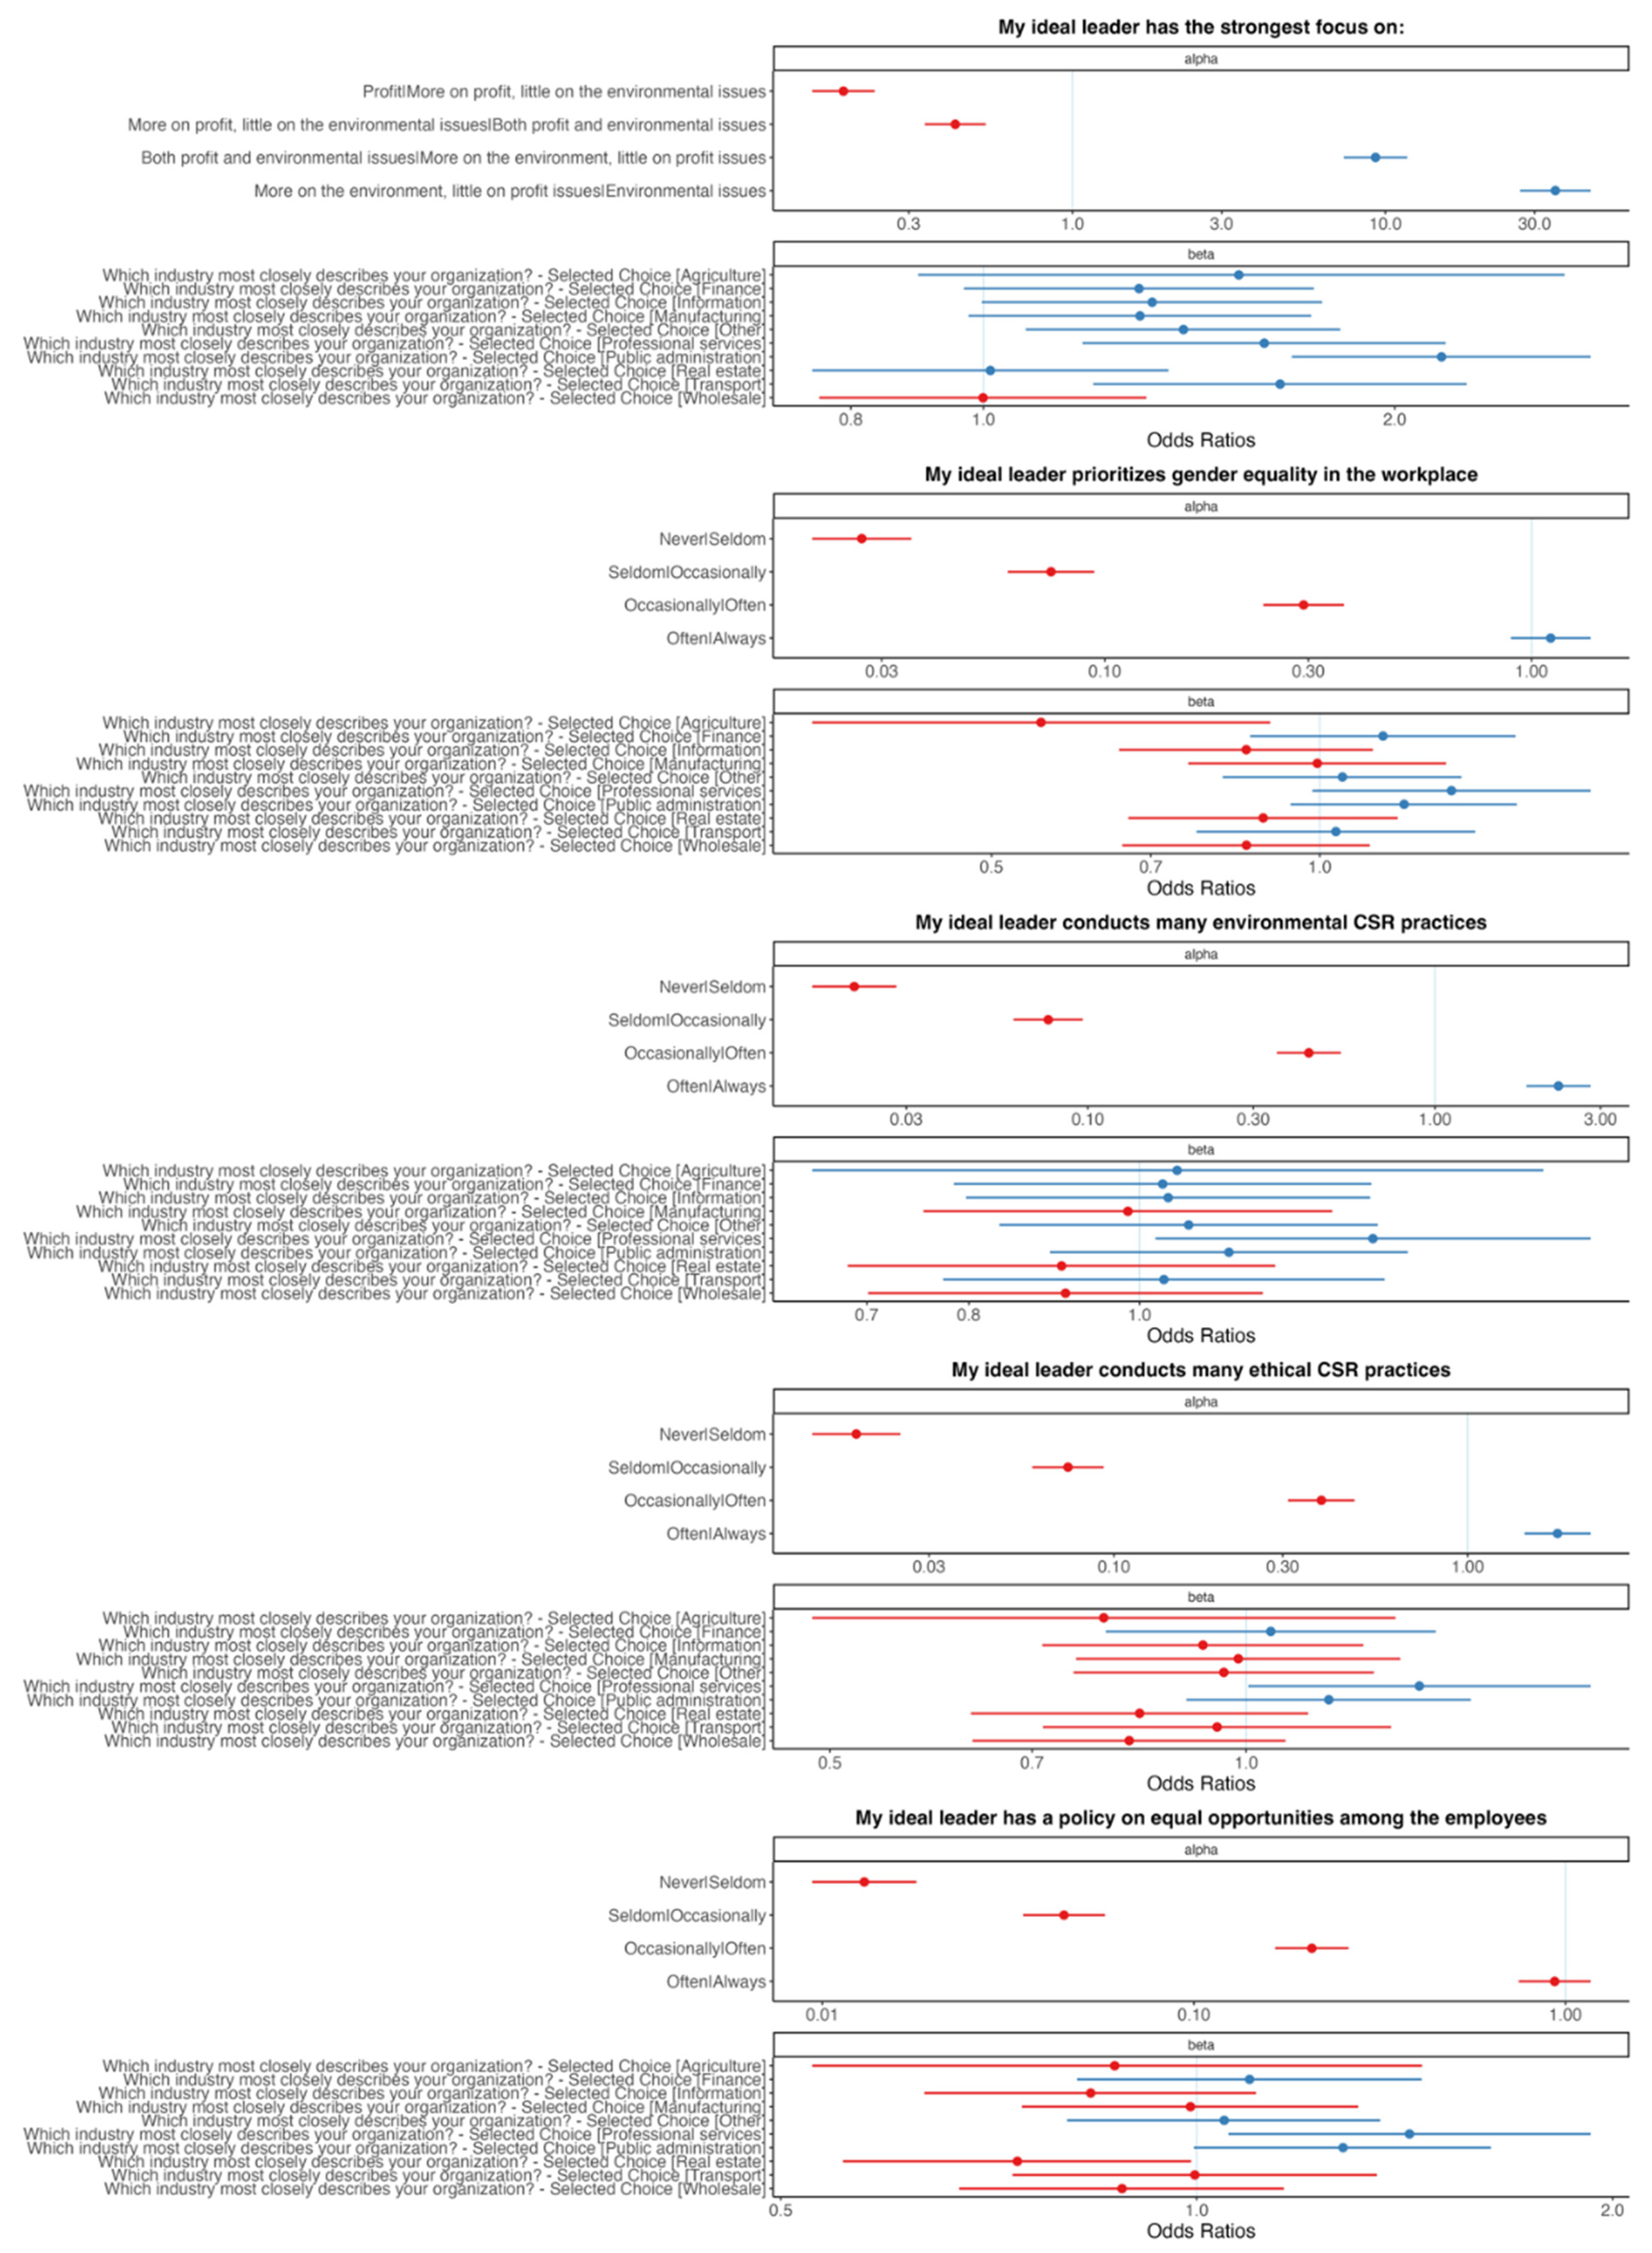
Our study also discovered the existence of industry preferences towards specific sustainability items. For example, employees from the Transport industry put a strong emphasis on the environment over profits; however, Agriculture and Real estate do not seem to place much importance on sustainability items. Although such findings, especially with regard to Agriculture, might seem counterintuitive, they are in line with the literature regarding the existence of sector cultures. That is, there are considerable differences in how much importance followers attach to the need for leaders to be oriented towards various behaviors of sustainability (Phillips 1994; Minelgaite 2016; Pizam et al. 1997).
Such findings could also potentially be explained through the “proximity paradox” where those closest to an issue (i.e., environmental impact in Agriculture) may become desensitized, leading to a lower prioritization of sustainability in daily operations. Additionally, employees of the Agricultural or Real estate sector might perceive sustainability as a constraint to profitability, especially in regions where sustainable practices are not economically incentivized. Hence, while seemingly paradoxical, the lower emphasis on sustainability items among certain industries such as Real estate or Agriculture might be attributed to a mix of psychological, economic, and contextual factors.
The industry-specific preferences towards certain sustainability items can be explained through a combination of reasons, including direct industry impact, regulatory pressures, public perception, and others. For example, employees in the Transport industry, which is a significant contributor to carbon emissions, may emphasize environmental sustainability due to direct regulatory pressures to reduce emissions and public scrutiny of their environmental impact (Lynes and Dredge 2006). In contrast, industries that are less directly impacted by environmental regulations or public pressure (i.e., Agriculture, Real estate) may not prioritize environment-related sustainability items to the same extent. Moreover, the nature of industries with immediate economic pressure can lead to a lesser focus on broader sustainability issues, while industries with direct client demands (i.e., Professional services) might naturally favor sustainable and ethical business practices due to the increasing global pressure for sustainability to become a competitive advantage and a key element of corporate reputation (Epstein 2018; Babiak and Trendafilova 2011).
Furthermore, our findings on high preference for sustainability-oriented leader behavior by professional service employees could also be attributed to the education level of the respondents. Previous research supports such a hypothesis (Vecchio and Boatwright 2002), with some attributing it to variations in scientific disciplines on reflecting upon attitudes, values, and behaviors of people (Littrell and Snaebjornsson 2016), which could also correspond to sustainability as a value.
Besides theoretical contributions, as discussed above, our research also offers important practical implications. Our research has identified and measured preferred sustainable leader behavior dimensions that are similar or different across industries. Such information can be used for the development of global leaders with regard to various sustainability items and ethical conduct and also for the education and training of leaders for success in multiple countries and across a range of industries (Akstinaitė 2023).
In addition, our research addresses previous calls for a tool or a “moral compass” for sending leaders in the right direction in terms of sustainability and ethics-related behaviors and values (Sadler-Smith and Akstinaitė 2022). Hence, an important managerial implication stemming from our findings is that the PSLO can be applied as a validated online tool or an application for organizations to map different sustainability vs. profit orientations as well as different equality expectations of employees at all levels in the organization as a “sustainability barometer”. Such a barometer can be utilized in management training to enhance self-awareness at all management levels, to prepare, educate, and develop new teams, and to strengthen the organization’s culture and sustainability reputation.
In summary, our results and the confirmation of our hypotheses offer valuable insights into the interplay between industry background, public versus private sector employees, and the prioritization of different aspects of sustainability leadership.
6. Conclusions, Limitations, and Future Research
The findings of this study have confirmed that although the sustainability focus is growing globally, the industry background impacts a follower’s Preferred Sustainability Leadership Orientation. Our research builds on the earlier paper by Warner-Søderholm et al. (2021), confirming the significance of Preferred Sustainability Leadership Orientation and extends the research by providing empirical findings from 11 countries to test and confirm the original conceptual model.
All studies have limitations, as is the case with this present study. We have a limited dataset from 11 countries, and we only focus on one demographic outcome variable: industry background. Future research could also include demographic items to investigate seniority and years worked in each industry to tease out possible nuances on industry impact. Another limitation is that the demographic aspects of culturally endorsed leadership data are only applied as control variables. Future research should study these more in depth and develop the project into a larger global study and investigate the predictive values of all demographics, including gender, age, educational level, and nationality. Another limitation might arise due to the potential impact of possible positive question phrasing on the participant responses as we apply traditional survey question frameworks used in the literature over the last 60 years. Future research could investigate if more neutral question phrasing has an impact on the responses, both in this study and in other international leadership studies.
Despite the above-mentioned limitations, this research has successfully discovered an answer to the probing question, “do followers prefer a leader with sustainability orientation”? Empirically proven results of this study point to a clear answer: yes, they do. Such preference is an indication of a significant shift in leadership expectations, where leaders are now expected to integrate sustainability into their strategic organizational vision. In line, the varying sustainability item preferences across different sectors and industries point to the nuanced understanding of sustainability by the followers in various domains. All in all, the sustainability-oriented leadership trend is likely to continue to grow. Hence, organizations and leaders across all sectors must adapt to the evolving expectations of their followers, recognizing that effective leadership today entails a strong commitment to sustainable practices.
Author Contributions
Conceptualization: I.M., S.Č., V.A. and G.W.-S., Methodology; G.W.-S., I.M. and S.Č., formal analysis: I.M., G.W.-S. and S.Č.; writing of original draft; G.W.-S., I.M., S.Č. and V.A., Review and editing; I.M., V.A., S.Č. and G.W.-S., Visualization: S.Č. All authors have read and agreed to the published version of the manuscript.
Funding
This research received no external funding.
Institutional Review Board Statement
No specific ethics board application to start the study was required as we meet the ethical standards within the EU GDPR data protection requirements set by European Commission (europa.eu), and we are not including medical trails on humans or animals in our research. In addition, we detail and confirm in our manuscript footnote, which co-author contributed to the development of each section, to secure that we meet the San Fransisco protocol for ethical co-authorship. (sfdora.org).
Informed Consent Statement
Informed consent was obtained from all subjects involved in the study.
Data Availability Statement
Please contact corresponding author for dataset.
Conflicts of Interest
The authors declare no conflicts of interest.
Appendix A. My Ideal Leader Has the Strongest Focus on
| Which Industry Most Closely Describes Your Organization? | Profit | More on Profit, Little on the Environmental Issues | Both Profit and Environmental Issues | More on the Environment, Little on Profit Issues | Environmental Issues |
| Accommodation | 46 | 44 | 182 | 18 | 11 |
| Agriculture | 7 | 16 | 30 | 10 | 7 |
| Finance | 55 | 48 | 265 | 35 | 17 |
| Information | 66 | 56 | 299 | 46 | 21 |
| Manufacturing | 64 | 50 | 294 | 43 | 16 |
| Other | 73 | 89 | 504 | 48 | 33 |
| Professional services | 33 | 45 | 225 | 46 | 10 |
| Public administration | 80 | 106 | 810 | 148 | 67 |
| Real estate | 66 | 46 | 226 | 32 | 9 |
| Transport | 37 | 41 | 191 | 51 | 11 |
| Wholesale | 99 | 66 | 358 | 37 | 16 |
Appendix B. My Ideal Leader Has a Policy on Equal Opportunities among the Employees
| Which Industry Most Closely Describes Your Organization?—Selected Choice | Never | Seldom | Occasionally | Often | Always |
| Accommodation | 8 | 17 | 39 | 73 | 165 |
| Agriculture | 4 | 2 | 10 | 18 | 36 |
| Finance | 4 | 12 | 46 | 135 | 224 |
| Information | 3 | 19 | 67 | 174 | 225 |
| Manufacturing | 6 | 10 | 60 | 155 | 237 |
| Other | 12 | 19 | 103 | 218 | 404 |
| Professional services | 3 | 6 | 32 | 103 | 214 |
| Public administration | 10 | 31 | 119 | 359 | 697 |
| Real estate | 5 | 14 | 63 | 130 | 166 |
| Transport | 0 | 12 | 52 | 92 | 173 |
| Wholesale | 12 | 15 | 85 | 181 | 280 |
Appendix C. My Ideal Leader Conducts Many Ethical CSR Practices
| Which Industry Most Closely Describes Your Organization?—Selected Choice | Never | Seldom | Occasionally | Often | Always |
| Accommodation | 8 | 23 | 62 | 90 | 119 |
| Agriculture | 3 | 8 | 10 | 27 | 22 |
| Finance | 6 | 16 | 90 | 158 | 151 |
| Information | 8 | 30 | 100 | 187 | 163 |
| Manufacturing | 7 | 23 | 103 | 169 | 166 |
| Other | 18 | 31 | 174 | 265 | 268 |
| Professional services | 4 | 10 | 60 | 137 | 147 |
| Public administration | 20 | 57 | 222 | 447 | 470 |
| Real estate | 6 | 23 | 90 | 140 | 119 |
| Transport | 6 | 15 | 75 | 120 | 114 |
| Wholesale | 13 | 37 | 136 | 203 | 184 |
Appendix D. My Ideal Leader Conducts Many Environmental CSR Practices
| Which Industry Most Closely Describes Your Organization? | Never | Seldom | Occasionally | Often | Always |
| Accommodation | 9 | 16 | 73 | 104 | 100 |
| Agriculture | 2 | 3 | 14 | 29 | 21 |
| Finance | 4 | 24 | 96 | 166 | 130 |
| Information | 5 | 22 | 112 | 203 | 146 |
| Manufacturing | 11 | 23 | 107 | 187 | 140 |
| Other | 16 | 34 | 168 | 295 | 241 |
| Professional services | 7 | 17 | 62 | 137 | 135 |
| Public administration | 25 | 54 | 253 | 485 | 398 |
| Real estate | 8 | 20 | 98 | 142 | 110 |
| Transport | 7 | 15 | 78 | 125 | 105 |
| Wholesale | 13 | 33 | 141 | 220 | 166 |
Appendix E. My Ideal Leader Prioritizes Gender Equality in the Workplace
| Which Industry Most Closely Describes Your Organization? | Never | Seldom | Occasionally | Often | Always |
| Accommodation | 9 | 12 | 57 | 75 | 149 |
| Agriculture | 5 | 8 | 9 | 24 | 24 |
| Finance | 12 | 16 | 59 | 119 | 215 |
| Information | 12 | 26 | 74 | 172 | 204 |
| Manufacturing | 9 | 25 | 70 | 144 | 220 |
| Other | 21 | 29 | 112 | 228 | 366 |
| Professional services | 8 | 13 | 52 | 86 | 199 |
| Public administration | 29 | 44 | 160 | 355 | 628 |
| Real estate | 11 | 17 | 71 | 108 | 171 |
| Transport | 5 | 16 | 54 | 95 | 160 |
| Wholesale | 17 | 22 | 106 | 181 | 247 |
Appendix F. Bar Charts for Sustainability Leadership Orientation Items by Industry

Appendix G. Ordinal Logistic Regressions with Original Coefficients: Sustainability Items and Private-Public Sectors
| Dependent Variable: | ||||||||||
| Has the Strongest Focus on Profit-Environment | Prioritizes Gender Equality in the Workplace | Conducts Many Environmental CSR Practices | Conducts Many Ethical CSR Practices | Has a Policy on Equal Opportunities among the Employees | ||||||
| (1) | (2) | (3) | (4) | (5) | (6) | (7) | (8) | (9) | (10) | |
| Public Sector compared to Private Sector | 0.530 *** | 0.438 *** | 0.193 *** | 0.056 | 0.093 | −0.001 | 0.175 *** | 0.034 | 0.267 *** | 0.141 ** |
| (0.067) | (0.069) | (0.062) | (0.064) | (0.060) | (0.062) | (0.060) | (0.062) | (0.063) | (0.066) | |
| Demographic and Cultural Controls | ✓ | ✓ | ✓ | ✓ | ✓ | |||||
| Observations | 5349 | 5339 | 5360 | 5350 | 5355 | 5345 | 5360 | 5350 | 5359 | 5349 |
| Note: Standard errors in the parentheses. ** p < 0.05, *** p < 0.01. Tick icons confirm specific observations | ||||||||||
Appendix H. Ordinal Logistic Regressions: Sustainability and Industries with Original Coefficients
| Dependent Variable: | ||||||||||
| Has the Strongest Focus on Profit-Environment | Prioritizes Gender Equality in the Workplace | Conducts Many Environmental CSR Practices | Conducts Many Ethical CSR Practices | Has a Policy on Equal Opportunities among the Employees | ||||||
| (1) | (2) | (3) | (4) | (5) | (6) | (7) | (8) | (9) | (10) | |
| Agriculture | 0.430 | 0.411 | −0.589 ** | −0.544 ** | 0.049 | −0.010 | −0.237 | −0.229 | −0.137 | −0.105 |
| (0.278) | (0.281) | (0.246) | (0.248) | (0.244) | (0.247) | (0.248) | (0.250) | (0.259) | (0.263) | |
| Finance | 0.262 * | 0.174 | 0.134 | 0.153 | 0.030 | −0.105 | 0.041 | 0.010 | 0.088 | 0.089 |
| (0.150) | (0.153) | (0.143) | (0.145) | (0.139) | (0.141) | (0.140) | (0.143) | (0.146) | (0.149) | |
| Information | 0.284 * | 0.195 | −0.155 | −0.092 | 0.038 | −0.122 | −0.072 | −0.095 | −0.177 | −0.167 |
| (0.146) | (0.151) | (0.137) | (0.141) | (0.135) | (0.139) | (0.136) | (0.141) | (0.141) | (0.145) | |
| Manufacturing | 0.264 * | 0.158 | −0.005 | 0.055 | −0.015 | −0.102 | −0.013 | 0.006 | −0.010 | 0.019 |
| (0.147) | (0.151) | (0.139) | (0.143) | (0.136) | (0.140) | (0.138) | (0.142) | (0.143) | (0.147) | |
| Other | 0.337 ** | 0.232 * | 0.048 | −0.013 | 0.064 | −0.032 | −0.037 | −0.106 | 0.046 | −0.038 |
| (0.135) | (0.137) | (0.129) | (0.130) | (0.126) | (0.127) | (0.128) | (0.129) | (0.133) | (0.135) | |
| Professional services | 0.473 *** | 0.343 ** | 0.278 * | 0.271 * | 0.305 ** | 0.139 | 0.288 ** | 0.232 | 0.355 ** | 0.335 ** |
| (0.156) | (0.159) | (0.150) | (0.153) | (0.145) | (0.148) | (0.145) | (0.149) | (0.154) | (0.158) | |
| Public administration | 0.772 *** | 0.617 *** | 0.178 | 0.059 | 0.117 | −0.053 | 0.138 | −0.008 | 0.244 * | 0.124 |
| (0.128) | (0.131) | (0.122) | (0.124) | (0.119) | (0.122) | (0.121) | (0.123) | (0.126) | (0.129) | |
| Real estate | 0.012 | 0.022 | −0.119 | −0.052 | −0.102 | −0.102 | −0.177 | −0.106 | −0.299 ** | −0.252 * |
| (0.153) | (0.155) | (0.145) | (0.147) | (0.143) | (0.144) | (0.143) | (0.145) | (0.148) | (0.150) | |
| Transport | 0.500 *** | 0.465 *** | 0.034 | 0.050 | 0.032 | −0.020 | −0.048 | −0.025 | −0.003 | 0.015 |
| (0.161) | (0.162) | (0.150) | (0.152) | (0.147) | (0.149) | (0.148) | (0.150) | (0.155) | (0.158) | |
| Wholesale | −0.0003 | 0.004 | −0.155 | −0.124 | −0.097 | −0.100 | −0.195 | −0.117 | −0.124 | −0.053 |
| (0.141) | (0.142) | (0.133) | (0.135) | (0.132) | (0.133) | (0.133) | (0.135) | (0.138) | (0.140) | |
| Demographic and Cultural Controls | ✓ | ✓ | ✓ | ✓ | ✓ | |||||
| Observations | 5349 | 5339 | 5360 | 5350 | 5355 | 5345 | 5360 | 5350 | 5359 | 5349 |
| Note: Standard errors in the parentheses. * p < 0.10, ** p < 0.05, *** p < 0.01. Tick icon denotes specific observations | ||||||||||
Appendix I. Follower Endorsed Effective Leadership and Sustainability Survey Items
| 1. Acts as the spokesman of the group |
| 2. Waits patiently for the results of a decision |
| 3. Gets along well with the people above him/her |
| 4. Publicises the activities of the group |
| 5. His/her arguments are convincing |
| 6. Fails to take necessary action |
| 7. Keeps the group working together as a team |
| 8. Speaks as the representative of the group |
| 9. Argues persuasively for his/her point of view |
| 10. Encourages initiative in the group members |
| 11. Puts suggestions made by the group into operation |
| 12. Seems able to predict what is coming next |
| 13. Accepts delays without becoming upset |
| 14. Is a very persuasive talker |
| 15. Lets the members do their work the way they think best |
| 16. Lets some members take advantage of him/her |
| 17. Treats all group members as his/her equals |
| 18. Keeps the work moving at a rapid pace |
| 19. His/her superiors act favourably on most of his/her suggestions |
| 20. Represents the group at outside meetings |
| 21. Is very skillful in an argument |
| 22. Is the leader of the group in name only |
| 23. Gives advance notice of changes |
| 24. Pushes for increased production |
| 25. Things usually turn out as he/she predicts |
| 26. Assigns group members to particular tasks |
| 27. Backs down when he/she ought to stand firm |
| 28. Is accurate in predicting the trend of events |
| 29. Gets his/her superiors to act for the welfare of the group members |
| 30. Is overwhelmed by situations requiring attention to many details |
| 31. Faced with problems, can wait patiently for a time, but then reacts with anger or annoyance |
| 32. Sees to it that the work of the group is coordinated |
| 33. His/her word carries weight with superiors |
| 34. His/her behavior tends to make complex and confused situations worse. |
| 35. Remains calm when uncertain about coming events |
| 36. Schedules the work to be done |
| 37. Allows the group a high degree of initiative |
| 38. Is willing to make changes |
| 39. Drives hard when there is a job to be done |
| 40. Helps group members settle their differences |
| 41. Gets what he/she asks for from his/her superiors |
| 42. Is able to delay action until the proper time occurs |
| 43. Maintains definite standards of performance |
| 44. Trusts members to exercise good judgement |
| 45. Urges the group to beat its previous record |
| 46. Anticipates problems and plans for them |
| 47. Gets confused when too many demands are made of him/her |
| 48. Worries about the outcome of any new procedure |
| 49. Asks that group members follow standard rules and regulations |
| 50. Keeps the group working up to capacity |
| 51. My ideal leader prioritizes gender equality in the workplace |
| 52. My ideal leader conducts many environmental CSR practices |
| 53. Conducts many ethical CSR practices |
| 54. Has a policy on equal opportunities among the employees |
| 55. My ideal leader has the strongest focus on: |
| Profit both profit and environmental issues environmental issues |
| 1 2 3 4 5 |
References
- Abdullah, Zulhamri, and Yuhanis Abdul Aziz. 2013. Institutionalizing corporate social responsibility: Effects on corporate reputation, culture, and legitimacy in Malaysia. Social Responsibility Journal 9: 344–61. [Google Scholar] [CrossRef]
- Akstinaitė, Vita. 2023. Understanding hubris and heuristics in CEO decision-making: Implications for management. Organizational Dynamics 52: 100–978. [Google Scholar] [CrossRef]
- Amir, Ahmed. 2023. The Rise of ESG: Sustainable Investing Becomes the New Norm. Available online: https://www.linkedin.com/pulse/rise-esg-sustainable-investing-becomes-new-norm-ali-amir-fcca/ (accessed on 4 January 2024).
- Aragón-Correa, J. Alberto, Nuria Hurtado-Torres, Sanjay Sharma, and Víctor J. García-Morales. 2008. Environmental strategy and performance in small firms: A resource-based perspective. Journal of Environmental Management 86: 88–103. [Google Scholar] [CrossRef]
- Babiak, Kathy, and Sylvia Trendafilova. 2011. CSR and environmental responsibility: Motives and pressures to adopt green management practices. Corporate Social Responsibility and Environmental Management 18: 11–24. [Google Scholar] [CrossRef]
- Bansal, Pratima, and Kendall Roth. 2000. Why companies go green: A model of ecological responsiveness. Academy of Management Journal 43: 717–36. [Google Scholar] [CrossRef]
- Bressler, R. Daniel. 2024. Science and Challenges of Sustainability. In Sustainability: Business and Investment Implications. Singapore: World Scientific Publishing Co. Pte. Ltd., pp. 9–38. [Google Scholar]
- Brislin, Richard W. 1970. Back-translation for cross-cultural research. Journal of Cross-Cultural Psychology 1: 185–216. [Google Scholar] [CrossRef]
- Brønn, Peggy Simcic, and Deborah Vidaver-Cohen. 2009. Corporate motives for social initiative: Legitimacy, sustainability, or the bottom line? Journal of Business Ethics 87: 91–109. [Google Scholar] [CrossRef]
- Choi, Yongrok, and Yanni Yu. 2014. The influence of perceived corporate sustainability practices on employees and organizational performance. Sustainability 6: 348–64. [Google Scholar] [CrossRef]
- Di Fabio, Annamaria, and José María Peiró. 2018. Human Capital Sustainability Leadership to promote sustainable development and healthy organizations: A new scale. Sustainability 10: 2413. [Google Scholar] [CrossRef]
- Dunlap, Riley E., Kent D. Van Liere, Angela G. Mertig, and Robert Emmet Jones. 2000. New trends in measuring environmental attitudes: Measuring endorsement of the new ecological paradigm: A revised NEP scale. Journal of Social Issues 56: 425–42. [Google Scholar] [CrossRef]
- Eagle, Lynne, Peter Case, David Low, and Lisa Vandommele. 2015. Attitudes of undergraduate business students toward sustainability issues. International Journal of Sustainability in Higher Education 16: 650–68. [Google Scholar] [CrossRef]
- Epstein, Marc J. 2018. Making Sustainability Work: Best Practices in Managing and Measuring Corporate Social, Environmental AND Economic Impacts. London: Routledge. [Google Scholar]
- European Parliament. 2023. Deal on New EU rules to Make Sustainable Products the Norm. Available online: https://www.europarl.europa.eu/news/en/press-room/20231204IPR15634/deal-on-new-eu-rules-to-make-sustainable-products-the-norm (accessed on 7 January 2024).
- Fernandez, Todd, Jacqueline Doyle, Allison Godwin, Hank Boone, Dina Verdin, Lisa Benson, Adam Kirn, and Geoff Potvin. 2016. More Comprehensive and Inclusive Approaches to Demographic Data Collection. Paper presented at the 2016 ASEE Annual Conference and Exposition, New Orleans, LA, USA, June 26–29. [Google Scholar]
- Gericke, Niklas, Teresa Berglund, Jelle Boeve-de Pauw, and Daniel Olsson. 2019. The Sustainability Consciousness Questionnaire: The theoretical development and empirical validation of an evaluation instrument for stakeholders working with sustainable development. Sustainable Development 27: 35–49. [Google Scholar] [CrossRef]
- Gerlich, Michael. 2023. How Short-Term Orientation Dominates Western Businesses and the Challenges They Face—An Example Using Germany, the UK, and the USA. Administrative Sciences 13: 25. [Google Scholar] [CrossRef]
- Gorden, William I., Carolyn M. Anderson, and Stephen D. Bruning. 1992. Employee perceptions of corporate partnership: An affective-moral quid pro quo. Employee Responsibilities and Rights Journal 5: 75–85. [Google Scholar] [CrossRef]
- Hailemariam, Abebe, and Michael Odei Erdiaw-Kwasie. 2023. Towards a circular economy: Implications for emission reduction and environmental sustainability. Business Strategy and the Environment 32: 1951–65. [Google Scholar] [CrossRef]
- Hoffman, Andrew John. 2018. The next phase of business sustainability. Stanford Social Innovation Review 16: 34–39. [Google Scholar] [CrossRef]
- House, Robert J., Mansour Javidan, Paul J. Hanges, Peter W. Dorfman, and Vipin Gupta, eds. 2004. Culture, Leadership, and Organizations: The GLOBE Study of 62 Societies. Thousand Oaks: Sage Publications. [Google Scholar]
- Houston, David J. 2000. Public-service motivation: A multivariate test. Journal of Public Administration Research and Theory 10: 713–28. [Google Scholar] [CrossRef]
- Jutras, Cory. 2009. The ROI of Sustainability: Making the Business Case. Available online: http://www.aberdeen.com/summary/report/benchmark/5908-RA-sustainability-environmental-stewardship.asp (accessed on 6 January 2024).
- Kristinsson, Kári, Inga Minelgaite, and Olga Stangej. 2022. In the eye of the beholder? Gendered perception of ceos ethical and unethical leadership. Economics & Sociology 15: 21–38. [Google Scholar]
- Lenz, Gabriel S., and Alexander Sahn. 2021. Achieving Statistical Significance with Control Variables and Without Transparency. Political Analysis 29: 356–69. [Google Scholar] [CrossRef]
- Littrell, Romie Frederick, and Inga Minelgaite Snaebjornsson. 2016. Comparison of managerial leadership behavior preferences across nationalities, industries, and gender. Paper presented at Academy of International Business 2016 Conference, New Orleans, LA, USA, June 27–30. [Google Scholar]
- Littrell, Romie Frederick, Inga Minelgaite, Gillian Warner-Søderholm, Serene Dalati, Yaghoub Ahmadi, Andrew Bertsch, and Valentina Kuskova. 2018. Explicit preferred leader behaviours across cultures: Instrument development and validation. Journal of Management Development 37: 243–57. [Google Scholar] [CrossRef]
- Lord, Robert G., and Karen J. Maher. 2002. Leadership and Information Processing: Linking Perceptions and Performance. London: Routledge. [Google Scholar]
- Lynes, Jennifer K., and Dianne Dredge. 2006. Going green: Motivations for environmental commitment in the airline industry. A case study of Scandinavian Airlines. Journal of Sustainable Tourism 14: 116–38. [Google Scholar] [CrossRef]
- McCann, Jack, and Matthew Sweet. 2014. The perceptions of ethical and sustainable leadership. Journal of Business Ethics 121: 373–83. [Google Scholar] [CrossRef]
- Milfont, Taciano L., and John Duckitt. 2010. The environmental attitudes inventory: A valid and reliable measure to assess the structure of environmental attitudes. Journal of Environmental Psychology 30: 80–94. [Google Scholar] [CrossRef]
- Minelgaite, Inga, Bjarnveig Birta Bjarnadottir, and Kari Kristinsson. 2021. Walking the Talk? Sustainability in New Product Development Projects in the Icelandic Seafood Industry. In Research on Project, Programme and Portfolio Management: Integrating Sustainability into Project Management. Berlin/Heidelberg: Springer International Publishing, pp. 137–49. [Google Scholar]
- Minelgaite, Inga, Svala Guðmundsdóttir, Árelía E. Guðmundsdóttir, and Olga Stangej. 2018. Demystifying Leadership in Iceland: An Inquiry Into Cultural, Societal, and Entrepreneurial Uniqueness. Berlin/Heidelberg: Springer. [Google Scholar]
- Minelgaite, Inga. 2016. Ideal leader profiles in the Icelandic business sector: Evidence of uniformity of followers’ attitudes. Tímarit um viðskipti og efnahagsmál 13: 97–118. [Google Scholar]
- Mitchell, Marie S., and Maureen L. Ambrose. 2007. Abusive supervision and workplace deviance and the moderating effects of negative reciprocity beliefs. Journal of Applied Psychology 92: 1159. [Google Scholar] [CrossRef]
- Northouse, Peter G. 2021. Leadership: Theory and Practice. Thousand Oaks: Sage Publications. [Google Scholar]
- Office for National Statistics. 2024. Who Works in the Public Sector? Available online: https://www.ons.gov.uk/ (accessed on 19 December 2023).
- Pellegrini, Ann. 2018. MeToo: Before and after. Studies in Gender and Sexuality 19: 262–64. [Google Scholar] [CrossRef]
- Phillips, Margaret E. 1994. Industry mindsets: Exploring the cultures of two macro-organizational settings. Organization Science 5: 384–402. [Google Scholar] [CrossRef]
- Pizam, Abraham, Connie Mok, Ray Pine, and Jae Young Shin. 1997. Nationality vs. industry cultures: Which has a greater effect on managerial behavior? International Journal of Hospitality Management 16: 127–45. [Google Scholar] [CrossRef]
- Pulusella, Martina. 2020. Analysis of Preferred Leadership Behaviors of Italian Managers: A focus on Sustainability Orientation. Biblioteche e Archivi. Available online: https://www.politesi.polimi.it/handle/10589/170239 (accessed on 25 February 2024).
- Quinn, Laura, and Maxine Dalton. 2009. Leading for sustainability: Implementing the tasks of leadership. Corporate Governance: The International Journal of Business in Society 9: 21–38. [Google Scholar] [CrossRef]
- Reiche, André. 2017. Sustainability 4.0. Available online: http://www.resilience.org/stories/2017-01-19/sustainability-4-0 (accessed on 10 November 2023).
- Reichheld, Ashley, John Peto, and Cory Ritthaler. 2023. Research: Consumers’ Sustainability Demands Are Rising. Available online: https://hbr.org/2023/09/research-consumers-sustainability-demands-are-rising (accessed on 28 December 2023).
- Ritz, Adrian, Gene A. Brewer, and Oliver Neumann. 2016. Public service motivation: A systematic literature review and outlook. Public Administration Review 76: 414–26. [Google Scholar] [CrossRef]
- Ročkutė, Kristina, Ligita Zailskaitė-Jakštė, Inga Minelgaité, and Robertas Damaševičius. 2018. Brand awareness in the context of mistrust: The case study of an employment agency. Sustainability 10: 695. [Google Scholar] [CrossRef]
- Sadler-Smith, Eugene, and Vita Akstinaitė. 2022. Human hubris, anthropogenic climate change, and an environmental ethic of humility. Organization & Environment 35: 446–67. [Google Scholar]
- Sanders, Nada R., and John D. Wood. 2024. Foundations of Sustainable Business. Hoboken: John Wiley & Sons. [Google Scholar]
- Shao, Jing, and Enes Ünal. 2019. What do consumers value more in green purchasing? Assessing the sustainability practices from demand side of business. Journal of Cleaner Production 209: 1473–83. [Google Scholar] [CrossRef]
- Singh, Suman, Praveen Kumar Sharma, Shivani Chaturvedi, Prashant Kumar, Ashween Deepak Nannaware, Alok Kalra, and Prasant Kumar Rout. 2024. Biocatalyst for the synthesis of natural flavouring compounds as food additives: Bridging the gap for a more sustainable industrial future. Food Chemistry 435: 137–217. [Google Scholar] [CrossRef] [PubMed]
- Stogdill, Ralph M. 1974. Handbook of Leadership: A Survey of Theory and Research. Hong Kong: Free Press. [Google Scholar]
- United Nations. 2015. Sustainable Development Goals. United Nations Development Programme. Available online: https://www.undp.org (accessed on 15 August 2015).
- United Nations. 2023. The 17 Goals. Available online: https://www.un.org/ (accessed on 19 December 2023).
- Van Dierendonck, Dirk, Sigrún Gunnarsdóttir, Milton Sousa, Jari Hakanen, Andrea Bobbio, Emin Cihan, Duyan Armin, Pircher Verdorfer, and Raquel Rodriguez-Carvajal. 2017. The cross-cultural invariance of the servant leadership survey: A comparative study across eight countries. Administrative Sciences 7: 8. [Google Scholar] [CrossRef]
- Vecchio, Robert P., and Karyn J. Boatwright. 2002. Preferences for idealized styles of supervision. The Leadership Quarterly 13: 327–42. [Google Scholar] [CrossRef]
- Warner-Søderholm, Gillian, Inga Minelgaité, and Romie Frederick Littrell. 2021. Measuring follower-endorsed effective leadership and sustainability values across cultures. Journal of International Doctoral Research 8: 6–26. [Google Scholar]
- Warner-Søderholm, Gillian, Inga Minelgaite, and Romie Frederick Littrell. 2019. From LBDQXII to LBDQ50: Preferred leader behavior measurement across cultures. Journal of Management Development 39: 68–81. [Google Scholar] [CrossRef]
- Yol Lee, Su, and Seung-Kyu Rhee. 2007. The change in corporate environmental strategies: A longitudinal empirical study. Management Decision 45: 196–216. [Google Scholar] [CrossRef]
Disclaimer/Publisher’s Note: The statements, opinions and data contained in all publications are solely those of the individual author(s) and contributor(s) and not of MDPI and/or the editor(s). MDPI and/or the editor(s) disclaim responsibility for any injury to people or property resulting from any ideas, methods, instructions or products referred to in the content. |
© 2024 by the authors. Licensee MDPI, Basel, Switzerland. This article is an open access article distributed under the terms and conditions of the Creative Commons Attribution (CC BY) license (https://creativecommons.org/licenses/by/4.0/).