Abstract
Due to constant change in the marketplace, it can be difficult for companies to secure the material, human, and technological resources necessary for competitive innovation activities. In this sense, and to overcome these constraints, the open innovation model is a quite successful approach, where the sharing of resources among companies allows the formation of an innovation ecosystem. However, the execution time of these projects can be negatively affected if the performance of each work team is not taken into account. In this work, the application of the agile approach in open innovation projects is proposed as a way to reduce the uncertainty both in the execution time of the projects and in the respective implementation costs. In this sense, a methodology for optimal team assignment for agile teams in open innovation projects according to their performance on each project task is developed to determine the optimal team assignment that leads to the shortest project execution time. This methodology will support decision making in the project management of open innovation projects, especially in the selection of the internal and external work teams that will participate in a given innovation project. The application of the proposed methodology is illustrated with an example describing and analyzing the different steps of its application. The results show that with the proposed methodology it is possible to take into account the performance of each team when calculating the project execution time and that the project execution time varies depending on the assignment of the agile teams to the project tasks. It is also shown that it is possible to determine the optimal assignment with the shortest project execution time.
1. Introduction
In order to take advantage of the application of the agile methodology in open innovation projects where different teams are involved in different tasks, it is necessary to distribute them according to their capabilities in order to avoid the occurrence of agile management failures in a given task. In this sense, a model is needed to support the decision-making process in the selection and distribution of agile teams to the different tasks of the project according to their suitability/performance for the task, with the aim of keeping the project duration as short as possible. In this way, mistakes in agile teams that negatively affect the execution time of open innovation projects can be avoided.
The Agile methodology, launched in 2001 by the vision of Alistair Cockburn and Jim Highsmith and popularized by the Agile Manifesto, aims to draw attention to the need for a paradigm shift in the software industry by focusing on four fundamental aspects, namely people and their respective interactions, the product, collaboration with the customer, and responsiveness to change. The reasons that led to this initiative were the need to improve communication between software development teams and to improve communication between these teams and customers in order to increase customer satisfaction and reduce waste. (Fowler and Highsmith 2001).
Open innovation projects, apart from their peculiarities due to the way they work, must also be managed according to classical management principles (Oh and Choi 2020). One of these principles is based on the three management constraints, also called the iron triangle, namely the cost, scope, and execution time of the project. These factors are synergistically related, meaning that a deviation in any one of these factors will negatively impact the other two (Zid et al. 2020). This premise applies to the management of all types of projects, including open innovation projects (Pollack et al. 2018). Despite the undeniable benefits, open innovation brings with it a number of well-known and documented challenges, namely strategic, cultural, legal, and operational (Bogers et al. 2018).
There are numerous works in the literature that propose solutions to these challenges and present different architectures of open innovation systems (Naqshbandi and Tabche 2018; Yun and Liu 2019; Yuana et al. 2021). However, in terms of operational management, i.e., the three constraining factors in managing projects, the work presented in the literature is very limited in the context of open innovation.
On the other hand, agile teams are better prepared for the reality of open innovation because of their great adaptability to different scenarios and realities and can even remove some of the problems of the open innovation approach from the equation. For example, problems such as communication failures and strategic alignment errors that occur in open innovation projects can be eliminated by the agile way of working (Pellizzoni et al. 2019).
However, due to the agile way of working, there may be a lack of alignment between the agile teams and the project manager, which can negatively impact the execution time of innovation projects as well as the other two constraints, namely the cost and scope of the project. In this sense, the inclusion of agile teams in open innovation projects brings additional benefits that minimize some of the concerns of the open innovation approach. On the other hand, the agile characteristics associated with project management may increase the derailment of the project in terms of estimated time to completion.
In this study, we intend to develop a methodology for the allocation of agile teams in open innovation projects in order to obtain the optimal allocation that minimizes the project execution time. To this end, the performance of each agile team is evaluated for each of the project tasks, taking into account operational factors and specific open innovation factors that may affect the project execution time. The goal of this methodology is to reduce uncertainty about project execution time and in this way contribute to the robust management of open innovation projects by promoting cost containment and the focus of agile teams within open innovation projects.
In the proposed methodology, the PERT method was considered for evaluating the execution time of open innovation projects carried out by agile teams since this method is widely used in practice. However, since this method has its limitations in considering stochastic variations in task times, this work proposes a modification of the PERT method by including a risk model to model the performance of each team along with the Monte Carlo method to obtain more realistic estimates of project execution times.
The article consists of six sections. The introduction provides a comprehensive overview of the research and points out the gaps that led to this research article. Section 2 provides a literature review of recent work on open innovation, agile teams, and project time management. Section 3 describes the research methods and presents all the tools used to develop the model proposed in this study. Section 4 illustrates the application of the developed model to a case study. Section 5 analyzes and discusses the results, and finally Section 6 draws the conclusions from this work.
2. Literature Review
2.1. Agile Methodology
Over the years, agile methodology has expanded to other areas of industry. This expansion is due to the need for companies to be agile in responding to the challenges and opportunities of the digital age, such as adapting to the digital culture of social networks, which requires advanced skills in social listening and Big Data analytics. These are important qualities that companies must have today to be competitive and innovative (Mohiuddin Babu et al. 2022).
Currently, the competitiveness of companies results from their ability to respond quickly to customer needs by developing new products or rapidly improving existing solutions and services (Laanti et al. 2011; Mathiyazhagan et al. 2021).
Despite this growing trend, companies have encountered several challenges in adopting agile methods, namely inconsistency in agile processes and practices, cultural incompatibilities, resistance to change, lack of experience and training, weak or non-existent leadership, and inadequate management. These obstacles have persisted over time and must be overcome to fully realize the benefits of agile methodology (Gerster et al. 2018; Žužek et al. 2020).
These benefits have a very positive impact on organizations. They improve the ability to manage change, promote faster delivery of products and services, increase productivity and the quality of products and services, improve alignment between the business and its production, increase visibility and foresight, reduce risk, and increase responsiveness to market fluctuations. In essence, these benefits lead to an increase in delivery value, customer satisfaction, and speed of delivery (Putta et al. 2018).
Because of these benefits, the agile methodology has been adopted at the enterprise level, resulting in what is known as Scaling Agile. In this approach, organizations with mechanistic structures, i.e., top-down hierarchical structures, begin to organize themselves in the same way as living organisms. In the process, rigid hierarchies are devalued in favor of goals, bureaucracy is replaced by flexibility and openness to change, and detailed instructions are replaced by leadership that provides orientation and encourages action (Dikert et al. 2016).
At the organizational level, there have also been some obstacles to the full implementation of the agile methodology, namely difficulties in managing information and quantifying it, in sizing and managing systems, in creating competencies, and in dynamically adapting the organizational structure over time as the market evolves. Of these barriers, the one that has the greatest impact on the implementation of the agile methodology is the limited or non-existent application of systems thinking in the implementation of the agile methodology at the organizational level (Stoica et al. 2016).
Agile organizations are in fact made up of teams and teams of teams that interact with each other to form a system. In this sense, managing a large number of agile teams requires a high level of coordination and sophisticated transparency for the proper planning of tasks and the corresponding progress assessment. This requires mechanisms in the organization to implement agile system architectures depending on the mission at hand. This dynamic architecture, created based on the agile mission, is essentially defined by the selection of agile teams, the planning, and the assignment of tasks to the teams (Alqudah and Razali 2016).
The complexity of this problem increases when it comes to virtual enterprises that are created temporarily to respond to business opportunities. This type of enterprise has evolved in R&D and is formed by alliances between companies that share their capabilities and resources to overcome their limitations and increase their competitiveness and performance (Goranson 1999). Combining the benefits of Agile with those of virtual enterprises creates a powerful virtual organization that mitigates not only the problems associated with quality and productivity, but also the problems associated with limited technical capabilities and technological resources (Lichtenthaler 2020).
Many of the benefits of virtual enterprises align with the benefits of Agile, namely higher productivity and greater customer satisfaction are two of the common benefits. In addition, virtual enterprises enable a reduction in operational costs associated with the workplace, meaning teams can work remotely, which is very common with Agile teams. They also enable an increase in profit, not only by reducing costs but also through the business opportunities that the virtual enterprise creates. Finally, virtual enterprises have privileged access to the global market and promote the environment by working remotely (Shaitura et al. 2019).
On the other hand, the related problems are cultural problems that also occur with Agile at scale, lack of trust between teams from different companies, lack of or faulty communication, a problem that also occurs with Agile at scale, and resistance to change. It seems that many of the problems encountered when implementing virtual enterprises also occur when implementing Agile principles in organizations. In this sense, the creation of virtual enterprises with agile teams from different companies greatly promotes the success of this type of enterprise (Zhang et al. 2020).
In this sense, the disruption that occurs in organizations when participating in virtual enterprises is minimized when they adopt agile principles in their organization, i.e., agile organizations are better prepared to participate in virtual enterprises than organizations with a traditional organization approach, which is more of an advantage of implementing agile methods in the organization (Yusuf et al. 1999). Virtual enterprises are a special case of collaborative networks in which companies work together to achieve a common goal. These companies are created in a variety of industries, but the field of open innovation benefits greatly from this type of company due to the characteristics already mentioned (Shamsuzzoha et al. 2018).
Open innovation is a model of innovation management in which companies share ideas and resources to improve the development of new products and processes and increase customer satisfaction. The advantages of this innovation model are numerous: co-creation with customers (a characteristic common to agile principles), networking with competing companies, exchange of ideas between collaborating companies, diversification in research and development, easier market entry, easier access to technological and intellectual resources, and faster development and use of the intellectual property of the network’s employees. On the other hand, the disadvantages are a heavy dependence on resources and external knowledge, loss of complete control over the innovation process, loss of flexibility, risk of losing information to competing companies, and loss of employees (Dahlander and Gann 2010).
If we analyze the concepts of Agile at scale, virtual enterprises, and open innovation together, we can see that there is a common goal and common characteristics. Moreover, the common approach of these three concepts allows us to mitigate some of the limitations that these concepts have in their individual forms. First, collaborative networks as virtual enterprises foster open innovation, and second, agile organizations are better prepared to participate in virtual enterprises created with the goal of developing open innovation projects.
2.2. Open Innovation
In short, open innovation can be defined as an innovation model proposed by Henry Chesbrough (Chesbrough 2003) in which there is an exchange of information and resources between internal and external partners with the aim of promoting and improving innovative solutions for customers, increasing efficiency, and adding value to products and services (Chesbrough 2019).
This innovation model represents an alternative to the traditional innovation model, also known as closed innovation, in which innovation projects are developed using only the company’s existing resources, i.e., without the involvement of external partners. This innovation model, while minimizing some risks related to trade secrets, has proven to be insufficient in the face of fierce competition in the market since technological capacity and speed in the development of new products and services are fundamental factors in the competitiveness of companies (Bogers et al. 2019).
In fact, in most companies, especially in small and medium enterprises, the investment of companies in innovation does not keep up with the high pace of market dynamics. In this sense, the open innovation approach, in which companies share resources (including technological and human resources) and exchange ideas, allows these companies to maintain their competitiveness in ever-changing markets.
2.3. Advantages of Open Innovation
The benefits of open innovation are many. First and foremost, it promotes the development of new products and services that the company would never have developed due to a lack of time, knowledge, and technological resources. It promotes access to markets in which the company participates through open innovation partners and improves its ability to adapt to market participation. It also promotes new market opportunities resulting from R&D activities that could not be explored internally due to technological, human resources, and technical limitations. It enables the commercialization of products and services that the company that owns them cannot bring to market due to a lack of capacity or for strategic reasons, and it promotes a reduction in the time and cost of innovation projects (Chesbrough et al. 2018; Madrid-Guijarro et al. 2021).
2.4. Challenges with Open Innovation
(Obradović et al. 2021) conducted a literature review focused on the application of the open innovation model in the manufacturing industry by analyzing 397 articles published during the period 2006–2019. The research topics presented are diverse, namely collaboration, company size, inbound, industry 4.0, intellectual property, openness, open strategy, outbound, performance, and sustainability. However, despite the wide range of research topics in the literature, no work is found on the management of open innovation projects.
Despite its many advantages, open innovation faces a number of challenges, both at the management and operational levels. These include managing and organizing long-term projects, balancing internal and external contributions and linking them to the strategy agreed upon between internal and external partners, managing opportunity risks and controlling intellectual property, and managing the motivation of internal and external participants (Bertello et al. 2022).
In terms of operational challenges, open innovation projects require more efficient coordination and typically incur additional implementation costs; they also increase the likelihood of workflow errors due to poor communication between internal and external participants. The dependence on external knowledge can limit both the quality of deliverables and timely execution of tasks, as well as the flexibility, creativity, and strategic capacity of partners. This dependency can also negatively impact the development of additional tasks that were not originally intended for the project (Kohnová 2018).
2.5. Project Management in Open Innovation
Appropriate and efficient project management contributes greatly to the success of the open innovation model in its various aspects (de Carvalho et al. 2021). In general, innovation activities are complex and uncertain, especially in collaborative open innovation, where management challenges increase due to uncertainty about the commitment of external and internal stakeholders to the project (uncertainty about sharing of materials, technology, and personnel) and require timely management based on thoughtful decisions (Bishnoi 2018).
Project management provides a temporal and financial structure for project tasks and their coordination through plans, objectives, and formal assessments of collaborative innovation activities, thus contributing positively to the success of open innovation projects. Indeed, open innovation collaborations are often resource-constrained, and in this sense, coordination and formal management through management practices can help ensure that limited resources do not compromise project goals (Lakemond et al. 2016).
In addition to this contribution, project management activities also promote the identification and evaluation of new innovation opportunities, which reinforces the benefits for stakeholders. Management activities also contribute to situational open innovation, which combines different approaches to identify and select the most appropriate external and internal partners for a given project to reduce the risk that the project will be negatively impacted during its implementation (Guertler and Sick 2021).
In this way, open innovation projects clearly benefit from management activities. However, these activities are also associated with a number of challenges that arise in advanced project phases, such as managing research and communication costs, managing disclosure paradoxes, and managing problems related to the misappropriation of information and resources. Poor management of these issues can create tensions between internal and external stakeholders involved in collaborative open innovation activities, increasing the risk that project goals will not be achieved.
Because of this risk, formal management forms such as contracts or specific investments are necessary to establish norms and build trust among open innovation stakeholders (Marullo et al. 2020).
On the other hand, a recent study suggests that the use of detailed and rigid contracts does not have a positive impact on the performance of open innovation because a formal contract limits the flexibility of the parties involved (internal and external actors). Because a formal contract limits the flexibility of the parties involved (internal and external participants) and limits the autonomy needed to make adjustments as the project progresses, this limitation has a particular impact on open innovation projects developed by agile teams (Ahlfänger et al. 2022).
In practice, successful and unsuccessful open innovation projects have shown significant differences in the nature of collaboration and respective management. Successful projects tend to use active and interactive forms of collaboration, while unsuccessful projects tend to use passive and one-way forms (Yoon et al. 2016).
Moreover, recent studies argue that the innovation strategies, inbound open innovation and outbound open innovation, can increase their performance by adopting dynamic capabilities through agility (Liao et al. 2019). For instance, market capitalization agility and operational adjustment agility can be incorporated into business models based on open innovation as a way to quickly respond to market changes and to hear the voice of the customer in a timely manner before the product is placed on the market.
In this sense, this work proposes the implementation of open innovation projects by agile teams as a way to implement active and interactive forms of collaboration. Together with a methodology for assigning project tasks to agile teams to optimize project execution time, it contributes on two fronts to improve first the implementation of open innovation and second the management of open innovation activities.
2.6. Agile Iron Triangle in Project Management
One of the most important prerequisites for a company’s competitiveness is the ability to bring innovative products and services to market as quickly as possible in order to achieve a market position.
In the traditional iron triangle approach, i.e., project management by traditional non-agile teams, the estimates for the execution time and cost of a given project tend to fluctuate during execution, while the scope of the project is set during project execution. In the context of innovation project management, these fluctuations tend to be even greater due to the project management challenges and uncertainties described in the previous section, negatively impacting both the project and the stakeholders involved. This fact is confirmed for both open and closed innovation models (Pollack et al. 2018).
In contrast, when considering agile work teams in open innovation projects, the iron triangle is reversed, i.e., the execution time and cost of a given project are usually fixed and the scope of the project varies, see Figure 1. This change in the iron triangle results from the agile characteristics that the respective work teams bring to the project (Bergmann and Karwowski 2019).
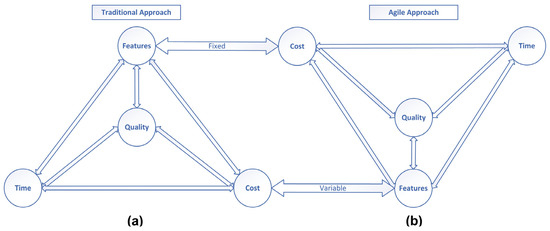
Figure 1.
Iron triangle: (a) traditional approach, (b) Agile approach.
In this sense, the use of agile teams in open innovation projects is of great benefit to their management, as it minimizes uncertainty in terms of time and cost.
Moreover, the variation in project scope that characterizes the agile iron triangle enables a better customer-centric innovation solution that contributes to the competitiveness of collaborative innovation actors (internal and external) through innovative and high-quality product development. and also helps to strengthen the continuity of open innovation initiatives among collaborative actors (Bilir 2022).
It can be concluded that the application of the Agile approach in open innovation projects contributes positively to the goals of the innovation project, both in terms of management and innovation.
2.7. Estimation of the Project Execution Time
As mentioned above, the execution time of a project is one of the factors that have the greatest impact on its success. In this sense, its management is important, as is the estimation of execution time in the early stages of project development. This estimation supports decision making during project development, and therefore the particular architecture depends heavily on this estimation. Traditionally, two methods have been used in practice to estimate the execution time of a particular project, namely the Program Evaluation and Review Technique (PERT) (Cynthia 2020) and the Critical Path Method (CPM) (Bishnoi 2018; Cynthia 2020).
These two models were developed around 1950 by different teams. However, the two methods are very similar, which leads to the practical use of both methods in the same analysis to estimate the execution time of a given project (Zheng et al. 2022). These methods use graphical representations, called graphs, to visualize, plan, and coordinate the different project tasks. For each of the tasks, the PERT model considers the weighted average of three runtime scenarios, i.e., the most optimistic, the most probable, and the most pessimistic, and uses these results to estimate the project execution time since it is a probabilistic method. The CPM method, on the other hand, uses the same graphs as the PERT method to determine the critical path, also known as the sequence of critical tasks, where the execution time cannot exceed the initial time estimate when an event occurs. if the time in any of these tasks increases, the project execution time also increases. In practice, the tasks on the critical path have a tighter time span and require more rigorous management.
Despite their widespread use and the fact that they are well-recognized models, both the PERT and CPM models have some limitations in practice, particularly in the way they account for uncertainty in the times considered for each task. In their traditional form, the times assigned to tasks are fixed and predetermined. They do not take into account the stochastic variations in the times for each task, which are always present in the execution of the tasks of a given project due to the performance of the team executing the task, and which may vary according to internal and external factors. In this sense, the method proposed in this work aims to fill this gap and proposes to take into account the stochastic variations in the execution time of each task and determine the execution time of the project through the Monte Carlo method, from which the estimate of the execution time of the project is obtained through a mean value and the corresponding confidence level.
2.8. Correlation between the Assignment of Teams to Tasks of a Project and the Corresponding Execution Time
The allocation of human resources can be considered a core process of information systems project management (e Silva and Costa 2013; Nepomuceno and Costa 2019), which also applies to the management of open innovation projects. Indeed, in open innovation projects, internal and external participants are selected to perform tasks in a given project. The ability to perform tasks operationally, the ability to communicate between teams (external and internal), and the ability to prevent and mitigate unforeseen situations are extremely important skills for teams and should be considered when selecting and assigning these teams to project tasks.
With this in mind, there may be teams (internal and external) that are better prepared for a particular project task and less prepared for other tasks. This level of preparation has a particular impact on project execution time and corresponding costs. This means that the manager of a particular innovation project may observe different execution times depending on how teams are assembled for the different tasks of the project.
A team that is less prepared for a particular task may take more time to execute due to a lack of experience, lack of technological and human resources, or even poor communication. However, the same team may be better prepared for a different project task than the other teams. In this case, the particular characteristics of the task may match the strengths of this team, and in this sense, the project manager must take advantage of these capabilities.
In this context, the selection of teams and the corresponding assignment to the tasks of the innovation project proves to be an important management activity in order to optimize the project implementation time and the corresponding costs. For this purpose, it is necessary to use indicators that allow distinguishing each team according to its performance in each task, as well as a model that allows in a systematic way to make the optimal allocation of teams in innovation projects.
3. Materials and Methods
The goal of this study is to develop a methodology to determine the optimal allocation of agile teams in open innovation projects.
The research methodology began with the identification of the research problem (already discussed in the previous sections). Then, the research hypothesis was formulated that the execution time of open innovation projects carried out by agile teams depends on the performance of each team. To characterize the research question, three models were used, namely, Erisk, PERT, and Monte Carlo, which in aggregated and adjusted form allow the evaluation of the execution time of the project for each arrangement of the assignment of the teams to the different project tasks. The selection of the best assignment of the teams to the project tasks was conducted by analyzing the results obtained for the variations in the possible team assignments. To illustrate and consolidate the description and application of the model, an illustrative case study is used (Section 4), where the performance of each team for each of the considered tasks was obtained from random cases studied by the authors, rather than from the analysis of a real case.
Figure 2 is intended to illustrate this decision problem for which, to the best of the research team’s knowledge, there is no tool or methodology to determine in a systematic way the optimal allocation of agile teams in projects of open innovation implemented by agile teams. The open innovation project manager has the task of selecting a set of teams that can be considered to perform the project tasks, i.e., to form a pool of teams. Based on this selection, the project manager familiarizes himself with the capabilities (strengths and weaknesses) of each team and then assigns these teams to the various tasks according to the analysis performed. However, determining the optimal assignment of teams in this context is a complex task that is difficult to perform without a systematic methodology.
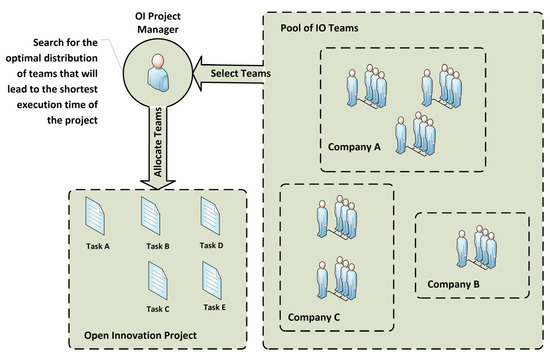
Figure 2.
Open innovation allocation of teams’ process.
To obtain this tool and the corresponding methodology, a research framework was created to structure the work. Figure 3 shows this structure, which consists of four main research areas that contribute to the development and implementation of the model proposed in this work.
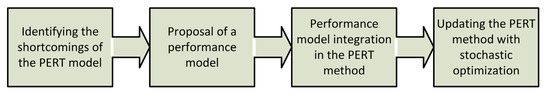
Figure 3.
Framework for the research tasks developed in this work.
In this context, the work begins by identifying the limitations of the model PERT, which is the starting point of the proposed model. In essence, this model will be improved to take into account important aspects that affect the overall duration of the implementation of open innovation projects carried out by agile teams.
The next step in the research framework is then to develop a model that allows the performance of each team to be captured in each task of the project, called a performance model. The goal is to match the estimated execution time of a given task with the available resources and the ability of a given team to execute.
The next step is to integrate the performance model developed in the previous step into the traditional model PERT. Finally, the last part of the framework aims to improve the estimates of the model PERT by changing the calculation method so that the respective estimates are represented in a stochastic way, i.e., by an average value for the execution time of the project together with the respective variance according to a predefined confidence level.
3.1. Limitations of the PERT Method
In the traditional PERT method, the execution time of a given task is estimated using the respective typical values, i.e., minimum time, most probable time, and maximum execution time.
These times are usually determined without considering the performance of the team executing the task, i.e., these times do not vary independently of the team’s performance, good or bad. In this sense, and consistent with the traditional approach of PERT, the total execution time of a given project is also independent of the performance of the teams that will execute the project. This characteristic can lead to very conservative or not very conservative estimates, which increases the uncertainty of the estimates of the PERT model, which in turn favors an increase in waste, both in terms of material resources and in terms of technological and financial resources.
In addition to this limitation, the traditional PERT model assumes that the execution time of a given task has a variance calculated based on the minimum time, the most likely time, and the maximum time assigned to the task, i.e., the variance of a given task calculated using the traditional PERT method is also independent of the performance of the team executing the task.
In this way, and through the traditional PERT method, the project execution time is independent of the performance of the teams executing the project tasks and the available resources.
However, the research hypothesis in this paper assumes that the execution time of a given project is highly dependent on the performance of the teams that will execute each task, as well as the distribution pattern chosen by the project manager in assigning the various tasks of the project to the work teams.
This study aims to test this hypothesis and, moreover, to improve the PERT method to overcome the above limitations. This result is of particular interest for agile team allocation in the context of managing agile teams in open innovation projects, reducing uncertainty in project execution time, and promoting waste reduction.
3.2. Agile Model of Team Assignment in Open Innovation Projects
To overcome the aforementioned limitations of the PERT model, the team assignment model shown in Figure 4 is proposed.
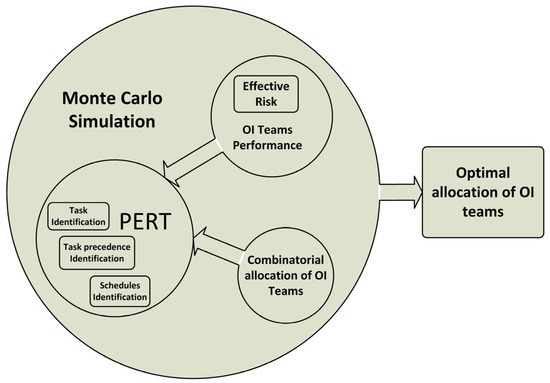
Figure 4.
Conceptual representation of the proposed model.
The first change concerns the way the most likely execution time for a given task is calculated. This time is calculated by correcting the most likely execution time of a task (determined in a traditional way) by a risk model applied to a set of failure modes inherent to the activities of agile teams in the context of the tasks of a given innovation project, presented in the next section.
The second change is the inclusion of combinatorial analysis in the calculation of project execution time and in the determination of the critical path. The performance of each team varies depending on the task, and therefore the project execution time also varies depending on how the teams are divided.
The third and final change is made by including the Monte Carlo method in the determination of the project execution time and the corresponding variance. With this method, it is possible to determine the probability that the project execution time is greater or less than the estimated time for a given confidence level.
3.3. The Model of Team Performance and the Corresponding Integration into the PERT Model
The performance of each team is assessed using the effective risk model, with the following paradigm: if the effective risk assessed for a team in the context of a given task is low, it means that the team’s performance is high; on the other hand, if the effective risk is high, it means that the team’s performance is low. In this sense, low performance (high effective risk) may mean that the task execution time is longer than expected, while high performance (low effective risk) may mean that the task execution time is shorter than expected.
Figure 5 illustrates how the most likely value for a given task is updated according to each team’s performance. To estimate the performance of each team, the effective risk is first evaluated using Equation (1).
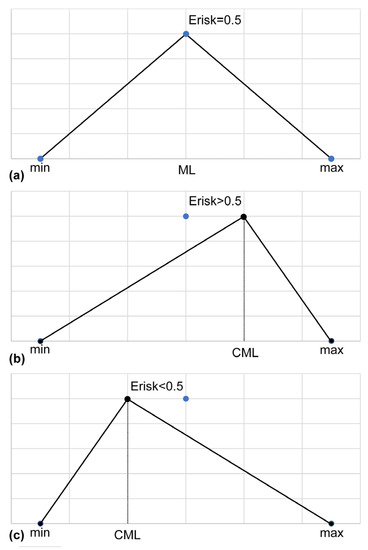
Figure 5.
Estimation of task execution time. (a) Traditional PERT estimation, (b) proposed estimation based on effective risk model, Erisk > 0.5, (c) proposed estimation based on effective risk model, Erisk < 0.5.
Thus, if the effective risk is less than 0.5, the value of the most probable time shifts toward the value of the minimum time, or conversely, if the effective risk is greater than 0.5, the most probable time shifts toward the maximum time.
Equation (1) consists of two branches: the first is for the effective risk of less than 0.5. In this branch, when the effective risk is zero, the task execution time is equal to the minimum time determined by the traditional approach PERT.
In the other branch, when the effective risk is greater than 0.5, if the effective risk is equal to 1, the task execution time is equal to the maximum value determined for the task using the traditional approach PERT. If the calculated effective risk for a given task is equal to 0.5, then the task execution time is equal to the most probable time determined by the traditional approach PERT, which can be determined by Equation (1) in both branches. The variance in the execution time of the project is calculated using Equation (2), taking into account the minimum time, the maximum time, and the most probable time of execution of the task, corrected by the model and the effective risk.
3.4. Effective Risk Model
The effective risk model was proposed by (Anes et al. 2018) and aims to overcome a number of limitations found in the traditional FMEA model. It is a risk model that allows you to evaluate scenarios using qualitative and quantitative information. This evaluation essentially focuses on previously identified failure modes that have a strong influence on the risk scenario.
With this model, the authors essentially overcome three major limitations of the original FMEA model, namely the non-injectivity and non-surjectivity of the RPN function and the inability to consider risk mitigation options after a particular failure mode is discovered.
Figure 6 illustrates the effective risk model in a conceptual manner. The model summarizes seven variables that can be qualitative or quantitative.
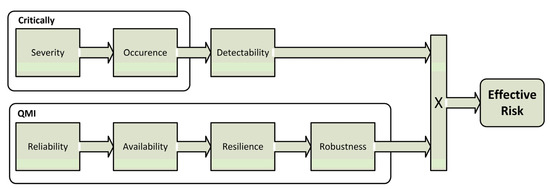
Figure 6.
Conceptual representation of the effective risk model.
The severity, occurrence, and detectability variables are the traditional variables of the FMEA model and are used to quantify the extent of the impact of a particular failure mode (severity), the probability of occurrence of that failure mode (occurrence), and the ability to detect a particular failure mode before it occurs (detectability).
The remaining variables are variables to quantify the ability to mitigate damage after a failure mode is detected. The reliability variable is intended to quantify the level of performance in performing damage mitigation tasks; the availability variable is intended to quantify the level of availability of material and human resources during damage mitigation activities; the resilience variable is intended to quantify the ability to maintain the values assigned to the reliability and availability variables over time; and the robustness variable is intended to quantify the level of volatility of the values assigned to the other three variables.
Equation (3) represents the expression for effective risk with respect to the upper branch in Figure 6, and Equation (4) represents the expression for the calculation of the lower branch also in Figure 6. The effective risk of a particular failure mode is obtained by multiplying the results of these two expressions as shown in Equation (5). To evaluate the effective risk of a particular risk scenario containing multiple failure modes, Equation (6) is used to determine the aggregate effective risk.
3.5. Failure Modes in Agile Teams in the Context of Open Innovation Projects
As described in Section 3.3, the most likely time for each task is updated using the effective risk model described in Section 3.4. To assess the effective risk of an agile team in any task and in the context of open innovation projects, the literature review conducted by (Dikert et al. 2016) to identify challenges and success factors for large-scale agile transformations was used to identify the key failure modes that significantly impact the goals of open innovation projects.
Table 1 shows the 5 failure modes that were considered most relevant and used in the model for assigning agile teams in open innovation projects.

Table 1.
Failure modes with greater impact in project management for open innovations (Dikert et al. 2016).
The presented failure modes have a strong impact on project execution time, i.e., if these failure modes are not detected before they occur and if there is no way to mitigate them, there is a very high probability that project tasks will take longer than expected.
Poor implementation of agile methodologies, lack of best practices in implementing open innovation activities, and poor communication between open innovation teams can lead to the need to rework various project tasks, resulting in project execution taking longer than expected, which negatively impacts the project goal.
Lack of an organizational structure for the project, or poor communication of that structure, encourages poor communication between teams, which also leads to rework, which in turn leads to an increase in project duration. Insufficient commitment from agile teams and the organization can negatively impact creativity and problem-solving performance and increase the time required to complete tasks. Unrealistic expectations about the time required for each task can put pressure on the team, which can affect the quality of the results achieved on each task.
In general, these failure modes associated with agile methodology and open innovation activities negatively impact the execution time of project tasks. These failure modes are considered in the proposed model and systematically evaluated in each task of the studied open innovation project through the seven variables of the effective risk model described in Section 3.4.
3.6. Description of the Phases of the Model Implementation
Table 2 gives an overview of the different phases of the implementation of the proposed model.
Table 2.
Overall framework at the process level with respect to the proposed model implementation.
4. Illustrative Case Study
To illustrate the application of the proposed model, we considered an illustrative case study of a scenario in which an open innovation project manager must make the decision to deploy three agile teams for the various project tasks.
In this case study, it is assumed that these three teams have been previously selected based on a set of criteria that allow selecting the best prepared teams for this project.
However, the proposed model also allows for this selection, i.e., the proposed model not only allows for the determination of the best assignment of the preselected teams but also allows for the selection of the teams that will be assigned to the project from a variety of available teams. In this case study, we only assume that the teams have already been selected, and the focus is on determining the optimal assignment that minimizes the project implementation time.
The project consists of the 10 tasks listed in Table 3. This table not only lists the tasks (from A to J) but also their ranking and most likely duration according to the traditional method CPM.
Table 3.
Project tasks, precedence between tasks, and their respective durations.
Figure 7 shows the CPM diagram of project tasks, taking into account the duration of each task and its precedence. From the diagram, it can be seen that there are five possible critical paths, namely path 1 ACFI, path 2 ADHJ, path 3 ADGJ, path 4 AEHJ, and path 5 BFI. It is also confirmed that the duration of the project according to the method CPM is 22 weeks and that the critical path is AEHJ, i.e., path 4.
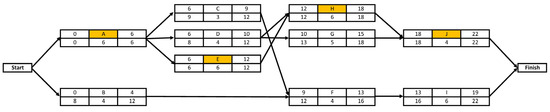
Figure 7.
CPM diagram of the project under study.
Based on this information and the priorities between tasks and the corresponding distribution in Table 4, it can be concluded that three teams working simultaneously are required to achieve the shortest project duration. Based on this distribution, three schedules were defined, also shown in Table 4, namely Schedule 1 (S1), Schedule 2 (S2), and Schedule 3 (S3).
Table 4.
Identification of project schedules.
According to the proposed model, it is necessary to analyze the best assignment of teams to project tasks through a combinatorial analysis. In this illustrative case, the assignment study is performed considering the already identified schedules, which leads to the result that the shortest project execution time is achieved considering these schedules.
Table 5 shows the six possible assignment variants of the three teams to the three schedules. The proposed model is applied to each of these six permutations and the one that results in the shortest project execution time is selected by the manager to execute the project.
Table 5.
Possible permutations considering the tasks and schedules of the project.
5. Results and Discussion
5.1. Simulations
Table 6 shows the results for Team 1 in terms of effective risk in each of the 10 project tasks given the first failure mode shown in Table 1. Table 7 and Table 8 show the results for Teams 2 and 3, also given the first failure mode.
Table 6.
Effective risk assessment of team 1 in each project task.
Table 7.
Effective risk assessment of team 2 in each project task.
Table 8.
Effective risk assessment of team 3 in each project task.
The proposed model considers the five failure modes presented in Table 1, so 15 similar tables had to be evaluated in this case study, three for each failure mode. However, for simplicity, only the first three are presented. These tables are used to evaluate the actual risk of each team with respect to each failure mode listed in Table 1.
In these tables, the 10 project tasks are recorded in the first column, the qualitative ratings on a scale of 1 to 10 for the severity, occurrence, and detectability variables used in Equation (3) are recorded in columns 2 through 4, and the result is recorded in column 9 (RPI). Columns 6 to 8 contain the qualitative scores, also on a scale of 1 to 10, for the variables: reliability, availability, resilience, and robustness. These variables are applied to Equation (4) and the result is recorded in column 10. Then, the values contained in columns 9 and 10 (RPI and QPI) are used to obtain the effective risk of the team in each project task through Equation (5). These values are stored in column 12 of the respective table.
Table 9 shows the results for the estimates of execution time for each of the 10 tasks for which the PERT method was considered (columns 2 through 6). The second column shows the minimum estimated time for each task, column 3 shows the most likely time, and column 4 shows the maximum estimated time for each task. Column 5 shows the average task time, which corresponds to the most probable time, and column 6 shows the variance, which refers to the average value of the execution time of each task.
Table 9.
Effective risk results for every team, every project task, and Monte Carlo iteration.
Columns 7 through 9 show the actual risk for each task and team. These values were calculated for each team using the effective risk for each of the five failure modes described in Table 1. Then, the overall effective risk was evaluated using Equation (6).
Columns 10 through 12 show the results for Team 1. Column 10 contains the average value of the execution time corrected using Equation (1) for each task. Column 11 contains the new value for the variance of the execution time of each task calculated using Equation (2), and Column 12 contains the estimate of the execution time of each task obtained by the Monte Carlo iteration. Columns 13 through 15 contain the values for Team 2, and columns 16 through 18 contain the values for Team 3.
Figure 8a shows the results obtained for estimating the total duration of project implementation in each of the six permutations listed in Table 5. The dashed line represents the minimum value (17.66 weeks) of the estimated project implementation duration using the traditional method PERT and the dotted line represents the maximum value (21.68 weeks). These values were obtained by considering the CPM chart in Figure 7, the average time in column 5 of Table 8, and the respective variance in column 9 for each of the tasks.
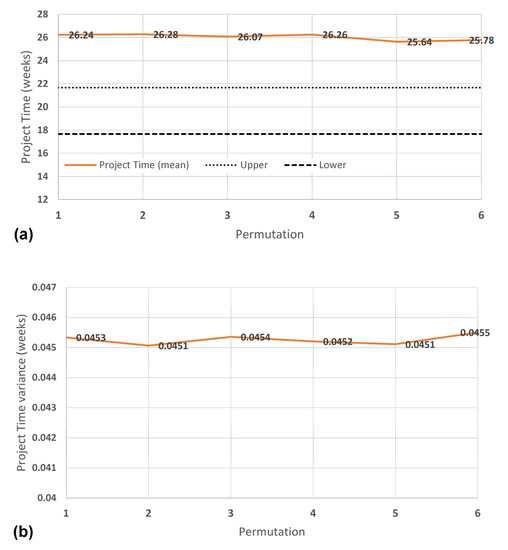
Figure 8.
Project time estimates for each permutation and effective risk evaluated with RPI component only. (a) Project time estimates for each permutation. (b) Variance estimates for each permutation.
The orange line runs through the estimates of the execution time of each task for the situation in which the average time of each task is corrected using only the RPI component of the effective risk, without taking into account the prevention and mitigation capacity of each team in each task, i.e., without taking into account the QMI component used in the effective risk.
It turns out that correcting the execution time taking into account the effective risk evaluated in this way makes the estimates very conservative, i.e., all estimates are at least 4 weeks above the maximum value obtained by the traditional method PERT.
This result is justified because the effective risk was assessed using only the RPI component, and for this case study, it allows values above 0.5 for all tasks, which shifts all the averages for the execution time of each task toward the maximum estimated time for the task. In this analysis, permutation 5, which assigns Team 3 to Schedule 1, Team 1 to Schedule 2, and Team 2 to Schedule 3, was the permutation that produced the shortest project execution time.
Figure 8b plots the variance obtained for each permutation and shows that the smallest variance occurs for permutation 2 and permutation 5.
It can be concluded that the estimates of project execution time become very conservative when the effective risk is evaluated without the performance component of each team, i.e., the shortest estimated time for the project using the effective risk that considers only the RPI component (without the QMI performance component) has a value of 25.64 weeks (permutation 5), about 4 weeks more than the maximum estimate using the traditional method PERT.
Figure 9a presents the results of estimating the project execution time for each of the six permutations where the effective risk was evaluated taking into account the RPI and QMI components when evaluating the effective risk. In fact, when including the performance component, there is a marked variation in the results compared to that described in Figure 8.
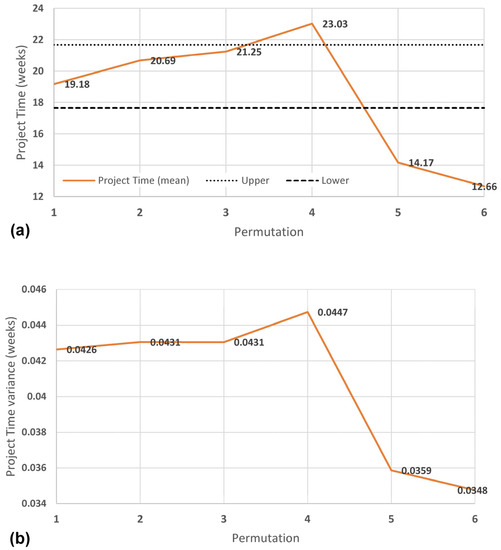
Figure 9.
Project time estimates for each permutation and effective risk evaluated with RPI and QMI. (a) Project time estimates for each permutation. (b) Variance estimates for each permutation.
In this case, the estimate for the shortest execution time is 12.66 weeks with a variance of 0.0348 weeks and occurs in permutation 6 where Team 3 is allocated to Schedule 1, Team 2 is allocated to Schedule 2, and Team 3 is allocated to Schedule 3. In this case, the difference between the estimate of the execution time of permutation 6 and the estimate of the shortest execution time by the method PERT is 5 weeks, which is a considerable deviation.
In Figure 9b, the evolution of the variances for each of the six permutations is represented, and similarly to what is seen in the results of Figure 8, it verifies that the smallest variance occurs in the permutation with the smallest estimate for the execution time.
Figure 10 shows the probability that the project execution time for each permutation is greater or less than the average project execution time obtained using the traditional method PERT. Analysis of these results shows that permutations 5 and 6 have an extremely high probability that the execution time is less than the time determined by the method PERT, about 0.99, which means that they can be verified with reasonable confidence.
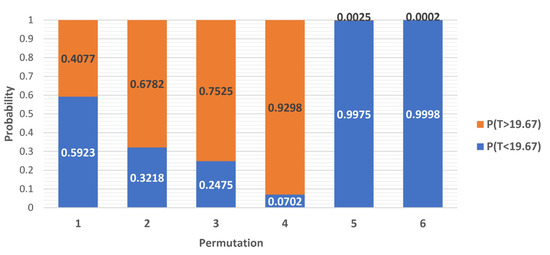
Figure 10.
Achieved probabilities for each of the 6 permutations considered in the illustrative case study.
5.2. Discussion
From these results, we can see that when estimating the execution time of a particular project, the ability of the teams to complete the tasks of the project must be taken into account. In this case study, we see that permutation 6 leads to a reduction of 5 weeks in the estimated execution time compared to the minimum value estimated by the method PERT. On the other hand, permutation 4 estimates an execution time that is about 1.35 weeks higher than the maximum value obtained with the traditional method PERT. In this way, it was possible to validate and confirm the research hypothesis through the proposed model and to quantify that the performance of the teams involved in the projects has indeed an impact on the execution time.
Figure 11 shows the variation in the critical path according to the Monte Carlo iteration and according to the permutation. Figure 11a shows the variation in the critical path for the case where the effective risk is evaluated considering only the RPI (without considering the performance of the teams), and Figure 11b shows the results for the case where the most likely execution time of the task is corrected with the effective risk evaluated considering the RPI together with the QMI.
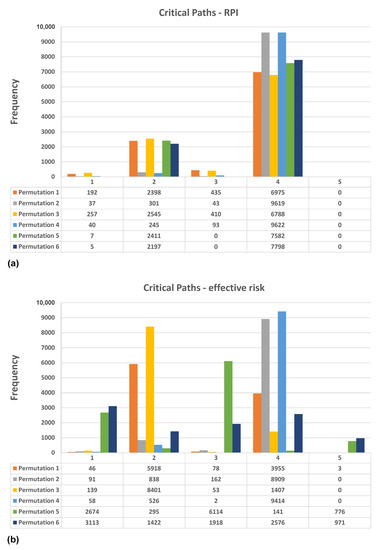
Figure 11.
Identification of critical path. (a) Effective risk assessed with RPI only, (b) effective risk assessed with RPI together with QMI.
From these results, it can be concluded that, contrary to what was shown in the method CPM and PERT, the critical path varies according to the performance of the work teams and according to the pattern of team assignment. For the results shown in Figure 11a, the occurrence of path 4 (AEHI) as the critical path was confirmed in all permutations. In contrast, for the results in Figure 11b, the critical path was found to vary by permutation and to fluctuate between critical path 2 and 4 depending on the permutation.
Based on the results of this illustrative case study, we can conclude from the correlation between the traditional PERT methodology and the proposed methodology that depending on the pattern of assigning the agile teams to the different tasks of the project, there is a probability that the execution time of the project will be higher or lower than the estimate of the traditional PERT methodology. For example, for permutations 5 and 6 shown in Figure 10, it is almost certain that the execution time will be lower than the estimate of the traditional PERT methodology, indicating a conservative estimate. There is a high probability that the project execution time is higher than the estimate of the traditional method PERT, indicating a non-conservative estimate.
(Stenbeck 2008) argues that there is nothing more valuable in project management than estimates that reflect reality, motivate the achievement of project goals, and enable rigorous record keeping. In fact, conservative estimates for project execution time can lead to a loss of competitiveness and waste of resources, while non-conservative estimates can lead to penalties for failure to meet deadlines and to remedial actions with a negative impact on project costs. In this sense, the traditional method PERT becomes a method with inaccurate estimates because it does not consider mechanisms to adjust the execution time of tasks according to the performance of the team. This feature becomes critical when project managers are not familiar with work teams, as is the case with the problem addressed in this study. The method presented in this paper fills this gap of the traditional PERT and allows more realistic estimates of execution time.
5.3. Limitations of the Study and Future Works
Although the objectives proposed in this work were achieved, the study has some limitations. In this sense, certain aspects could have been deepened, such as the application of the agile methodology in open innovation projects or a more detailed description of the different models in terms of their use and their respective advantages and disadvantages. However, the information provided throughout the article allows not only to identify, based on the literature, the existing limitations that are overcome by the proposed methodology but also indicates where the reader can find more information about the models used in the proposed methodology. The level of depth assumes that the reader is familiar with the topics, both in terms of more general topics such as open innovation and agile methodology, and in terms of the models used, namely the PERT method and the Monte Carlo model. In addition to these aspects, the illustrative case study aims to complement the information about the proposed methodology. It lacks validation in practice through a real case study with agile teams and agile project managers, but it is foreseen to perform this study in future works. Moreover, the presented methodology could have been correlated with other human resource allocation models to compare the results.
Another limitation of this study is that it considers a static evaluation of the performance of open innovation teams. However, due to the learning curve and continuous improvement, team performance has a dynamic nature, i.e., team performance may improve or deteriorate over the course of the project. In future work, we also intend to address this limitation and adapt the methodology proposed in this study to incorporate a dynamic assessment of open innovation team performance.
6. Conclusions
Assigning teams to the different tasks of open innovation projects can lead to different times for project implementation, depending on the capabilities and performance of each team. In this sense, it is necessary to use a tool or methodology that allows an optimal assignment of teams to the different tasks of the project in order to optimize the project implementation time, taking into account the performance of each team in each task. This optimization will allow the reduction in waste in terms of human, technological, and financial resources.
In this paper, a new methodology is developed to assign agile teams participating in open innovation projects taking into account their performance. The goal is to achieve an optimal assignment that leads to a shorter project execution time, which is one of the main constraints in project management. In practice, the result of applying the proposed methodology should support decision making in managing open innovation projects.
The developed methodology summarizes three tools, namely the PERT method, the effective risk model, and the Monte Carlo method.
The PERT method is used to determine the project execution time, the effective risk model is used to adjust the execution time of each task according to the performance of each team for that task, and the Monte Carlo model allows a statistical distribution to be obtained for the project execution time, namely the average project execution time and the corresponding variance.
With the proposed methodology, it was possible to include the performance of the teams performing the tasks in the PERT method. This is a contribution that can improve the effectiveness of the estimates of this method, which is widely used in the industry, and for this reason was considered for improvement.
This new functionality makes it possible to perform new types of analysis with the PERT method, such as the analysis of the execution time of the project as a function of the performance of the teams involved, making it possible to look for the distribution of teams that leads to a shorter execution time.
In this way, managers of open innovation projects can reduce waste in terms of the quality of their decisions.
By selecting agile work teams and distributing them in a time-optimized manner among a variety of project tasks using the proposed methodology, project costs are reduced, and quality is increased, which increases the probability of achieving the goals set for the project.
Author Contributions
Conceptualization, V.A. and A.A.; methodology, V.A.; software, V.A.; validation, A.A., A.D. and J.C.; formal analysis, A.D.; investigation, V.A.; resources, J.C.; data curation, V.A.; writing—original draft preparation, V.A.; writing—review and editing, A.D.; visualization, V.A.; supervision, A.A.; project administration, V.A.; funding acquisition, J.C. All authors have read and agreed to the published version of the manuscript.
Funding
This research was funded by Polytechnic Institute of Lisbon, grant number IPL/2021/ReEdIA_ISEL.
Institutional Review Board Statement
Not applicable.
Informed Consent Statement
Not applicable.
Data Availability Statement
Not applicable.
Acknowledgments
This work was supported by the FCT through IDMEC under LAETA, project UIDB/50022/2020, and by the Polytechnic Institute of Lisbon through the Projects for Research, Development, Innovation and Artistic Creation (IDI&CA) under the project ReEdIA-Risk Assessment and Management in Open Innovation, IPL /2021/ReEdIA_ISEL.
Conflicts of Interest
The authors declare no conflict of interest.
References
- Ahlfänger, Marcel, Hans Georg Gemünden, and Jens Leker. 2022. Balancing Knowledge Sharing with Protecting: The Efficacy of Formal Control in Open Innovation Projects. International Journal of Project Management 40: 105–19. [Google Scholar] [CrossRef]
- Alqudah, Mashal, and Rozilawati Razali. 2016. A Review of Scaling Agile Methods in Large Software Development. International Journal on Advanced Science, Engineering and Information Technology 6: 828–37. [Google Scholar] [CrossRef]
- Anes, Vitor, Elsa Henriques, Manuel Freitas, and Luís Reis. 2018. A New Risk Prioritization Model for Failure Mode and Effects Analysis. Quality and Reliability Engineering International 34: 516–28. [Google Scholar] [CrossRef]
- Bergmann, Thomas, and Waldemar Karwowski. 2019. Agile Project Management and Project Success: A Literature Review. In Advances in Human Factors, Business Management and Society: Proceedings of the AHFE 2018 International Conference on Human Factors, Business Management and Society, July 21–25, 2018, Loews Sapphire Falls Resort at Universal Studios, Orlando, Florida, USA 9. Cham: Springer, pp. 405–14. [Google Scholar]
- Bertello, Alberto, Alberto Ferraris, Paola De Bernardi, and Bernardo Bertoldi. 2022. Challenges to Open Innovation in Traditional SMEs: An Analysis of Pre-Competitive Projects in University-Industry-Government Collaboration. International Entrepreneurship and Management Journal 18: 89–104. [Google Scholar] [CrossRef]
- Bilir, Canser. 2022. Project Success Criteria, Critical Success Factors (CSF), and Agile Projects. Contemporary Challenges for Agile Project Management 52–72. [Google Scholar] [CrossRef]
- Bishnoi, Nisha. 2018. Critical Path Method (CPM): A Coordinating Tool. International Research Journal of Management Science & Technology 9: 459–67. [Google Scholar]
- Bogers, Marcel, Henry Chesbrough, and Carlos Moedas. 2018. Open Innovation: Research, Practices, and Policies. California Management Review 60: 5–16. [Google Scholar] [CrossRef]
- Bogers, Marcel, Henry Chesbrough, Sohvi Heaton, and David J. Teece. 2019. Strategic Management of Open Innovation: A Dynamic Capabilities Perspective. California Management Review 62: 77–94. [Google Scholar] [CrossRef]
- Chesbrough, Henry William. 2003. Open Innovation: The New Imperative for Creating and Profiting from Technology. Boston: Harvard Business Press. [Google Scholar]
- Chesbrough, Henry, Christopher Lettl, and Thomas Ritter. 2018. Value Creation and Value Capture in Open Innovation. Journal of Product Innovation Management 35: 930–38. [Google Scholar] [CrossRef]
- Chesbrough, Henry. 2019. Open Innovation Results: Going beyond the Hype and Getting down to Business. Oxford: Oxford University Press. [Google Scholar]
- Cynthia, Orumie. 2020. Implementation of Project Evaluation and Review Technique (PERT) and Critical Path Method (CPM): A Comparative Study. International Journal of Industrial and Operations Research 3. [Google Scholar] [CrossRef]
- Dahlander, Linus, and David M. Gann. 2010. How Open Is Innovation? Research Policy 39: 699–709. [Google Scholar] [CrossRef]
- de Carvalho, Victor Diogho Heuer, Thiago Poleto, Thyago Celso Cavalcante Nepomuceno, and Ana Paula Paula Cabral Seixas Costa. 2021. A Study on Relational Factors in Information Technology Outsourcing: Analyzing Judgments of Small and Medium-Sized Supplying and Contracting Companies’ Managers. Journal of Business & Industrial Marketing 37: 893–917. [Google Scholar]
- Dikert, Kim, Maria Paasivaara, and Casper Lassenius. 2016. Challenges and Success Factors for Large-Scale Agile Transformations: A Systematic Literature Review. Journal of Systems and Software 119: 87–108. [Google Scholar] [CrossRef]
- e Silva, Lúcio Camara, and Ana Paula Cabral Seixas Costa. 2013. Decision Model for Allocating Human Resources in Information System Projects. International Journal of Project Management 31: 100–8. [Google Scholar] [CrossRef]
- Fowler, Martin, and Jim Highsmith. 2001. The Agile Manifesto. Software Development 9: 28–35. [Google Scholar]
- Gerster, Daniel, Christian Dremel, and Prashant Kelker. 2018. ‘Agile Meets Non-Agile’: Implications of Adopting Agile Practices at Enterprises. Paper presented at 24th Americas Conference on Information System, New Orleans, LA, USA, August 16–18. Association for Information Systems. [Google Scholar]
- Goranson, H. Ted. 1999. The Agile Virtual Enterprise: Cases, Metrics, Tools. Santa Barbara: Greenwood Publishing Group. [Google Scholar]
- Guertler, Matthias Rudolf, and Nathalie Sick. 2021. Exploring the Enabling Effects of Project Management for SMEs in Adopting Open Innovation–A Framework for Partner Search and Selection in Open Innovation Projects. International Journal of Project Management 39: 102–14. [Google Scholar] [CrossRef]
- Kohnová, Lucia. 2018. Overcoming Industry 4.0. Challenges through Open Innovation: Literature Review. Business Environment Horizons 4: 64–75. [Google Scholar]
- Laanti, Maarit, Outi Salo, and Pekka Abrahamsson. 2011. Agile Methods Rapidly Replacing Traditional Methods at Nokia: A Survey of Opinions on Agile Transformation. Information and Software Technology 53: 276–90. [Google Scholar] [CrossRef]
- Lakemond, Nicolette, Lars Bengtsson, Keld Laursen, and Fredrik Tell. 2016. Match and Manage: The Use of Knowledge Matching and Project Management to Integrate Knowledge in Collaborative Inbound Open Innovation. Industrial and Corporate Change 25: 333–52. [Google Scholar] [CrossRef]
- Liao, Suqin, Zhiying Liu, and Chaoliang Ma. 2019. Direct and Configurational Paths of Open Innovation and Organisational Agility to Business Model Innovation in SMEs. Technology Analysis & Strategic Management 31: 1213–28. [Google Scholar]
- Lichtenthaler, Ulrich. 2020. A Conceptual Framework for Combining Agile and Structured Innovation Processes. Research-Technology Management 63: 42–48. [Google Scholar] [CrossRef]
- Madrid-Guijarro, Antonia, Dominique Philippe Martin, and Domingo García-Pérez-de-Lema. 2021. Capacity of Open Innovation Activities in Fostering Product and Process Innovation in Manufacturing SMEs. Review of Managerial Science 15: 2137–64. [Google Scholar] [CrossRef]
- Marullo, Cristina, Alberto Di Minin, Chiara De Marco, and Andrea Piccaluga. 2020. Is Open Innovation Always the Best for SMEs? An Exploratory Analysis at the Project Level. Creativity and Innovation Management 29: 209–23. [Google Scholar] [CrossRef]
- Mathiyazhagan, Kaliyan, Vernika Agarwal, Andrea Appolloni, Tarik Saikouk, and Anna Gnanavelbabu. 2021. Integrating Lean and Agile Practices for Achieving Global Sustainability Goals in Indian Manufacturing Industries. Technological Forecasting and Social Change 171: 120982. [Google Scholar] [CrossRef]
- Mohiuddin Babu, Mujahid, Shahriar Akter, Mahfuzur Rahman, Md Morsaline Billah, and Dieu Hack-Polay. 2022. The Role of Artificial Intelligence in Shaping the Future of Agile Fashion Industry. Production Planning & Control, 1–15. [Google Scholar] [CrossRef]
- Naqshbandi, M. Muzamil, and Ibrahim Tabche. 2018. The Interplay of Leadership, Absorptive Capacity, and Organizational Learning Culture in Open Innovation: Testing a Moderated Mediation Model. Technological Forecasting and Social Change 133: 156–67. [Google Scholar] [CrossRef]
- Nepomuceno, Thyago, and Ana Costa. 2019. Resource Allocation with Time Series DEA Applied to Brazilian Federal Saving Banks. Economics Bulletin 39: 1384–92. [Google Scholar]
- Obradović, Tena, Božidar Vlačić, and Marina Dabić. 2021. Open Innovation in the Manufacturing Industry: A Review and Research Agenda. Technovation 102: 102221. [Google Scholar] [CrossRef]
- Oh, Minjeong, and Sungyong Choi. 2020. The Competence of Project Team Members and Success Factors with Open Innovation. Journal of Open Innovation: Technology, Market, and Complexity 6: 51. [Google Scholar] [CrossRef]
- Pellizzoni, Elena, Daniel Trabucchi, and Tommaso Buganza. 2019. When Agility Meets Open Innovation: Two Approaches to Manage Inbound Projects. Creativity and Innovation Management 28: 464–76. [Google Scholar] [CrossRef]
- Pollack, Julien, Jane Helm, and Daniel Adler. 2018. What Is the Iron Triangle, and How Has It Changed? International Journal of Managing Projects in Business 11: 527–547. [Google Scholar] [CrossRef]
- Putta, Abheeshta, Maria Paasivaara, and Casper Lassenius. 2018. Benefits and Challenges of Adopting the Scaled Agile Framework (SAFe): Preliminary Results from a Multivocal Literature Review. In International Conference on Product-Focused Software Process Improvement. Cham: Springer, pp. 334–51. [Google Scholar]
- Shaitura, Sergey, Alina Minitaeva, Konstantin Ordov, and Valeria Shaparenko. 2019. Virtual Enterprises in a Spatial Economy. International Journal of Recent Technology and Engineering 7: 719–24. [Google Scholar]
- Shamsuzzoha, Ahm, Mahmood Al-Kindi, and Nasr Al-Hinai. 2018. Open Innovation in Small and Medium Size Enterprises-Perspective from Virtual Collaboration. International Journal of Engineering and Technology Innovation 8: 173–90. [Google Scholar]
- Stenbeck, John. 2008. Five Keys to Estimating. In PMI® Global Congress. North America, Denver and Newtown Square: Project Management Institute. [Google Scholar]
- Stoica, Marian, Bogdan Ghilic-Micu, Marinela Mircea, and Cristian Uscatu. 2016. Analyzing Agile Development-from Waterfall Style to Scrumban. Informatica Economica 20: 5. [Google Scholar] [CrossRef]
- Yoon, Byungun, Juneseuk Shin, and Sungjoo Lee. 2016. Open Innovation Projects in SMEs as an Engine for Sustainable Growth. Sustainability 8: 146. [Google Scholar] [CrossRef]
- Yuana, Rivira, Eko Agus Prasetio, Rizal Syarief, Yandra Arkeman, and Arif Imam Suroso. 2021. System Dynamic and Simulation of Business Model Innovation in Digital Companies: An Open Innovation Approach. Journal of Open Innovation: Technology, Market, and Complexity 7: 219. [Google Scholar] [CrossRef]
- Yun, JinHyo Joseph, and Zheng Liu. 2019. Micro-and Macro-Dynamics of Open Innovation with a Quadruple-Helix Model. Sustainability 11: 3301. [Google Scholar] [CrossRef]
- Yusuf, Yahaya Y., Mansoor Sarhadi, and Angappa Gunasekaran. 1999. Agile Manufacturing: The Drivers, Concepts and Attributes. International Journal of Production Economics 62: 33–43. [Google Scholar] [CrossRef]
- Zhang, Yifei, Zhezhu Li, and Kun Liu. 2020. Design and Implementation of a Scrum Project Training Platform Supporting Virtual Enterprise Environment. Paper presented at 2020 IEEE 2nd International Conference on Computer Science and Educational Informatization (CSEI), Xinxiang, China, June 12–14; pp. 130–34. [Google Scholar]
- Zheng, Maosheng, Haipeng Teng, Jie Yu, Ying Cui, and Yi Wang. 2022. History and Current Status of Material Selection with Multi-Objective Optimization. In Probability-Based Multi-Objective Optimization for Material Selection. Singapore: Springer, pp. 1–6. [Google Scholar]
- Zid, Chaher, Narimah Kasim, and Ali Raza Soomro. 2020. Effective Project Management Approach to Attain Project Success, Based on Cost-Time-Quality. International Journal of Project Organisation and Management 12: 149–63. [Google Scholar] [CrossRef]
- Žužek, Tena, Žiga Gosar, Janez Kušar, and Tomaž Berlec. 2020. Adopting Agile Project Management Practices in Non-Software SMEs: A Case Study of a Slovenian Medium-Sized Manufacturing Company. Sustainability 12: 9245. [Google Scholar] [CrossRef]


Disclaimer/Publisher’s Note: The statements, opinions and data contained in all publications are solely those of the individual author(s) and contributor(s) and not of MDPI and/or the editor(s). MDPI and/or the editor(s) disclaim responsibility for any injury to people or property resulting from any ideas, methods, instructions or products referred to in the content. |
© 2023 by the authors. Licensee MDPI, Basel, Switzerland. This article is an open access article distributed under the terms and conditions of the Creative Commons Attribution (CC BY) license (https://creativecommons.org/licenses/by/4.0/).