Does the Relationship between Entrepreneurial Orientation and Subjective Financial Firm Performance Have an Inverted U-Shape? Evidence from Southeast European SMEs


Abstract
1. Introduction
2. Literature Review and Hypotheses
2.1. Entrepreneurial Orientation
2.2. EO and Firm Performance
2.3. Linearity of EO–Firm Performance Relationship
2.4. Moderators, Controls, and Context-Specific Factors Affecting the EO–Firm Performance Relationship
3. Research Method
3.1. Sample and Data Collection Procedure
3.2. Measures
3.2.1. Controls
3.2.2. Independent Variable
3.2.3. Dependent Variable
3.3. Analysis
4. Results
5. Discussion
5.1. Theoretical and Managerial Implications
5.2. Limitations and Future Research
5.3. Conclusions
Author Contributions
Funding
Institutional Review Board Statement
Informed Consent Statement
Data Availability Statement
Conflicts of Interest
References
- Abu-Rumman, Ayman, Ata Al Shraah, Faisal Al-Madi, and Tasneem Alfalah. 2021. Entrepreneurial networks, entrepreneurial orientation, and performance of small and medium enterprises: Are dynamic capabilities the missing link? Journal of Innovation and Entrepreneurship 10: 1–16. [Google Scholar] [CrossRef]
- Acosta, Alexandra Solano, Ángel Herrero Crespo, and Jesus Collado Agudo. 2018. Effect of market orientation, network capability and entrepreneurial orientation on international performance of small and medium enterprises (SMEs). International Business Review 27: 1128–40. [Google Scholar] [CrossRef]
- Alegre, Joaquin, and Ricardo Chiva. 2013. Linking Entrepreneurial Orientation and Firm Performance: The Role of Organizational Learning Capability and Innovation Performance. Journal of Small Business Management 51: 491–507. [Google Scholar] [CrossRef]
- Alonso-Dos-Santos, Manuel, and Orlando Llanos-Contreras. 2019. Family business performance in a post-disaster scenario: The influence of socioemotional wealth importance and entrepreneurial orientation. Journal of Business Research 101: 492–98. [Google Scholar] [CrossRef]
- Ameer, Farah, and Naveed R. Khan. 2020. Manager’s age, sustainable entrepreneurial orientation and sustainable performance: A conceptual outlook. Sustainability 12: 3196. [Google Scholar] [CrossRef]
- Andersén, Jim. 2010. A Critical Examination of the EO-performance Relationship. International Journal of Entrepreneurial Behavior & Research 16: 309–28. [Google Scholar] [CrossRef]
- Anderson, Brian S., and Yoshihiro Eshima. 2013. The Influence of Firm Age and Intangible Resources on the Relationship between Entrepreneurial Orientation and Firm Growth among Japanese SMEs. Journal of Business Venturing 28: 413–29. [Google Scholar] [CrossRef]
- Basco, Rodrigo, Felipe Hernández-Perlines, and María Rodríguez-García. 2020. The effect of entrepreneurial orientation on firm performance: A multigroup analysis comparing China, Mexico, and Spain. Journal of Business Research 113: 409–21. [Google Scholar] [CrossRef]
- Bauweraerts, Jonathan, and Olivier Colot. 2017. Exploring Nonlinear Effects of Family Involvement in the Board on Entrepreneurial Orientation. Journal of Business Research 70: 185–92. [Google Scholar] [CrossRef]
- Chaston, Ian, and Eugene Sadler-Smith. 2012. Entrepreneurial cognition, entrepreneurial orientation and firm capability in the creative industries. British Journal of Management 23: 415–32. [Google Scholar] [CrossRef]
- Chavez, Roberto, Wantao Yu, Muhammad Shakeel Sadiq Jajja, Antonio Lecuna, and Brian Fynes. 2020. Can entrepreneurial orientation improve sustainable development through leveraging internal lean practices? Business Strategy and the Environment 29: 2211–25. [Google Scholar] [CrossRef]
- Covin, Jeffrey G., and Dennis P. Slevin. 1989. Strategic management of small firms in hostile and benign environments. Strategic Management Journal 10: 75–87. [Google Scholar] [CrossRef]
- Covin, Jeffrey G., and Dennis P. Slevin. 1991. A Conceptual Model of Entrepreneurship as Firm Behavior. Entrepreneurship Theory and Practice 16: 7–26. [Google Scholar] [CrossRef]
- Covin, Jeffrey G., and William J. Wales. 2012. The Measurement of Entrepreneurial Orientation. Entrepreneurship: Theory and Practice 36: 677–702. [Google Scholar] [CrossRef]
- Covin, Jeffrey G., Kimberly M. Green, and Dennis P. Slevin. 2006. Strategic Process Effects on the Entrepreneurial Orientation–Sales Growth Rate Relationship. Entrepreneurship Theory and Practice 30: 57–81. [Google Scholar] [CrossRef]
- Donbesuur, Francis, Nathaniel Boso, and Magnus Hultman. 2020. The effect of entrepreneurial orientation on new venture performance: Contingency roles of entrepreneurial actions. Journal of Business Research 118: 150–61. [Google Scholar] [CrossRef]
- Genc, Ebru, Mumin Dayan, and Omer Faruk Genc. 2019. The impact of SME internationalization on innovation: The mediating role of market and entrepreneurial orientation. Industrial Marketing Management 82: 253–64. [Google Scholar] [CrossRef]
- Ghantous, Nabil, and Ibrahim Alnawas. 2020. The differential and synergistic effects of market orientation and entrepreneurial orientation on hotel ambidexterity. Journal of Retailing and Consumer Services 55: 102072. [Google Scholar] [CrossRef]
- Gonzalez, Rodrigo Valio Dominguez, and Tatiana Massaroli de Melo. 2018. The Effects of Organization Context on Knowledge Exploration and Exploitation. Journal of Business Research 90: 215–25. [Google Scholar] [CrossRef]
- Gupta, Anil K., and Vijay Govindarajan. 1984. Business unit strategy, managerial characteristics, and business unit effectiveness at strategy implementation. Academy of Management Journal 27: 25–41. [Google Scholar] [CrossRef]
- Gupta, Vishal K., and Safal Batra. 2016. Entrepreneurial Orientation and Firm Performance in Indian SMEs: Universal and Contingency Perspectives. International Small Business Journal 34: 660–82. [Google Scholar] [CrossRef]
- Gupta, Vishal K., and William J. Wales. 2017. Assessing Organisational Performance Within Entrepreneurial Orientation Research: Where Have We Been and Where Can We Go from Here? The Journal of Entrepreneurship 26: 51–76. [Google Scholar] [CrossRef]
- Hina, Syeda Mahlaqa, Gul Hassan, Mahwish Parveen, and Syeda Arooj. 2021. Impact of Entrepreneurial Orientation on Firm Performance through Organizational Learning: The Moderating Role of Environmental Turbulence. Performance Improvement Quarterly 34: 77–104. [Google Scholar] [CrossRef]
- Kiani, Ataullah, Delin Yang, Usman Ghani, and Mathew Hughes. 2022. Entrepreneurial passion and technological innovation: The mediating effect of entrepreneurial orientation. Technology Analysis & Strategic Management 34: 1139–52. [Google Scholar] [CrossRef]
- Kohtamäki, Marko, Jesse Heimonen, and Vinit Parida. 2019. The Nonlinear Relationship between Entrepreneurial Orientation and Sales Growth: The Moderating Effects of Slack Resources and Absorptive Capacity. Journal of Business Research 100: 100–10. [Google Scholar] [CrossRef]
- Kraus, Sascha, J. P. Coen Rigtering, Mathew Hughes, and Vincent Hosman. 2012. Entrepreneurial Orientation and the Business Performance of SMEs: A Quantitative Study from the Netherlands. Review of Managerial Science 6: 161–82. [Google Scholar] [CrossRef]
- Kreiser, Patrick, Louis D. Marino, Donald Kuratko, and Mark K. Weaver. 2013. Disaggregating Entrepreneurial Orientation: The Non-Linear Impact of Innovativeness, Proactiveness and Risk-Taking on SME Performance. Small Business Economics 40: 273–91. [Google Scholar] [CrossRef]
- Laskovaia, Anastasiia, Louis D. Marino, Galina Shirokova, and William Wales. 2019. Expect the unexpected: Examining the shaping role of entrepreneurial orientation on causal and effectual decision-making logic during economic crisis. Entrepreneurship & Regional Development 31: 456–75. [Google Scholar] [CrossRef]
- Lomberg, Carina, Diemo Urbig, Christoph Stöckmann, Louis D. Marino, and Pat H. Dickson. 2017. Entrepreneurial Orientation: The Dimensions’ Shared Effects in Explaining Firm Performance. Entrepreneurship Theory and Practice 41: 973–98. [Google Scholar] [CrossRef]
- Lumpkin, George Thomas, and Gregory G. Dess. 1996. Clarifying the Entrepreneurial Orientation Construct and Linking It to Performance. The Academy of Management Review 21: 135. [Google Scholar] [CrossRef]
- Luu, Ngoc, and Liem Viet Ngo. 2019. Entrepreneurial Orientation and Social Ties in Transitional Economies. Long Range Planning 52: 103–16. [Google Scholar] [CrossRef]
- Messersmith, Jake G., and William J. Wales. 2013. Entrepreneurial orientation and performance in young firms: The role of human resource management. International Small Business Journal 31: 115–36. [Google Scholar] [CrossRef]
- Miller, Danny. 1983. The Correlates of Entrepreneurship in Three Types of Firms. Management Science 29: 770–91. [Google Scholar] [CrossRef]
- Miller, Danny, and Peter H. Friesen. 1982. Innovation in Conservative and Entrepreneurial Firms: Two Models of Strategic Momentum. Strategic Management Journal 3: 1–25. [Google Scholar] [CrossRef]
- Morgan, Todd, and Sergey Alexander Anokhin. 2020. The joint impact of entrepreneurial orientation and market orientation in new product development: Studying firm and environmental contingencies. Journal of Business Research 113: 129–38. [Google Scholar] [CrossRef]
- Morić-Milovanović, Bojan. 2012. Moderating effect of external environment on the entrepreneurial orientation and business performance relationship of Croatian small and medium sized manufacturing enterprises. Poslovna Izvrsnost 6: 9–23. [Google Scholar]
- Morić-Milovanović, Bojan. 2022. Exploring Direct and Non-Linear Effects of Entrepreneurial Orientation and Its Dimensions on Firm Performance in a Small, Open, Transitional Economy. Strategic Management 27: 26–38. [Google Scholar] [CrossRef]
- Morić-Milovanović, Bojan, Zoran Wittine, and Zoran Bubaš. 2021. Examining Entrepreneurial Orientation–Performance Relationship among Croatian Service SMEs. Ekonomska Misao i Praksa 30: 509–26. [Google Scholar] [CrossRef]
- Naman, John L., and Dennis P. Slevin. 1993. Entrepreneurship and the concept of fit: A model and empirical tests. Strategic Management Journal 14: 137–153. [Google Scholar] [CrossRef]
- Petrović, Želimir, Svetlana Vukotić, Jugoslav Aničić, and Nebojša Zakić. 2015. Moderating Effect of National Culture on the Relationship between Entrepreneurial Orientation and Business Performance: An Evidence from Serbia. New Technologies 3: 84–89. [Google Scholar]
- Putniņš, Talis J., and Arnis Sauka. 2020. Why Does Entrepreneurial Orientation Affect Company Performance? Strategic Entrepreneurship Journal 14: 711–35. [Google Scholar] [CrossRef]
- Rauch, Andreas, Johan Wiklund, George Thomas Lumpkin, and Michael Frese. 2009. Entrepreneurial Orientation and Business Performance: An Assessment of Past Research and Suggestions for the Future. Entrepreneurship Theory and Practice 33: 761–87. [Google Scholar] [CrossRef]
- Schepers, Jelle, Wim Voordeckers, Tensie Steijvers, and Eddy Laveren. 2014. The Entrepreneurial Orientation–Performance Relationship in Private Family Firms: The Moderating Role of Socioemotional Wealth. Small Business Economics 43: 39–55. [Google Scholar] [CrossRef]
- Sciascia, Salvatore, Laura D’Oria, Massimiliano Bruni, and Barbara Larrañeta. 2014. Entrepreneurial Orientation in Low- and Medium-Tech Industries: The Need for Absorptive Capacity to Increase Performance. European Management Journal 32: 761–69. [Google Scholar] [CrossRef]
- Sciascia, Salvatore, Pietro Mazzola, and Francesco Chirico. 2013. Generational Involvement in the Top Management Team of Family Firms: Exploring Nonlinear Effects on Entrepreneurial Orientation. Entrepreneurship Theory and Practice 37: 69–85. [Google Scholar] [CrossRef]
- Seo, Ribin. 2019. Entrepreneurial Orientation and Innovation Performance: Insights from Korean Ventures. EJIM 23: 675–95. [Google Scholar] [CrossRef]
- Šlogar, Helena. 2021. Longitudinal Research—Entrepreneurial Orientation Impact, Innovativeness, and Business Performance in Croatian Companies. Entrepreneurship and Sustainability Issues 9: 152–68. [Google Scholar] [CrossRef] [PubMed]
- Šlogar, Helena, and Heri Bezić. 2020. The Relationship between Entrepreneurial Orientation and Innovativeness in Croatian Companies. Poslovna Izvrsnost—Business Excellence 14: 71–87. [Google Scholar] [CrossRef]
- Su, Zhongfeng, En Xie, and Dong Wang. 2015. Entrepreneurial Orientation, Managerial Networking, and New Venture Performance in China. Journal of Small Business Management 53: 228–48. [Google Scholar] [CrossRef]
- Su, Zhongfeng, En Xie, and Yuan Li. 2011. Entrepreneurial Orientation and Firm Performance in New Ventures and Established Firms. Journal of Small Business Management 49: 558–77. [Google Scholar] [CrossRef]
- Tang, Jintong, Zhi Tang, Louis D. Marino, Yuli Zhang, and Qianwen Li. 2008. Exploring an Inverted U–Shape Relationship between Entrepreneurial Orientation and Performance in Chinese Ventures. Entrepreneurship Theory and Practice 32: 219–39. [Google Scholar] [CrossRef]
- Tang, Zhi, and Jintong Tang. 2012. Entrepreneurial Orientation and SME Performance in China’s Changing Environment: The Moderating Effects of Strategies. Asia Pacific Journal of Management 29: 409–31. [Google Scholar] [CrossRef]
- Veselinović, Ljiljan, Mirza Kulenović, Lejla Turulja, and Merima Činjarević. 2021. The Interplay of Entrepreneurial Orientation, Total Quality Management, and Financial Performance. Total Quality Management & Business Excellence 32: 1732–50. [Google Scholar] [CrossRef]
- Wales, William John. 2016. Entrepreneurial Orientation: A Review and Synthesis of Promising Research Directions. International Small Business Journal 34: 3–15. [Google Scholar] [CrossRef]
- Wales, William John, Jeffrey G. Covin, and Erik Monsen. 2020. Entrepreneurial orientation: The necessity of a multilevel conceptualization. Strategic Entrepreneurship Journal 14: 639–60. [Google Scholar] [CrossRef]
- Wales, William John, Pankaj C. Patel, Vinit Parida, and Patrick M. Kreiser. 2013. Nonlinear Effects of Entrepreneurial Orientation on Small Firm Performance: The Moderating Role of Resource Orchestration Capabilities: Nonlinear Effects of EO on Small Firm Performance. Strategic Entrepreneurship Journal 7: 93–121. [Google Scholar] [CrossRef]
- Wales, William John, Sascha Kraus, Matthias Filser, Christoph Stöckmann, and Jeffrey G. Covin. 2021. The Status Quo of Research on Entrepreneurial Orientation: Conversational Landmarks and Theoretical Scaffolding. Journal of Business Research 128: 564–77. [Google Scholar] [CrossRef]
- Wales, William, Johan Wiklund, and Alexander McKelvie. 2015. What about new entry? Examining the theorized role of new entry in the entrepreneurial orientation–performance relationship. International Small Business Journal 33: 351–73. [Google Scholar] [CrossRef]
- Wang, Ming Chao, Pei Chen Chen, and Shih Chieh Fang. 2020. How environmental turbulence influences firms’ entrepreneurial orientation: The moderating role of network relationships and organizational inertia. Journal of Business & Industrial Marketing 36: 48–59. [Google Scholar] [CrossRef]
- Wiklund, Johan, and Dean Shepherd. 2005. Entrepreneurial Orientation and Small Business Performance: A Configurational Approach. Journal of Business Venturing 20: 71–91. [Google Scholar] [CrossRef]
- Zahra, Shaker A. 1991. Predictors and Financial Outcomes of Corporate Entrepreneurship: An Exploratory Study. Journal of Business Venturing 6: 259–85. [Google Scholar] [CrossRef]
- Zahra, Shaker A., and Dennis M. Garvis. 2000. International Corporate Entrepreneurship and Firm Performance: The Moderating Effect of International Environmental Hostility. Journal of Business Venturing 15: 469–92. [Google Scholar] [CrossRef]
- Zahra, Shaker A., Daniel F. Jennings, and Donald F. Kuratko. 1999. The Antecedents and Consequences of Firm-Level Entrepreneurship: The State of the Field. Entrepreneurship Theory and Practice 24: 45–65. [Google Scholar] [CrossRef]
- Zaidi, Syed Shahan Ali, and Syed Shahid Zaheer Zaidi. 2021. Linking Entrepreneurial Orientation and Innovation Intensity: Moderating Role of Environmental Turbulence. Journal of Entrepreneurship, Management, and Innovation 3: 202–36. [Google Scholar] [CrossRef]
- Zhang, Jing A., Conor O’Kane, and Guoquan Chen. 2020. Business ties, political ties, and innovation performance in Chinese industrial firms: The role of entrepreneurial orientation and environmental dynamism. Journal of Business Research 121: 254–67. [Google Scholar] [CrossRef]
- Zhang, Zhe, Xin Wang, and Ming Jia. 2021. Echoes of CEO entrepreneurial orientation: How and when CEO entrepreneurial orientation influences dual CSR activities. Journal of Business Ethics 169: 609–29. [Google Scholar] [CrossRef]


| Mean | SD | 1 | 2 | 3 | 4 | 5 | 6 | 7 | 8 | 9 | |
|---|---|---|---|---|---|---|---|---|---|---|---|
| 1. Country | 3.29 | 1.45 | 1.00 | ||||||||
| 2. Firm size | 1.75 | 0.73 | −0.038 | 1.00 | |||||||
| 3. Industry | 4.86 | 2.20 | 0.065 * | −0.276 ** | 1.00 | ||||||
| 4. Turbulence | 4.25 | 1.05 | −0.053 | −0.076 * | −0.047 | 1.00 | |||||
| 5. EO | 4.26 | 1.13 | −0.017 | 0.033 | 0.018 | 0.206 ** | 1.00 | ||||
| 6. EO2 | 1.28 | 1.70 | −0.031 | −0.076 * | 0.020 | −0.004 | −0.0200 ** | 1.00 | |||
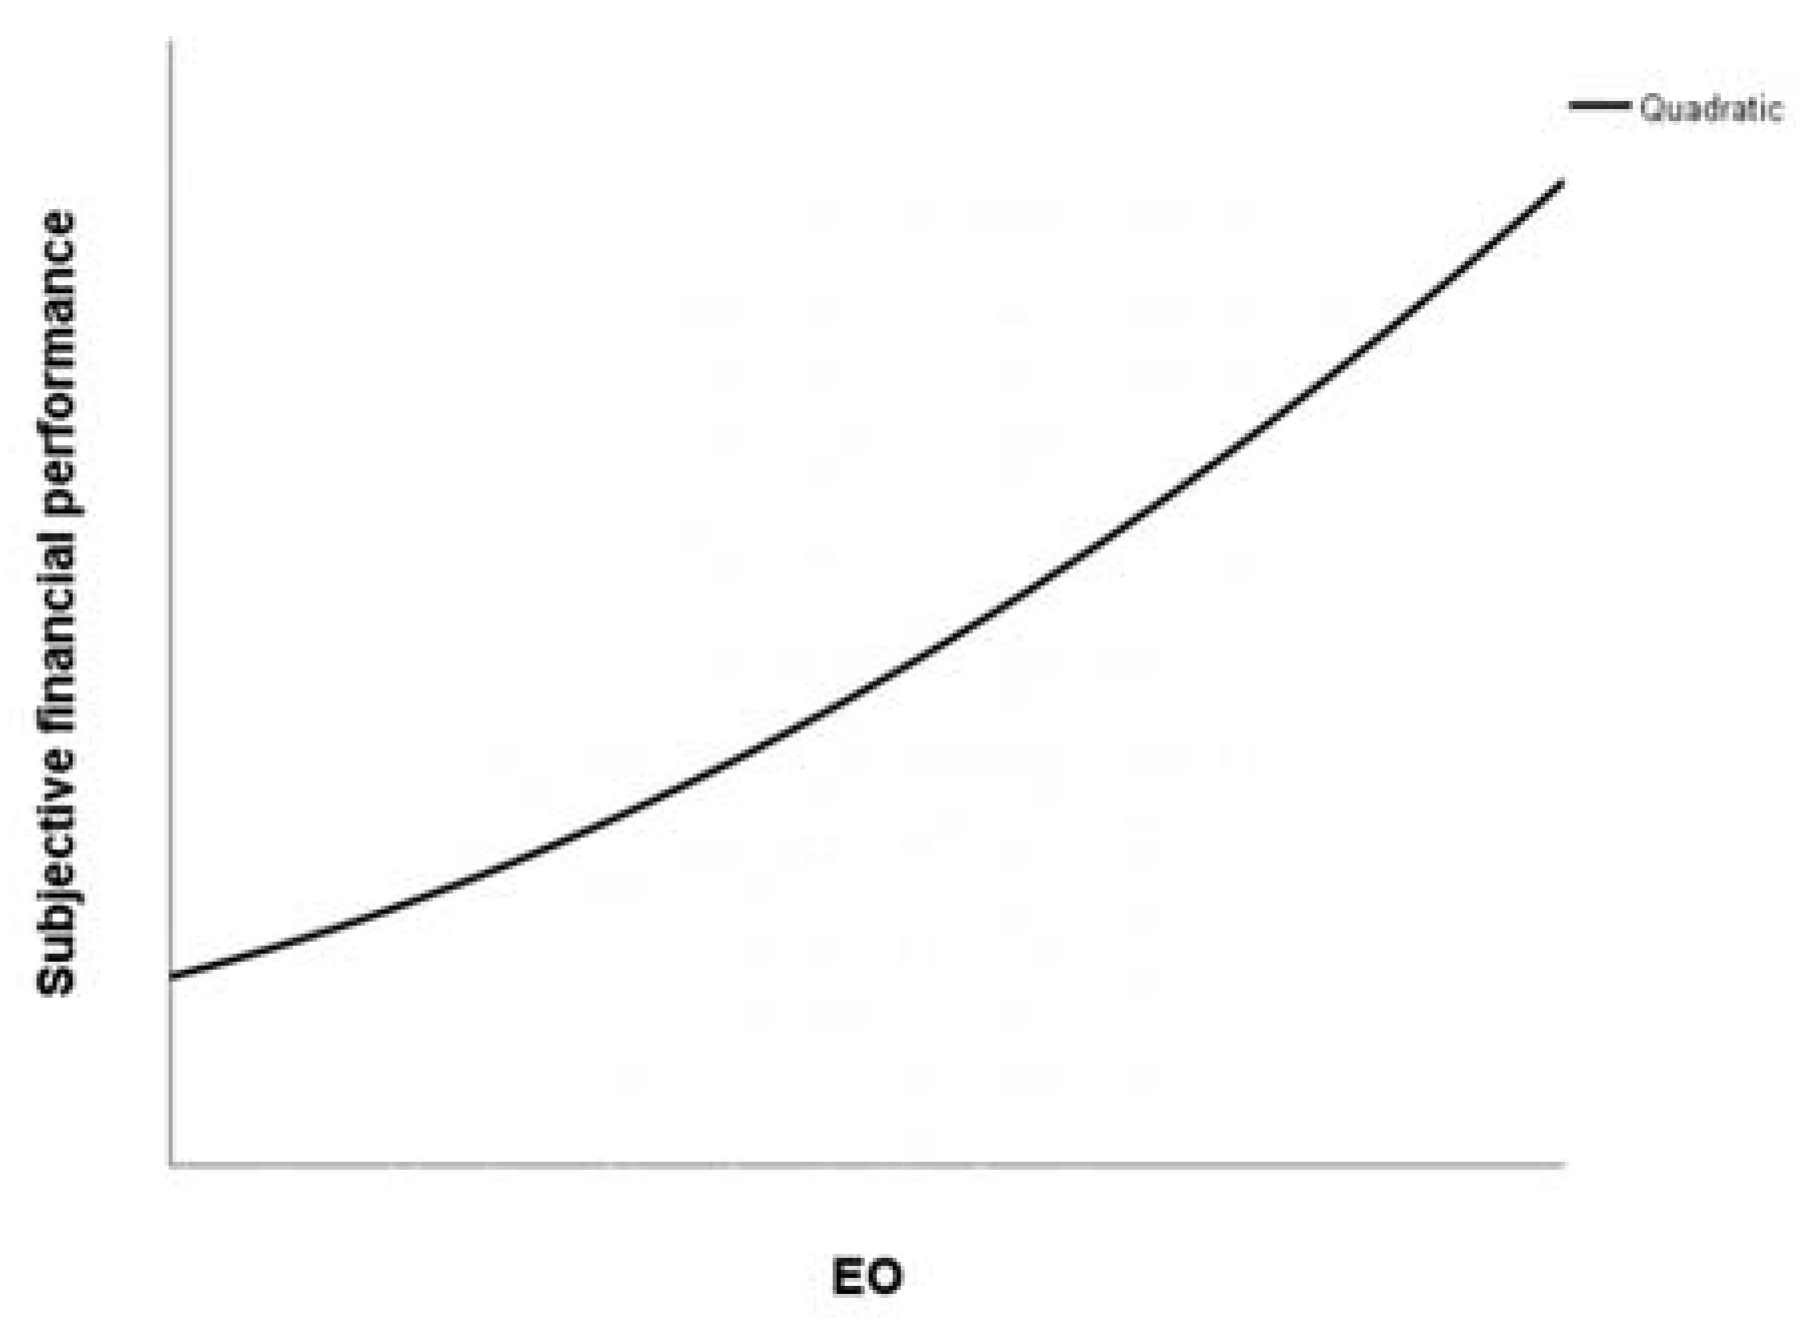
| 7. Performance | 3.88 | 1.49 | 0.034 | 0.153 ** | −0.039 | −0.065 * | 0.355 ** | −0.026 | 1.00 | ||
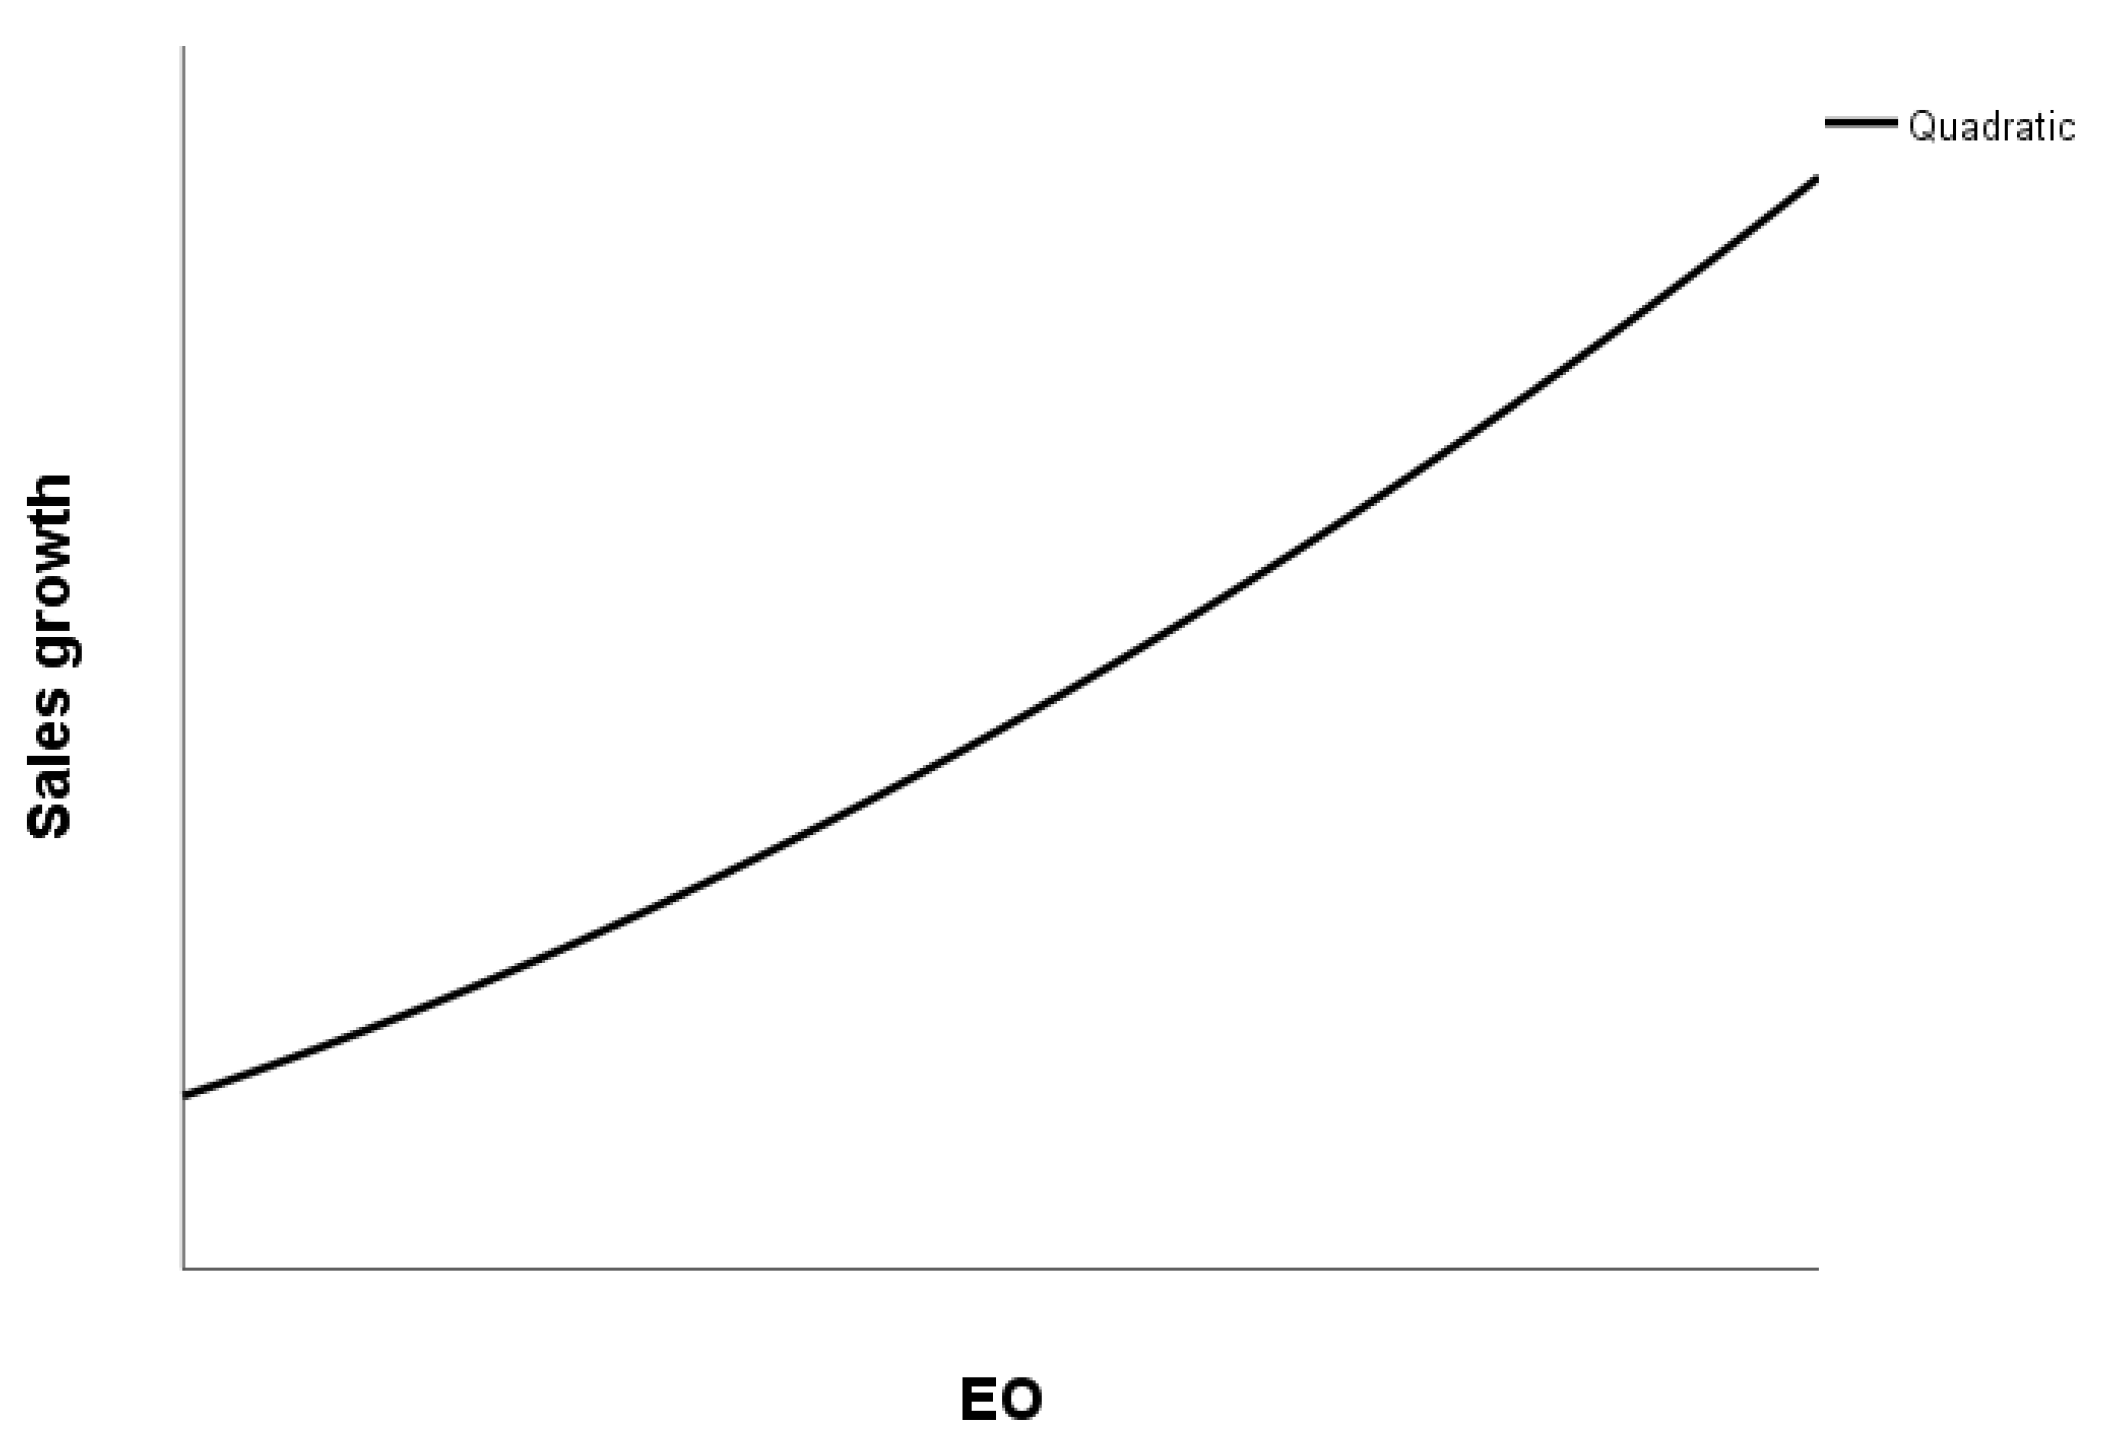
| 8. Sales growth | 3.95 | 1.63 | 0.030 | 0.160 ** | −0.032 | −0.041 | 0.347 ** | −0.037 | 0.920 ** | 1.00 | |
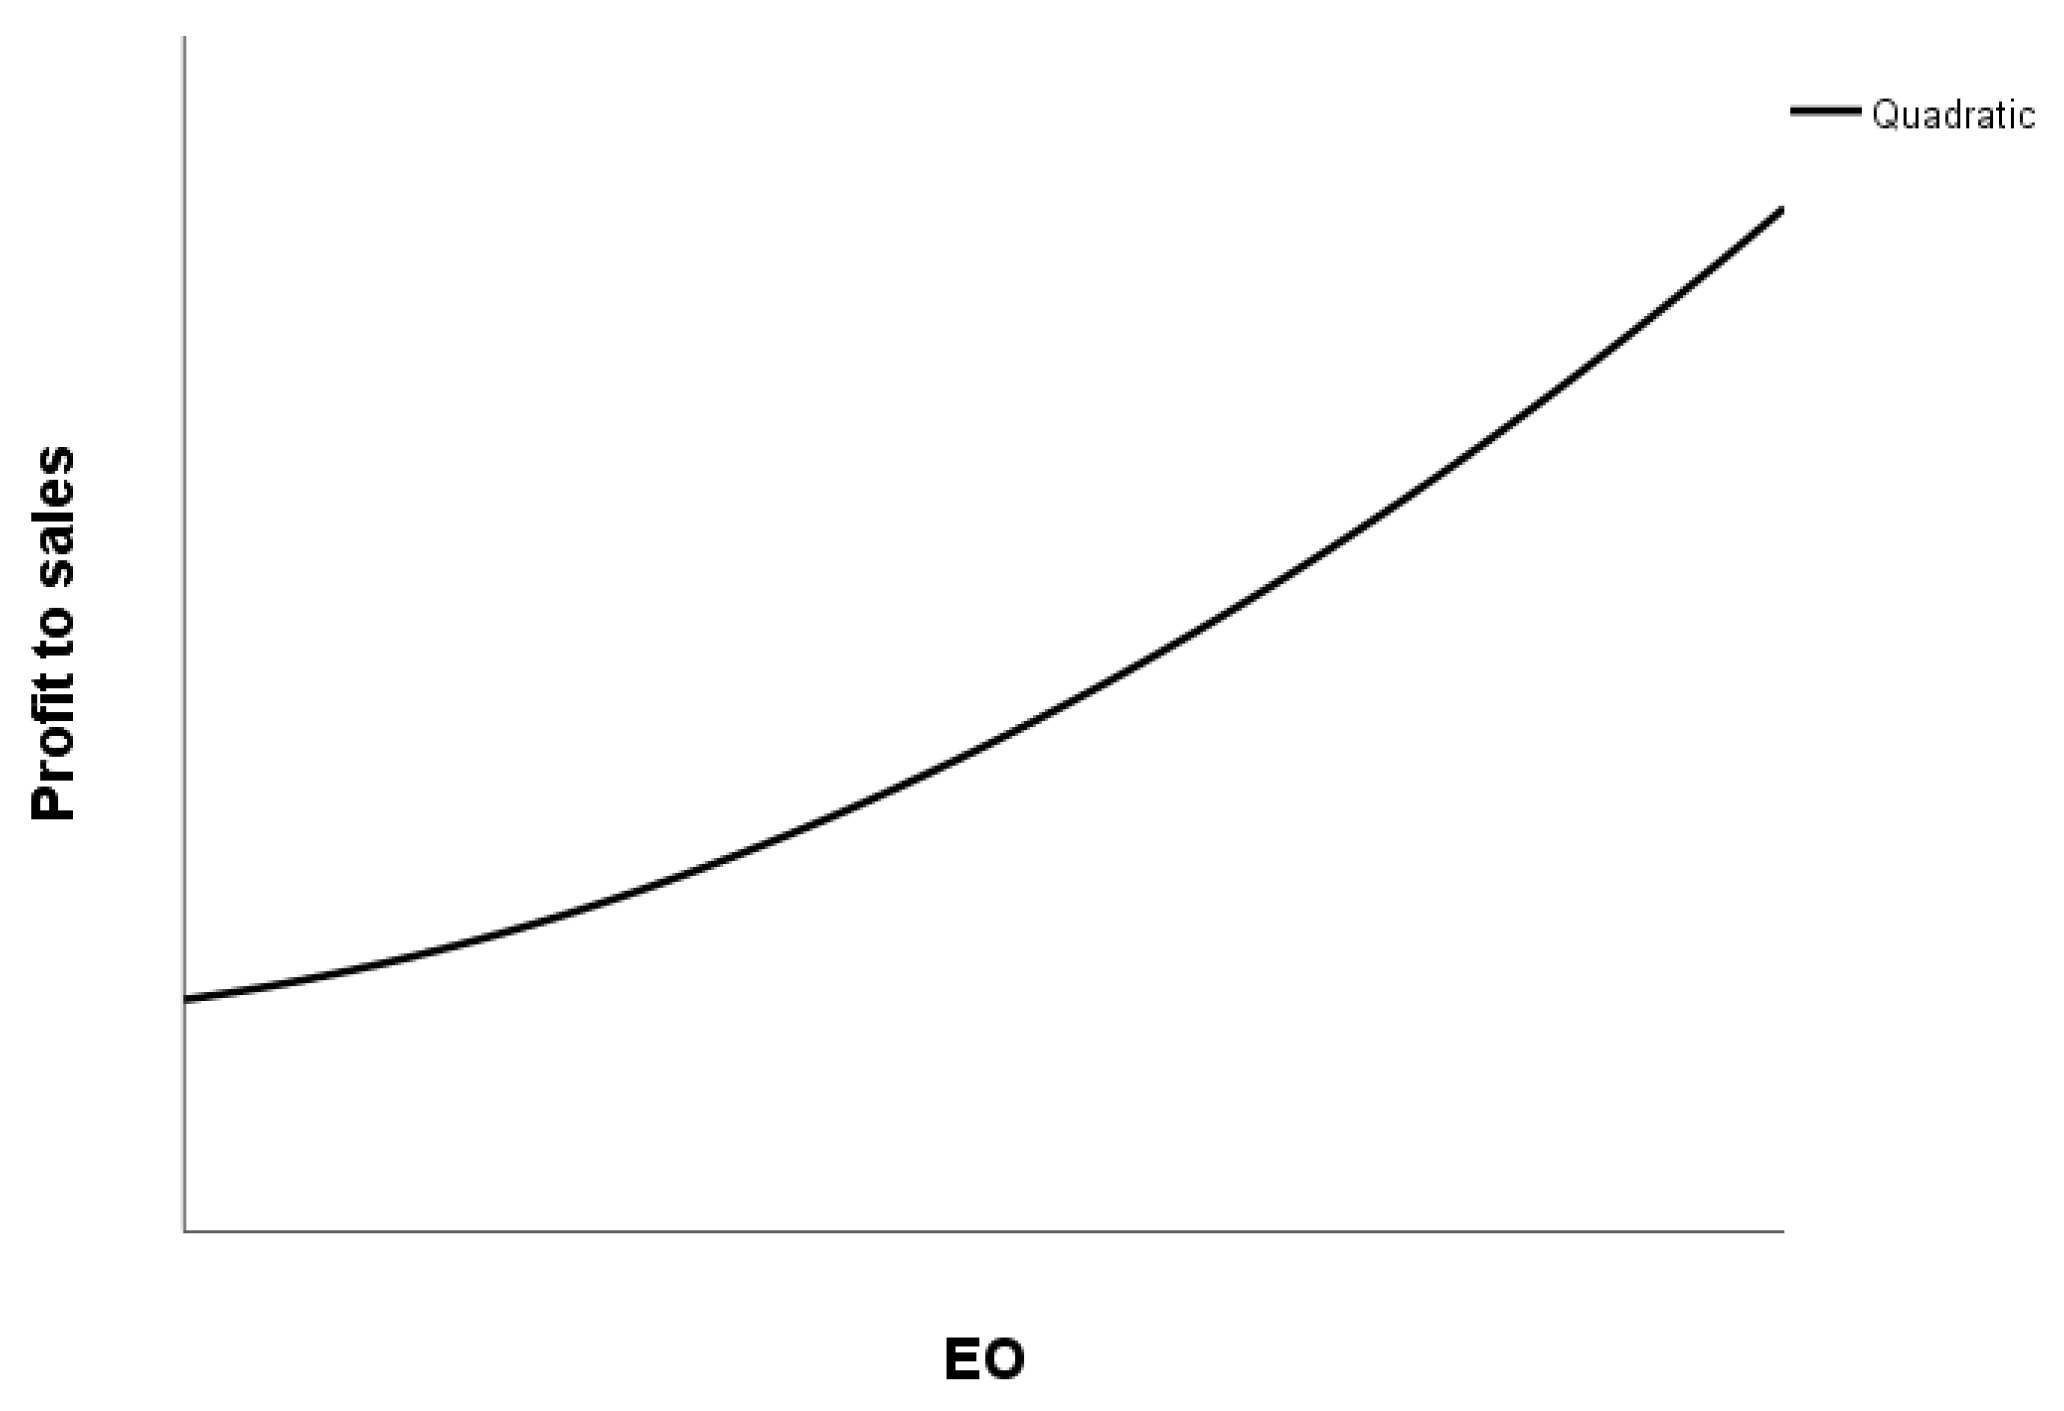
| 9. Profit to sales | 3.82 | 1.62 | 0.032 | 0.120 ** | −0.039 | −0.079 * | 0.306 ** | −0.010 | 0.919 ** | 0.692 ** | 1.00 |
| Variables | Model 1: Control Variables | Model 2: Direct Effects | Model 3: Nonlinear Effects |
|---|---|---|---|
| Controls | |||
| Country | 0.038 (0.033) | 0.040 (0.031) | 0.043 (0.030) |
| Firm size | 0.306 (0.068) *** | 0.258 (0.063) *** | 0.266 (0.063) *** |
| Industry | −0.002 (0.023) | −0.013 (0.021) | −0.014 (0.021) |
| Turbulence | −0.074 (0.046) | −0.189 (0.043) *** | −0.192 (0.043) *** |
| Direct effects | |||
| EO | 0.500 (0.040) *** | 0.517 (0.041) *** | |
| Nonlinear effects | |||
| EO2 | 0.056 (0.026) ** | ||
| Model stats | |||
| R-squared | 0.027 *** | 0.165 *** | 0.168 *** |
| Adj. R-squared | 0.023 *** | 0.160 *** | 0.163 *** |
| ∆R-squared | 0.027 *** | 0.137 *** | 0.004 *** |
| Variables | Model 1: Control Variables | Model 2: Direct Effects | Model 3: Nonlinear Effects |
|---|---|---|---|
| Controls | |||
| Country | 0.039 (0.036) | 0.041 (0.033) | 0.043 (0.033) |
| Firm size | 0.362 (0.074) *** | 0.312 (0.069) *** | 0.319 (0.070) *** |
| Industry | 0.007 (0.025) | −0.006 (0.023) | −0.006 (0.023) |
| Turbulence | −0.041 (0.050) | −0.162 (0.048) *** | −0.164 (0.048) *** |
| Direct effects | |||
| EO | 0.524 (0.044) *** | 0.538 (0.045) *** | |
| Nonlinear effects | |||
| EO2 | 0.047 (0.029) * | ||
| Model stats | |||
| R-squared | 0.028 *** | 0.155 *** | 0.157 *** |
| Adj. R-squared | 0.024 *** | 0.150 *** | 0.152 *** |
| ∆R-squared | 0.028 *** | 0.127 *** | 0.002 *** |
| Variables | Model 1: Control Variables | Model 2: Direct Effects | Model 3: Nonlinear Effects |
|---|---|---|---|
| Controls | |||
| Country | 0.037 (0.036) | 0.039 (0.034) | 0.042 (0.034) |
| Firm size | 0.250 (0.074) *** | 0.204 (0.070) *** | 0.214 (0.070) *** |
| Industry | −0.010 (0.025) | −0.021 (0.023) | −0.022 (0.023) |
| Turbulence | −0.107 (0.050) ** | −0.216 (0.048) *** | −0.219 (0.048) *** |
| Direct effects | |||
| EO | 0.475 (0.044) *** | 0.495 (0.045) *** | |
| Nonlinear effects | |||
| EO2 | 0.064 (0.029) ** | ||
| Model stats | |||
| R-squared | 0.021 *** | 0.126 *** | 0.130 *** |
| Adj. R-squared | 0.016 *** | 0.122 *** | 0.125 *** |
| ∆R-squared | 0.021 *** | 0.106 *** | 0.004 *** |
Disclaimer/Publisher’s Note: The statements, opinions and data contained in all publications are solely those of the individual author(s) and contributor(s) and not of MDPI and/or the editor(s). MDPI and/or the editor(s) disclaim responsibility for any injury to people or property resulting from any ideas, methods, instructions or products referred to in the content. |
© 2023 by the authors. Licensee MDPI, Basel, Switzerland. This article is an open access article distributed under the terms and conditions of the Creative Commons Attribution (CC BY) license (https://creativecommons.org/licenses/by/4.0/).
Share and Cite
Šlogar, H.; Morić Milovanović, B.; Hrvatin, S. Does the Relationship between Entrepreneurial Orientation and Subjective Financial Firm Performance Have an Inverted U-Shape? Evidence from Southeast European SMEs. Adm. Sci. 2023, 13, 26. https://doi.org/10.3390/admsci13020026
Šlogar H, Morić Milovanović B, Hrvatin S. Does the Relationship between Entrepreneurial Orientation and Subjective Financial Firm Performance Have an Inverted U-Shape? Evidence from Southeast European SMEs. Administrative Sciences. 2023; 13(2):26. https://doi.org/10.3390/admsci13020026
Chicago/Turabian StyleŠlogar, Helena, Bojan Morić Milovanović, and Stella Hrvatin. 2023. "Does the Relationship between Entrepreneurial Orientation and Subjective Financial Firm Performance Have an Inverted U-Shape? Evidence from Southeast European SMEs" Administrative Sciences 13, no. 2: 26. https://doi.org/10.3390/admsci13020026
APA StyleŠlogar, H., Morić Milovanović, B., & Hrvatin, S. (2023). Does the Relationship between Entrepreneurial Orientation and Subjective Financial Firm Performance Have an Inverted U-Shape? Evidence from Southeast European SMEs. Administrative Sciences, 13(2), 26. https://doi.org/10.3390/admsci13020026