Abstract
This research paper presents and discusses the main results generated and obtained with the proprietary computer platform CIDIUS®, developed by the authors of this work, which aims to support the decision-making process of Portuguese mayors. Thus, keeping in mind the theoretical models and based on the data collected through the questionnaire given to the population, we tried to understand the influence that the dimensions Notoriety, Image, and Reputation (NIR), Citizen and Voter Expectations (CVE), Contestation and Complaint of the Municipal Executive (CCME), Perceived Value (PV), and Organizational Performance and Perceived Quality (OPPQ) has a positive effect on Municipe Satisfaction (MS). The parishes of the municipality of Valongo were selected and analyzed, namely the parishes of Alfena, Campo e Sobrado, Valongo, and Ermesinde, and a total of 998 valid questionnaires were collected. It was concluded that all studied dimensions except the Organizational Performance and Perceived Quality (OPPQ) dimension had a positive and statistically significant impact on Municipe Satisfaction (MS). The results of this research suggest the need for the use of these opinion-gathering techniques to encourage active citizen involvement in the daily life of their municipality, as well as the need for valid information that gives executives the ability to take political action that is appropriate to the interests and expectations of citizens.
1. Introduction
The history of satisfaction measurement is linked to the plurality of the evolution of the concept of quality of products and services (Kim et al. 2018; Zope et al. 2014). Currently, the issues of quality and satisfaction have particular relevance in governance whose actors are elected by the community, mandated for a certain time horizon in which individuals are simultaneously citizens, residents, and voters. The understanding of such matters requires a valid and reliable scientific and methodological construction in order to enrich knowledge in the area by planning data collection capable of testing various research hypotheses (Hair et al. 2019). It should be noted that the main characteristics of a scientific work are objectivity, refutability, analytical character, and communicability of the results so that they can be reproduced and verified.
One of the basic principles of public quality is focus, which emphasizes the importance of public administration in understanding citizens’ needs in order to meet their expectations in a broad sense. The understanding of this reality is only possible by directly questioning citizens about their expectations and needs regarding the public services provided by the public administration (Perry and Christensen 2015).
The Municipal Rating System is composed of several dimensions of analysis (Notoriety, Image, and Reputation, Citizen and Voter Expectations, Contestation and Complaint of the Municipal Executive, Perceived Value Organizational Performance and Perceived Quality, and Municipe Satisfaction) and was applied in order to build a Municipality Compliance Index capable of measuring the services provided by companies and institutions, regardless of their nature. In this context, cities, as an object of study, have been the target of multiple indexes, annotations, and classifications. Since ancient times, the city has been a meeting place and a place for sharing, where economy and knowledge, people and culture, and security and power come together. According to the latest UN report on world urbanization, there has been a significant migratory flow towards cities over the last 25 years. Half the world’s population now lives in urban areas (Bocquier 2005). The city has become a human sponge, subordinated to the laws of supply and demand, where people seek work, education, housing, mobility, and safety, and always on the assumption that the cities that innovate and develop their knowledge the most are more prosperous, fair, and inclusive and therefore more attractive and healthy.
The Municipal Rating System is part of the current smart cities and urban analytics, which advocates the development of knowledge and intelligence in and from urban contexts. In general, it is a mechanism for evaluating the expectations and perceptions of the community regarding the intervention of elected representatives and municipal dynamics. However, on the other hand, and in concrete terms, it is both an analysis model and a digital platform mediating the constructive relationship between the municipality and the citizenry, thus becoming a management instrument and an innovative tool in the national and European scene.
The Municipal Rating System is based on a global, integrative, structural, longitudinal, probabilistic, and estimation model of the performance of local authorities and perceptions of citizens. The structural approach consists of assigning a weight to the vectors of political intervention, whose implementation over time is valued between the company and the municipality, combined with the citizens’ perception of the achievements of the local government. In this way, it is probably the most potent and weighted approach to evaluating local authority performance. In this sense, the Municipal Rating System makes it possible to observe the levels and nature of the collective perception of the public behavior of elected representatives from a perspective that is quantifiable, comparable, relatable, and predictive of future electoral behavior. The Municipal Rating System comprises 3 dimensions, 12 indicators and 107 analysis variables that make up the dimensions of our general satisfaction model. Four indicators form the dimension of the citizen’s perceived value: Notoriety, Image, and Reputation (20 variables); citizen and voter expectations (5 variables); Organizational Performance and Perceived Quality (27 variables); and Fees, Process, Means, and Payment Deadlines (5 variables). The dimension of citizen satisfaction is formed by four indicators: satisfaction with the different intervention axes (13 variables); satisfaction with municipal services (20 variables); satisfaction with the municipal executive (four variables); and overall satisfaction with the municipality (one variable). Finally, the dimension of voter leader is formed by four indicators: Evaluation of the Mayor (two variables); Evaluation of the Municipal Executive (one variable); Recommendation of the Municipal Executive and the Municipality (five variables), and Contestation and Complaint about the Municipal Executive (four variables).
The data collection questionnaire was based on the following theoretical models: SERVQUAL, the Common Measurement Tool (CMT), the Common Assessment Framework (CAF), Speyer’s model, and the European Customer Satisfaction Index (ECSI). It should be noted that none of these models have been adjusted and validated so far to public administration or to the evaluation of Portuguese public services. Therefore, our model and the respective survey are a reference in understanding the phenomenon of public performance and Municipe Satisfaction. In this sense, the purpose of this paper is to explore the relationships between variables and to determine the dependence between dimensions, indicators, and variables present in the general model of Municipe Satisfaction, whose antecedents are related to the citizen’s perceived value and the consequences related to the citizens’ evaluation, recommendation, and contestation. The transition from the bureaucratic model to the model based on service delivery is one of the vectors of administrative modernization, at both the national and regional and local governance levels. Local government has come to play a central role in the performance of the state because of the greater proximity between elected officials and citizens. Today, citizens expect and demand more and better services from the public administration, so the response must be proportionate, fast, efficient, and high-quality. As such, the evaluation of organizational performance and the quality of the service provided should be measured regularly and by professionals.
2. Literature Review
The management of budget difficulties and increasing demands from citizens are the main challenges faced by public administration in general. In this context, the quality of public services emerges as a priority for governments in most Western countries. Quality is a multivariable concept, loaded with different meanings, where there is still no consensus in terms of the definition. Most experts define the concept of quality (Elassy 2015) in general terms as conformity (Crosby 1979), suitability (Juran and DeFeo 1988), and customer satisfaction (Eiglier and Langeard 1991; Garvin 1988). Indeed, while the origins of the quality theory are based on the quality of results, in recent decades, the concept has integrated a number of aspects of organizational management and product reality (Foster and Jonker 2003).
Client satisfaction demands efficiency and effectiveness from states at the administrative and relational levels, which must be analyzed from an integrated and holistic perspective. To this end, states must listen to and involve citizens in their dynamics in order to increasingly meet their needs and expectations. It is in this systematized and controlled interaction that the State improves its performance in the provision of public services (Adam 2020). By taking citizens’ opinions seriously, as citizens are the main beneficiary of public services (Winkler 1987; Thomas and Palfrey 1996), politicians ascertain public needs and develop strategies and services that add value to people’s lives.
One of the essential aspects of this research work is the evaluation of the performance of municipalities from the customer’s perspective, since this type of organization should be at the service of the community and society. It was in the 1990s that many economies came to understand that performance evaluation was essential in legitimizing and improving public service practices (Broom 1995; Denhardt and Denhardt 2015). The definition and improvement of services became a central issue in public administration (Boyne 2003). The OECD itself in 2000 noted that the modernization of the public sector involves performance management and evaluation because of growing social and business demands (Lau 2000). Similarly to the private sector, performance evaluation allows for the improvement of organizational processes and the implementation of an evaluation methodology capable of assisting leaders’ and managers’ decision-making processes. In this context, this paper is a reflection on the dimensions, indicators, and variables of organizational performance evaluation and municipal public satisfaction (Zakaria et al. 2017; Collins et al. 2019).
We live in times when financial and accounting metrics can no longer clarify the reality of municipal efficiency and performance, because the qualitative dimension of the aggregates and variables, namely the citizen’s perceived value, the citizen’s satisfaction, and the voter’s loyalty, are starting to be considered in decision processes. Since Municipe Satisfaction is a central issue in the evaluation of public service performance, it must be analyzed over time in order to implement an effective public action program, including, upstream, the aggregates of the citizen perceived value dimension and, downstream, the voter loyalty dimension. This proposal is the result of a partnership effort with the City Councils of Bragança and Valongo (Portugal), which supported the refinement and authorized the validation of the model in their county.
In the scope of this work, and in conceptual terms, we understand citizens’ perceived value (PV) as the overall perception of value ascertained by the difference between the expected value in the form of benefits and the total cost to the citizen in the form of personal and/or financial sacrifices (Kotler and Keller 2012). The citizen’s perceived value is formed by the set of mental representations, judgments, and meanings stored around functional, symbolic, emotional, and social realities. Municipe Satisfaction (MS) is the result of a process of comparison between performances and a personal and/or regulated standard (Oliver Richard 1997). It is the interaction between parties that allows the citizen to judge the action of the public entity (in the form of performance) against the citizen’s legitimate expectations. When expectations are met or even exceeded, it creates and adds to citizens’ satisfaction, where repeated results over time consolidate the perception of satisfaction. Voter loyalty is the predisposition guiding a certain attitude (Czepiel and Gilmore 1987; Gremler and Brown 1996) or voting behavior (Zins 2001). Hypothetical behavior focuses on past experience, while the affective dimension in the form of attitudes is based on future actions. It should be kept in mind that, similarly to commercial loyalty, political loyalty means the repetition not of the purchase but of the repeated vote for a party or public or political personality. Other authors, such as (Zeithaml et al. 1996), add the indicator of recommendation to others as a demonstration vector of loyalty.
Our approach is multifaceted and is capable of evaluating the perception of compliance with the municipal commitment with which their mayors were elected. This proposal is part of the movement towards smart cities and urban analytics, which advocate the development of knowledge and intelligence in and from urban contexts. In a general sense, our model is a mechanism for evaluating the expectations and perceptions of the community around the intervention of elected officials and municipal dynamics. The model is global, integrative, structural, longitudinal, and probabilistic and estimates the performance of the municipality based on the perception of the citizens. Through the structural approach, we were able to assign a differentiated weighting to the vectors of political intervention, combining this reality with citizens’ perception of the local government’s achievements. This model allows us to observe the levels and nature of the collective perception in relation to the public behavior of elected officials from a quantifiable, comparable, and predictive perspective of future electoral behavior (Braun and Tausendpfund 2020; Tavokin 1996).
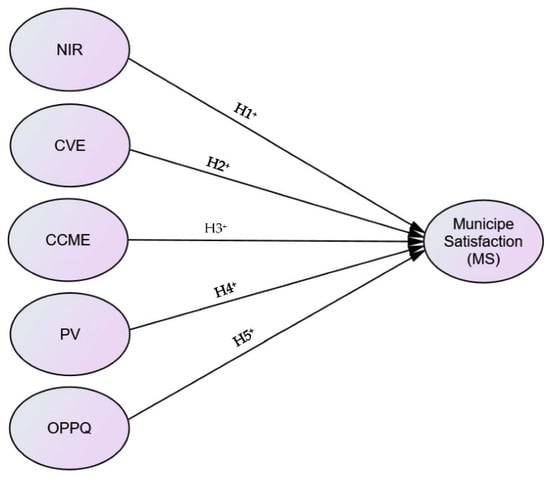
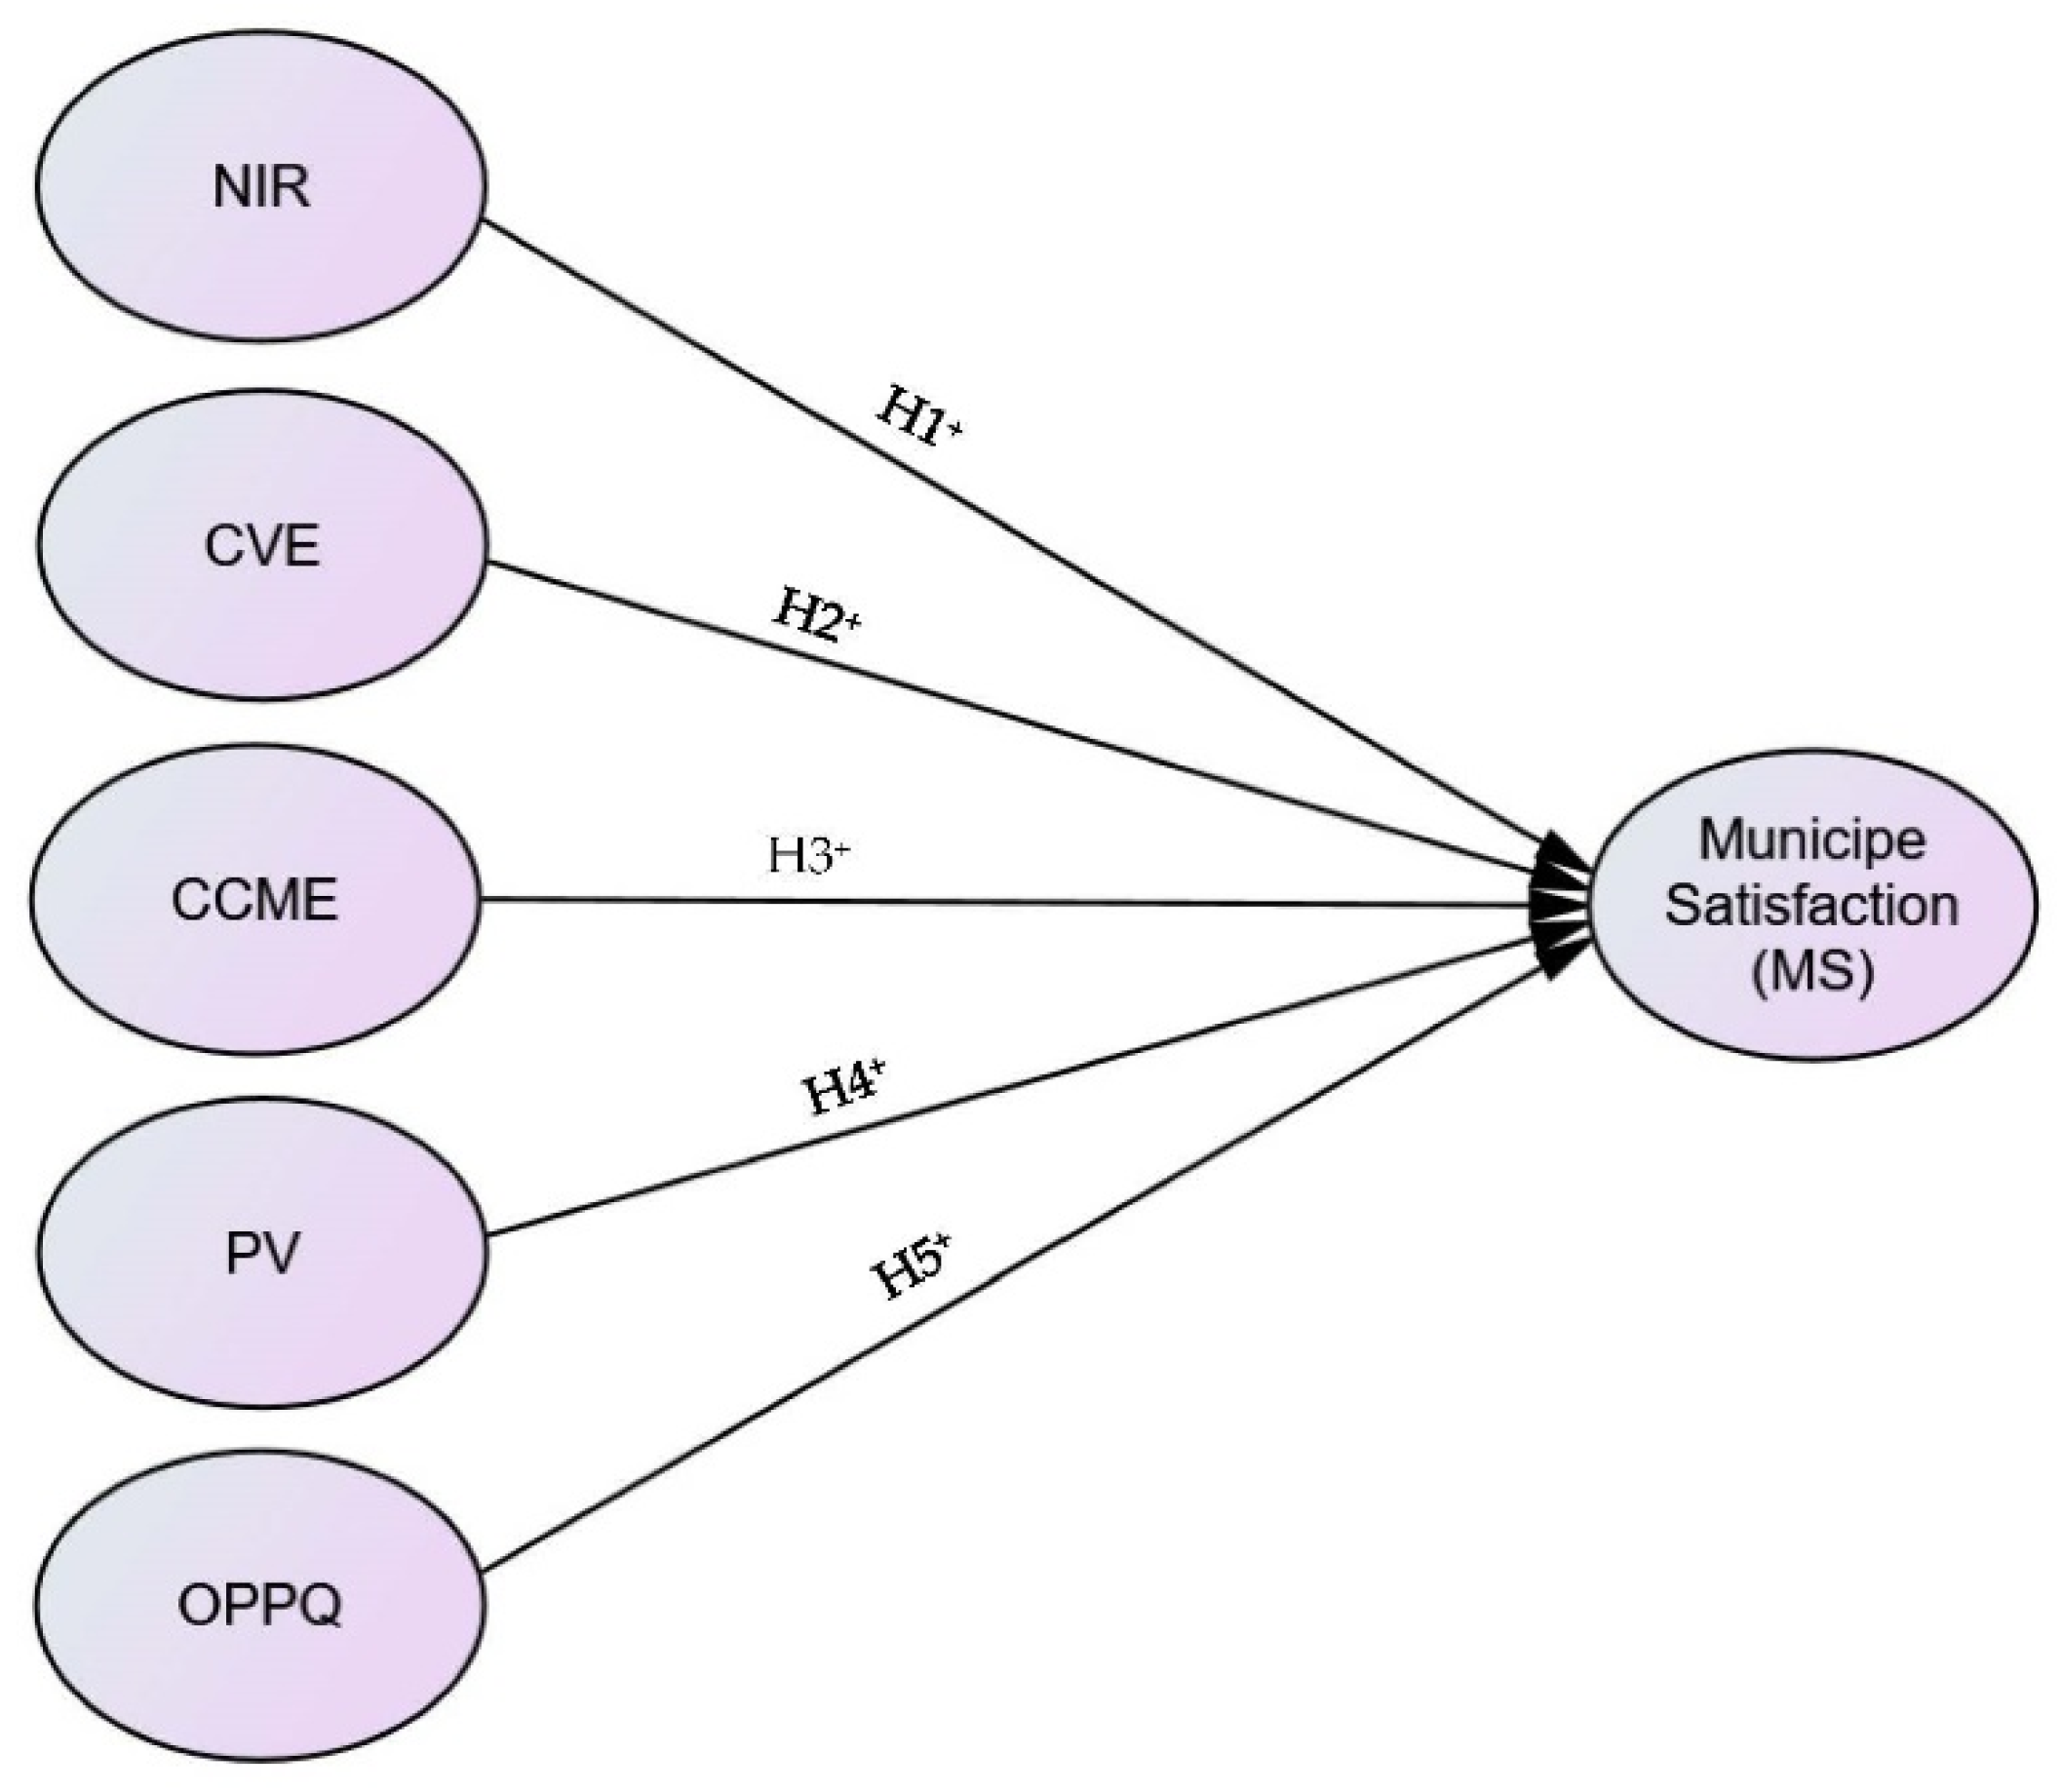
According to the literature review, it is possible to hypothesize that the NIR, CVE, CCME, PV, and OPPQ dimensions increase Municipe Satisfaction (MS). Hence, the following research hypotheses were defined:
Hypothesis 1 (H1).
Notoriety, Image, and Reputation (NIR) has a positive effect on Municipe Satisfaction (MS).
Hypothesis 2 (H2).
Citizen and Voter Expectations (CVE) have a positive effect on Municipe Satisfaction (MS).
Hypothesis 3 (H3).
Contestation and Complaint of the Municipal Executive (CCME) has a positive effect on Municipe Satisfaction (MS).
Hypothesis 4 (H4).
Perceived Value (PV) has a positive effect on Municipe Satisfaction (MS).
Hypothesis 5 (H5).
Organizational Performance and Perceived Quality (OPPQ) has a positive effect on Municipe Satisfaction (MS).
These hypotheses will make it possible to test the research model presented in Figure 1.
Figure 1.
Research model.
3. Method
3.1. Study Background
Our overall model of citizen, municipality, and voter satisfaction consists of 3 dimensions, 12 indicators, and 107 analysis variables. The three dimensions are citizen perceived value, Municipe Satisfaction, and voter loyalty. Under Citizen Perceived Value, we have the following indicators: Notoriety, Image, and Reputation (20 variables); Citizen and Voter expectations (five variables); Organizational performance and perceived quality (27 variables); and Fees, Process, Means, and Payment Deadlines (five variables). In the scope of Municipe Satisfaction, we have indicators such as satisfaction with the different intervention axes (formed by 13 variables); satisfaction with municipal services (formed by 20 variables); satisfaction with the municipal executive (formed by 4 variables); and overall satisfaction with the municipality (formed by 1 variable). Within the scope of voter loyalty, we have indicators such as intention to vote for the mayor (formed by two variables); intention to vote for the municipal executive (formed by one variable); Recommendation of the Municipal Executive (formed by five variables); and Contestation and Complaint of the Municipal Executive (formed by four variables).
Taking all indicators into account, the following indicators assume an important explanatory and scientific capacity in the understanding of the phenomenon under study: Notoriety, Image, and Reputation; Citizen, and voter expectations; Organizational Performance and Perceived Quality, and complaint and contestation of municipal executives. Therefore, within the indicator Notoriety, Image, and Reputation, a series of statements were presented in which the respondents positioned themselves, namely statements that are related to seriousness, credibility, accountability, sensitivity, transparency, innovation, creativity, trust, public visibility, media strength, public communication management, and politics. This aggregate allows us to ascertain the mental representation residing in the collective memory about a set of vectors related to the knowledge, representation, and social evaluation of the quality of political action carried out by elected officials.
Within the scope of the Citizen and Voter Expectations indicator, we investigate the ability of the city council to solve citizens’ problems: whether the municipality is able to offer services that are adequate to their needs; whether the resolution of problems is fast and effective; whether the city council has competent and dedicated employees, functional speed, and organizational effectiveness; and the quality of the services provided to citizens and businesses. All of these statements aim to ascertain whether citizens’ expectations are met in terms of a set of vectors related to problem-solving, adequate services, competence, organizational performance, human dedication, and quality of service.
In the scope of Organizational Performance and Perceived Quality, we investigated the quality of organizational functioning and its perception by citizens. In this sense, we presented a series of statements related to the direction and management of the municipality, concerns about people and companies, meeting deadlines, database management, variety of means of contact with the community, opening hours, internal procedures, location and service places, and the human quality of public servants. This aggregate allows us to clarify which vectors deserve greater appreciation, as well as those in which the city council will have to invest, review, or change the behavior of the institution.
Finally, the indicator called Contestation and Complaint about the Municipal Executive allows us to ascertain the negative charges present among residents of the community about the action and management of the municipal executive. In this context, we investigated whether there are reasons to complain, whether complaints are attended to and resolved, and whether complaints improve municipal behaviors and services, as well as to understand whether contestation and complaint influence municipal decisions. This aggregate is increasingly important in the life of Municipalities because it is a legal obligation to ascertain levels of satisfaction with services, and municipal executives look at protests and complaints as opportunities to improve the functioning of the public entity.
3.2. Data Collection Tools and Sample
The quantitative scientific method used presents itself as an instrument of knowledge acquisition provided by the collection, classification, analysis, and interpretation of data collected through the questionnaire survey administered face-to-face by approaching citizens in the different parishes of the municipality under study. In this way, a consistent and coherent survey was developed for the very particular reality of Portuguese municipalities, with reference to the following theoretical models: SERVQUAL developed by (Parasuraman et al. 1993); the Common Measurement Tool (CMT) of the Canadian Management Center (Strickland and Schmidt 1998); the Common Assessment Framework (CAF) inspired by the Excellence Model of the European Foundation for Quality Management (European Foundation for Quality Management or EFQM) (Engel 2002); and the Speyer Model of the Deutschen Universität für Verwaltungswissen-schaften (Speyer n.d.); and the European Customer Satisfaction Index (ECSI) (Ciavolino and Dahlgaard 2007), based on the American Consumer Satisfaction Index of the University of Michigan. The questionnaire is divided into 3 dimensions, with 5 indicators for each dimension, totaling 127 closed-ended questions associated with the estimation of the dimensions, indicators, and variables of the model, which were tested through a pilot survey before the actual data collection. A 5-point Likert-type numerical scale was used in the survey, with the extreme points presenting the semantic description “Strongly disagree” and “Strongly agree”, respectively. It is important to note that the scale is composed of a set of statements with a logical or empirical relationship and is a form of evaluation aimed at measuring a concept or a characteristic of the individual. At the end of the survey, and on an optional basis, the respondent was informed of the possibility of being part of a panel of citizens to be set up, in order to obtain their responses every six months electronically. If the citizen agrees to participate in the panel, all their data are processed in accordance with the General Data Protection Regulation (RGPD). On the other hand, this nominative and electronic contact information is used exclusively to allow participants to have private access to the questionnaire area, excluding any possibility of relating their personal data to the nature of the survey responses.
The participants were citizens aged between 18 and 82 years old, and 48.3% were male and 51.7% female. A total of 2260 questionnaires were collected (Table 1).
Table 1.
Characterization of the sample.
3.3. Confirmatory Factorial Analysis (CFA)
To perform the CFA, a model was tested with a set of variables corresponding to the six constructs under analysis and another one with the removal of variables whose factorial loadings were lower than 0.5 (having chosen the one whose adjustment of variables revealed better statistical consistency (Brown 2006; Browne and Cudeck 1993; Marôco 2010)). In Table 2, we can verify the results of the two models tested, with the MS1 model presenting a modest fit, which improved with the removal of five variables belonging to the constructs PV (PV1 and PV2), CCME (CCME1), OPPQ (OPPQ3), and MS (MS37) The most statistically significant model tested was the SM2, which presented the statistical evidence χ2/df = 3.836, RMSEA = 0.045, SRMR = 0.0402, NFI = 0.816, GFI = 0.962, AGFI = 0.807, and CFI = 0.975. This statistical evidence was obtained after some items were removed to make it statistically more robust, and all items whose factor loadings were less than 0.5 were excluded (Hair et al. 2010b; Marôco 2010).
Table 2.
Quality index of the adjustment of the models tested.
As regards the reliability of the items and factors, the sample that was obtained, consisting of 998 Valongo citizens, shows a good internal consistency (α = 0.989).
4. Results
Validity and Reliability
The analysis of the research model that has been proposed using confirmatory factor analysis (CFA), a structural equation model (SEM), and SPSS/AMOS 27 software (Ringle et al. 2015). The mediation model was tested (for validity and reliability of the measures) in accordance with the literature, and several research hypotheses were tested to determine the meaning of loadings and coefficients of each path (Hair et al. 2014).
Table 3 shows the model’s convergent validity, which presents sufficient validity and reliability. The sample size meets the criteria for structural equation analysis that suggest there should be a minimum of five interviewees for each variable of the model (Hoelter 1983; Hair et al. 2010a). Hair et al. (2010a) corroborate this threshold but propose complex models with few indicators per construction and bigger samples. According to the sources mentioned earlier, it is fair to say the sample that was collected was representative enough to be used in a structural equation model. The structural equation model that was presented enables a multivariate analysis, which allows for the testing of more complex models than the traditional linear regression model (Bagozzi and Yi 2012).
Table 3.
Validity and reliability of the constructs.
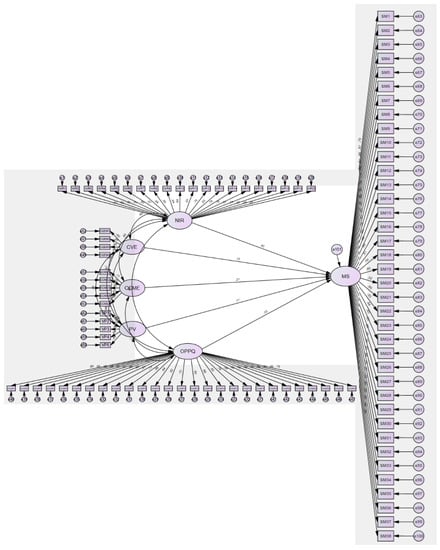
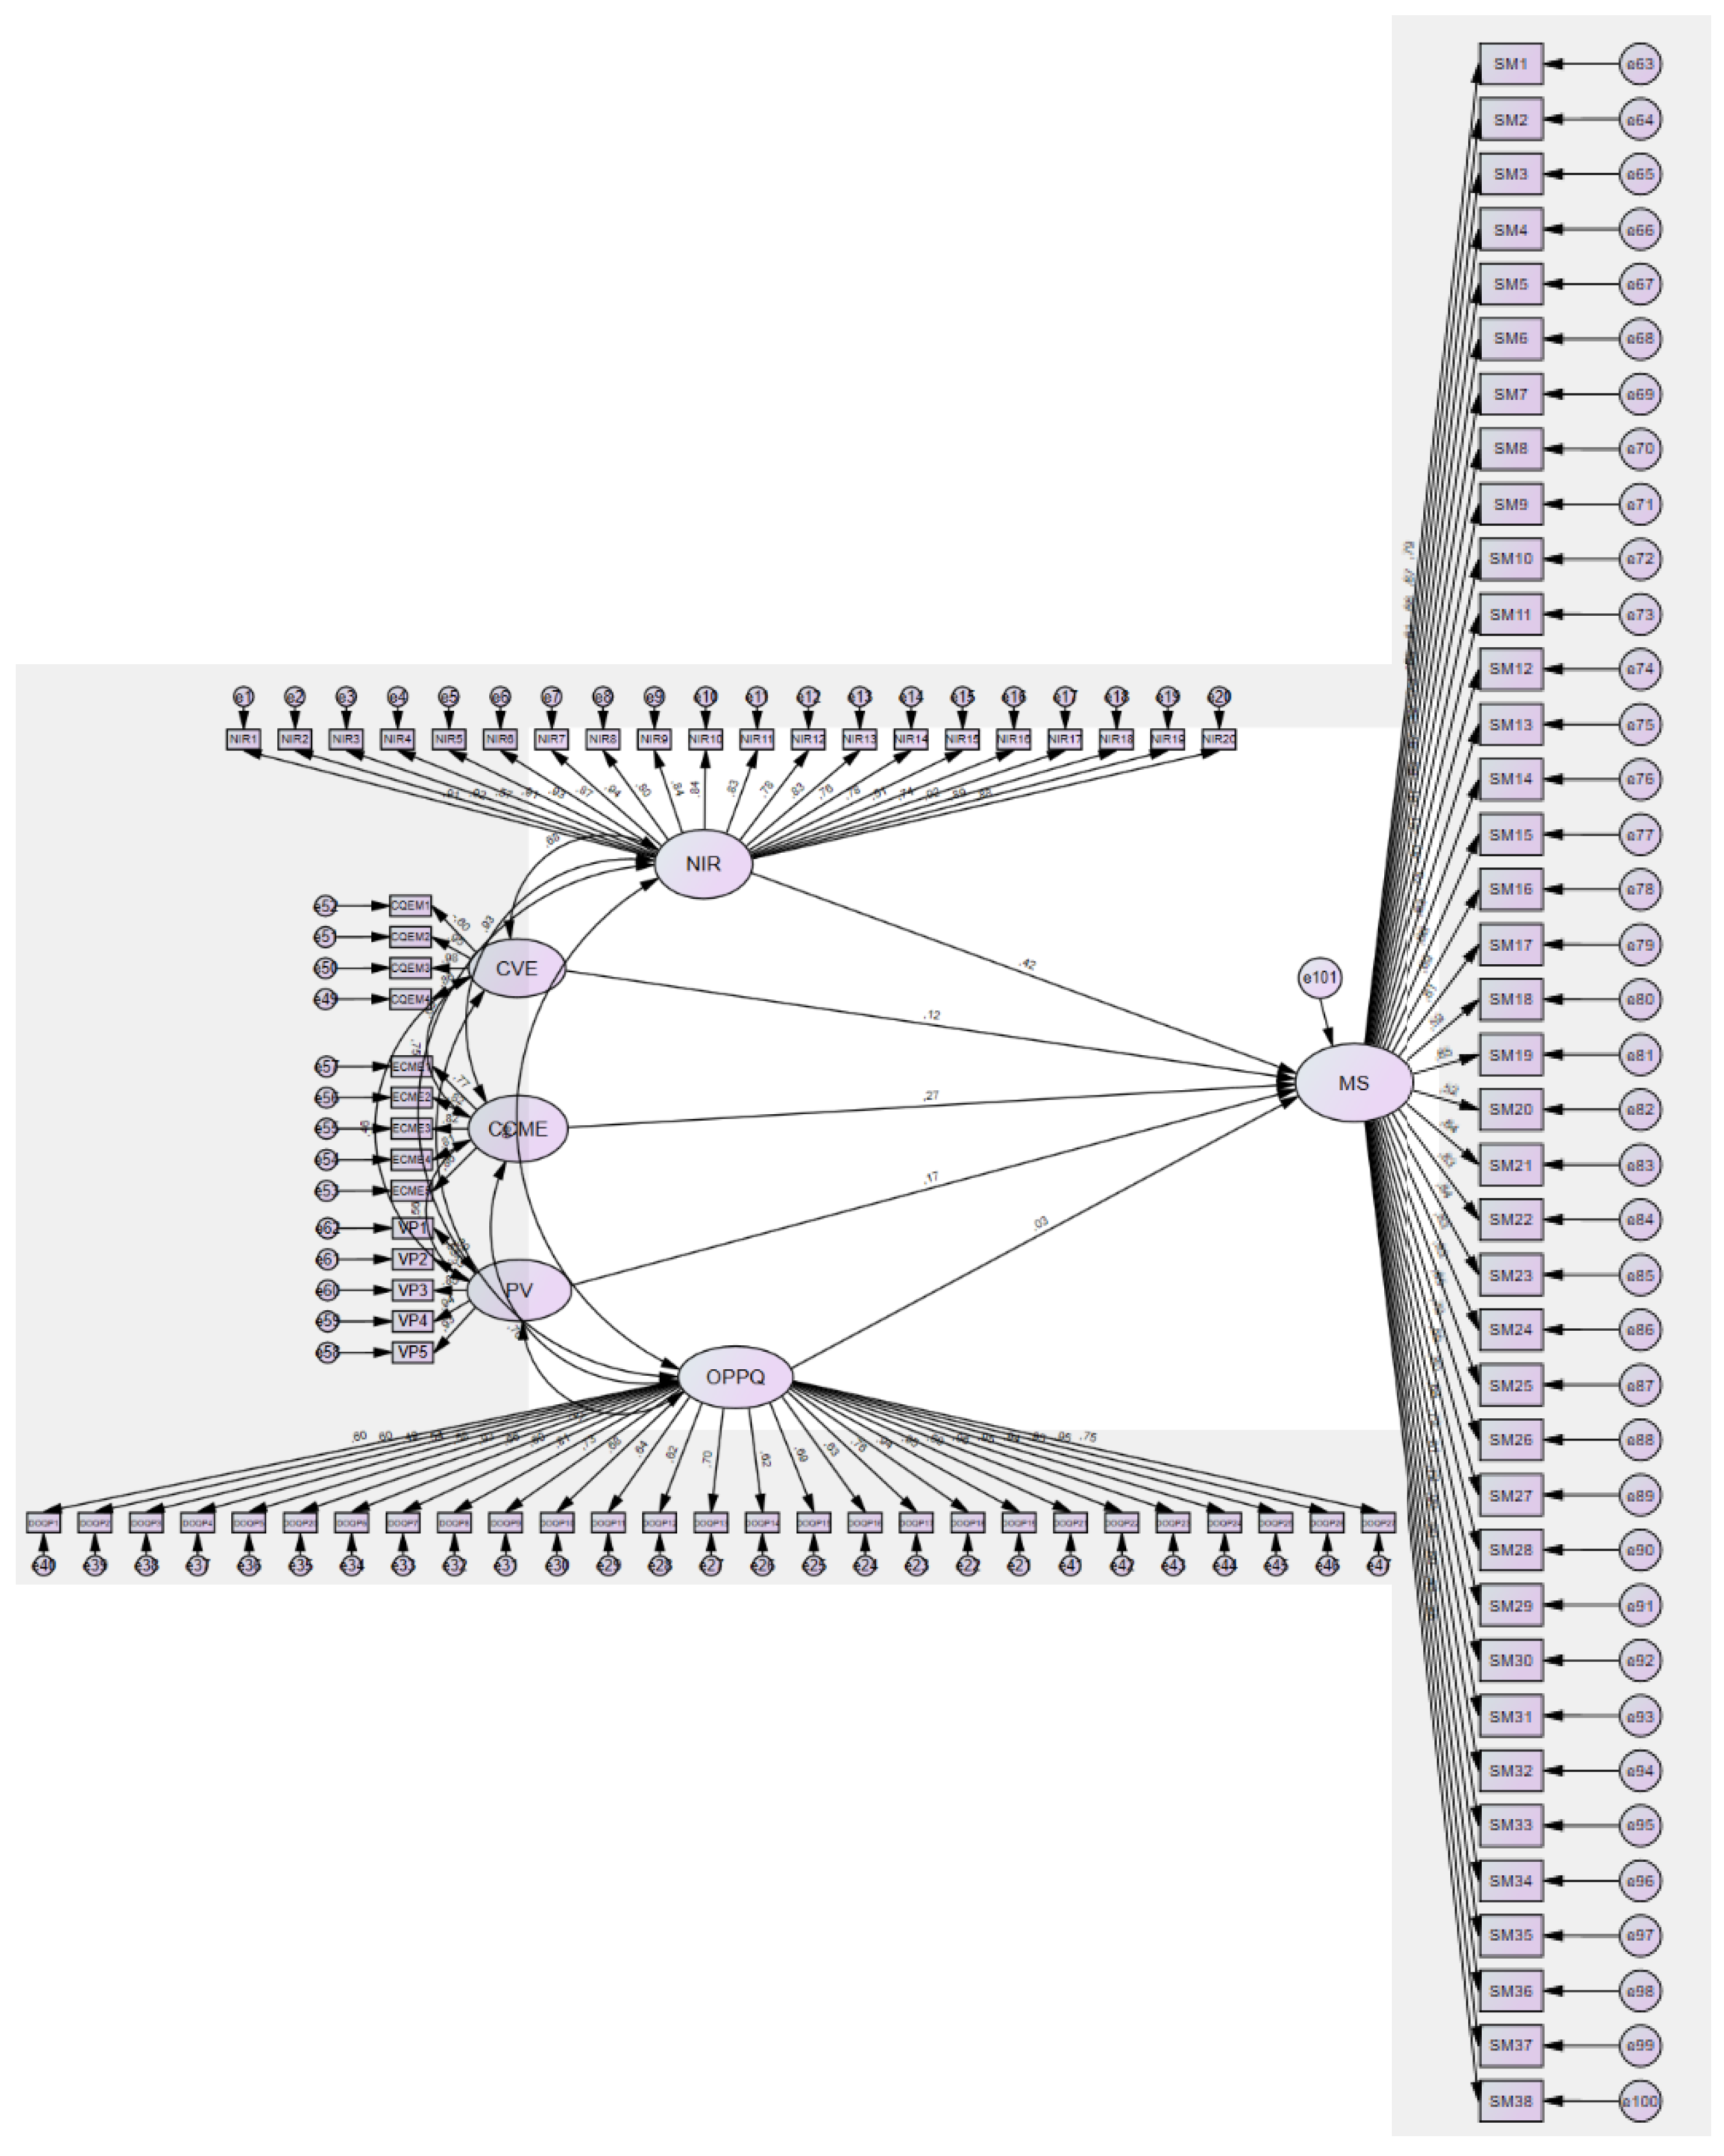
In Table 4, it is possible to see a summary of the hypotheses that were tested, using what was found to be the best research model (MS2), as well as the results that were obtained, and which allow one to conclude that the variation that occurs in MS is accounted for by such dimensions as NIR (β = 0.355, p < 0.001), CVE (β = 0.109, p < 0.05), CCME (β = 0.244, p < 0.05), PV (β = 0.151, p < 0.001), and OPPQ (β = 0.021, p > 0.05). Furthermore, all the dimensions were statistically significant in both models tested (Figure 2). The structural results point to NIR, CVE, CCME, and PV dimensions having a direct positive and statistically significant influence on MS, validating research hypotheses H1, H2, H3, and H4, whereas the OPPQ dimension has a direct positive but not statistically significant influence on MS, which does not validate research hypothesis H5.
Table 4.
Research hypotheses and statistical results—MS2.
Figure 2.
Final research model—SM2.
After the validity and reliability of the initial model (MS1) had been analyzed, the new model (MS2) was tested, and some variables whose scores were less than 0.5 were removed, thus improving the internal consistency of the model.
The results that were obtained also allow one to conclude that the dimensions which affect Municipe Satisfaction were NIR, CVE, CCME, and PV. It should be noted that the OPPQ dimension had a positive impact on NIR, which did not affect it in a statistically significant manner.
It has been noted that dimensions NIR and CVE proved to be the most pertinent dimensions concerning the increase in MS. NIR was the strongest MS predictor, followed by CVE and PV.
Regarding the hypothesis model that was tested, it accounted for most of the variance of dependent variables. In general, most of the variables were highly correlated, strongly affecting MS.
5. Discussion
Looking into the influence of each dimension of Municipe Satisfaction, one can verify that the Notoriety, Image, and Reputation of Municipal Executive and their respective work and management had a strong impact on the Municipe Satisfaction, which is in keeping with previous studies (Czepiel and Gilmore 1987; Gremler and Brown 1996). The verification of this hypothesis shows that Notoriety, Image, and Reputation are extremely relevant for citizens who attach great importance to aspects such as honesty; environmental responsibility; humanization; quality of services; transparency; social, economic and cultural development innovation; communication; and promise keeping. These findings are in line with previous studies that have addressed the importance and influence of this dimension of Municipe Satisfaction (Zins 2001).
In what concerns the dimension of Citizen and Voter Expectations, the present study’s results corroborate other researchers’ findings, in which Citizen and Voter Expectations were found to increase Municipe Satisfaction (Kotler and Keller 2012). These results show that the city council’s ability to solve citizens’ problems quickly and effectively, the skills of its employees, the adequate services it offers to meet citizens’ needs, and its concern for municipality services have a statistically significant influence on municipal satisfaction (Winkler 1987; Thomas and Palfrey 1996). Regarding the contestation and complaint of the municipal executive and its positive, direct influence on the structural model that was studied, results are consistent with various studies that claim that it contributes to Municipe Satisfaction (Broom 1995). It is evident that the contestation and complaint in relation to the municipal executive is a preponderant factor in the construction of the Municipe Satisfaction dimension because the evaluation that is made, if negative, influences the opinion of the municipalities about the activity performed by municipal executives (Boyne 2003).
As regards the Perceived Value, results concur with the literature, indicating that citizens attribute importance to the balance between the fees that are charged and the economic reality of municipalities, verifying the direct, positive, and statistically significant influence of Perceived Value on Municipe Satisfaction (Czepiel and Gilmore 1987; Gremler and Brown 1996). In terms of the dimension of Organizational Performance and Perceived Quality, results show a direct influence on the structural model, creating a direct but not statistically significant impact on the Municipe Satisfaction, as has already been established by Zins (2001). The results of this study show that although the variables that make up the dimension are important for the evaluation of the municipal executive, the fact that it is statistically insignificant does not allow us to extrapolate and draw further conclusions.
Our results suggest that using this model represents a useful tool to gauge Municipe Satisfaction, the executive municipal management level of competence and decisions (Zeithaml et al. 1996).
6. Conclusions
This study looked into the impact of some dimensions—namely Notoriety, Image, and Reputation; Citizen and Voter Expectations; Contestation and Complaint of the Municipal Executive; Perceived Value; Organizational Performance and Perceived Quality; Concentration; Clarity; Feedback; Challenge; Autonomy; Social Interaction; and Perceived Learning—on Municipe Satisfaction. Using some validated scales, a quantitative analysis was conducted resorting to SPSS/AMOS 27 software and applying a structural equations model, which resulted in the validation of hypotheses H1–H4 and in the rejection of hypothesis H5.
The impact of the dimensions investigated on Municipe Satisfaction was as follows: Notoriety, Image, and Reputation had a direct influence of 35.5%; the Citizen and Voter Expectations had an influence of 10.9%; Contestation and Complaint of the Municipal Executive had an influence of 24.4%); Perceived Value in Municipe Satisfaction had an influence of 15.5%; and, finally, Organizational Performance and Perceived Quality had an influence of 2% but without statistically significance.
This research paper presents and discusses the main results generated and obtained with the proprietary computer platform CIDIUS®, developed by the authors of this work, which aims to support the decision-making process of Portuguese mayors. Thus, bearing in mind the theoretical models and based on the data collected through the questionnaire given to the population, we tried to determine the influence that the dimensions Notoriety, Image, and Reputation (NIR), Citizen and Voter Expectations (CVE), Contestation and Complaint of the Municipal Executive (CCME), Perceived Value (PV), and Organizational Performance and Perceived Quality (OPPQ) has a positive effect on Municipe Satisfaction (MS). The results of this research suggest the need for the use of these opinion-gathering techniques that encourage active citizen involvement in the daily life of their municipality, as well as the need for valid information that gives the executive the possibility of taking political action appropriate to the interests and expectations of citizens.
7. Limitations, Contributions and Implications of the Study
The data included in the present study were self-reported, and the data collection tools that were used, although empirically and scientifically validated, may be replaced by others that are equally relevant. In fact, scales are always liable to investigation and replacement by others that may present more statistically robust results.
This study examined the dimensions that affect Municipe Satisfaction, reinforcing its importance in giving information to municipal leaders and help future management decisions that contribute to citizens’ and voters’ satisfaction.
The present study also contributes to the development of a body of literature that is more focused on Municipe Satisfaction but will be used in other areas of public management.
Author Contributions
Conceptualization, G.M. and R.S.; methodology, R.S.; software, R.S.; validation, G.M., M.B. and C.L.; formal analysis, R.S.; investigation, G.M.; resources, C.L data curation, R.S.; writing—original draft preparation, G.M.; writing—review and editing, C.L.; visualization, M.B.; supervision, G.M.; project administration, G.M. and R.S.; funding acquisition, G.M., M.B., C.L. and R.S. All authors have read and agreed to the published version of the manuscript.
Funding
The work of author Rui Silva is supported by national funds, through the FCT—Portuguese Foundation for Science and Technology under the project UIDB/04011/2022 and by NECE-UBI, Research Centre for Business Sciences, Research Centre under the project UIDB/04630/2022. The work of author Carmem Leal is supported by national funds, through the FCT—Portuguese Foundation for Science and Technology under the project UIDB/04011/2022.
Institutional Review Board Statement
Not applicable.
Informed Consent Statement
Not applicable.
Data Availability Statement
Not applicable.
Acknowledgments
The authors gratefully acknowledge the University of Trás-os-Montes and Alto Douro and CETRAD (Centre for Transdisciplinary Development Studies) and University of Beira Interior (NECE–UBI).
Conflicts of Interest
The authors declare no conflict of interest.
References
- Adam, Edmund. 2020. ‘Governments Base Performance-Based Funding on Global Rankings Indicators’: A Global Trend in Higher Education Finance or a Global Rankings Literature Fiction? A Comparative Analysis of Four Performance-Based Funding Programs. International Journal of Educational Development 76: 102197. [Google Scholar] [CrossRef]
- Bagozzi, Richard P., and Youjae Yi. 2012. Specification, Evaluation, and Interpretation of Structural Equation Models. Journal of the Academy of Marketing Science 40: 8–34. [Google Scholar] [CrossRef]
- Bocquier, Philippe. 2005. World Urbanization Prospects: An Alternative to the UN Model of Projection Compatible with the Mobility Transition Theory. Demographic Research 12: 197–236. [Google Scholar] [CrossRef]
- Boyne, George A. 2003. Sources of Public Service Improvement: A Critical Review and Research Agenda. Journal of Public Administration Research and Theory 13: 367–94. [Google Scholar] [CrossRef]
- Braun, Daniela, and Markus Tausendpfund. 2020. Electoral Behaviour in a European Union under Stress. Politics and Governance 8: 28–40. [Google Scholar] [CrossRef]
- Broom, Cheryle. 1995. Performance-Based Government Models: Building a Track Record. Available online: https://ssrn.com/abstract=465645 (accessed on 10 January 2022).
- Brown, Timothy A. 2006. Confirmatory Factor Analysis for Applied Research. New York: Guilford. [Google Scholar]
- Browne, Michael W., and Robert Cudeck. 1993. Alternative Ways of Assessing Model T. Edited by Kenneth Bollen and Jason Long. Newbury Park: Sage. [Google Scholar]
- Ciavolino, Enrico, and Jens J. Dahlgaard. 2007. ECSI—Customer Satisfaction Modelling and Analysis: A Case Study. Total Quality Management 18: 545–54. [Google Scholar] [CrossRef]
- Collins, Brian K., Hyun Joon Kim, and Jie Tao. 2019. Managing for Citizen Satisfaction: Is Good Not Enough? Journal of Public and Nonprofit Affairs 5: 21–38. [Google Scholar] [CrossRef]
- Crosby, Philip B. 1979. 8: Quality Improvement Program. In Quality Is Free: The Art of Making Quality Certain. New York: McGraw-Hill, pp. 127–39. [Google Scholar]
- Czepiel, John A., and Robert Gilmore. 1987. Exploring the Concept of Loyalty in Services. In The Services Challenge: Integrating for Competitive Advantage. Chicago: American Marketing Association, pp. 91–94. [Google Scholar]
- Denhardt, Janet V., and Robert B. Denhardt. 2015. The New Public Service Revisited. Public Administration Revie 75: 664–72. [Google Scholar] [CrossRef]
- Eiglier, Pierre, and Eric Langeard. 1991. Servuction—A Gestão Marketing de Empresas de Serviços. Paris: McGraw-Hill. [Google Scholar]
- Elassy, Noha. 2015. The Concepts of Quality, Quality Assurance and Quality Enhancement. Quality Assurance in Education 23: 250–61. [Google Scholar] [CrossRef]
- Engel, Christian. 2002. Common Assessment Framework: The State of Affairs. Eipascope 2002: 1–5. [Google Scholar]
- Foster, David, and Jan Jonker. 2003. Third Generation Quality Management: The Role of Stakeholders in Integrating Business into Society. Managerial Auditing Journal 18: 323–28. [Google Scholar] [CrossRef] [Green Version]
- Garvin, David A. 1988. Managing Quality: The Strategic and Competitive Edge. New York: Free Press London & Collier Macmillan. [Google Scholar]
- Gremler, Dwayne D., and Stephen W. Brown. 1996. Service Loyalty: Its Nature, Importance, and Implications. Advancing Service Quality: A Global Perspective 5: 171–81. [Google Scholar]
- Hair, Joe F., Jr., Michael Page, and Niek Brunsveld. 2019. Essentials of Business Research Methods. London: Routledge. [Google Scholar]
- Hair, Joe, Marko Sarstedt, Lucas Hopkins, and Volker Kuppelwieser. 2014. Partial Least Squares Structural Equation Modeling (PLS-SEM) an Emerging Tool in Business Research. European Business Review 26: 106–21. [Google Scholar] [CrossRef]
- Hair, Joseph F., William C. Black, Barry J. Babin, Rolph E. Anderson, and Ronald Tatham. 2010a. Multivariate Data Analysis. Upper Saddle River: Pearson. [Google Scholar]
- Hair, Joseph F., William C. Black, Barry J. Babin, Rolph E. Anderson, and Ronald Tatham. 2010b. SEM: An Introduction. In Multivariate Data Analysis: A Global Perspective. Upper Saddle River: Pearson, pp. 629–86. [Google Scholar]
- Hoelter, Jon W. 1983. The Analysis of Covariance Structures: Goodness-of-Fit Indices. Sociological Methods & Research 11: 325–44. [Google Scholar]
- Juran, Joseph M., and Joseph A. DeFeo. 1988. Juran on Planning for Quality. New York: Collier Macmillan. [Google Scholar]
- Kim, Sung Hong, Jin Han Kim, and Won Jun Lee. 2018. Exploring the Impact of Product Service Quality on Buyer Commitment and Loyalty in B TO B Relationships. Journal of Business-to-Business Marketing 25: 91–117. [Google Scholar] [CrossRef]
- Kotler, Philip, and Kevin Lane Keller. 2012. Administração de Marketing: A Biblia do Marketing. São Paulo: Publisher. [Google Scholar]
- Lau, Edwin. 2000. Government of the Future. Paris: Organization for Economic. [Google Scholar]
- Marôco, João. 2010. Structural Equation Analysis: Theoretical Foundations, Software & Applications. Report No 2010. Lisboa: ReportNumber. [Google Scholar]
- Oliver Richard, L. 1997. Satisfaction: A Behavioral Perspective on the Consumer. New York: McGraw Hill. [Google Scholar]
- Parasuraman, Arun, Leonard L. Berry, and Valarie A. Zeithaml. 1993. More on Improving Service Quality Measurement. Journal of Retailing 69: 140–47. [Google Scholar] [CrossRef]
- Perry, James L., and Robert K. Christensen. 2015. Handbook of Public Administration. New York: John Wiley & Sons. [Google Scholar]
- Ringle, Christian M., Sven Wende, and Jan-Michael Becker. 2015. SmartPLS 3. Boenningstedt: SmartPLS GmbH, Available online: http://www.Smartpls.Com (accessed on 18 January 2022).
- Speyer, Verwaltungswissenschaften. n.d. Umbenennung in Deutsche Universität Für. Available online: https://www.uni-speyer.de/fileadmin/SpeyerJournal/SpeyerJournal20.pdf (accessed on 17 February 2022).
- Strickland, Teresa, and Faye Schmidt. 1998. Client Satisfaction Surveying. Common Measurements Tool. Dallas: Canadian Centre for Management Development. [Google Scholar]
- Tavokin, E. P. 1996. Sociological Prognoses of Electoral Behaviour. Sotsiologicheskie Issledovaniya 7: 15–20. [Google Scholar]
- Thomas, Paul, and Colin Palfrey. 1996. Evaluation: Stakeholder-Focused Criteria. Social Policy & Administration 30: 125–42. [Google Scholar]
- Winkler, Fedelma. 1987. Consumerism in Health Care: Beyond the Supermarket Model. Policy & Politics 15: 1–8. [Google Scholar]
- Zakaria, Zaherawati, Kamarudin Ngah, Nazni Noordin, and Adnan Aminuddin. 2017. Public Complaints on Municipal Services: A Perspectives from Internal and External Customers. Advanced Science Letters 23: 7464–67. [Google Scholar] [CrossRef]
- Zeithaml, Valarie A., Leonard L. Berry, and Ananthanarayanan Parasuraman. 1996. The Behavioral Consequences of Service Quality. Journal of Marketing 60: 31–46. [Google Scholar] [CrossRef]
- Zins, Andreas H. 2001. Relative Attitudes and Commitment in Customer Loyalty Models: Some Experiences in the Commercial Airline Industry. International Journal of Service Industry Management 12: 269–94. [Google Scholar] [CrossRef]
- Zope, Nikhil Zope, K. Anand, and Doji Samson Lokku. 2014. Reviewing Service Quality for IT Services Offerings: Observations in the Light of Service Quality Models & Determinants. Paper presented at 2014 Annual SRII Global Conference, San Jose, CA, USA, April 23–25. [Google Scholar]

Publisher’s Note: MDPI stays neutral with regard to jurisdictional claims in published maps and institutional affiliations. |
© 2022 by the authors. Licensee MDPI, Basel, Switzerland. This article is an open access article distributed under the terms and conditions of the Creative Commons Attribution (CC BY) license (https://creativecommons.org/licenses/by/4.0/).