Article

New Age Informality: Hispanics and the Sharing Economy

by
Michael J. Pisani
Department of Management, Central Michigan University, Mt. Pleasant, MI 48859, USA
Adm. Sci. 2021, 11(1), 23; https://doi.org/10.3390/admsci11010023
Submission received: 26 January 2021 / Revised: 15 February 2021 / Accepted: 23 February 2021 / Published: 1 March 2021

Abstract

:
The purpose of this study is to advance understanding of the Hispanic contribution to the engagement and production of the sharing and informal economies in the US. The study is situated within the domains of the sharing economy and informality within a broader frame of entrepreneurship. Specifically, Hispanic participation rates, rationale for engagement, and the major drivers of involvement in the production of the sharing and informal economies are analyzed. To evaluate this, data are reported from a nationally representative subsample of Hispanics derived from the US Federal Reserve Board’s Enterprising and Informal Work Activities Survey (EIWA) conducted in the late fall of 2015. The finding is that more than one-third of Hispanics engage in EIWA. Hispanics participate in EIWA primarily as a means to earn extra income or as a key avenue to earn a living. By choice, relatively affluent Hispanics have the largest stake in sharing and informal economies. However, it is the lowest income Hispanics that engage in EIWA out of necessity. The major drivers of EIWA participation among Hispanics are revealed. This is the first known study with a nationally representative sample of Hispanics focused on participation rates, rationale for engagement, and drivers of involvement in the production of new age sharing and informal economies.
JEL Classification:
D16; E26; J15; J46; L26

1. Introduction

While informal markets are as old as the government institutions created to regulate them, informality in the age of the smartphone began not long ago in 2007. Noted globalization observer Thomas Friedman (2016) has argued that the smartphone was instrumental in creating the age of accelerations in the contemporary global marketplace; the smartphone certainly changed the conduct of business (Morris 2017). In essence, the smartphone ushered in and standardized the technological sharing economy. Unfamiliar a decade ago, these sharing economy companies are ubiquitous today: Uber, Airbnb, Etsy, and Lyft. Recent Pew Research surveys reported that 36% of US adults had used ride sharing (Jiang 2019) and that 72% of Americans had participated as consumers in the sharing economy as of 2016 (Smith 2016a).
Sundararajan (2016, p. 2) argues that “a radical shift is underway” fueled by the sharing economy that he argues achieved scale by 2010 and that this radical shift is transforming the nature of employment. Employment and especially earnings within the sharing economy is under-reported, and oftentimes goes unreported, to government authorities enhancing the informal nature of much of the sharing economy. In this article, the popular term sharing economy is used extensively. Alternate terms for this phenomenon include crowd-based capitalism, gig economy, and collaborative consumption among others (see Gobble 2017).
As a first step in understanding the scope of this transformational shift, the Consumer and Community Affairs division of the US Federal Reserve Board undertook a national survey in the late fall of 2015 targeted at the sharing economy (see Robles and McGee 2016). In addition, this survey—the Enterprising and Informal Work Activities (EIWA) survey—also explored more traditional offline informal economic activities, such as landscaping, child and elder care, and selling goods at flea markets. The economic target of the survey encapsulated the sharing and informal economies.
Stephany (2015, p. 9) defines the sharing economy as: “the value in taking underutilized assets and making them accessible online to a community, leading to a reduced need for ownership of those assets”. In essence, the sharing economy allows for innovative asset sharing or co-utilization while reducing transactions costs in part through rental management and enhanced inventory control. Schor (2020, p. 16) adds that the sharing economy “denotes peer-to-peer sites serving individuals (consumers) in offline [market or gift] exchanges”. Woodcock and Graham (2020, p. 3) define the sharing or gig economy as labor markets “that are characterized by independent contracting that happens through, via, and on digital platforms”. Finally, Hamari et al. (2016, p. 2047) note the sharing economy as “peer-to-peer-based activity of obtaining, giving, or sharing access to goods and services, coordinated through community-based online services”. As to economic informality, Richardson and Pisani (2012, p. 19) define informality as “work that is in itself legal but avoids government regulation, oversight, and/or taxation” in the production of a licit good or service.
The sharing and informal economies in the US are present across regional geographies and ethnicities. Our focus in this article is to spotlight and better understand the engagement and participation of Hispanics in this new age of informality, particularly within the lens of the sharing economy. Illustrating Hispanic participation in the production of the sharing economy, seven percent of Lyft drivers and nearly six percent of Uber drivers in the US are Latino (Dickey 2017). The terms Hispanic and Latino are used interchangeably throughout this article.
As informal work and portions of the sharing economy seek to remain hidden from government authority, it is difficult to measure informality and ethnic inclusion precisely. Regional estimates in heavily populated Hispanic areas provide some perspective. For example, it is estimated that the informal economy comprises more than sixteen percent of the Los Angeles workforce (Klowden and Wong 2005) to upwards of twenty-five percent of the entire economy of Hispanic South Texas (Richardson and Pisani 2012). Additionally, a recent national study estimates that perhaps as many as one-third of Latino-owned businesses are unregistered enterprises (Pisani and Morales 2020). The sharing economy provides one new pathway into the informal economy.
So, as there is overlap and interconnection between the sharing and informal economies, does this interconnection differ by ethnicity? It is clear that Hispanics are part of the sharing and informal economies; yet almost nothing is known of Hispanic engagement and business participation in these economies. To our knowledge, this is the first academic work focused on Latino participation as consumers of goods and services and suppliers of labor in the sharing economy. In essence, I seek to explore how Hispanics engage the sharing economy as a first step forward in understanding the relationship between Hispanic ethnicity, the sharing economy, and informality. Three research questions (RQ) guide the exploration:
  • RQ #1: Do Hispanics differ from other racial/ethnic groups in their participation in the sharing and informal economies?
  • RQ #2: What is the rationale of Hispanic participation in the sharing and informal economies?
  • RQ #3: What are the major drivers (i.e., determinants) of Hispanic participation in the sharing and informal economies?
As this research is exploratory, I believe answering foundational research questions may build momentum in future research toward more formal hypothesis testing with further understanding of ethnicity and engagement with the sharing and informal economies. The remainder of this article is organized as follows: section two reviews the pertinent literature. Section three details our sample and methodology. Results and a discussion of the findings are detailed in section four. The last section concludes the article and offers a perspective on policy implications.

2. Literature Review

The sharing economy and informality literature inform our study and are reviewed in this section.
A. The Sharing Economy
Sharing has been a fundamental component of economies for millennia (Sundararajan 2016). What is new in the present-day sharing economy is “the technological breakthroughs of the internet economy, including electronic payments and ubiquitous access to information and communication through mobiles [smartphones]” (Hira and Reilly 2017, p. 2). More fundamentally, sharing economy enhances the efficiency and productivity of idle or slack resources, be they cars, home spaces, or labor and reduce related transactions costs.
Sundararajan (2016, p. 27) argues that the sharing economy has five fundamental characteristics: (1) it is largely market based; (2) it engages high impact capital; (3) it employs decentralized crowd-based networks; (4) it blurs the lines between the personal and professional; (5) it blurs the line between fulltime and part-time labor. Sundararajan further suggests that sharing economy transactions are mostly synchronous (that is, market exchanges that occur in real time), high stakes, and proximity critical. For example, the ride-sharing service Uber requires a match of time, involves strangers that do not know one another, and takes place within a connected geographical space. Trust engineered through brand management, reputation, and performance is often the missing link or competitive advantage that sharing economy aggregators (or intermediaries) rely upon (Albinsson et al. 2019). Non-synchronous entities, such as eBay and Craigslist, from Sundararajan’s perspective, are seen as precursors to the sharing economy though these non-synchronous online enterprises that are often included in sharing economy. Labor is not to be lost within the gig economy framework. Chai and Scully (2019) insist that sharing economy service providers or labor should be considered distinct from the gig platform or capital (ownership). Woodcock and Graham (2020) further the distinction of labor by illustrating the often precarious nature of sharing economy work around the world.
The consumption of goods and services in the sharing economy in the US was described in a 2016 Pew Research report. It noted that the heaviest users of the sharing economy are college graduates, those with households with incomes over USD 100,000, persons under 45 years of age, and urbanites (Smith 2016a). This same report broke out the sharing economy use for Hispanics and the population as a whole. Rates of consumption are similar between Hispanics and the general US population (see Table 1, Panel A). Another 2016 report by Pew noted Hispanics participated at comparable levels to the general population for those earning income from the sharing economy (see Table 1, Panel B) (Smith 2016b).
Katz and Krueger (2016) find a rise in the contingent workforce (or alternative work arrangements), in part, attributable to the sharing economy. They report that the percentage of workers engaged in alternate work arrangements increased from 10.7% of the labor force in 2005 to 15.8% in 2015. Katz and Krueger find that 19.4% of employees were engaged in selling directly to customers with 7% reporting using an online or offline aggregator (or intermediary). Of those utilizing an aggregator, Katz and Krueger report one-third utilize an online aggregator for a total of 0.5% of all workers identifying customers using this method. Robles and McGee (2016) provide an excellent overview of the overall results of the EIWA survey. They report that 36.0% of Americans participate in the sharing and informal economies; most of those who participated in EIWA were already gainfully employed, and earnings were primarily part of a strategy to make extra money. In our study, we build upon and move beyond Robles and McGee (2016) to focus specifically upon Hispanics and extend their work through the employ of multivariate analyses.
B. Informality
Keith Hart (1970, 1973) coined the phrase “informal economy” derived from his field work in West Africa. Since the early 1970s, the study of the informal economy has matured with major contributions from economists, sociologists, and anthropologists. Two early edited works (Portes et al. 1989; Rakowski 1994) illustrate informality as a global phenomenon present in both developed and developing markets, though much more prevalent in the latter. Theoretical lenses are also explored from dependent (Marxist) relationships to market-based relationships. De Soto (2000) popularized informality as a rational response to stifling regulations and government corruption. More recently, Williams and Horodnic (2016) extend the drivers of informality to large differences in state and civic morality.
Portes and Schauffler (1993) argue that informal activity represents work that itself could be undertaken within the bounds of government legislation, but is instead undertaken outside of the purview of government oversight. The informal economy consists of market transactions that avoid government detection, while noting that these same transactions could have been conducted under the auspices of government monitoring. Hence, informality refers to “off the books” exchanges. From dichotomy (Geertz 1978) to heterogeneity (Tokman 1989) to continuum (Pisani et al. 2008; Williams and Youssef 2014), evolving scholarship continues to refine our understanding of informality. Today, more research emphasis is placed on the entrepreneurial nature of informal production (or suppliers) of goods and services (Thai and Turkina 2012), relatively absent are the consumers of informal goods and services (Pisani 2013).
Losby et al. (2002) conducted a comprehensive literature review of informality within the United States and uncovered the following patterns: (1) there is a natural link between informality and microenterprise entrepreneurship—that is, very small businesses lend themselves to low levels of visibility and high levels of ignorance of governmental regulations and authority; (2) the general level of informal activity is large (roughly 10%) and constant within a sea of similar sized business (75% of US business establishments employ ten or fewer employees); (3) informal businesses may thrive in environments that (a) meet the needs of high-income consumers who seek customized goods and services (this is the case for our present study); (b) serve low-income, price-sensitive households; (c) serve commuters and tourists in urban centers through low-cost operations.
Gunter (2017) sheds light on participation rates and movement between informal and formal earnings for urban fathers and mothers in the US utilizing a panel study over a recent nine-year period. Gunter found that 53% of fathers and 32% of mothers have participated in informal economy at one time or another. The rate for Hispanics was slightly lower, with 48% of fathers and 27% of mothers as informal economy participants. Participation is not confined sectorally, as informal participants may move back and forth between the formal and informal sectors or be engaged in both simultaneously (Gunter 2017; Richardson and Pisani 2012). Gunter (2017, p. 17) adds:
“Simultaneous participation in the regular and informal sectors and the relationship between regular-sector occupation changes and participation in informal work both suggest that regular-sector positions provide individuals with access to short-term informal-sector opportunities. Although participation in informal work is driven in part by individuals who face barriers to work in the regular sector or who have exited the formal sector entirely, many informal workers appear to use the skills or relationships they gain through regular employment to take advantage of alternative earning opportunities.”
In their book-length manuscript of Hispanic informality in South Texas, Richardson and Pisani (2012) explore the many faces of informality with a focus on informal activities, informality and legal status, informal housing, informal health care, cross-border informality, and welfare and informality. They find that the informal economy is part and parcel of South Texas economy and generally accepted feature of the economic landscape. Similarly, Hondagneu-Sotelo (2007), Staudt (1998), Ward (1999) study informality in Hispanic regional populations across various sectors. Because of its early stage of development, the online-based sharing economy was not considered.
As many as 2.5 million participate in the sharing economy (Bruckner 2016). Because as many as 60% of sharing economy earners do not receive a completed US Internal Revenue Service Form 1099-K (to document card payment transactions) or Form 1099-MISC (to document direct sales and contract work) from their online platform, these sharing economy participants are not prompted to file taxes on their gig economy earnings (Bruckner 2016). Additionally, 88% of gig economy workers earned less than USD 15,000, well below the USD 20,000 or 200 transaction thresholds that online platform companies have to report to the IRS (Bruckner 2016; Sullivan 2016). Hence many sharing economy workers, knowingly or not, do not report gig economy earnings and are thus an integral part of the informal sector. Additionally, the federal government has little incentive to force tax compliance on small scale gig economy earners who average between USD 3768 and USD 6635 annually (Bruckner 2016) as enforcement costs (and possible deductions and rebates) would outweigh potential tax collections.

3. Methodology: Sample, Instrumentation, and Descriptive Statistics

The genesis of the Enterprising and Informal Work Activities (EIWA) survey began with the Consumer and Community Affairs division of the Board of Governors (BoG) of the US Federal Reserve System (Much of the detail in this section relies upon Robles and McGee 2016). The survey’s creation, development, and deployment were led by the Consumer and Community Development research section of the BoG. Survey administration (fielding) was outsourced to GfK, a large global online consumer research firm, which obtained a nationally representative sample of 6898 respondents aged 18 and over in the late fall of 2015. Hispanics comprised 1032 of the total or fifteen percent of all respondents. The reported non-response rate was 44.7% The collected responses were adjusted for non-respondents and weighted by demographics—age, gender, race and ethnicity, education, residence, and income—and Internet access. The data source for this study is the Board of Governors of the US Federal Reserve System and in May 2017, the Enterprising and Informal Work Activities codebook and survey data were released for public download. The codebook and data may be accessed at https://www.federalreserve.gov/consumerscommunities/community-development-publications.htm (accessed on 15 June 2017). I utilized the post-stratification sample-based weight for total respondents (weight 1) in the analyses.
The survey instrument contained five modules: EIWA screening questions (eleven questions focused on three areas, these include personal services, online and online sharing economy, and selling goods offline over the last six months); employment (eight questions, focused on the last six months of employment); self-employment, two modules (twenty-four questions, focused on the last six months of self-employment); side jobs and informal activities (ten questions focused on EIWA earnings over the last six months). Ten demographic questions were also asked (i.e., age, gender, education, ethnicity/race, etc.). The EIWA survey was conducted in English, the median time to complete the survey was six minutes, and the survey was completed asynchronously (at one’s own timing) online.
The Hispanic participation rate of 37.8% in enterprising and informal work activities was just above the national rate of 36.0% and surpassed both Whites and Blacks (see Table 2). Note that both White and Anglo are used interchangeably throughout the article. Anglo is commonly referenced in contrast to Hispanics as terms of ethnicity among scholars of Latino studies (see Richardson and Pisani 2017). Though statistically different, the rates of participation for the groups in Table 2 hover between 35% and 41% suggesting a broad consensus in the participation of EIWA actions. In graphical form, the data in Table 1 is presented in the accompanying figure (see Figure 1). This partially answers our first research question of Hispanic participation rates in EIWA with regard to other racial and ethnic groups. We detail a further breakdown of specific EIWA activities in the next section.
In Table 3, we report the descriptive statistics for Hispanics in the survey, those engaged and not engaged in EIWA. We also report all survey respondents for comparison. Briefly, EIWA participants are significantly younger than non-EIWA participants (significant differences between participants and non-participants are denoted by italics in Table 3). A little more than one-third of Latinos and Latinas participate in EIWA, and no significant difference exists by gender. EIWA participants are generally less educated with more household members than non-participants. However, those with less than a high school education have the highest participation rates for Hispanics. Single and divorced/separated Hispanic respondents have higher rates of EIWA participation than married or widowed Hispanics. While there are no significant differences by housing type, Hispanic respondents living in mobile homes and attached one-family units report higher rates of EIWA participation. Internet access is a clear divide between EIWA participants and non-participants. Rural (non-metro) Hispanics and renters participate at greater levels in EIWA than Hispanic urbanites and home owners. Hispanics in the Midwest have the highest percentage of EIWA participants. Generally, those Hispanics not working have higher participation rates than Hispanics who work for a wage or salary. Additionally, Hispanics with the highest household incomes have the highest EIWA participation rates.

4. Results and Discussion

In this section we present our results in subsections based upon our three research questions focused on the racial and ethnic differences in participation in the sharing and informal economies (RQ#1), the rationale of Hispanic engagement in the sharing and informal economies (RQ#2), and the drivers of Hispanic participation in the sharing and informal economies (RQ#3). We also include a discussion at the end of this section.

4.1. EIWA Differences across Racial and Ethnic Groups

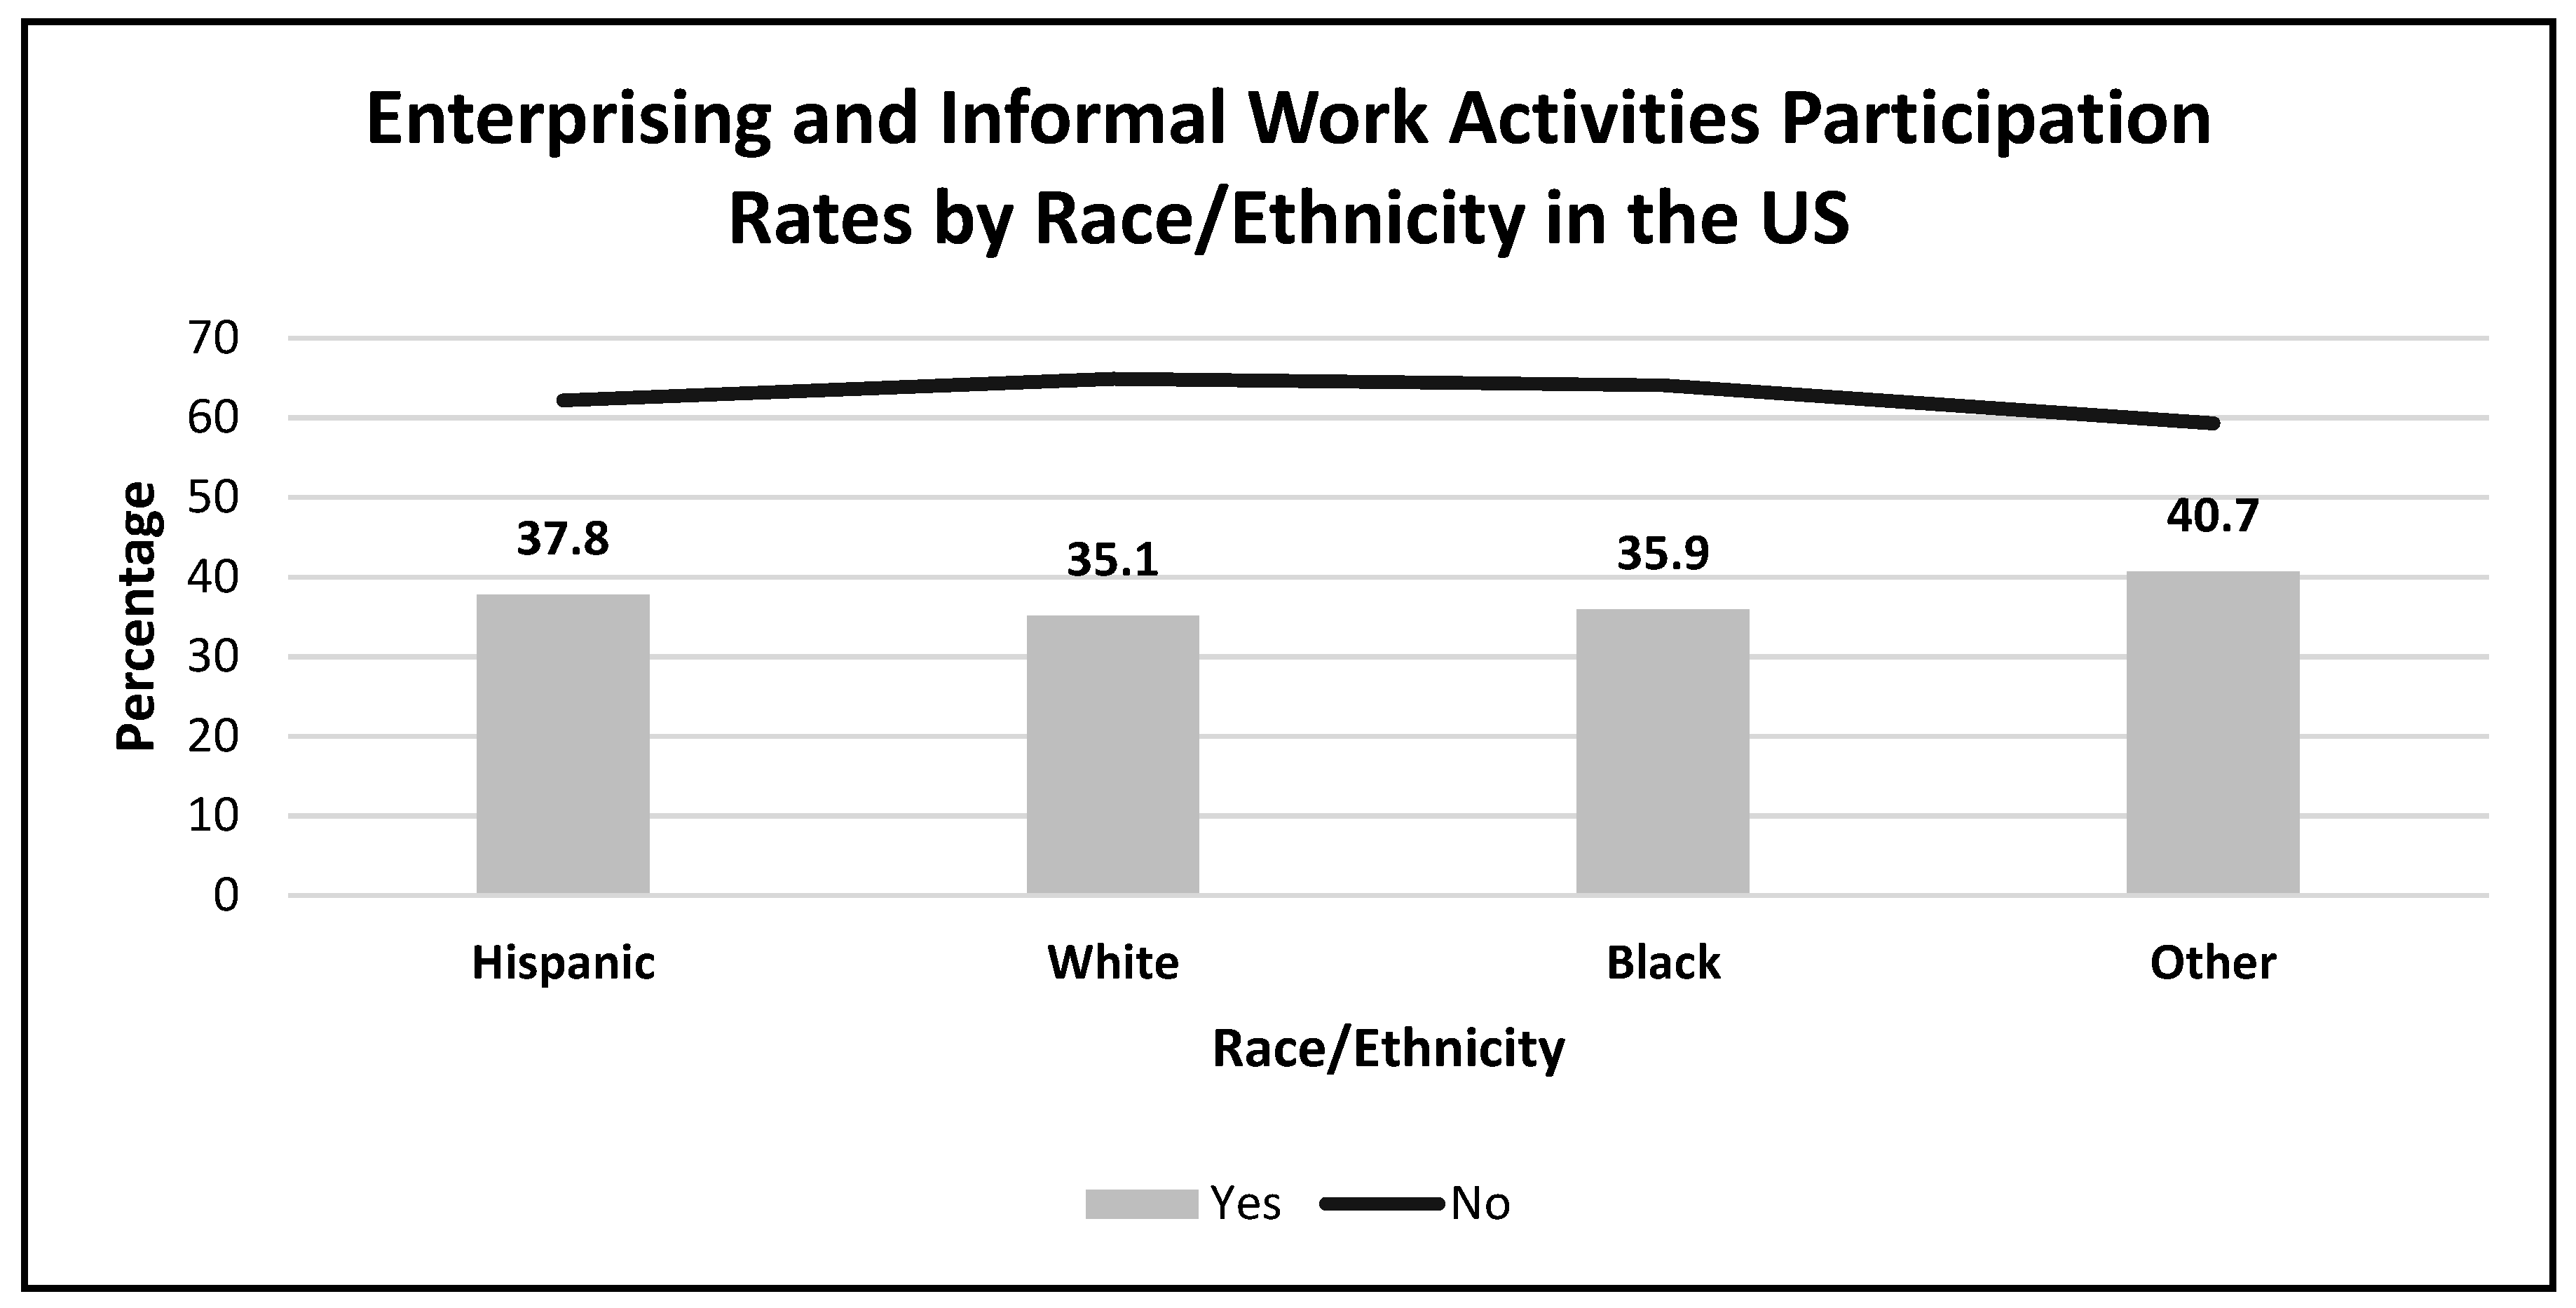
In this section, we report the engagement in EIWA for Hispanics and other racial and ethnic groups. For comparison, Whites, Blacks and others are included as they are the distinguishable groups in the data set (though other refers to “other, non-Hispanic” and those of “two or more races other than Hispanic” and does not offer much further detail). The first module of the EIWA survey contained eleven questions in three categories: personal services, online and online sharing economy which captures asynchronous online market exchanges (e.g., eBay, Craigslist) and real time synchronous market exchanges (e.g., Uber, Lyft), and selling goods offline (see Table 4). Personal services included four questions focused on in-home services (e.g., childcare, elder care, house cleaning, landscaping) and reports that 21.7% of Hispanic respondents engaged in at least one of these activities—a higher rate than in other groups. The online sharing economy has the highest participation rate of 22.2% of Hispanic respondents engaging in at least one of the four areas of consideration: completing online tasks, renting out a property, selling new or used goods, or other online paid activities. Hispanics participate in asynchronous online and real time online sharing economy at higher rates than Whites and Blacks. More traditional methods of selling goods offline netted 10.3% of Hispanic respondents a rate in between Whites (11.9%) and Blacks (8.8%). As previously stated, 37.8% of Hispanics participate in the sharing and informal economies, a rate higher than Whites and Blacks.
With regard to the online sharing economy, two websites have the highest Hispanic participation as income earners: Craigslist and eBay (see Table 5). Latinos participate at a higher rate than Whites and Blacks in all but one of the listed online EIWA areas except for eBay, where Whites participate at a slightly higher level. Sundararajan suggests that Craigslist and eBay online platforms are precursors to the sharing economy because they are low risk asynchronous retail exchanges where proximity is not very important. These activities, nonetheless, may be gateway actions that permit a deeper future engagement with the mainline sharing economy Sundararajan describes, as reported in Table 5.
On average, Hispanics engaged in EIWA spend 14 h per month working in the sharing and informal economies (see Table 6, Panel A). On average, this compares to 12.2 h for Whites, 19.3 h for Blacks, and 16.0 h for others per month (Panels A–D). Latino households with the least income (5.8 h) and most income (6.1 h) work the fewest hours in EIWA per month. Hispanic households earning between USD 75,000 and USD 100,000 work, on average, the most hours at 29.7 per month, or about the equivalent of one full 8 h day per week. For Whites, the general pattern of hours worked in EIWA decreases with household income. Hourly participation rates for Blacks vary considerably by income with no discernable pattern. The other group pattern more closely aligns with Latino households.
At the request of a reviewer, a more focused univariate (cross-tabulation) look at gender differences within Hispanics only is reported here by EIWA sub-category. Women are 1.3 times more likely than men to be engaged in personal services; men are 1.2 times more likely than women to be engaged in the online sharing economy; women are 1.1 times more than men likely to be selling goods offline; there are virtually no gender differences for total combined EIWA activities.

4.2. Hispanic Participation in EIWA—The Rationale

Earning extra money is the focal aim of participating in sharing and informal economies for Hispanics. The extra money may be a primary source of income, supplemental household income, or income to help family members (see Table 7). Of the categories in Table 7, reporting over twenty percent only, to help earn extra money for family members shows a slight difference in reporting by gender with women slightly more likely than men to undertake EIWA activities to financially help a family member. About one-fifth of Hispanics engage in EIWA just for fun or as a hobby. As earning extra income is important for Hispanics, I calculate annual household income earned through EIWA. On average, 14.3% of Hispanic household income—for those Hispanics participating in the sharing and informal economies—was generated through EIWA, and EIWA reached 25% of household income for households earning USD 75,000 to USD 100,000. Dollar ranges by household EIWA earnings are reported in Table 8. Over half of the respondents thought they would stay engaged in EIWA at the same pace and three income groups (from USD 15,000 to USD 74,999) believed they would increase their participation (see Table 9). Only the most heavily engaged income group believed they would taper off in their rates of EIWA participation.

4.3. Hispanic Participation in EIWA—The Drivers

Hispanic participants in EIWA were asked variations of the importance of the income earned from EIWA. Reported in Table 10, Panel A are the results of how EIWA income may have offset any negative economic household shocks over the past six months. Those respondents with the lowest household incomes found the greatest income support from EIWA. However, a plurality (i.e., largest response group) of respondents indicated across all incomes no discernable impact. Table 10, Panel B focused on the importance of EIWA earnings as a significant source of household income. Here a majority of all income groups noted that EIWA was not a significant source of household income, though about one quarter indicated that EIWA income was somewhat or very much significant for household income. Lastly, Panel C of Table 10 reports the regularity and consistency of EIWA income for household earnings. For about one-fifth of the lowest household income respondents, EIWA earnings were very much a regular component of household income. For sizable portions of all income groups, EIWA earnings were at least a somewhat regular component of household income.
To discern the major drivers (i.e., significant variables or determinants) of Hispanic EIWA participation, more advanced analyses of the survey data were undertaken. As the dependent variable is dichotomous (participates in EIWA = 1, or does not participate in EIWA = 0) with multiple independent variables, we employed a binomial logistic regression model. The independent or predictor variables are age, gender, education, civil status, housing and ownership type, Internet access, urban or rural residence, regional residence, employment status, and annual household income. Categorical variables were assigned a reference category. The assigned reference categories are: gender = female; education = BA/BS or Higher; civil status = married/living with partner; housing type = detached 1-family house (boat, van, omitted because of a very low response rate); Internet access at home = yes; urban residence = urban; residence ownership = owned/purchasing; US residence location = west; employment status = working wage and salaried; annual household income = under USD 15,000. As this is an exploratory study, these variables were chosen due to their availability and connection to the sharing and informal economies literature. Logistic regression predicts the odds of an event occurring, in the present case the odds or likelihood of Hispanic EIWA participation.
Table 11 displays our logistic regression results for Hispanics engaged in EIWA. Significant variables include age, education, civil status, Internet access, residence ownership type, regional residential location, employment status, and annual household income and are described below. Gender is an insignificant variable in this analysis. Each additional year of age reduces the likelihood of EIWA participation by 2.2%. This is calculated as 1-β. For age, see Table 11, row 3. The exp(β) found in column 6 is 0.978. Thus 1 − 0.978 equals 0.022. As the variable age is a count variable in one-unit increments beginning at 18, a 25-year-old is 15.4% less likely than an 18-year-old to participate in EIWA (25 − 18 = 7; then 7 × 0.022 = 0.154). The reference category for education is a college degree or higher, hence, those Hispanics with less than a high school education are 63.9% more likely to be EIWA participants than college graduates. Divorced and separated respondents are 88.9% more likely to participate in EIWA than married and couples living together. Those respondents without Internet access at home are 43.8% less likely to be EIWA participants than those respondents with home-based Internet access. Renters and those respondents living in rent-free spaces are 56.2% and 79.7%, more likely to participate in EIWA, respectively, then home-owning respondents.
As compared to US residence in the West, the odds of EIWA participation increase by 61.2% and 35.5% for residence in the US Midwest and South, respectively. Regarding those respondents working full time for a wage and salary, the self-employed, and those not working and (a) looking for work, (b) retired, and (c) disabled are all more likely to be EIWA participants. The odds of greater EIWA participation are 66.2% for the self-employed, 118.9% for those looking for work, 94.7% for the retired, and 82.7% for the disabled. Respondents with annual household earnings of less than USD 15,000 served as the reference category for income. Hispanic households earning between USD 15,000 and USD 34,999, USD 35,000 and USD 49,999, and over USD 100,000 were 61.04%, 83.2% and 155.4%, respectively, more likely to participate in EIWA than the lowest earning Hispanic households. The model diagnostics appear at the bottom of Table 11 and fall within acceptable ranges. This also includes checks for multicollinearity where the correlation matrices for the various binary logistic regression estimates fall within acceptable ranges.
We also estimated logistic regression models for the three subcategories of EIWA: personal services, the asynchronous online and real-time sharing economy, and selling goods offline (described in Table 4). The results are briefly reported here in condensed form, the tables may be viewed in Appendix A. Hispanics that have participated in any of the personal services were less likely to participate if they were men and as respondents aged (see Table A1). Increasing the odds of participating in personal services were those with less than a high school education, single individuals who had never married, those living in mobile homes, respondents who were rented their housing, respondents living in the Midwest, the self-employed, those out of work and those looking for a job, and those with household incomes above USD 15,000 except for those households earning between USD 50,000 and USD 74,999. Hispanics that participate in any aspect of the online and sharing economy were more likely to do so if they rent or occupy rent-free housing, live in the South, were laid-off from work, were retired, and were part of household that earned USD 100,000 or more per year. Decreasing the odds of participating in the online and sharing economy for Hispanics was increasing age, status as never married single, and lack of internet access at home (see Table A2). The odds for Hispanics participating in the selling of goods decreased for those living in urban environments and for those without Internet access at home (see Table A3). Conversely, Hispanics were more likely to sell goods offline if they possessed less than a high school education, lived in households with more members present, were divorced or separated, occupied free rent housing, and were out of work for an unspecified reason.
A simplified summary table of all the logistic regression models is provided in Table 12). Where a variable is significant, either a “+” or a “−” is inserted to indicate more likely or less likely to impact the odds of participation. For all but one variable, the directionality of signs are in concert with one another. The results generally indicate an increase in age lessens the odds of EIWA participation, respondents with less than a high school education were active EIWA participants, divorced or separated Hispanics participated in EIWA, lack of internet access at home decreased EIWA participation, rental housing increased participation in EIWA, Midwest and Southern locations increased EIWA participation, the self-employed and out of work were likely EIWA participants, and higher income households were more likely to participate in EIWA. More specifically, men were less likely to provide personal services, larger member households were more likely to be involved in selling goods offline, living in a mobile home or an urban environment was likely to enhance participation in personal services. Mixed findings for singles meant singles who were more likely to participate in personal services and less likely to participate in online and sharing economy.

4.4. Discussion

Hispanics have higher rates of EIWA participation than African Americans and Anglos in the US economy. This higher rate also holds for personal services and for the online and online sharing economy. Higher personal services rates for Hispanics may reflect more recent immigrant experiences including challenges associated with work authorization which are important in connecting economic participation. The EIWA survey did not ask questions of work authorization or immigration history, so this direct connection is left unanswered in the EIWA survey. Latino engagement in the online and online sharing economy illustrates a willingness to pursue income earning opportunities innovatively and asynchronously. Asynchronous online participation allows for the juggling and management of time, altering the scheduling of time from one of reaction to pro-action. Innovations, such as involvement in Craigslist or eBay, provide a safe first step into the online environment that may provide greater confidence in the participation in EIWA activities creating a gateway to further more sustained and perhaps synchronous future involvement. Additionally, this online activity has been accomplished with the constraint of internet usage and broadband access gaps between Hispanics and African Americans and Anglos, where Hispanics lag behind. However, these gaps are quickly narrowing and may disappear in a few years (Brown et al. 2016). Selling goods offline is an American tradition, be they yard sales, flea markets or pulgas, craft fairs, or food stands, and selling goods offline is not highly distinguishable, especially among Hispanics and Anglos.
Time committed to EIWA activities varies substantially by ethnic and racial group. While Whites may be using EIWA to supplement incomes, so that lower income households devote more time to EIWA, the households of Latinos and Blacks, on the other hand, may find their time involvement constrained or augmented by additional factors. These may include access to the sharing and informal economies, perhaps stunted or augmented by internet availability, available income earning opportunities, and market information. Focusing on Hispanics, the EIWA survey clearly indicates that the motivation for EIWA involvement is to earn income, be it as a primary or secondary income with the intention to continue or accelerate EIWA participation.
One of the more interesting findings is that relatively affluent Hispanic households (USD 75,000 to USD 99,999 annual incomes) are the most engaged in EIWA by time spent and income earned. This, in part, may reflect the added stress of incomes keeping up and catching up to others in America where many households are still digging out from the economic and housing crisis of 2008/2009 and the malaise in income growth over the past decade. Other economic stresses, such as college education for children, may also be at play. The added income may simply help to maintain a middle-class lifestyle in America. For many, extra income earned in EIWA for this group, most of it likely unreported, is perhaps a rational economic response and strategy to get ahead. Gender differences are mostly muted, perhaps a fertile area for future investigators to explore and explain.
Our multivariate statistical results indicate those variables critical to EIWA participation. It is certain that youth matters, as younger respondents were more likely to engage in EIWA. This result may, in part, have to do with technological familiarity for the online sharing economy and possibly immigrant status and ease of employment access for personal services. Where education and income tend to be highly correlated, earning extra household income for those respondents with less than a high school education seems to be a plausible supplemental income strategy. This may be true of renters and those that occupy rent-free residences as well as those not working. The divorced and separated may find time spent previously with family may now be reoriented to EIWA. With little doubt, home-based internet access is the gateway to the online sharing economy. While public access to the internet allows some to participate in EIWA, the convenience of, and ready access to, home-based broadband internet is a key element in EIWA engagement. Respondents in the Midwest and South find themselves more engaged in EIWA, perhaps an area for more study to uncover the reasons for this phenomenon. Additionally, as stated and described above, it is not the poorest households that are the most engaged in EIWA.

5. Conclusions and Policy Implications

Hispanics, similar to other groups in the US, are active participants in the informal and sharing economies. This study is an exploratory first step to place Hispanics within the growing new age informality centered on the online sharing economy as a complement to the informal economy. In total, 37.8% of Hispanics are involved in the informal and sharing economies—caring for and cleaning others, selling on eBay or Craigslist, driving for Uber, or selling goods at pulgas or vending from food trucks. Upper middle-class Hispanics are the most engaged in time and earnings in the sharing and informal economies. As such, the sharing economy provides a conduit to engage more widely with innovative income-earning opportunities across income groups, perhaps demystifying the sharing economy as one that services the affluent with the labor of the masses. Upper- and middle-class Latinos participate in the sharing and informal economies to earn extra income, income that most likely goes unreported to government authorities. However, some of the notions of the sharing economy persist where younger, single, and less educated Latinos more widely participate than older, married, and more educated Latinos.
Simply put, increased internet access provides great engagement in the sharing economy. While access to broadband and usage rates of the Internet for Hispanics is improving, there still exists a technological divide, a digital gap, inhibiting Hispanics from even greater participation in the online sharing economy. Perhaps this digital divide has created a lag in participation for Hispanics in the synchronous sharing economy not evident in the asynchronous online sphere. Public policy directed toward the greater inclusion of all, and especially for Hispanic communities, in the internet age will broaden opportunities for all to participate in and profit from the growing gig economy. For Latinos to show the participation levels they do indicates resilience in the face of structural online access barriers.
Undoubtedly, unreported income will surge with the growth of the sharing economy, where already nearly 40% of households earn a portion of income. Many who participate, the self-employed and those not working, easily fall under and avoid government radars. Cooperation between app providers and government is required to enforce the present tax regime. Perhaps beginning with the most ubiquitous apps—such as Uber, Lyft, and Airbnb—operating in plain sight (Williams and Horodnic 2017) to report all earnings to the federal government for all contract workers and providers may assist with pertinent income tax filings and transition informal activities to formal ones. Afterall, these sharing economy transactions are digitally constructed, exchanged, and recorded. Such tax filings are not an especially onerous administrative requirement for app providers who already do so for contract workers who annually earn above USD 20,000 or have undertaken 200 or more transactions. Notwithstanding these digital filings, it is more challenging to deal with the monitoring of the informal economy where a third-party intermediary is, more often than not, absent and transactions are more likely to occur in cash. Where informal earnings are relatively large, government tax enforcement efforts may be worthy of additional focus and resources. On the other hand, small-time informal actors may be better handled by permissive legislation that allows for some informal earnings without engaging the formal tax bureaucracy. Such legislation may allow time and space for budding entrepreneurs who start out using a small corner of the house (such as Phil Knight of Nike) or garage (such as Steve Jobs and Steve Wozniak of Apple) to eventually outgrow their informal roots to become formal and upstanding enterprises without reprisal.
Further research should consider the impact of the COVID-19 pandemic and immigrant work authorization on Hispanic and other minority group participation in the production (supply side) of the sharing and informal economies. Complementary studies that examine the demand side (consumers) of the sharing and informal economies are needed to extended our understanding of the sharing and informal economic marketplace.

Funding

This research received no external funding.

Institutional Review Board Statement

Not applicable.

Informed Consent Statement

Not applicable.

Data Availability Statement

The codebook and data utilized in this study is publicly available and may be accessed at https://www.federalreserve.gov/consumerscommunities/community-development-publications.htm.

Conflicts of Interest

The author declares no conflict of interest.

Appendix A

Table A1. Logistic Regression of Hispanic EIWA Personal Services (Personal Services = 1).
VariableβS.E.WaldSig.Exp(β)
Constant−1.8850.58010.5810.001 ***0.152
Age −0.0210.0077.5760.006 ***0.980
Gender (Female = 1)−0.3540.1764.0330.045 **0.702
Education 14.7920.002 ***
 Less than High School1.0150.30311.2460.001 ***2.759
 High School0.3020.2841.1340.2871.353
 Some College0.3350.2821.4060.2361.398
Household Size−0.0750.0561.8040.1790.928
Civil Status 4.3260.228
 Widowed0.1580.4340.1330.7161.172
 Divorced/Separated0.4000.2532.4950.1141.492
 Single, Never Married0.3830.2183.0700.080 *1.466
Housing Type 2.9960.392
 Attached 1-Family Home 0.1080.3550.0930.7611.114
 Apartment−0.0470.2510.0350.8510.954
 Mobile Home0.6000.3642.7170.099 *1.822
Internet Access at Home (Yes = 1)0.1060.2270.2190.6401.112
Urban Residence0.5800.3073.5630.059 *1.785
Residence Ownership Type 5.4380.066 *
 Rented0.4880.2185.0290.025 **1.629
 Occupied, No Rent0.4960.3981.5560.2121.643
US Regional Residence Location 15.3550.002 ***
 Northeast−0.4380.2902.2910.1300.645
 Midwest0.7900.3056.6910.010 ***2.203
 South0.4480.1965.2240.0221.566
Employment Status 23.8350.001 ***
 Working—Self-Employed0.8750.3386.7070.010 ***2.398
 Not Working—Temporarily Laid-off−0.2460.5670.1880.6650.782
 Not Working—Looking for Work1.1880.27618.4620.000 ***3.280
 Not Working—Retired0.1990.3920.2580.6121.220
 Not Working—Disabled0.3890.3101.5750.2091.476
 Not Working—Other0.1860.2740.4640.4961.205
Annual Household Income 16.9570.005 ***
 USD 15,000 to USD 34,9990.6230.2785.0110.025 **1.864
 USD 35,000 to USD 49,9990.7000.3065.2270.022 **2.014
 USD 50,000 to USD 74,999−0.1440.3250.1950.6590.866
 USD 75,000 to USD 99,9990.5600.3382.7430.098 *1.751
 Over USD 100,0000.8430.3326.4310.011 **2.322
Model Statistics
−2 Log Likelihood = 956.659, Cos and Snell R Square = 0.110; Nagelkerke R Square = 0.170; p = 0.000
Classification Table (Hit Ratio) Percentage Correct: No = 96.5; Yes = 19.7; Overall = 79.7
Reference categories: Gender = Female; Education = BA/BS or Higher; Civil Status = Married/Living with Partner; Housing Type = Detached 1-Family House (boat, van, omitted); Internet Access at Home = Yes; Urban Residence = Urban; Residence Ownership = Owned/Purchasing; US Residence Location = West; Employment Status = Working Wage and Salaried; Annual Household Income = Under USD 15,000. Note: ***, **, * signify statistical significance at the 0.01, 0.05, and 0.10 levels.
Table A2. Logistic Regression of Hispanic EIWA Online and Online Sharing Economy (Online and Sharing Economy = 1).
VariableβS.E.WaldSig.Exp(β)
Constant−1.0250.5713.2180.073 *0.359
Age −0.0240.0089.1660.002 ***0.976
Gender (Female = 1)0.1640.1680.9510.3301.178
Education 0.4030.940
 Less than High School−0.1670.2860.3410.5590.846
 High School−0.0830.2480.1130.7360.920
 Some College−0.0340.2430.0200.8880.966
Household Size−0.0140.0540.0690.7930.986
Civil Status 9.5490.023 **
 Widowed−1.0600.7012.2850.1310.346
 Divorced/Separated0.3350.2451.8620.1721.397
 Single, Never Married−0.4090.2173.5390.060 *0.664
Housing Type 3.2120.360
 Attached 1-Family Home 0.2070.3110.4430.5061.230
 Apartment−0.3300.2451.8180.1780.719
 Mobile Home−0.1720.4390.1530.6960.842
Internet Access at Home (Yes=1)−0.7870.2559.5210.002 ***0.455
Urban Residence0.4740.3342.0150.1561.606
Residence Ownership Type 21.6330.000 ***
 Rented0.9320.21019.6860.000 ***2.539
 Occupied, No Rent1.0280.4016.5780.010 ***2.795
US Regional Residence Location 6.7840.079 *
 Northeast−0.0220.2660.0070.9330.978
 Midwest0.4800.3112.3810.1231.616
 South0.4280.1905.0790.024 **1.534
Employment Status 15.5360.016 **
 Working—Self-Employed0.5870.3383.0150.082 *1.798
 Not Working—Temporarily Laid-off1.4170.4838.6150.003 ***4.127
 Not Working—Looking for Work0.3720.3021.5180.2181.451
 Not Working—Retired0.9600.3577.2400.007 ***2.612
 Not Working—Disabled0.3170.3250.9510.3291.372
 Not Working—Other0.1040.2750.1430.7051.110
Annual Household Income 8.7230.121
 USD 15,000 to USD 34,999−0.0480.2960.0260.8720.953
 USD 35,000 to USD 49,9990.3850.3141.5000.2211.469
 USD 50,000 to USD 74,999−0.0730.3130.0540.8160.930
 USD 75,000 to USD 99,9990.3380.3281.0610.3031.402
 Over USD 100,0000.5910.3263.2880.070 *1.806
Model Statistics
−2 Log Likelihood = 1006.307, Cox and Snell R Square = 0.079; Nagelkerke R Square = 0.120; p = 0.000
Classification Table (Hit Ratio) Percentage Correct: No = 98.3; Yes = 7.6; Overall = 78.1
Reference categories: Gender = Female; Education = BA/BS or Higher; Civil Status = Married/Living with Partner; Housing Type = Detached 1-Family House (boat, van, omitted); Internet Access at Home = Yes; Urban Residence = Urban; Residence Ownership = Owned/Purchasing; US Residence Location = West; Employment Status = Working Wage and Salaried; Annual Household Income = Under USD 15,000. Note: ***, **, * signify statistical significance at the 0.01, 0.05, and 0.10 levels.
Table A3. Logistic Regression of Hispanic EIWA Selling Goods Offline (Selling Goods Offline = 1).
VariableβS.E.WaldSig.Exp(β)
Constant−2.9850.77314.9020.000 ***0.051
Age −0.0140.0111.7250.1890.986
Gender (Female = 1)0.2470.2381.079.2991.280
Education 12.1140.007 ***
 Less than High School0.9320.40045.3220.021 **2.540
 High School0.3350.3820.7680.3811.398
 Some College−0.1740.4010.1880.6650.841
Household Size0.2070.0679.6920.002 ***1.231
Civil Status 6.2560.100 *
 Widowed0.2040.7150.0820.7751.227
 Divorced/Separated0.7420.3255.2260.022 **2.101
 Single, Never Married−0.1590.3100.2630.6080.853
Housing Type 0.6850.877
 Attached 1-Family Home −0.0870.4490.0380.8460.916
 Apartment−0.2360.3420.4750.4910.790
 Mobile Home−0.3180.6110.2700.6030.728
Internet Access at Home (Yes = 1)−0.9760.3896.2970.012 **0.377
Urban Residence−0.9900.5483.2650.071 *0.371
Residence Ownership Type 4.5230.104
 Rented0.3970.2831.9630.1611.487
 Occupied, No Rent1.0070.5283.6460.056 *2.738
US Regional Residence Location 5.7710.123
 Northeast−0.1010.3900.0660.7970.904
 Midwest0.8300.3824.7210.030 **2.293
 South0.3330.2661.5690.2101.395
Employment Status 8.5780.199
 Working—Self-Employed−0.5820.6170.8920.3450.559
 Not Working—Temporarily Laid-off0.5630.6760.6950.4051.757
 Not Working—Looking for Work−0.3250.4340.5620.4530.722
 Not Working—Retired0.5320.4981.1410.2851.703
 Not Working—Disabled0.3110.4330.5160.4731.365
 Not Working—Other0.6560.3293.9640.046 **1.927
Annual Household Income 5.4630.362
 USD 15,000 to USD 34,999−0.3370.3910.7410.3890.714
 USD 35,000 to USD 49,999−0.1280.4190.0940.7590.880
 USD 50,000 to USD 74,9990.2850.3900.5320.4661.329
 USD 75,000 to USD 99,999−0.0790.4470.0310.8600.924
 Over USD 100,000−0.5180.4811.1610.2810.596
Model Statistics
−2 Log Likelihood = 607.967, Cox and Snell R Square = 0.071; Nagelkerke R Square = 0.147; p = 0.000
Classification Table (Hit Ratio) Percentage Correct: No = 100.0; Yes = 3.8; Overall = 90.0
Reference categories: Gender = Female; Education = BA/BS or Higher; Civil Status = Married/Living with Partner; Housing Type = Detached 1-Family House (boat, van, omitted); Internet Access at Home = Yes; Urban Residence = Urban; Residence Ownership = Owned/Purchasing; US Residence Location = West; Employment Status = Working Wage and Salaried; Annual Household Income = Under USD 15,000. Note: ***, **, * signify statistical significance at the 0.01, 0.05, and 0.10 levels.

References

  1. Albinsson, Pia A., B. Yasanthi Perera, Lubna Nafees, and Bidisha Burman. 2019. Collaborative Consumption Usage in the US and India: An Exploratory Study. Journal of Marketing Theory and Practice 27: 390–412. [Google Scholar] [CrossRef]
  2. Brown, Anna, Gustavo López, and Mark H. Lopez. 2016. Digital Divide Narrows for Latinos as More Spanish Speakers and Immigrants Go Online. Washing, DC: Pew Research Center, Available online: http://assets.pewresearch.org/wp-content/uploads/sites/7/2016/07/PH_2016.07.21_Broadbank_Final.pdf (accessed on 3 July 2017).
  3. Bruckner, Caroline. 2016. Shortchanged: The Tax Compliance Challenges of Small Business Operators Driving the On-Demand Platform Economy. Washington, DC: Kogod Tax Policy Center, Kogod School of Business, American University, Available online: http://www.american.edu/kogod/news/upload/shortchanged-caroline-bruckner-kogod-au.pdf (accessed on 30 June 2017).
  4. Chai, Sunyu, and Maureen A. Scully. 2019. It’s About Distributing Rather than Sharing: Using Labor Process Theory to Probe the ‘Sharing’ Economy. Journal of Business Ethics 159: 943–60. [Google Scholar] [CrossRef]
  5. De Soto, Hernando. 2000. The Mystery of Capital: Why Capitalism Triumphs in the West and Fail Everywhere Else. New York: Basic Books. [Google Scholar]
  6. Dickey, Megan R. 2017. Lyft Finally Releases a Diversity Report. TechCrunch: Available online: https://techcrunch.com/2017/06/01/lyft-diversity-report/ (accessed on 28 June 2017).
  7. Friedman, Thomas L. 2016. Thank You for Being Late: An Optimist’s Guide to Thriving in the Age of Accelerations. New York: Farrar, Straus and Giroux. [Google Scholar]
  8. Geertz, Clifford. 1978. The Bazaar Economy: Information and Search in Peasant Marketing. American Economic Review 68: 28–32. [Google Scholar]
  9. Gobble, Mary Anne M. 2017. Defining the Sharing Economy. Research Technology Management 60: 59–61. [Google Scholar] [CrossRef]
  10. Gunter, Samara R. 2017. Dynamics of Urban Informal Labor Supply in the United States. Social Science Quarterly 98: 16–36. [Google Scholar] [CrossRef] [PubMed] [Green Version]
  11. Hamari, Juho, Mimmi Sjöklint, and Antii Ukkonen. 2016. The Sharing Economy: Why People Participate in Collaborative Consumption. Journal of the Association for Information Science and Technology 67: 2047–59. [Google Scholar] [CrossRef]
  12. Hart, Keith. 1970. Small Scale Entrepreneurs in Ghana and Development Planning. Journal of Development Planning 6: 104–20. [Google Scholar] [CrossRef]
  13. Hart, Keith. 1973. Informal Income Opportunities and Urban Employment in Ghana. Journal of Modern African Studies 11: 61–89. [Google Scholar] [CrossRef]
  14. Hira, Andy, and Katherine Reilly. 2017. The Emergence of the Sharing Economy: Implications for Development. Journal of Developing Societies 33: 1–16. [Google Scholar] [CrossRef]
  15. Hondagneu-Sotelo, Pierrette. 2007. Doméstica: Immigrant Workers Cleaning & Caring in the Shadows of Affluence. Berkeley: University of California Press. [Google Scholar]
  16. Jiang, Jingjing. 2019. More Americans are Using Ride-Hailing Apps. Washington, DC: Factank, Pew Research Center, Available online: https://www.pewresearch.org/fact-tank/2019/01/04/more-americans-are-using-ride-hailing-apps/ (accessed on 11 December 2019).
  17. Katz, Lawrence F., and Alan B. Krueger. 2016. The Rise and Nature of Alternate Work Arrangements in the United States, 1995–2015. Working Paper #603. Princeton: Industrial Relations Section, Princeton University, Available online: http://dataspace.princeton.edu/jspui/bitstream/88435/dsp01zs25xb933/3/603.pdf (accessed on 30 June 2017).
  18. Klowden, Kevin, and Perry Wong. 2005. Los Angeles Economy Project. Santa Monica: The Milken Institute. [Google Scholar]
  19. Losby, Jan L., John F. Else, Marcia E. Kingslow, Elaine L. Edcomb, Erika T. Mal, and Vivian Kao. 2002. Informal Economy Literature Review. Washington, DC: The Institute for Social and Economic Development and The Aspen Institute, Available online: https://assets.aspeninstitute.org/content/uploads/2017/04/InformalEconomyLiteratureReview.pdf (accessed on 29 June 2017).
  20. Morris, Betsy. 2017. From Music to Maps, How Apple’s iPhone Changed Business. Wall Street Journal. June 23. Available online: https://www.wsj.com/articles/from-music-to-maps-how-apples-iphone-changed-business-1498210201 (accessed on 28 June 2017).
  21. Pisani, Michael J., and Alfonso Morales. 2020. Informality and Latino-owned Businesses: A National Portrait of Unregistered Latino-owned Businesses. Social Science Quarterly 101: 588–603. [Google Scholar] [CrossRef]
  22. Pisani, Michael J., Chad Richardson, and J. Michael Patrick. 2008. Economic Informality on the U.S.-Mexican Border: A (Re)View from South Texas. Journal of Borderlands Studies 23: 19–40. [Google Scholar] [CrossRef]
  23. Pisani, Michael J. 2013. Cross-Border Consumption of Informal and Underground Goods: A Case Study of Alternative Consumerism in South Texas. Social Science Quarterly 94: 242–62. [Google Scholar] [CrossRef]
  24. Portes, Alejandro, and Richard Schauffler. 1993. Competing Perspectives on the Latin American Informal Sector. Population and Development Review 19: 33–60. [Google Scholar] [CrossRef]
  25. Portes, Alejandro, Manuel Castells, and Lauren A. Benton, eds. 1989. The Informal Economy: Studies in Advanced and Less Developed Countries. Baltimore: The Johns Hopkins University Press. [Google Scholar]
  26. Rakowski, Cathy A., ed. 1994. Contrapunto: The Informal Sector Debate in Latin America. Albany: State University of New York Press. [Google Scholar]
  27. Richardson, Chad, and Michael J. Pisani. 2012. The Informal and Underground Economy of the South Texas Border. Austin: University of Texas Press. [Google Scholar]
  28. Richardson, Chad, and Michael J. Pisani. 2017. Batos, Bolillos, Pochos, and Pelados: Class and Culture on the South Texas Border, revised ed. Austin: University of Texas Press. [Google Scholar]
  29. Robles, Barbara, and Marysol McGee. 2016. Exploring Online and Offline Informal Work: Findings from the Enterprising and Informal Work Activities (EIWA) Survey; Finance and Economics Discussion Series 2016-089; Washington, DC: Board of Governors of the Federal Reserve System. Available online: https://www.federalreserve.gov/econresdata/feds/2016/files/2016089pap.pdf, (accessed on 28 November 2016).
  30. Schor, Juliet B. 2020. After the Gig: How the Sharing Economy Got Hijacked and How to Win It back. Oakland: University of California Press. [Google Scholar]
  31. Smith, Aaron. 2016a. Shared, Collaborative and on Demand: The New Digital Economy. Washington, DC: Pew Research Center, Available online: http://www.pewinternet.org/files/2016/05/PI_2016.05.19_Sharing-Economy_FINAL.pdf (accessed on 28 June 2017).
  32. Smith, Aaron. 2016b. Gig Work, Online Selling and Home Sharing. Washington, DC: Pew Research Center, Available online: http://assets.pewresearch.org/wp-content/uploads/sites/14/2016/11/17161707/PI_2016.11.17_Gig-Workers_FINAL.pdf (accessed on 29 June 2017).
  33. Staudt, Kathleen A. 1998. Free trade: Informal Economies at the U.S.-Mexican Border. Philadelphia: Temple University Press. [Google Scholar]
  34. Stephany, Alex. 2015. The Business of Sharing: Making It in the New Sharing Economy. London: Palgrave Macmillan. [Google Scholar]
  35. Sullivan, Mark. 2016. Due to Fuzzy Rules, Sharing-Economy Workers Often Underpay or Overpay Their Taxes; New York: Fast Company. Available online: https://www.fastcompany.com/3060241/due-to-fuzzy-rules-sharing-economy-workers-often-underpay-or-overpay-their-taxes (accessed on 30 June 2017).
  36. Sundararajan, Arun. 2016. The Sharing Economy: The End of Employment and the Rise of Crowd-Based Capitalism. Cambridge: MIT Press. [Google Scholar]
  37. Thai, Mai T. T., and Ekaterina Turkina, eds. 2012. Entrepreneurship in the Informal Economy: Models, Approaches and Perspectives for Economic Development. New York: Routledge. [Google Scholar]
  38. Tokman, Víctor E. 1989. Policies for a Heterogeneous Informal Sector in Latin America. World Development 17: 1067–76. [Google Scholar] [CrossRef]
  39. Ward, Peter M. 1999. Colonias and Public Policy in Texas and Mexico: Urbanization by Stealth. Austin: University of Texas Press. [Google Scholar]
  40. Williams, Colin C., and Ioana A. Horodnic. 2016. Cross-country Variations in the Participation of Small Businesses in the Informal Economy: An Institutional Asymmetry Explanation. Journal of Small Business and Enterprise Development 23: 3–24. [Google Scholar] [CrossRef]
  41. Williams, Colin C., and Ioana A. Horodnic. 2017. Regulating the Sharing Economy to Prevent the Growth of the Informal Sector in the Hospitality Industry. International Journal of Contemporary Hospitality Management 29: 2261–78. [Google Scholar] [CrossRef]
  42. Williams, Colin C., and Youssef Youssef. 2014. Classifying Latin American Economies: A Degree of Informalisation Approach. International Journal of Business Administration 5: 73–85. [Google Scholar] [CrossRef] [Green Version]
  43. Woodcock, Jamie, and Mark Graham. 2020. The Gig Economy: A Critical Introduction. Cambridge: Polity Press. [Google Scholar]
Figure 1. US Participation rates of EIWA by Race/Ethnicity.
Admsci 11 00023 g001
Table 1. Use of and Participation in the Sharing Economy.
Panel A: Use of the Sharing EconomyLatinos (%)US (%)
Have used a ride-hailing app1815
Have used a home-sharing app911
Bought used items online (e.g., eBay, Craigslist)4850
Bought handmade goods online (e.g., Etsy)2022
Hired someone online for a task (e.g., TaskRabbit, Fiverr, Amazon Mechanical Turk)54
Panel B: Earned Income Participating in the Digital EconomyLatinos (%)US (%)
Online gig platforms118
Online sellers (used/second hand goods, handmade items, consumer goods, other)1618
Source: Aaron Smith (2016a, 2016b).
Table 2. EIWA Participation Rates by Race/Ethnicity.
HispanicWhiteBlackOther * Total
EIWA Participation
Yes %37.835.135.940.736.0
No %62.264.964.159.364.0
N103245198025456898
Cross-tabulation: Pearson Chi-square = 8.339, p = 0.040.
Source: EIWA Survey, fall 2015. * Denotes: (a) Other, non-Hispanic; (b) 2 or more races, non-Hispanic.
Table 3. EIWA Demographic Statistics for Hispanics and All Respondents.
VariableHispanic
EIWA Participant
Hispanic
Non-EIWA Participant
All Respondents
Mean Age (std. dev.)39.6 (16.0)43.8 (16.0)42.2 (16.1)
Gender %
 Male37.162.950.8
 Female38.461.649.2
Education %
 Less than High School45.954.122.6
 High School35.864.230.7
 Some College35.864.230.0
 BA/BS or Higher33.966.116.8
Mean Household Size (std. dev.)3.3 (1.8)3.1 (1.6)3.2 (1.7)
Civil Status %
 Married/Living with Partner33.566.550.8
 Widowed34.165.94.0
 Divorced/Separated42.058.015.6
 Single, Never Married43.356.729.6
Housing Type %
 Detached 1-Family Home37.462.661.9
 Attached 1-Family Home (to one or more houses)44.056.07.3
 Apartment36.563.525.2
 Mobile Home44.255.85.0
 Boat, RV, Van0.0100.00.6
Internet Access at Home %
 Yes40.859.277.2
 No27.572.522.8
Residence (Urban/Rural) %
 Urban37.162.993.5
 Rural47.852.26.5
Residence (Ownership) %
 Owned/Purchasing34.965.157.3
 Rented41.758.338.1
 Occupied, No Rent41.758.34.6
Residence (US Location) %
 Northeast30.669.415.5
 Midwest42.058.07.9
 South40.659.437.7
 West37.162.939.0
Employment Status %
 Working
 Wage and Salaried33.766.353.7
 Self-employed41.059.05.9
 Not Working
 Temporarily Laid-off40.759.32.5
 Looking for Work54.145.98.2
 Retired31.368.79.5
 Disabled44.755.39.1
 Other43.956.111.0
Annual Household Income %
 Under USD 15,00034.865.215.4
 USD 15,000 to USD 34,99940.759.319.2
 USD 35,000 to USD 49,99942.457.613.5
 USD 50,000 to USD 74,99933.266.819.9
 USD 75,000 to USD 99,99932.967.114.7
 Over USD 100,00043.057.017.3
N3906421032
Source: EIWA Survey, fall 2015. Note: Italics signify statistical difference between participants and non-participants at the p < 0.10 level.
Table 4. EIWA by Category for Hispanics and Other Racial/Ethnic Groups.
Percent Participating
HispanicWhiteBlackOther *
Personal Services
 Babysitting, Child Care, Dog Walking, House Sitting7.95.19.27.2
 Disabled Adult, Elder Care Services4.43.37.24.6
 House Cleaning, House Painting, Yard Work, Landscaping, Property Maintenance Work13.48.99.19.5
 Other Personal Serves, Picking up Dry Cleaning, Helping People Move, Running Errands, Booking Travel6.34.37.35.3
Subtotal of Any Personal Services21.715.219.517.1
Online and Online Sharing Economy
 Completing Online Tasks through websites (e.g., Amazon Services, Mechanical Turk, Fiverr, Task Rabbit) and other tasks such as Editing Documents, Reviewing Resumes, Writing Songs, Creating Graphic Designs, Rating Pictures, Posting Videos, Blog Posts, etc.4.93.76.79.2
 Renting Out Property (e.g., your car, your place of residence, or other items you own) through websites, newspaper ads, flyers3.93.33.29.0
 Selling New/Used Goods, Handcrafts, etc. Online (e.g., through eBay, Craigslist, or other websites)13.211.97.812.1
Other Online Paid Activities6.67.06.88.1
Subtotal of Any Online and Online Sharing Economy22.221.218.627.8
Selling Goods Offline
 Selling goods (such as food, handcrafts, etc.) or services at flea markets, swap meets, garage sales, mobile vans/trucks, stalls/kiosks, or other temporary physical outlets/locations6.16.23.56.6
 Selling used goods (such as clothes, wedding dresses, handcrafts, etc.) at consignment shops or thrift stores3.15.33.77.3
 Other paid activities2.42.72.93.5
Subtotal of Selling Any Goods Offline10.311.98.813.4
N10324519802545
Source: EIWA Survey, fall 2015. * Denotes: (a) Other, non-Hispanic; (b) 2 or more races, non-Hispanic. Note: Italics signify statistical difference between participants and non-participants at the p < 0.10 level.
Table 5. Specific Online EIWA for Hispanics and Other Racial/Ethnic Groups.
Percent Participating
HispanicWhiteBlackOther *
Earned money over the last 6 months with…
 Airbnb1.11.00.73.2
 Amazon Mechanical Turk2.12.23.56.4
 Care.com1.40.90.72.3
 Craigslist17.916.46.013.6
 eBay13.015.012.712.6
 Etsy3.31.80.03.2
 Fiverr2.80.10.32.3
 Freelancer.com2.30.60.34.5
 Uber4.41.30.35.5
 Lyft2.90.61.12.7
 Sittercity2.50.30.72.3
 Task Rabbit2.80.40.71.8
 Upwork2.80.90.70.5
 Other websites5.34.44.27.2
N3901580287222
Source: EIWA Survey, fall 2015. * Denotes: (a) Other, non-Hispanic; (b) 2 or more races, non-Hispanic. Note: Italics signify statistical difference between participants and non-participants at the p < 0.10 level.
Table 6. EIWA and Hours Worked Usually Spent on Paid Work Activities or Side Jobs, Other than Primary Job for Hispanics and Other Racial/Ethnic Groups Over Last 6 Months.
Panel A: Hispanics
Annual Household Income Mean Monthly Hours Worked (std. dev.)
 Under USD 15,0005.8 (10.7)
 USD 15,000 to USD 34,99920.4 (67.2)
 USD 35,000 to USD 49,99916.8 (34.7)
 USD 50,000 to USD 74,9999.6 (27.6)
 USD 75,000 to USD 99,99929.7 (53.3)
 Over USD 100,0006.1 (14.4)
All (n = 390)14.3 (41.4)
Comparison of Means, ANOVA: F = 3.115, p = 0.009
Panel B: Whites
Annual Household Income Mean Monthly Hours Worked (std. dev.)
 Under USD 15,00017.6 (46.4)
 USD 15,000 to USD 34,99914.3 (42.2)
 USD 35,000 to USD 49,99915.4 (37.5)
 USD 50,000 to USD 74,99912.5 (28.8)
 USD 75,000 to USD 99,99910.3 (18.6)
 Over USD 100,0009.5 (22.7)
All (n = 1586)12.2 (31.0)
Comparison of Means, ANOVA: F = 2.268, p = 0.046
Panel C: Blacks
Annual Household Income Mean Monthly Hours Worked (std. dev.)
 Under USD 15,00022.6 (57.3)
 USD 15,000 to USD 34,99917.9 (49.3)
 USD 35,000 to USD 49,99929.3 (60.3)
 USD 50,000 to USD 74,99913.2 (27.8)
 USD 75,000 to USD 99,9991.0 (2.2)
 Over USD 100,00019.3 (32.2)
All (n = 288)18.3 (44.3)
Comparison of Means, ANOVA: F = 1.296, p = 0.266
Panel D: Other *
Annual Household Income Mean Monthly Hours Worked (std. dev.)
 Under USD 15,0005.2 (14.2)
 USD 15,000 to USD 34,99919.8 (35.9)
 USD 35,000 to USD 49,99910.3 (17.1)
 USD 50,000 to USD 74,99913.5 (23.6)
 USD 75,000 to USD 99,9996.3 (15.0)
 Over USD 100,00016.0 (31.8)
All (n = 222)13.3 (27.2)
Comparison of Means, ANOVA: F = 1.331, p = 0.252
Source: EIWA Survey, fall 2015. * Denotes: (a) Other, non-Hispanic; (b) 2 or more races, non-Hispanic.
Table 7. Stated Reasons (Rationale) for Engaging in EIWA for Hispanics.
Stated Reason (Rationale)All That Apply (%)Main Reason (%)
To earn money as a primary source of income26.923.2
To earn extra money on top of pay from a current job, retirement, pension, disability, or other regular source of income28.924.5
To earn extra money to help family members20.516.4
To maintain existing job-related skills1.70.2
To acquire new job-related skills8.83.9
To network/meet people3.61.2
Just for fun (as a hobby)22.916.8
Other13.013.8
N390355
Source: EIWA Survey, fall 2015.
Table 8. Percentage of Annual Household Income Usually Received from Paid Work Activities or Side Jobs via EIWA for Hispanics.
Annual Household Income % of Income (std. dev.)Potential Range (USD )
Under USD 15,00013.8 (24.6)0–2070
USD 15,000 to USD 34,99922.0 (36.5)3300–7700
USD 35,000 to USD 49,99910.1 (20.8)3535–5050
USD 50,000 to USD 74,99911.4 (24.6)5700–8550
USD 75,000 to USD 99,99925.0 (37.1)18,750–25,000
Over USD 100,0005.2 (15.8)5200 and higher
All14.3 (28.3)--
Comparison of Means: ANOVA, F = 4.457, p = 0.001
Source: EIWA Survey, fall 2015.
Table 9. Household Income and Future EIWA for Hispanics.
Six Months from Now, Do You Expect to Devote More, the Same, or Less Time to Paid Work Activities or Side Jobs Other than Your Primary Job Compared to Today?
Annual Household IncomeMore (%)Less (%)Same (%)
Under USD 15,00014.536.449.1
USD 15,000 to USD 34,99922.521.356.3
USD 35,000 to USD 49,99925.919.055.2
USD 50,000 to USD 74,99929.59.860.7
USD 75,000 to USD 99,99930.040.030.0
Over USD 100,0009.123.467.5
All21.324.154.6
Cross-tabulation, Chi-Square = 34.293, p = 0.000
Source: EIWA Survey, fall 2015.
Table 10. Household Income and Importance of EIWA for Hispanics.
Panel AOver the Last 6 Months, to What Extent Have EIWA Helped You Offset Any Negative Effects of Unemployment Spells, Loss of Working Hours, Loss of Benefits, or Frozen Wages in a Formal Job?
Annual Household IncomeVery Much (%)Somewhat (%)Not at All (%)Does Not Apply (%)
Under USD 15,00010.925.525.538.2
USD 15,000 to USD 34,9997.624.124.144.3
USD 35,000 to USD 49,9990.027.332.740.0
USD 50,000 to USD 74,9996.218.540.035.4
USD 75,000 to USD 99,9994.022.054.020.0
Over USD 100,0005.114.126.953.8
All5.821.532.740.1
Cross-tabulation, Chi-Square = 31.228, p = 0.008
Panel BOver the Past 6 Months, to What Extent Has the Money Earned from EIWA Been a Significant Source of Household Income?
Annual Household IncomeVery Much (%)Somewhat (%)Not at All (%)Does Not Apply (%)
Under USD 15,0007.329.132.730.9
USD 15,000 to USD 34,9996.322.535.036.3
USD 35,000 to USD 49,9995.321.135.138.6
USD 50,000 to USD 74,9990.023.054.123.0
USD 75,000 to USD 99,9994.030.044.022.0
Over USD 100,0000.017.148.734.2
All3.723.241.731.4
Cross-tabulation, Chi-Square = 22.193, p = 0.103
Panel COver the Past 6 Months, to What Extent Has the Money Earned from EIWA Been a Regular/Consistent Source of Household Income?
Annual Household IncomeVery Much (%)Somewhat(%)Not at All(%)Does Not Apply (%)
Under USD 15,00018.220.029.132.7
USD 15,000 to USD 34,9996.325.035.033.8
USD 35,000 to USD 49,9991.822.843.931.6
USD 50,000 to USD 74,9990.022.449.328.4
USD 75,000 to USD 99,9993.927.554.913.7
Over USD 100,0002.615.646.835.1
All5.222.042.930.0
Cross-tabulation, Chi-Square = 38.689, p = 0.001
Source: EIWA Survey, fall 2015.
Table 11. Logistic Regression of Hispanic EIWA (EIWA Participants = 1).
VariableβS.E.WaldSig.Exp(β)
Constant−0.8220.4822.9010.089 *0.440
Age −0.0230.00612.2710.000 ***0.978
Gender (Female = 1)−0.0360.1450.0600.8060.965
Education 5.6930.128
 Less than High School0.4940.2454.0760.043 **1.639
 High School0.0900.2190.1710.6791.095
 Some College0.0760.2160.1240.7251.079
Household Size−0.0060.0460.0190.8920.994
Civil Status 9.1650.027 *
 Widowed0.1630.3940.1710.6791.177
 Divorced/Separated0.6360.2129.0220.003 ***1.889
 Single, Never Married0.1730.1850.8740.3501.188
Housing Type 4.4910.213
 Attached 1-Family Home 0.4410.2752.5810.1081.555
 Apartment−0.0360.2140.0290.8650.964
 Mobile Home0.4230.3311.6290.2021.526
Internet Access at Home (Yes = 1)−0.5760.2018.2440.004 ***0.562
Urban Residence0.4010.2851.9740.1601.493
Residence Ownership Type 7.1420.028 **
 Rented0.4460.1835.9490.015 **1.562
 Occupied, No Rent0.5870.3472.8560.091 *1.798
US Regional Residence Location 10.8060.013 **
 Northeast−0.3590.2272.5100.1130.698
 Midwest0.4770.2653.2460.072 *1.612
 South0.3040.1633.4940.062 *1.355
Employment Status 15.6370.016 **
 Working—Self-Employed0.5080.3012.8410.092 *1.662
 Not Working—Temporarily Laid-off0.4930.4471.2140.2711.636
 Not Working—Looking for Work0.7830.2609.0780.003 ***2.189
 Not Working—Retired0.6660.3054.7800.029 **1.947
 Not Working—Disabled0.6030.2744.8380.028 **1.827
 Not Working—Other0.3420.2302.2070.1371.407
Annual Household Income 13.4890.019 **
 USD 15,000 to USD 34,9990.4790.24730.7520.053 *1.614
 USD 35,000 to USD 49,9990.6050.27240.9540.026 **1.832
 USD 50,000 to USD 74,9990.3150.26310.4340.2311.370
 USD 75,000 to USD 99,9990.4150.28620.1020.1471.514
 Over USD 100,0000.9380.284100.9300.001 ***2.554
Model Statistics
−2 Log Likelihood = 1270.887, Cox and Snell R Square = 0.086; Nagelkerke R Square = 0.117; p = 0.000
Classification Table (Hit Ratio) Percentage Correct: No = 87.6; Yes = 28.9; Overall = 65.3
Reference categories: Gender = Female; Education = BA/BS or Higher; Civil Status = Married/Living with Partner; Housing Type = Detached 1-Family House (boat, van, omitted); Internet Access at Home = Yes; Urban Residence = Urban; Residence Ownership = Owned/Purchasing; US Residence Location = West; Employment Status = Working Wage and Salaried; Annual Household Income = Under USD 15,000. Note: ***, **, * signify statistical significance at the 0.01, 0.05, and 0.10 levels.
Table 12. Logistic Regression of Hispanic EIWA (EIWA Participants = 1)—Summary Results.
VariableModel 1
All EIWA
Model 2
Personal Services
Model 3
Online and Sharing Economy
Model 4
Selling Offline Goods
Constant
Age
Gender (Female = 1)
 Education
 Less than High School++ +
 High School
 Some College
Household Size +
Civil Status
 Widowed
 Divorced/Separated+ +
 Single, Never Married +
Housing Type
 Attached 1-Family Home
 Apartment
 Mobile Home +
Internet Access at Home (Yes = 1)
Urban Residence +
Residence Ownership Type
 Rented+++
 Occupied, No Rent+ ++
US Regional Residence Location
 Northeast
 Midwest++ +
 South+ +
Employment Status
 Working—Self-Employed+++
 Not Working—Temporarily Laid-off +
 Not Working—Looking for Work++
 Not Working—Retired+ +
 Not Working—Disabled+
 Not Working—Other +
Annual Household Income
 USD 15,000 to USD 34,999++
 USD 35,000 to USD 49,999++
 USD 50,000 to USD 74,999
 USD 75,000 to USD 99,999 +
 Over USD 100,000+++
Reference categories: Gender = Female; Education = BA/BS or Higher; Civil Status = Married/Living with Partner; Housing Type = Detached 1-Family House (boat, van, omitted); Internet Access at Home = Yes; Urban Residence = Urban; Residence Ownership = Owned/Purchasing; US Residence Location = West; Employment Status = Working Wage and Salaried; Annual Household Income = Under USD 15,000. Note: + more likely; − less likely.
Publisher’s Note: MDPI stays neutral with regard to jurisdictional claims in published maps and institutional affiliations.

