Article

Predicting the Impact of Utility Lighting Rebate Programs on Promoting Industrial Energy Efficiency: A Machine Learning Approach

1
Ameresco, 8825 Stanford Blvd, Columbia, MD 21045, USA
2
Department of Mechanical Engineering, University of Dayton, Dayton, OH 45409, USA
*
Author to whom correspondence should be addressed.
Environments 2022, 9(8), 100; https://doi.org/10.3390/environments9080100
Submission received: 20 June 2022 / Revised: 18 July 2022 / Accepted: 30 July 2022 / Published: 6 August 2022

Abstract

:
Implementation costs are a major factor in manufacturers’ decisions to invest in energy-efficient technologies. Emerging technologies in lighting systems, however, typically require small investment costs and offer short, simple payback periods, due, in part, to federal, state, and utility incentive programs. Recently, however, certain state and federal mandates have reduced the support for and efficacy of electricity utility incentivizing programs. To determine the impact of such support programs, this study examined historical data regarding lighting retrofit savings, implementation costs, and utility rebates gathered from 13 years of industrial energy audits by a U.S. Department of Energy Industrial Assessment Center in a midwestern state. It uses a machine learning approach to evaluate the industrial energy and cost-saving opportunities that may have been lost due to decisions attributable to legislative mandates, utility policies, and manufacturers’ calculations and to evaluate the potential effect of lighting rebates on manufacturers’ decisions to implement industrial energy-efficient lighting retrofits. The results indicate that the decision not to implement lighting energy efficiency recommendations resulted in a loss of more than USD800,000 in potential rebates by industries during the study period and that the implementation of lighting energy assessment recommendations could have increased by about 50% if electric utility rebates had been available. These findings can help industries evaluate the benefits of implementing lighting efficiency improvements, and help utilities determine feasible lighting retrofit rebate values for incentivizing such changes by the industries they serve.

1. Introduction

The United States’ industrial sector is its largest consumer of end-use electricity, with about 1.4% of this total being consumed by industrial lighting systems [1,2]. Because new and emerging lighting technologies can significantly reduce energy consumption by industrial lighting systems, numerous federal and state entities have instituted incentive programs to encourage industries to upgrade and manage their energy usage. At the federal level, the U.S. Department of Energy (DOE) has developed multiple energy efficiency certifications and various programs to assist manufacturing industries in achieving their energy reduction goals. These include ISO-50001 certification, which industries can earn by implementing energy management systems to reduce various areas of energy waste and become more energy efficient [3,4]. The DOE also sponsors the Industrial Assessment Center (IAC), which provides small and medium-sized manufacturers (SMEs) with no-cost energy assessments of multiple energy systems and specific assessment recommendations (ARs) that offer annual cost savings that average more than USD130,000 per facility [5,6]. Among these are recommendations regarding lighting systems, as efficient management of industrial lights can reduce energy and improve personnel performance [7]. Upgrading current lighting to more efficient lamps and ballasts is the most common AR proposed for lighting systems, as more energy-efficient lamps, such as light-emitting diodes (LEDs), have been shown to consume less energy, last longer, and be more aesthetically pleasing than compact fluorescents and incandescent bulbs [8,9]. Another popular method for reducing energy consumption is installing smart controls, which have been implemented in about 20% of the commercial sector [10,11].
In the United States, utility rebate programs became more mainstream with the American Reinvestment and Recovery Act of 2009 (ARRA). This fiscal stimulus program made billions of dollars available to state and local utility companies to institute energy efficiency and renewable energy programs [12]. At the state and local levels, utility providers have offered incentives to assist manufacturers in making energy-efficient upgrades that have significantly influenced their energy cost-savings strategies. In a study of 20 state rebate programs, Hoffman et al. found that the average cost of saved electricity, mostly in the residential sector, was about 4.6 cents per kWh, thanks to the rebate programs [13]. Ohio took advantage of the ARRA by requiring the state’s utility companies to reduce their electricity sales by 0.3% annually and by a total of 2% by 2019. The legislature passed a Clean Energy Law (SB221) in 2008 that mandated that utilities reduce their customer’s energy usage by 22% from 2008 levels [14], which led utilities to offer rebates to manufacturers for installing energy-efficient lighting and other systems. After the 2019 deadline and the passage of House Bill 6, however, Ohio backtracked on its energy efficiency goals and allowed utilities to end their energy efficiency rebate programs [15]. All available state level policies and incentives can be found in the DSIRE [16]
This article examined the impact of those utility rebate programs on manufacturers’ implementation of energy-efficient lighting retrofits by applying a machine learning (ML) algorithm to lighting data collected from industrial energy audits performed by the University of Dayton Industrial Assessment Center between 2008 and 2020. We aimed to develop a supervised machine learning model to create a general predictor for industrial energy efficiency rebate rates for lighting systems. In addition, we aimed to allow industries to evaluate the benefits of implementing lighting efficiency improvements and allow utilities to determine feasible lighting retrofit rebate values for incentivizing such changes.

2. Literature Reviews
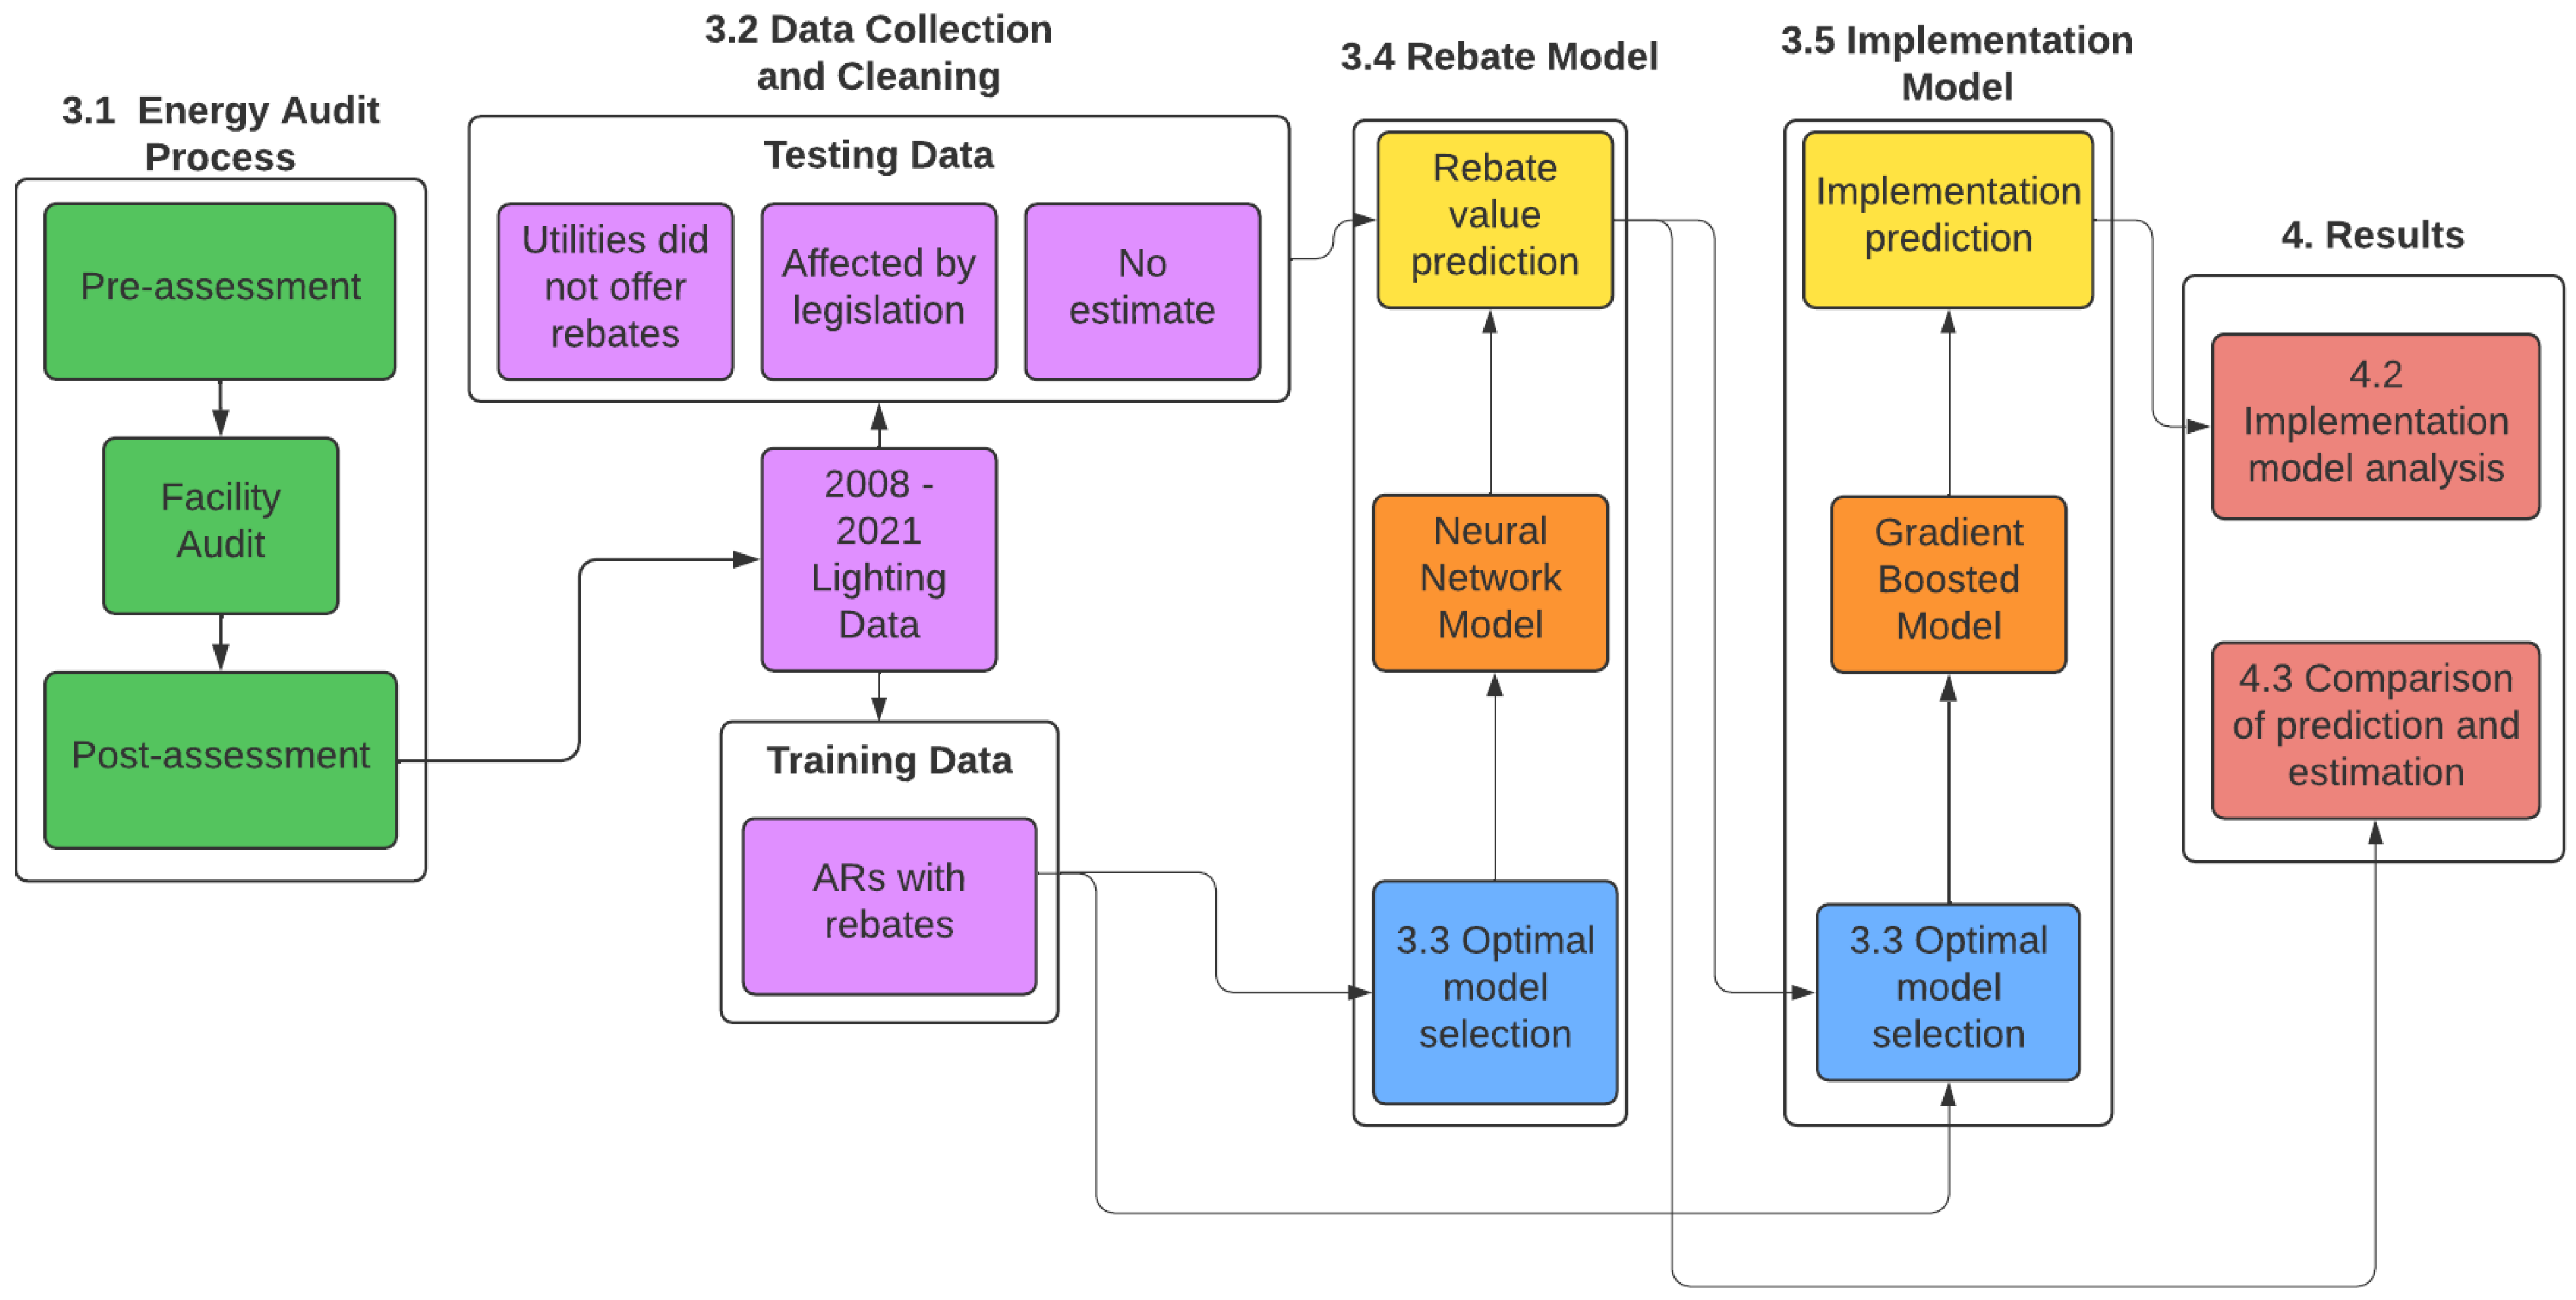
Studies have shown that improving industrial energy efficiency not only provides benefits to the facility but also generates trickle-down impacts on society [17,18,19]. In addition, researchers have shown that consumer behavior and the willingness to pay for energy efficiency increase when a well-designed rebate is provided for various energy-efficient products [20,21,22]. A study found that facilities implementing energy-efficient measures with a utility-provided energy efficiency rebate program benefited the local economy by USD88M and helped offset 466 K tons of emissions over 5 years [23]. However, Galarraga et al. [24] claimed that such a program could generate detrimental impacts such as welfare losses, a rebound effect, and a considerable deficit in the public budget.
Several previous studies have explored the relationship between energy-efficient practices and future energy consumption by applying ML techniques at the macro- and micro-levels [25,26]. For instance, Naji et al. [25] analyzed the likely effectiveness of various incentivizing opportunities for a given community by predicting the energy consumption of houses in that community by using an ML approach. The energy usage of lighting systems in the industrial sector has found ML techniques to be applicable and beneficial [27,28]. ML application is increasingly becoming a useful tool in manufacturing due to its ability to analyze trends in large datasets [29]. One popular model is the Random Forest (RF) model, developed by Breiman [30], which creates multiple uncorrelated decision trees and takes the average predictions of the group. RF models also measure the variable’s importance, allowing for targeted analysis of the key characteristics of the predicted variable [31]. Wang et al. [32] developed an RF model to predict hourly building energy usage based on weather, occupancy, and time data. A generalized linear model (GLM) utilizes a link function to relate the predictor variable with the linear model [33]. Similar to RF models, there have been many studies of different applications of GLM models, including for energy efficiency. GLMs have been used to determine different quantitative and qualitative variables affecting energy efficiency and security in different countries [34,35]. Gradient boosting machines (GBMs) are developed similarly to RF models but sequentially build decision trees based on the previous tree’s error to reduce the error in future trees [36,37]. It has been shown that GBMs can outperform other predictive methods when applied to predict energy consumption for commercial and residential buildings [38,39]. Artificial neural networks (ANNs) attempt to replicate activities such as recognizing patterns and forecasting, which neurons in the human brain can process [40]. The forecasting capabilities of ANNs have served well in predicting the energy consumption behaviors and optimizing energy efficiency options in energy systems [41,42]. When compared, ANNs and RF models have been shown to have similar predictive power in energy applications [43].
Machine learning is frequently used in manufacturing industries to manage and process data from the facility and products to support manufacturing decisions, estimate product costs, and improve manufacturing facility operations [29]. It was found that utilizing machine learning capabilities reduced error and uncertainty by 50% in measurement and verification applications in industry [44]. Similarly, smart manufacturing and predictive manufacturing both combine machine learning, big data, artificial intelligence, and advanced technology to optimize efficiency and productivity while reducing costs and production time [45,46]. Another study was able to accurately predict maintenance system failures by using a Random Forest machine learning model with a high R-squared (R2) value based on real-time data from production line equipment [47].
Although many researchers have adopted ML algorithms to facilitate energy analyses for commercial, industrial, and residential lighting systems, to our knowledge, no research has yet applied the ML approach to assist decision-making by utility companies and energy legislators regarding the incentives provided by energy efficiency rebate programs. To help fill this gap, this study adopted ML algorithms to predict feasible lighting rebate rates and how those rebates could increase the implementation of lighting retrofits and help industrial manufacturing facilities reduce their energy usage and costs.

3. Methodology

The research framework used by this study is shown in Figure 1. First, initial energy audits were performed in three steps: (1) pre-assessments, in which a facility’s energy consumption data were utilized for a baseline analysis; (2) one-day facility audits, in which expert energy engineers identified energy savings opportunities following a system-by-system approach; and (3) post-assessments, in which scientifically rigorous engineering calculations were used to estimate the amount of the potential energy savings, cost savings, and CO2 reductions of various assessment recommendations (ARs). Second, all collected data of industrial lighting systems from audits performed between 2008 and 2021 were classified into two groups: training data and testing data. The training data refer to lighting ARs where lighting rebates were available, whereas all the testing datasets consist of the ARs where the lighting rebates were not available for three reasons: (1) the legislation effect, meaning that the audits were performed after HB6 ended or reduced many utility rebates for industrial energy efficiency; (2) the utility effect, meaning that the local utility never offered such rebates; and (3) the manufacturer effect, meaning that other factors shaped a facility’s decision to not take advantage of the lighting rebates. The third case applied when manufacturers mentioned, during our audit, that they were not interested in applying for the rebate program because of internal reasons. In those cases, rebates were not included in the final report, thus, these data do not belong in the training data. Third, a rebate ML model was built using the training data to predict feasible rebate values for the testing data. After these rebate rates had been calculated, an implementation ML model was constructed to predict the implementation rate of the testing data with the newly predicted rebate values. Ohio utilities had provided rebates mostly on lighting, motors, and HVAC systems. Our historical data indicated that manufacturers tended to apply for lighting rebates more than motor and HVAC rebates. As the ML model validity becomes more feasible when more data are utilized for training, we chose the lighting system instead of other industrial energy systems. The following subsections describe each of these steps in more detail.

3.1. Energy Audit Process

Sponsored by the DOE to perform no-cost energy assessments [48,49,50], the University of Dayton Industrial Assessment Center (UD-IAC) has served the whole Midwest region for 40 years. Its assessments perform analyses of 11 different industrial systems. In addition to lighting, these systems include motors, fluid flow, compressed air, process heating, steam, process cooling, industrial refrigeration, HVAC, combined heat and power, and renewable energy systems.
To analyze the impact of utility rebates on the implementation rates of energy-efficient lighting upgrades, this study collected historical data from all UD-IAC energy assessments conducted between 2008 and 2021. Each lighting AR proposed to a facility typically includes estimates of the energy, cost, and CO2 emissions savings it is likely to provide. Nine months after the initial energy assessment, facilities complete an implementation survey to identify which ARs were implemented. Table 1 provides examples of the various types and kinds of ARs related to lighting systems.
In one example of a lighting AR that involved a utility rebate, we recommended that the facility install occupancy sensors on all its 247 6-lamp T5 high-bay fluorescent fixtures that illuminated the warehouse and manufacturing areas. During our site visit, plant personnel had indicated that lights in the warehouse were turned off after the first shift but many lights in manufacturing areas were left on even when unoccupied. We therefore recommended installing occupancy sensors on all lighting fixtures to turn them off when not needed, resulting in energy, cost, and CO2 emission savings. The audit team counted 45 fixtures in the warehouse area that operated 2200 h per year and 155 fixtures in the manufacturing area that operated 4400 h per year. Table 2 shows these and other properties of the lighting fixtures before the installation of occupancy sensors.
The plant personnel estimated that the occupancy sensors would be able to turn off all the lights about 40% of the time, which would, in turn, decrease energy usage and increase the life of the lights, resulting in reductions in electricity and relamping costs. Market research indicated that occupancy sensors cost an average of USD26 each. Considering a labor cost of USD50 per hour and an installation time of 10 min per sensor, we estimated that the total implementation cost would be USD6867. Because the facility’s electrical utility company offered rebates of USD40 per installed occupancy sensor, the implementation cost would be completely offset at that rebate price, creating an immediate payback.

3.2. Data Collection and Cleaning

Of all the lighting AR types shown in Table 1, data regarding only those eligible for the lighting rebate were collected, eliminating those regarding non-technical lighting ARs such as “turn off lights for certain hours” and “keep lamps and reflectors clean.” Data regarding the remaining five AR types are shown in Table 3.
The training dataset consisted of 203 ARs in which rebate savings were applied for calculating the energy cost savings during the study period. The historical rebate values, eligible lighting technologies, and the ways of applying/receiving rebates are quite different for each manufacturer, depending on the geographical locations of the plants because the rebate policies varied among the 25 different regional utility territories in the studied region [16].
The testing dataset consisted of 104 ARs from which rebate savings were omitted because of three different reasons. Those that fell into the “legislation” group refer to the ARs recommended by audits performed following the phasing out of energy efficiency programs following the passage of HB6 in Ohio. Those falling into the “utility” group included ARs in which the manufacturing facilities’ contracting utility program did not offer lighting rebates, which was more likely in smaller and municipal utilities. ARs falling into the “manufacturer” group were cases in which the rebates were not adopted because the facility did not want to apply for the available utility rebate program. Small and medium-sized manufacturers sometimes want to use a cheaper or less efficient solution for various reasons. Our analysis showed that “install occupancy sensors” and “utilize more efficient lamps” were the two most common ARs that made use of lighting rebates, undoubtedly reflecting that most utility companies provided rebates for purchasing specific materials such as LED light bulbs and occupancy sensors, whereas some utility companies offered rebates based on how much energy a general lighting retrofit would save.

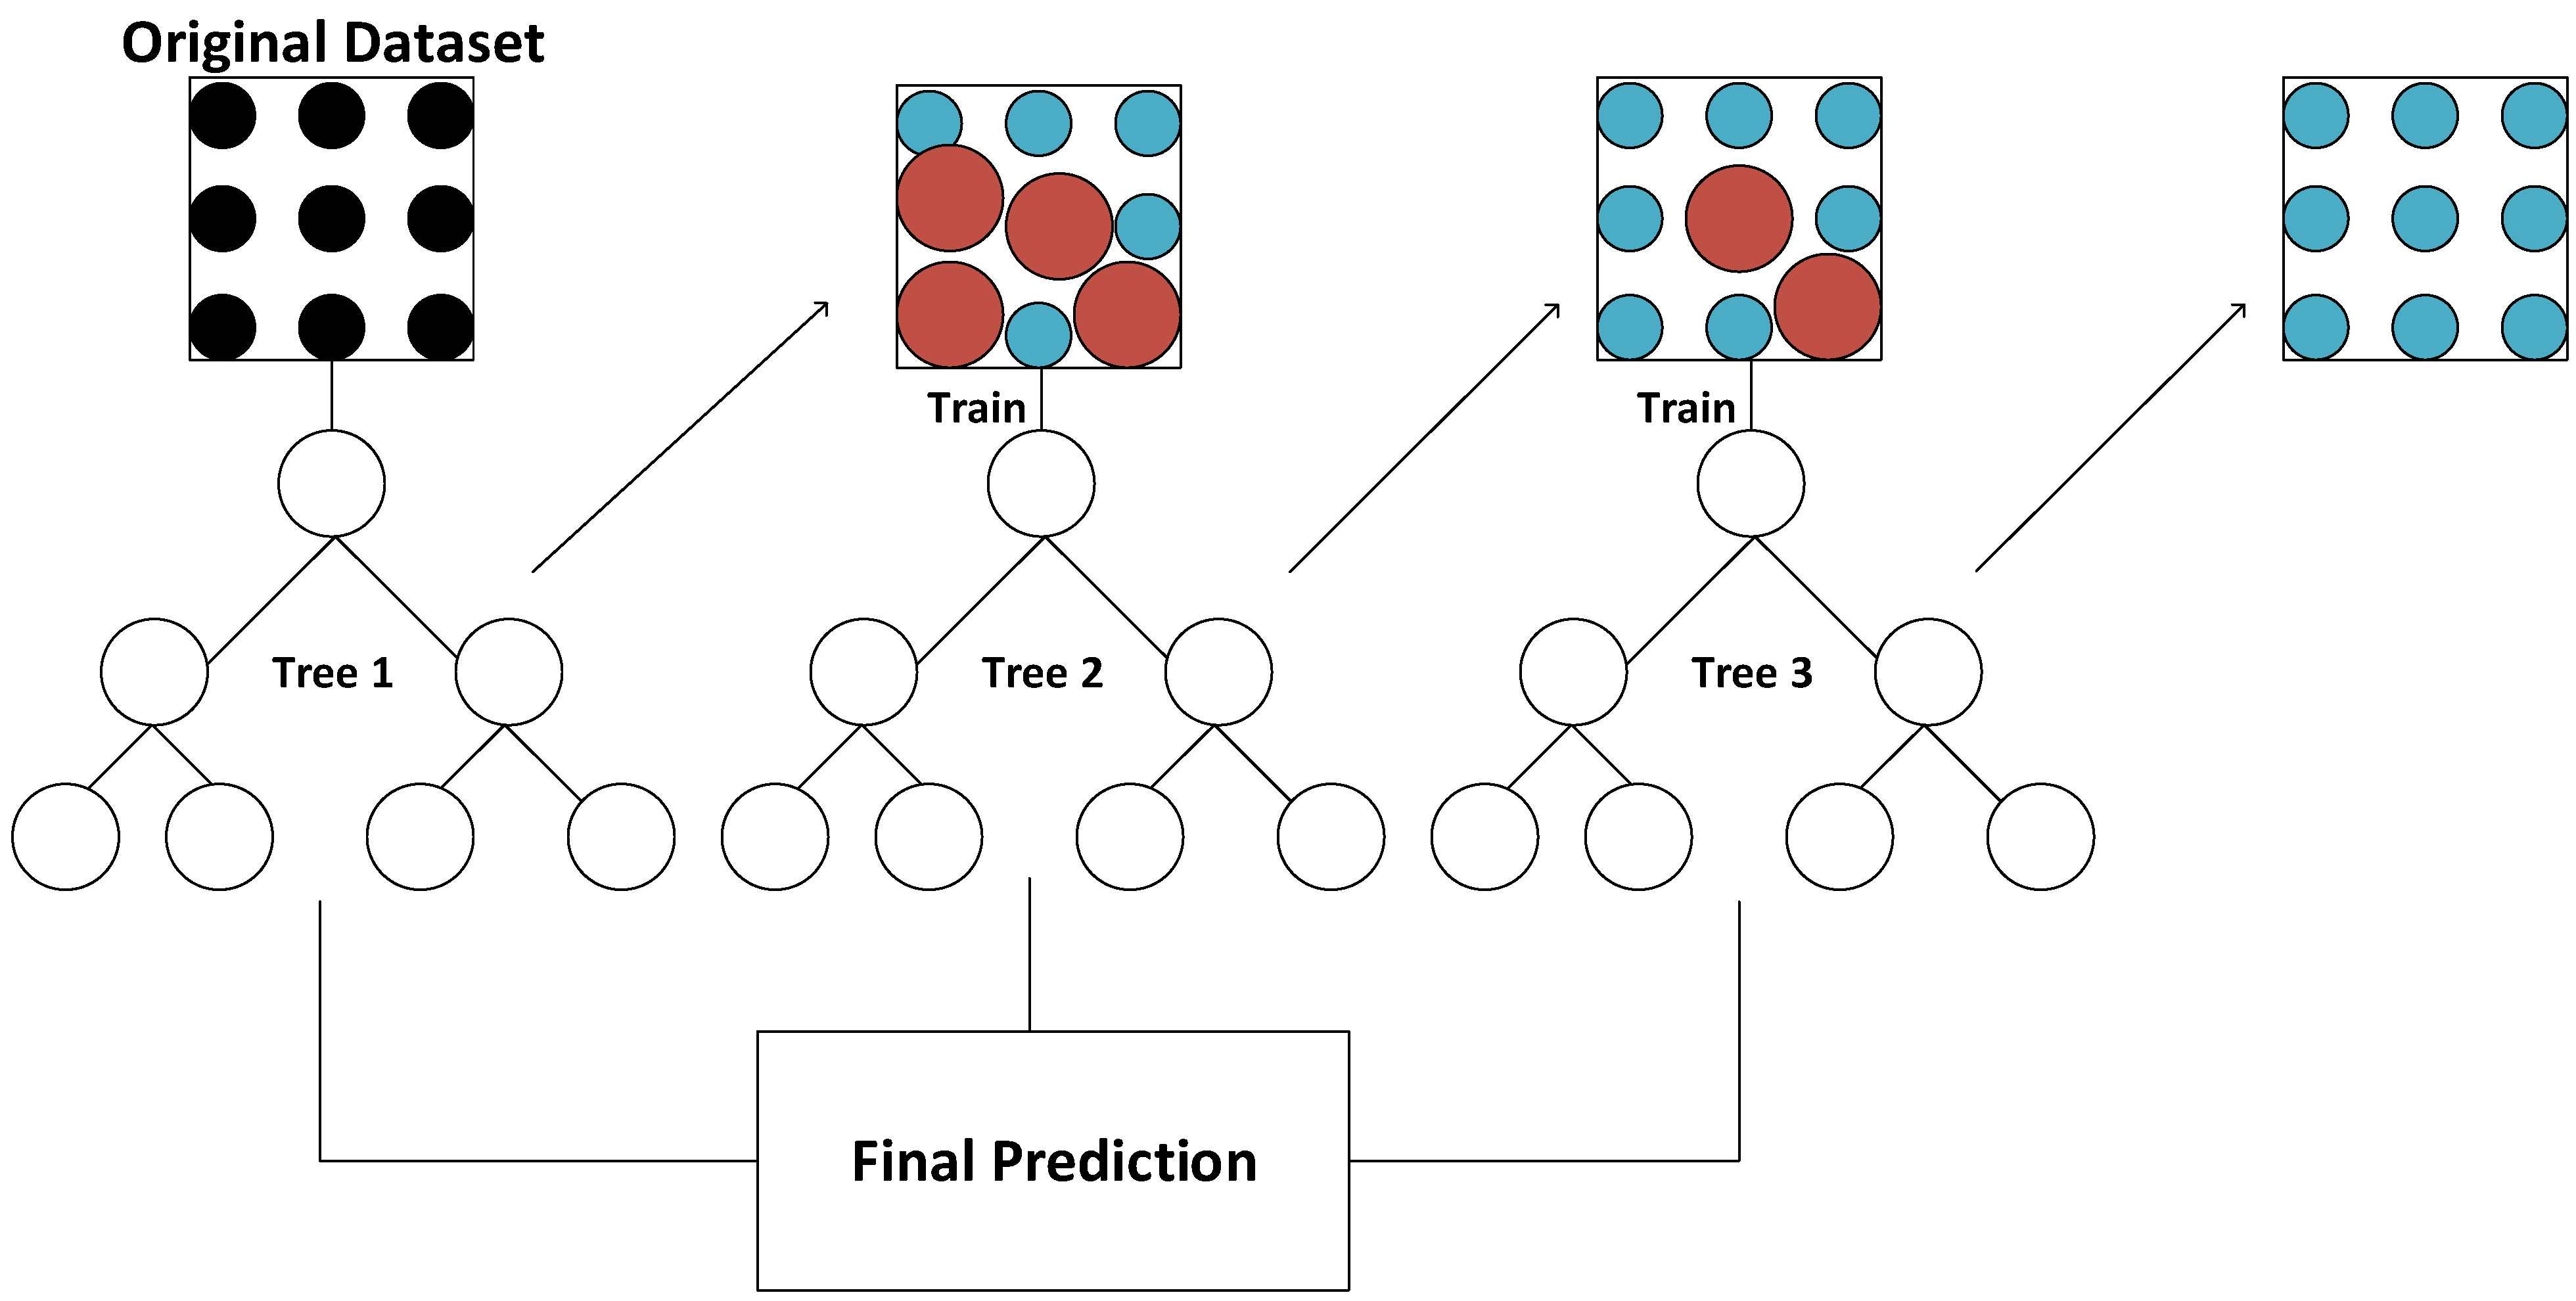
3.3. Optimal Model Selection

The metrics commonly used to determine the accuracy of the model include the coefficient of determination (R2), the mean absolute error (MAE), the mean squared error (MSE), and the root mean squared error (RMSE). The predicted values were compared with the training values, and the R2, MAE, MSE, and RMSE were calculated with Equations (1)–(4). R2 is a value between 0 and 1 that determines how much of the variation in the data can be explained by the model. An R2 of 1 means the model can explain all the variation, and a value of 0 means the model cannot explain any variation. MAE measures the absolute difference between the predicted and the values along the regression line. MSE is the average of the squares of the errors of a regression line. A smaller MSE indicates a smaller error in a regression line and thus a better-performing model. RMSE is the standard deviation of the prediction errors, which shows how close the predictions are to the regression line. It measures the standard deviation of the residuals. The closer the RMSE is to zero, the better the fit of the regressor line.
R 2 = i = 1 n y predict , i y ¯ data 2 i = 1 n y data , i y ¯ data 2
MAE = i = 1 n y predict , i y data n
MSE = i = 1 n y predict , i y data 2 n
RMSE = i = 1 n y predict , i y data 2 n
where y predict , i is the predicted rebate values for assessment recommendation i, y data is the historical rebate values for the assessment recommendation, n is the number of ARs in the dataset, and y ¯ data is the average rebate value.
Table 4 lists the validation metrics for the four types of ML models we compared to help us build the best rebate ML model, as explained in more detail in Section 3.4. As the table shows, the ANN model performed very well, with an almost perfect R2 and very low RMSE and MAE values, indicating the regression line errors. The validation metrics for other models are much less accurate (i.e., the errors indicated by MAE and RMSE increased). Although the GBM model had an equivalent R2 to ANN, the MAE and RMSE were slightly larger, making it a less optimal model for our purposes. The RF and GLM models showed an even poorer fit.
Table 5 compares the validation metrics for the implementation of the ML model, as shown in more detail in Section 3.5. For the purposes of this model, we found that GBM was the most accurate. Whereas the goal of the rebate ML model was to predict a discrete value, the goal of the implementation ML model was to predict enumerators by assigning “yes” and “no” a percentage value and selecting the higher percentage as the prediction. Even though we selected GBM as the most accurate model, the ANN model had a lower RMSE value.

3.4. Rebate ML Model

Figure 2 illustrates how we used ANN to predict the rebate values (output) using multiple input parameters. Before the training and testing data were entered into an ML algorithm, we selected eight technical parameters associated with the lighting ARs to include in our calculations: year, utility provider, type of ARs, number of lights, electricity demand savings, rebate value, total implementation cost, and implementation. These specific features were chosen because the selected training data are not correlated with each other and would not cause multicollinearity, which can occur when multiple variables are linearly correlated with each other and cause statistical insignificance problems. The hidden layer between the input and output layers adds a weight to the inputs and puts them through activation functions as the outputs. Each neuron in the hidden layers (numbered circles) forms the weighted sum of its inputs and passes the resulting value through an activation function. For example, for the first prediction made in the hidden layer, the variable “year” may be weighted higher than the other variables, but the second hidden layer prediction may weigh “utility” higher. This continues for the entirety of the hidden layer, and the output is an aggregation of all the predictions in the hidden layer.

3.5. Implementation ML Model

Although 104 of the suggested testing ARs applied rebate savings opportunities to show facilities how they could save energy costs, the post-audit surveys showed that not all the ARs were chosen to be implemented. To help us better understand why, we built another ML model to capture the implementation patterns of facilities and analyzed the influence of rebates on increasing implementation rates. This model is a binary classification that predicts whether a facility will implement a lighting AR based on the newly predicted rebate values produced from the rebate ML model explained in the previous section. A prediction of “yes” means that the facility implemented the AR, and “no” means that the AR was not implemented. For the reasons discussed above, GBM was shown to be the most accurate model. Figure 3 describes how a GBM model trains each decision tree and creates a prediction. In a GBM model, a decision tree is created for the original dataset, and the predictions from that tree are compiled into a second dataset, where another decision tree is formed. Each decision tree node takes a different subset of features for selecting the best split. This continues for n times sequentially; for example, from the original dataset to the second training dataset, the weighting of incorrect predictions (the size of the red circles) increases, and the outcome is based on the weighted average of the predictions.

4. Results

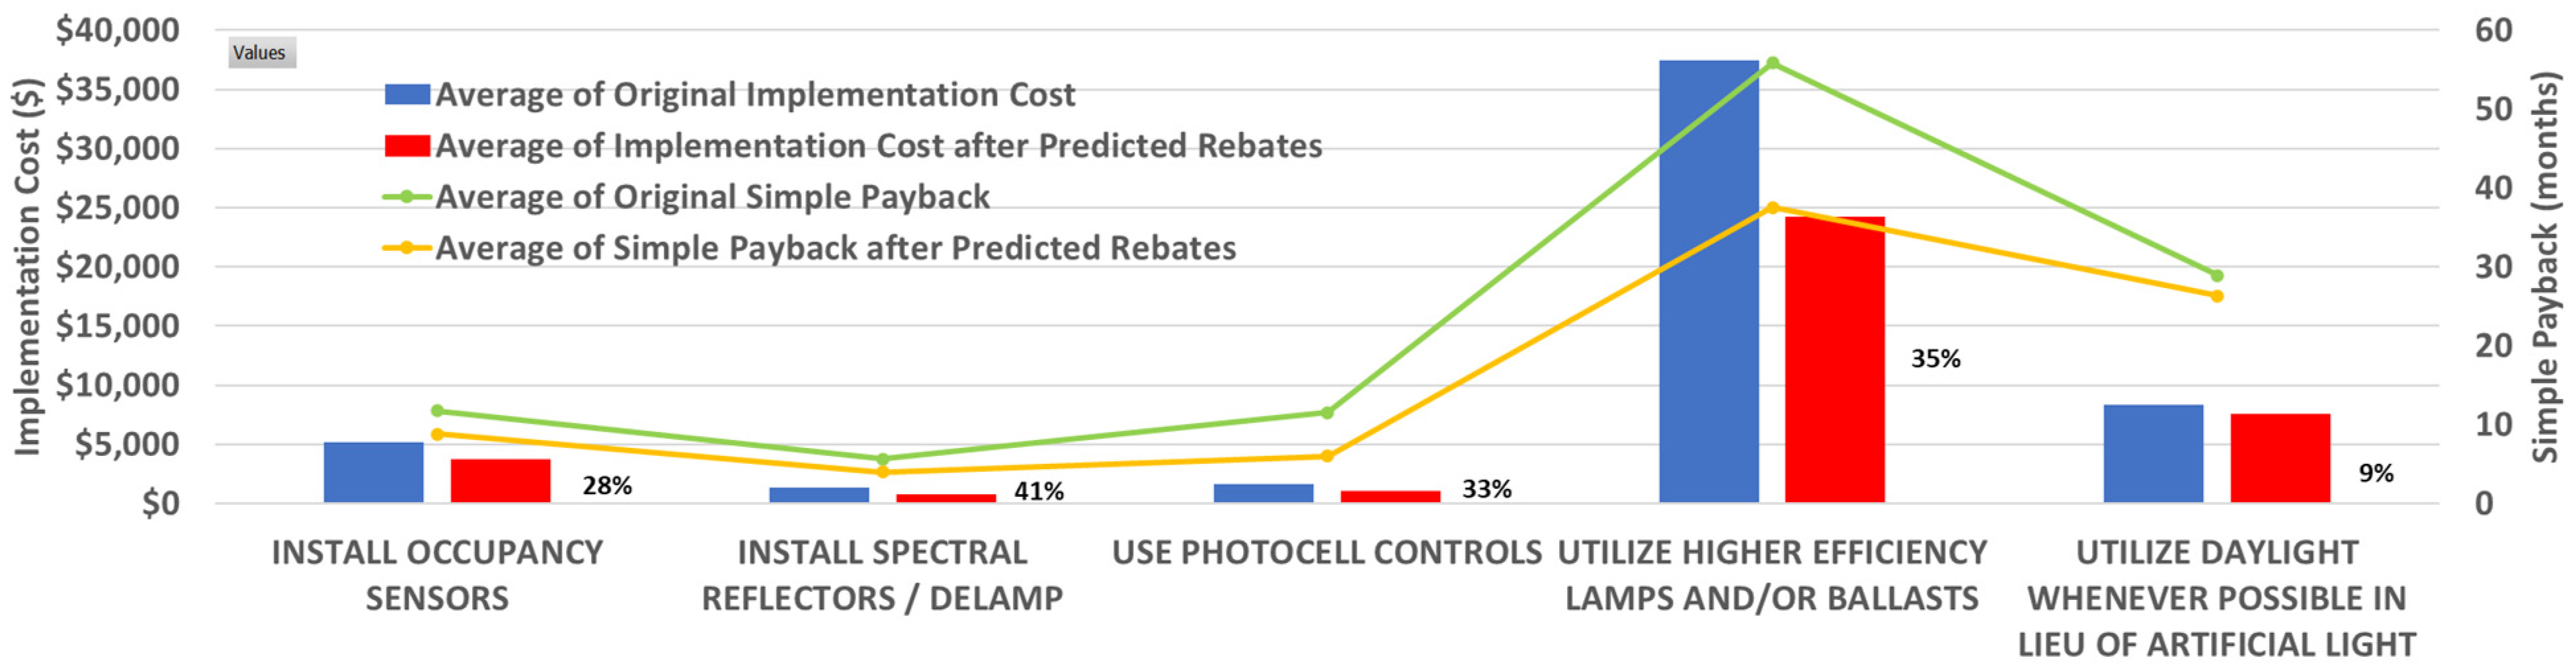
4.1. Results of the Rebate ML Model

The results of the rebate ML model reveal the potential savings offered by rebates that were lost due to the three testing data scenarios described in Section 3.2. These results were also used to calculate the feasible value of rebates that would have been awarded if the AR had been implemented, which is information that future policymakers and utility companies could use to create or reinitiate efficient lighting rebate programs. The model predicted feasible total rebate values for each 104 AR (testing dataset) in USD. One of the main constraints for the model is the range of the total rebate value for each AR. The total rebate value for each AR cannot be less than zero (minimum) and cannot exceed the implementation cost values (maximum). Figure 4 shows the total missed dollar savings caused for each of the three reasons (legislation, utility, manufacturing). The rebate model predicted a total of USD820,397 in missed rebate savings across the 104 lighting ARs in the testing dataset.
Figure 5 compares the total implementation cost and payback periods before and after adding the predicted rebate values to the calculations. The blue and red bars represent the average implementation cost per type of AR with and without rebate savings, respectively. The percentages are the percentage of reduction in the implementation cost. If we consider all ARs, the results show that manufacturing facilities could have reduced their implementation costs by about 34% through these ARs. The orange and green lines reveal how the reduction in implementation costs also helped produce a faster payback for each energy-efficient lighting project, amounting to a reduction of about 30% for all ARs. This information should help facilities feel more confident that their investments in energy-efficient lighting will pay off quickly and increase their cash flow, which could be reinvested in even more energy-efficient practices.
Because eight unique AR variables were inputted to the model, a wide range of rebate values was generated for each AR after running the rebate ML model. Nominal values for each AR type were found to give a general indicator. Equation (5) was used to find the rebate rates for the ARs within the testing dataset.
ε = τ ζ
where ε is the rebate rate per kWh saved, τ is the total rebate value in US dollars, and ζ is the total kWh saved by the implementation. Table 6 shows the nominal rates for each type of lighting AR. “Utilize more efficient lamps and ballasts” saw the largest rebate rates, possibly due to it being the most common AR and the large scale of most of these ARs. These ARs typically include switching almost every light in a facility to a more efficient lamp, so larger rebates are expected to help mitigate these costs.

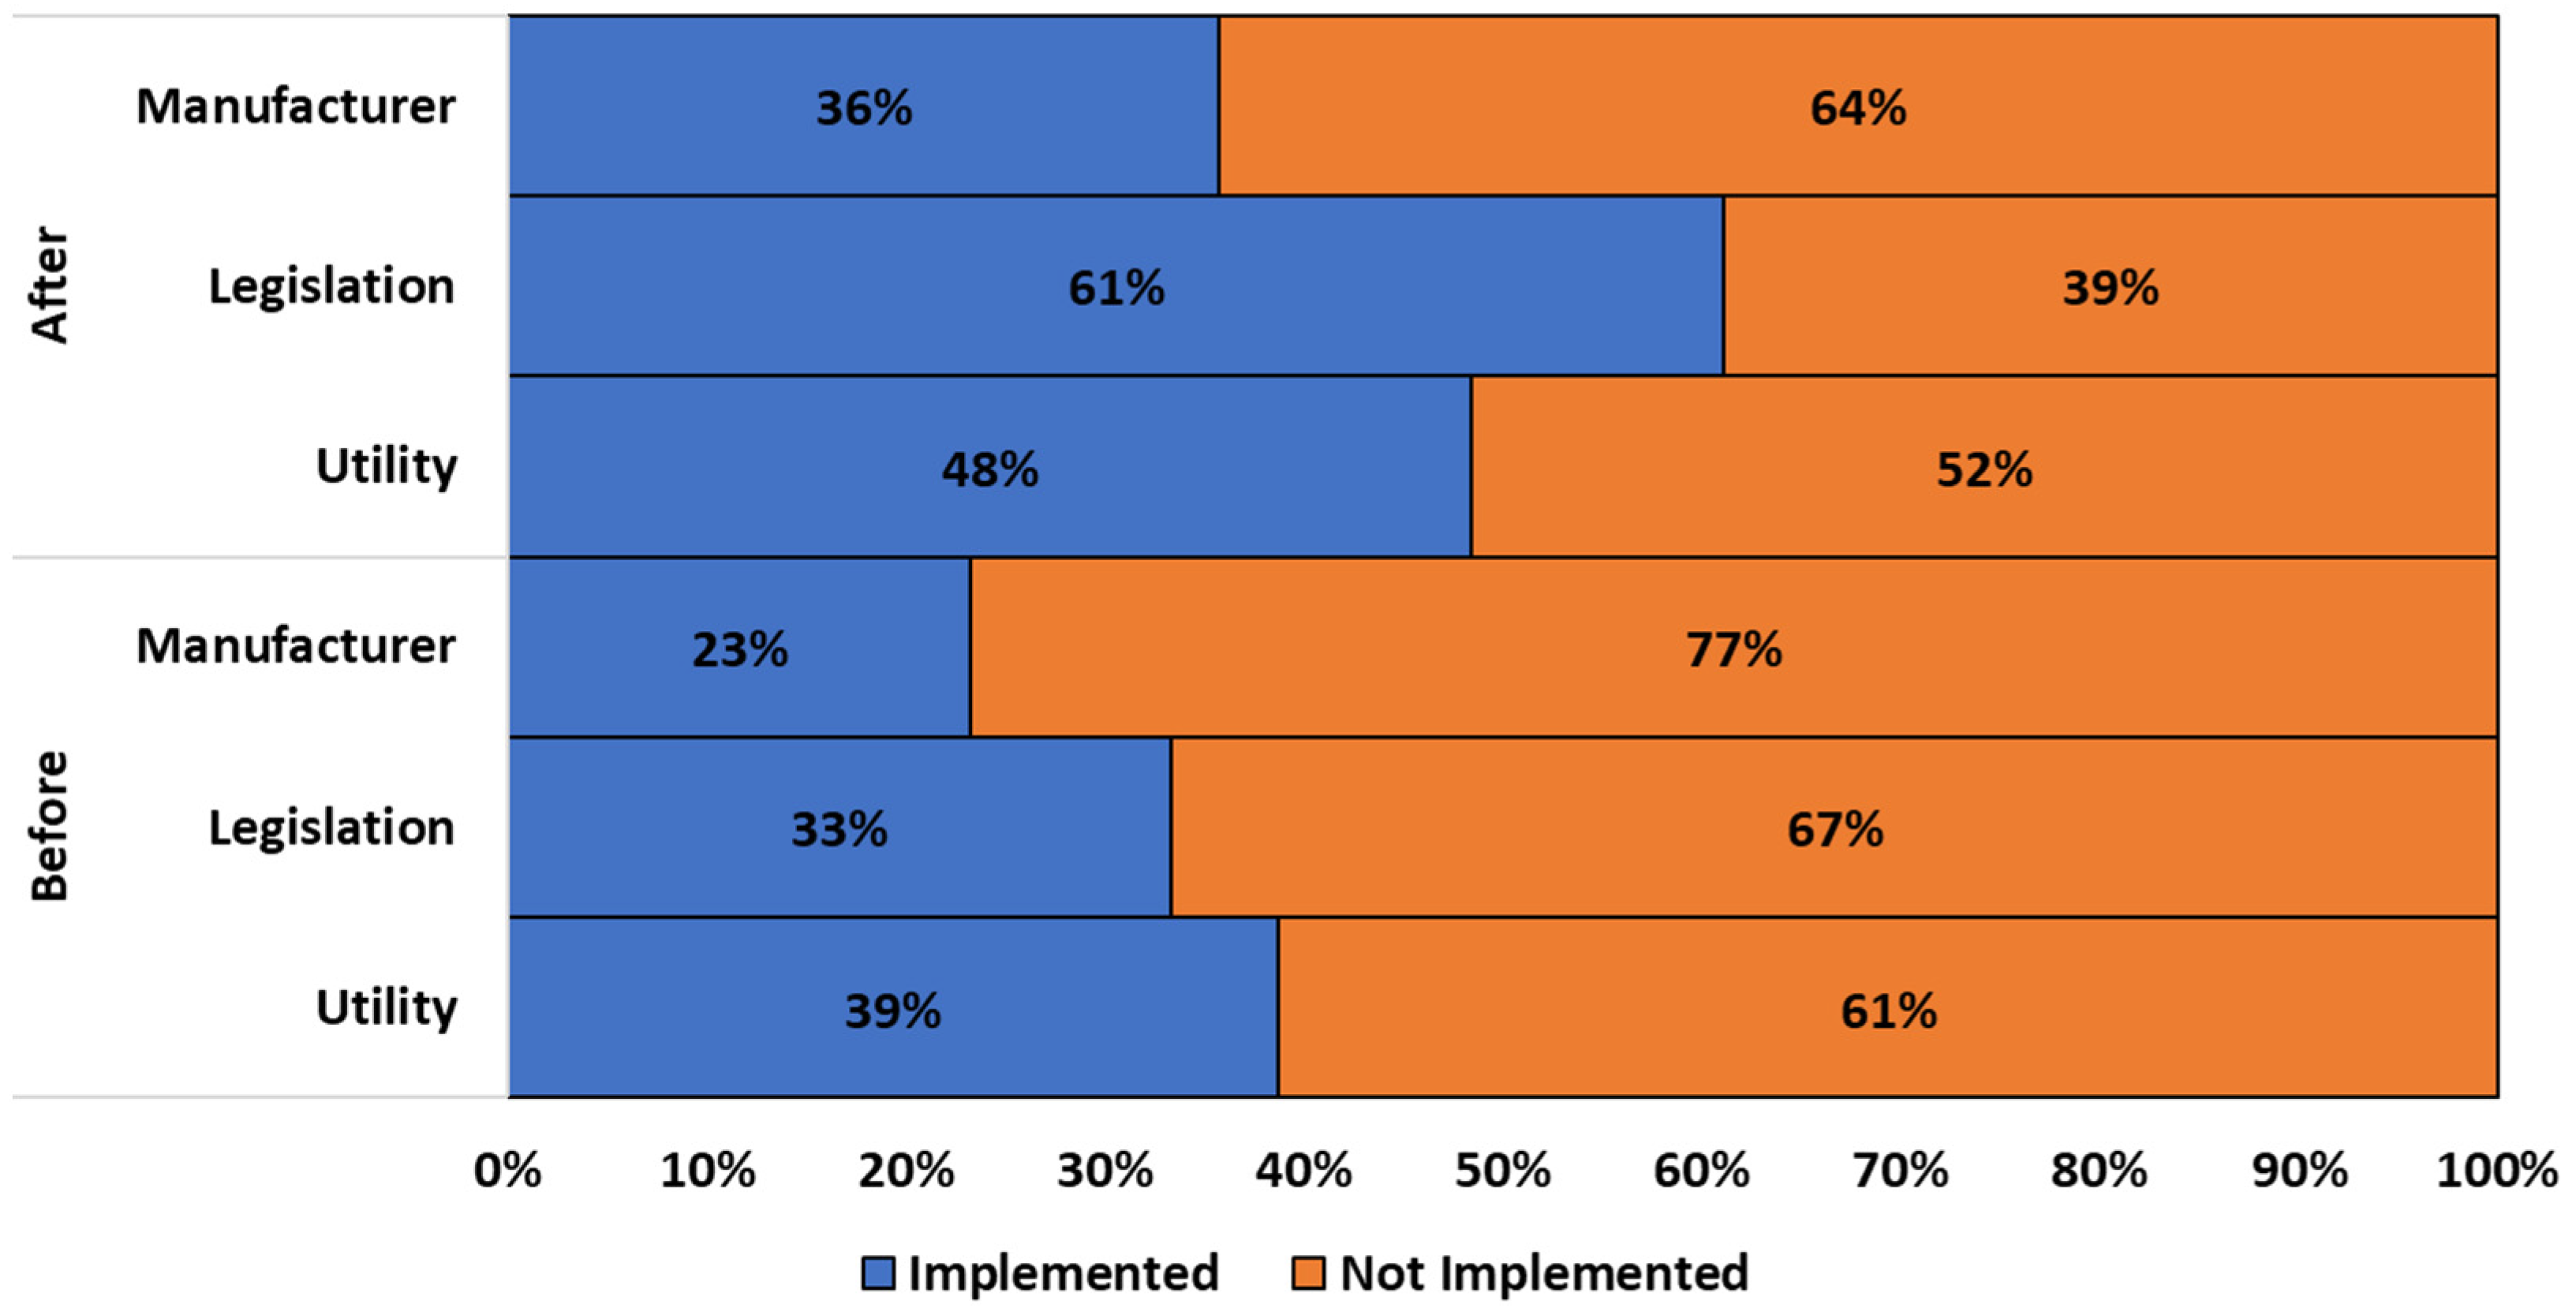
4.2. Results of the Implementation ML Model

The implementation ML model results are intended to help us better understand how rebate programs affect the probability of industrial facilities implementing lighting ARs. When developing the implementation ML model, we used the same training data as for the rebate ML model but updated the implementation cost parameters information with the predicted rebate values generated from the rebate ML model. As explained earlier, a GBM model was selected as the most accurate option for the implementation ML model. Table 7 shows the number of lighting ARs that were implemented or not implemented by client manufacturers for the 13 years of the study according to the results of the post-audit survey conducted 9 months after the industrial energy assessment and how much that implementation might have increased if the rebate rates predicted by the implementation ML model were applied. From the post-audit survey data, it was found that about 70% of lighting ARs that did not include rebate opportunities were not implemented. After running the ML model, the number of implemented ARs increased for every type of AR. The results indicate that if the predicted rebate rates had been applied to the rebate-omitted ARs, the percentage of implemented ARs would have increased from 30% to 52%.
Figure 6 compares the changes in implementation rates before and after the ML model was run in order to learn the impact of the three types of reason. The largest increase in implementation rates was shown in the group affected by the legislation, which suggest that if the state of Ohio had not passed HB6, which directly led regional utility companies to discontinue energy efficiency rebate programs, there was a higher chance that industrial facilities would have reduced their energy usage and costs through the lighting rebates. Across all three types of rebate-omitted cases, the results predict an average 50% increase in the number of lighting-related AR implementations, which suggests that providing rebates for lighting systems can significantly increase the implementation of energy-efficient lighting ARs in industrial facilities.

5. Conclusions

While not consistent across the US, utility incentive programs have been shown to influence manufacturing facilities’ decision-making regarding implementing energy efficiency measures. This study demonstrated that energy-efficient lighting rebates played an important role in incentivizing the implementation of energy-efficient lighting equipment by manufacturing facilities in the whole Ohio region. Across the three scenarios in which rebates were omitted from the recommendation analyses and five different types of lighting recommendations, a ML analysis predicted that a total of USD811,090 in potential rebates was lost by the facilities that were energy audited by the UD-IAC over a 13-year period, and that these facilities were more 50% more likely to have implemented lighting ARs if these rebates had been available. The results provided some additional insights. The ARs that recommended upgrading to more efficient lamps missed out on the largest opportunities by far, ranging from over USD130,000 to more than USD350,000, reflecting that upgrading to high-efficiency lamps was the most frequent AR offered to facilities during this period. The corresponding rebate values predicted by the ML model (USD0.043/kWh savings) for this AR type were also much higher than those of any of the other ARs. Together, these findings suggest that increasing a manufacturing facility’s investment in energy-efficient lighting projects would also save large implementation costs. The ML techniques proved to be effective in capturing the importance of rebates. Such evidence that facilities are willing to implement more energy-efficient measures when incentivizing programs such as energy-efficient rebates are in place should encourage policymakers and utility companies to create or restore the kind of energy-efficient programs that were available in Ohio between 2009 and 2019. Although this research was only performed for facilities receiving energy-efficient lighting ARs in one midwestern state, similar research into energy systems across various localities, states, and countries could help make such policies more politically and economically viable.

Author Contributions

Conceptualization, P.S. and J.-K.C.; methodology, P.S. and J.-K.C.; software, P.S. and J.-K.C.; validation, P.S. and J.-K.C.; formal analysis, P.S.; investigation, P.S. and J.-K.C.; resources, P.S.; data curation, P.S.; writing—original draft preparation, P.S. and J.-K.C.; writing—review and editing, P.S. and J.-K.C.; visualization, P.S. and J.-K.C.; supervision, J.-K.C.; project administration, J.-K.C.; funding acquisition, J.-K.C. All authors have read and agreed to the published version of the manuscript.

Funding

We would like to express our gratitude to the US Department of Energy for supporting this work through their funding of the Industrial Assessment Center program (DE-EE0009721).

Acknowledgments

We thank previous and current UD-IAC students for their contributions to this continuing effort, and our industrial partners for their significant contributions.

Conflicts of Interest

The authors declare no conflict of interest.

References

  1. EIA, U.S. Table F33: Total Energy Consumption, Price, and Expenditure Estimates; EIA, U.S.: Washington, DC, USA, 2019. [Google Scholar]
  2. EIA, U.S. How Much Electricity Is Used for Lighting in the United States? EIA, U.S.: Washington, DC, USA, 2021. [Google Scholar]
  3. Jovanović, B.; Filipović, J. ISO 50001 standard-based energy management maturity model—Proposal and validation in industry. J. Clean. Prod. 2016, 112, 2744–2755. [Google Scholar] [CrossRef]
  4. McKane, A. Thinking Globally: How ISO 50001—Energy Management Can Make Industrial Energy Efficiency Standard Practice; Lawrence Berkeley National Laboratory: Berkeley, CA, USA, 2009. Available online: https://www.osti.gov/servlets/purl/983191 (accessed on 19 June 2022).
  5. Dalzell, N.M.; Boyd, G.A.; Reiter, J.P. Creating linked datasets for SME energy-assessment evidence-building: Results from the U.S. Industrial Assessment Center Program. Energy Policy 2017, 111, 95–101. [Google Scholar] [CrossRef]
  6. Choi, J.-K.; Schuessler, R.; Ising, M.; Kelley, D.; Kissock, K. A Pathway Towards Sustainable Manufacturing for Mid-size Manufacturers. Procedia CIRP 2018, 69, 230–235. [Google Scholar] [CrossRef]
  7. Juslén, H.; Tenner, A. Mechanisms involved in enhancing human performance by changing the lighting in the industrial workplace. Int. J. Ind. Ergon. 2005, 35, 843–855. [Google Scholar] [CrossRef]
  8. Jhunjhunwala, A.; Vasudevan, K.; Kaur, P.; Ramamurthi, B.; Kumaravel; Bitra, S.; Uppal, K. Energy efficiency in lighting: AC vs DC LED lights. In Proceedings of the 2016 First International Conference on Sustainable Green Buildings and Communities (SGBC), Chennai, India, 18–20 December 2016; pp. 1–4. [Google Scholar]
  9. Lundberg, D.C.; Tang, J.A.; Attari, S.Z. Easy but not effective: Why “turning off the lights” remains a salient energy conserving behaviour in the United States. Energy Res. Soc. Sci. 2019, 58, 101257. [Google Scholar] [CrossRef]
  10. Pandharipande, A.; Newsham, G.R. Lighting controls: Evolution and revolution. Lighting Res. Technol. 2018, 50, 115–128. [Google Scholar] [CrossRef]
  11. Delaney, D.; Ruzzelli, A.; O’Hare, G. Evaluation of Energy-Efficiency in Lighting Systems Using Sensor Networks. In Proceedings of the First ACM Workshop on Embedded Sensing Systems for Energy-Efficiency in Buildings, Berkeley, CA, USA, 3 November 2009. [Google Scholar] [CrossRef] [Green Version]
  12. Charles, A.G.; Elizabeth, S.; Ian, M.H.; Merrian, C.F.; Megan, A.B. Interactions between Energy Efficiency Programs Funded under the Recovery Act and Utility Customer-Funded Energy Efficiency Programs; LBNL: Berkeley, CA, USA, 2011; p. 73. [Google Scholar]
  13. Hoffman, I.M.; Goldman, C.A.; Rybka, G.; Leventis, G.; Schwartz, L.; Sanstad, A.H.; Schiller, S. Estimating the cost of saving electricity through U.S. utility customer-funded energy efficiency programs. Energy Policy 2017, 104, 1–12. [Google Scholar] [CrossRef] [Green Version]
  14. Ohio General Assembly, SB 221, 127th General Assembly. 2008. Available online: http://archives.legislature.state.oh.us/bills.cfm?ID=127_SB_221 (accessed on 19 June 2022).
  15. Ohio State Government, House Bill 6. 2019. Available online: https://www.ohiocitizen.org/house_bill_6 (accessed on 18 June 2022).
  16. NC Clean Energy, DSIRE (Database of State Incentives for Renewables & Efficiency). Programs. 2021. Available online: https://www.dsireusa.org/ (accessed on 19 June 2022).
  17. Errigo, A.; Choi, J.-K.; Kissock, K. Techno-economic-environmental impacts of industrial energy assessment: Sustainable industrial motor systems of small and medium-sized enterprises. Sustain. Energy Technol. Assess. 2022, 49, 101694. [Google Scholar] [CrossRef]
  18. McLaughlin, E.; Choi, J.-K.; Kissock, K. Techno-Economic Impact Assessments of Energy Efficiency Improvements in the Industrial Combustion Systems. J. Energy Resour. Technol. 2021, 144, 082109. [Google Scholar] [CrossRef]
  19. Kapp, S.; Choi, J.-K.; Kissock, K. Toward energy-efficient industrial thermal systems for regional manufacturing facilities. Energy Rep. 2022, 8, 1377–1387. [Google Scholar] [CrossRef]
  20. Houde, S.; Aldy, J.E. Consumers’ Response to State Energy Efficient Appliance Rebate Programs. Am. Econ. J. Econ. Policy 2017, 9, 227–255. [Google Scholar] [CrossRef] [Green Version]
  21. Huh, S.-Y.; Jo, M.; Shin, J.; Yoo, S.-H. Impact of rebate program for energy-efficient household appliances on consumer purchasing decisions: The case of electric rice cookers in South Korea. Energy Policy 2019, 129, 1394–1403. [Google Scholar] [CrossRef]
  22. Datta, S.; Filippini, M. Analysing the impact of ENERGY STAR rebate policies in the US. Energy Effic. 2016, 9, 677–698. [Google Scholar] [CrossRef] [Green Version]
  23. Choi, J.-K.; Eom, J.; McClory, E. Economic and environmental impacts of local utility-delivered industrial energy-efficiency rebate programs. Energy Policy 2018, 123, 289–298. [Google Scholar] [CrossRef]
  24. Galarraga, I.; Abadie, L.M.; Ansuategi, A. Efficiency, effectiveness and implementation feasibility of energy efficiency rebates: The “Renove” plan in Spain. Energy Econ. 2013, 40, S98–S107. [Google Scholar] [CrossRef]
  25. Naji, A.; Al Tarhuni, B.; Choi, J.K.; Alshatshati, S.; Ajena, S. Ajena Toward cost-effective residential energy reduction and community impacts: A data-based machine learning approach. Energy AI 2021, 4, 100068. [Google Scholar] [CrossRef]
  26. Curtis, J.; Devitt, N.; Whelan, A. Estimating Building Energy Ratings for the Residential Building Stock: Location and Occupancy; ESRI WP489; Economic and Social Research Institute (ESRI): Dublin, Ireland, 2014.
  27. Chen, C.; Liu, Y.; Kumar, M.; Qin, J.; Ren, Y. Energy consumption modelling using deep learning embedded semi-supervised learning. Comput. Ind. Eng. 2019, 135, 757–765. [Google Scholar] [CrossRef]
  28. Violatto, G.; Pandharipande, A.; Li, S.; Schenato, L. Classification of Occupancy Sensor Anomalies in Connected Indoor Lighting Systems. IEEE Internet Things J. 2019, 6, 7175–7182. [Google Scholar] [CrossRef]
  29. Sharp, M.; Ak, R.; Hedberg, T., Jr. A Survey of the Advancing Use and Development of Machine Learning in Smart Manufacturing. J. Manuf. Syst. 2018, 48 Pt C, 170–179. [Google Scholar] [CrossRef]
  30. Breiman, L. Random Forests. Mach. Learn. 2001, 45, 5–32. [Google Scholar] [CrossRef] [Green Version]
  31. Ishwaran, H.; Lu, M. Standard errors and confidence intervals for variable importance in random forest regression, classification, and survival. Stat. Med. 2019, 38, 558–582. [Google Scholar] [CrossRef] [PubMed]
  32. Wang, Z.; Wang, Y.; Zeng, R.; Srinivasan, R.S.; Ahrentzen, S. Random Forest based hourly building energy prediction. Energy Build. 2018, 171, 11–25. [Google Scholar] [CrossRef]
  33. Nelder, J.A.; Wedderburn, R.W.M. Generalized Linear Models. J. R. Stat. Soc. Ser. A 1972, 135, 370–384. [Google Scholar] [CrossRef]
  34. Apergis, N.; Aye, G.C.; Barros, C.P.; Gupta, R.; Wanke, P. Energy efficiency of selected OECD countries: A slacks based model with undesirable outputs. Energy Econ. 2015, 51, 45–53. [Google Scholar] [CrossRef] [Green Version]
  35. Iyit, N. Modelling world energy security data from multinomial distribution by generalized linear model under different cumulative link functions. Open Chem. 2018, 16, 377–385. [Google Scholar] [CrossRef]
  36. Ayyadevara, V.K. Gradient Boosting Machine. In Pro Machine Learning Algorithms: A Hands-On Approach to Implementing Algorithms in Python and R; Apress: Berkeley, CA, USA, 2018; pp. 117–134. [Google Scholar] [CrossRef]
  37. Friedman, J.H. Greedy Function Approximation: A Gradient Boosting Machine. Ann. Stat. 2001, 29, 1189–1232. [Google Scholar] [CrossRef]
  38. Touzani, S.; Granderson, J.; Fernandes, S. Gradient boosting machine for modeling the energy consumption of commercial buildings. Energy Build. 2018, 158, 1533–1543. [Google Scholar] [CrossRef] [Green Version]
  39. Nie, P.; Roccotelli, M.; Fanti, M.P.; Ming, Z.; Li, Z. Prediction of home energy consumption based on gradient boosting regression tree. Energy Rep. 2021, 7, 1246–1255. [Google Scholar] [CrossRef]
  40. Jain, A.K.; Jianchang, M.; Mohiuddin, K.M. Artificial neural networks: A tutorial. Computer 1996, 29, 31–44. [Google Scholar] [CrossRef] [Green Version]
  41. Ekici, B.B.; Aksoy, U.T. Prediction of building energy consumption by using artificial neural networks. Adv. Eng. Softw. 2009, 40, 356–362. [Google Scholar] [CrossRef]
  42. Kalogirou, S.A. Applications of artificial neural-networks for energy systems. Appl. Energy 2000, 67, 17–35. [Google Scholar] [CrossRef]
  43. Ahmad, M.W.; Mourshed, M.; Rezgui, Y. Trees vs Neurons: Comparison between random forest and ANN for high-resolution prediction of building energy consumption. Energy Build. 2017, 147, 77–89. [Google Scholar] [CrossRef]
  44. Gallagher, C.V.; Bruton, K.; Leahy, K.; O’Sullivan, D.T. The suitability of machine learning to minimise uncertainty in the measurement and verification of energy savings. Energy Build. 2018, 158, 647–655. [Google Scholar] [CrossRef]
  45. Haricha, K.; Khiat, A.; Issaoui, Y.; Bahnasse, A.; Ouajji, H. Towards smart manufacturing: Implementation and benefits. J. Ubiquitous Syst. Pervasive Netw. 2021, 15, 25–31. [Google Scholar] [CrossRef]
  46. Nikolic, B.; Ignjatic, J.; Suzic, N.; Stevanov, B.; Rikalovic, A. Predictive manufacturing systems in industry 4.0: Trends, benefits, and challenges. Ann. DAAM Proc. 2017, 28. Available online: https://www.researchgate.net/profile/Aleksandar-Rikalovic/publication/321659440_Predictive_Manufacturing_Systems_in_Industry_40_Trends_Benefits_and_Challenges/links/5a2bbd8faca2728e05deb10b/Predictive-Manufacturing-Systems-in-Industry-40-Trends-Benefits-and-Challenges.pdf (accessed on 18 June 2022).
  47. Ayvaz, S.; Alpay, K. Predictive maintenance system for production lines in manufacturing: A machine learning approach using IoT data in real-time. Expert Syst. Appl. 2021, 173, 114598. [Google Scholar] [CrossRef]
  48. Kalantzis, F.; Revoltella, D. Do energy audits help SMEs to realize energy-efficiency opportunities? Energy Econ. 2019, 83, 229–239. [Google Scholar] [CrossRef]
  49. Marasco, D.E.; Kontokosta, C.E. Applications of machine learning methods to identifying and predicting building retrofit opportunities. Energy Build. 2016, 128, 431–441. [Google Scholar] [CrossRef] [Green Version]
  50. U.S. Department of Energy, Energy Efficiency and Renewable Energy (EERE), Advanced Manufacturing Office. Ind. Assess. Cent. (IAC) Program 2022. Available online: https://www.energy.gov/eere/amo/industrial-assessment-centers-iacs (accessed on 18 June 2022).
Figure 1. Research framework for using ML to analyze the impact of lighting utility rebates.
Environments 09 00100 g001
Figure 2. ANN concept applied for the rebate model.
Environments 09 00100 g002
Figure 3. GBM diagram showing decision trees trained from the weighted, incorrect predictions.
Environments 09 00100 g003
Figure 4. Total predicted rebates missed for each AR and scenario for missing rebates.
Environments 09 00100 g004
Figure 5. Reductions in implementation cost and simple payback due to rebate value predictions.
Environments 09 00100 g005
Figure 6. Changes in implementation according to the scenario group.
Environments 09 00100 g006
Table 1. Examples of ARs for increasing the efficiency of lighting systems.
CategoryDescription of Assessment Recommendations (ARs)
ControlsInstall occupancy sensors
Add area lighting switches
Install timers on light switches in little-used areas
Use photocell controls
HardwareUtilize more efficient lamps and ballasts
Install skylights
Lower light fixtures in high ceiling areas
Install spectral reflectors/delamping
OperationUtilize daylight instead of artificial light whenever possible
Make a practice of turning off lights when not needed
Keep lamps and reflectors clean
Disconnect ballasts
LevelsReduce illumination to minimum necessary levels
Table 2. Lighting fixture information before adding occupancy sensors.
TermWarehouseManufacturingUnits
Operating hours22004400h
Electrical peak demand16.055.2kW
Electrical consumption35,284243,065kWh/year
CO2 emissions25172tons/year
Total electricity costUSD4641USD20,908/year
Total relamping costUSD218USD1500/year
Total operating costUSD4859USD22,408/year
Table 3. Number of rebate-applicable lighting ARs used for training and testing the ML models.
Number of “Rebates Applied”
ARs (Training Data)
Number of “Rebate Omitted”
ARs (Testing Data)
Lighting AR Type Cause of missing the rebate opportunity
Legislation UtilityManufacturer
Install occupancy sensors456713
Install spectral reflectors/delamping2015
Utilize daylight whenever possible7057
Use photocell controls7002
Utilize more efficient lamps142111829
Total203104
Table 4. Validation metrics for rebate ML model selection.
Type of ML ModelValidation Metrics
R2MSE (USD)RMSE (USD)
ANN (selected)0.99284418
GBM0.99318566
RF0.9510362172
GLM0.0058309576
Table 5. Selection metrics for the implementation model.
Type of ML ModelValidation Metrics
R2MSERMSE
GBM (selected)0.910.020.15
RF0.880.030.17
ANN0.830.040.07
GLM0.230.190.43
Table 6. Predicted rebate rates for energy-efficient lighting ARs.
Energy-Efficient Lighting ARs Predicted Rebate per Unit of
Energy Saved (USD/kWh)
Install occupancy sensorsUSD0.020
Install spectral reflectors/delampingUSD0.014
Utilize daylight whenever possible USD0.016
Use photocell controlsUSD0.030
Utilize more efficient lampsUSD0.043
Table 7. Implementation results from the GBM model based on the AR type.
Number of Rebate-Omitted ARsIf Predicted Rebate Rates Were Applied
Energy-Efficient Lighting ARsNot ImplementedImplementedNot ImplementedImplemented
Install occupancy sensors197188
Install spectral reflectors/delamping4233
Utilize daylight whenever possible 6648
Use photocell controls1111
Utilize more efficient lamps43152434
Total73315054
Percentile70%30%48%52%
Publisher’s Note: MDPI stays neutral with regard to jurisdictional claims in published maps and institutional affiliations.

