Abstract
Large numbers of Single Use Surgical-type Face Masks, used by the public as personal protective equipment during the 2020–2022 COVID-19 pandemic, have been lost or intentionally discarded and have entered the environment rather than the waste management stream. These masks, made from non-woven polypropylene fibers, will undergo environmental decay which will release fiber fragments as microplastics into the environment. While the photochemical process of the decay of polypropylene polymers (photo-oxidation) is well understood, and while there are numerous studies that investigate mask decay and micro-fiber shedding in laboratory settings, there are no observational data that describe the progress and speed of decay on polypropylene face masks in real-life environmental settings. This paper examines the breakdown of single use surgical-type face masks under natural conditions. Masks from three manufacturers were exposed to natural sunlight over a ten-week period and their state of decay was photographically recorded in situ at weekly intervals. Visible decay accelerated after three weeks, with masks made from thinner spunbond fabric decaying more rapidly. Among same-weight fabric, photo-oxidation affected fabric dyed light blue more than undyed fabric, leading to a total breakdown after six weeks. The results are novel as they demonstrate a differential decay between the spunbonded and the melt-blown fabric, which cracks and breaks down much faster due to thinner fibers of shorter length and the lack of thermal bonding points. The resultant extensive micro-fiber generation was accelerated by external physical forces such as wind. This experiment highlights the fact that municipal agencies have only a narrow window of time to remove stray face masks from the urban environment if micro-fiber pollution is to be prevented.
1. Introduction
Soon after SARS-Cov-2, the virus responsible for the COVID-19 pandemic, had seeded into Australia in March 2020, all State governments mandated the wearing of masks in many outdoor and indoor settings [1]. Users had the choice of wearing surgical type, non-sterile single use (‘disposable’) facemasks, commercial KN95/P2 type dust masks, or masks made from fabrics [2]. Observational studies in Albury, a regional community in Southern New South Wales (Australia) showed that single use facemasks were most commonly worn by the public as personal protective equipment [3], an observation that was also confirmed by observational studies in Melbourne [4] and Sydney [5]. The quantity of masks manufactured in response to the COVID-19 pandemic is staggering, with China exporting more than 200 billion single use face masks in 2020 alone [6].
Not surprisingly, during a longitudinal study of masks encountered in the urban environment of Albury, single use facemasks were also the most common type of mask observed in various environmental settings, as lost or intentionally discarded items [7,8]. The majority of masks were encountered in carparks and at curbside parking locations where they were lost or discarded while entering or exiting parked vehicles. While the majority of these masks were removed during street cleaning operations, a significant quantity of masks was found in urban green spaces, in particular, on the verges of roads and footpaths, where they entered the green waste stream through mowing [9] or decayed in place. Decaying single use facemasks shed large amounts of microfibers into the environment as their bonds break.
1.1. Mode of Manufacture of Surgical Face Masks
Single use surgical masks are made from multiple layers of polypropylene or polyethylene non-woven fabrics which are machine-folded with (usually) three pleats (to allow for the mask stretching across the face) a nose wire and welded together at the top, bottom, and sides with hot-welded or ultrasonically welded seams. While this process is automated, the ear loops are usually manually attached with hot welding (Figure 1). Two basic kinds of fabric are used for the body of the mask: spunbond and melt-blown fabric.
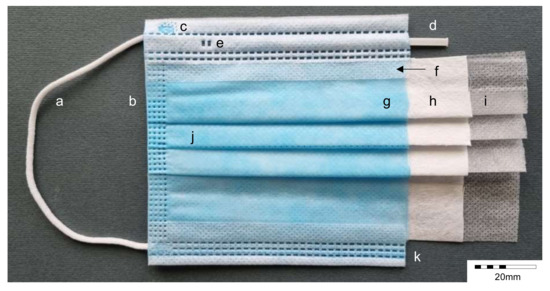
Figure 1.
Components of a surgical-type single use three-ply face mask. (a) Elastic ear loop; (b) heat-welded seam; (c) weld-point for ear loop; (d) nose wire; (e) weld-point to keep nose wire in place; (f) inner layer of spunbond polypropylene fabric folded over to thicken the heat-welded seam of the top of the mask; (g) outer layer of spunbond polypropylene fabric; (h) central core of melt-blown polypropylene fabric; (i) inner layer of spunbond polypropylene fabric; (j) pleats; and (k) inner layer of spunbond polypropylene fabric folded over to thicken the heat-welded seam of the bottom of the mask.
Spunbonded fabrics are produced by extruding melted polypropylene or polyethylene polymer through a spinneret to form long thin filaments. These filaments (5–20 µm diameter) are deposited in an irregular fashion on a moving conveyor belt where they form a fibrous web. Depending on the composition of the polymer and the residual heat in the filaments, they may form weak bonds between over-lapping fibers. The web of nonwoven fibers then passes between two heated rollers which thermally bond the web together, while heated raised node points (usually of oval or diamond shape) provide spot welding (thermal bonding points) to give the fabric better strength and durability [10,11,12,13].
Melt-blown fabrics are also produced by extruding a melted polymer through a spinneret. The extruded fibers are immediately subjected to high-velocity hot air streams which blow the molten polymer into very fine filaments (1–5 μm diameter) of shorter length. These discontinuous filaments are randomly dispersed and deposited on a moving conveyor belt where they form a dense fibrous web. The web of nonwoven fibers then passes between two heated rollers which thermally bond the web together. Unlike spunbond fabric, however, the melt-blown fabric does not show thermal bonding points [10,11,12,13], which results in a structurally weaker fabric.
Polypropylene is an electret that can hold a small charge or possess a net electric dipole moment [14]. Spunbond fabrics are usually used for the exterior of the mask, with the composition of the polymer adding further hydrophobic characteristics. The densely matted melt-blown fabric is used as a filter layer in the core of the mask.
1.2. Environmental Decay Processes
Many of the masks encountered in urban greenspaces and roadside verges originated on curbside parking and would have been blown to the locations by the wind as well as by vehicular draught. While most masks discarded/lost on roads and in carparks would eventually be removed by street cleaners, masks deposited in greenspaces remained in situ unless they were caught during mowing operations [9]. Once in the environment, the masks underwent processes of environmental decay.
Such environmental decay processes involve mechanical impact on the ground [15,16,17], being caught in machinery [9], immersion in turbulent waters [18,19,20,21], (simulated) abrasion [22], as well as freeze-thaw action [23]. Unless exposed to mechanical impact, the majority of masks will decay in place, subject to the environmental forces of temperature, solar radiation, precipitation, and, if exposed, to abrasive action by wind-borne dust and dirt particles.
Mere exposure to dry heat at natural environmental levels (<70 °C) or exposure to hot water has no observable effect on the tensile strength of polypropylene fibers [24,25]. Prolonged outdoor exposure to ultra-violet light and visible light intensity, however, causes photo-oxidation, which causes the polymer chains to break (chain scission) [26,27]. This results in a decrease in the tensile strength and separation of individual fibers which become more brittle and eventually break down into smaller fragments [18,26,28,29,30,31,32] and eventually microplastics through brittle fracturing [33]. In addition, since the bonding strength of the extruded spunbond or melt-blown fibers to each other is less than the strength of the fiber itself, continued cycles of thermal expansion and contraction result in fiber separation before fiber breakdown.
The majority of research on the UV degradation of polypropylene investigated the processes under accelerated laboratory conditions [24,25,28,29,30,34,35,36,37], often when exploring different polymer additives. Exceptions to this are the work by Saliu et al. who, in addition to laboratory tests, also examined masks sampled from Italian beaches [18], by Rathinamoorthy and Balasaraswathi who examined the stability of masks exposed to the environment for 30 days [22], by Rajakumar et al. [26], who examined the chemical processes, as well as observational studies of masks encountered in the environment [22,38,39]. Given the large number of mask manufacturers who use polypropylene fabric of different densities and manufacturing processes, as well as polypropylene with different chemical compositions in the form of stabilizing additives, it is impossible to compare laboratory samples with masks found as carried out by some authors [18].
Unless under controlled situations (local, duration, etc.), decay studies of found masks are indicative only, as are studies where micro-fiber shedding was assessed by rubbing surfaces together [22]. In addition, there are three experimental studies that investigated the environmental decay of polypropylene geotextiles [40,41,42]. Polypropylene weathering is affected by the combined photophysical and photochemical effects of ultraviolet (UV) radiation with the oxidative effects of atmospheric oxygen and hydrolytic effects of water [43,44].
The principal outcome of the photo-oxidation is a loss of flexibility in the fibers, resulting in a stiffer fabric coupled with an increased brittleness of the fibers and the overall fabric [35]. The brittleness is generated by transverse cracks [40]. The decay was not linear but accelerated over time with the total exposure to solar radiation being the discriminant factor [41]. As the fibers of the geotextiles tested are twice the strength of those used for surgical-type masks (40 µm vs. 20–25 µm), and as the density of the geotextiles fabric is significantly greater (420 gsm vs. 20–30 gsm), the results derived from these studies, while informative and applicable in principle, cannot be directly ported.
Several laboratory studies have examined the short-term exposure of polypropylene face masks to germicidal UV-C radiation and found no damage to the masks [45,46,47]. These studies have limited applicability, however, as the irradiation time was short and confined to a single event and the irradiation energy was low (but sufficient to generate a germicidal effect that adequately degraded the viruses).
While the photochemical process of the decay of polypropylene polymers is well understood, there are no observational data that describe the progress and speed of decay on items of material culture in natural, real-life environmental settings. These data, however, are important in order to understand the length of intervention time windows between the deposition of a mask and its breakdown into microfibers. The aim of this paper is to examine the breakdown of a range of single use surgical-type face masks under natural conditions, assessing the nature and progress of their decay over a ten-week period.
2. Materials and Methods
2.1. Masks Used for Experimentation
Two Australian- and one Chinese-manufactured sample of single use surgical-type face masks were used for the experiments, all of which were sourced in Albury, NSW, Australia [48].
Mask A: Single Use Face Mask Level 1. Batch 10911901, manufactured on 4 December 2020 by Bella Medical Supplies Pty Ltd., West Melbourne, Vic, Australia. The masks (175 mm × 95 mm) are made from three-ply polypropylene fabric, with spunbond fabric at the outward-facing exterior (33.8 gsm, color: 0010-R90B) [49], a melt-blown fabric at the inward-facing exterior (21.5 gsm, color 0000W), and a melt-blown fabric with finer filament size in the center (33 gsm). The outward-facing fabric shows rhomboid thermal bonding points while the inward-facing fabric appears to be melt-blown without thermal bonding points (for micro-photos of material see Figure 2).

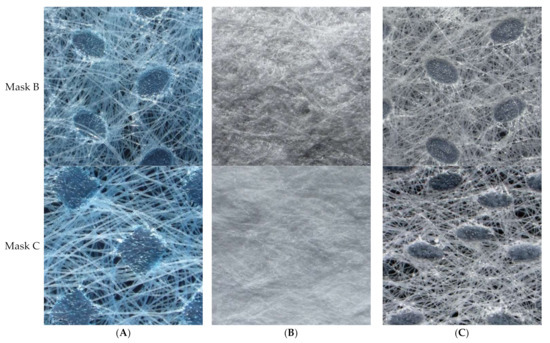
Figure 2.
Fabric of the surgical-type single use face masks discussed in this paper. (A) The outer layer of spunbond polypropylene fabric; (B) the central core of melt-blown polypropylene fabric; and (C) the inner layer of spunbond polypropylene fabric. Each square measures 3 mm × 3 mm.
Mask B: MicroProtect Surgical Face Masks, Level 3 Single Disposable (A1914-0001). Lot L2021239, manufactured in November 2021 by Softmed Manufacturing Pty Ltd., Campbellfield, Vic, Australia, and distributed by Coles Group Supermarkets. The masks (175 mm × 95 mm) are made from four-ply polypropylene fabric, with two layers of spunbond fabric at the outward-facing exterior (27 gsm, color 1020-B10 and 25 gsm, respectively, color 0000W) [49], one layer at the inward-facing exterior (28 gsm, gsm, color 0000W), and one layer of melt-blown fabric in the center (27 gsm) (for micro-photos of material see Figure 2).
Mask C: Disposable Face Mask with Ear loops (SOJO DFM20V). Batch 20200725, manufactured on 25 July 2020 by Insoft (China) Co. Ltd., Jinjiang City, China, and distributed in Australia by Bunnings Ltd. The masks (175 mm × 95 mm) are made from three-ply polypropylene fabric, with spunbond fabric at the outward (28 gsm, color 1030-B10) [49] and inward-facing exterior 26 gsm, color 0000W) and melt-blown fabric in the center (32 gsm) (for micro-photos of material see Figure 2).
2.2. Experimental Layout
Seven masks each were extracted as a consecutive sequence from a box of 50 (Masks A) or packs of 10 (Masks B and C). One was retained as a control, while the other six were mounted with thumbtacks on a 600 mm × 900 mm × 3 mm panel of medium-density fiberboard (MDF) made from plantation-grown Pinus radiata [50]. Each mask type was mounted both recto and verso side down (three replicates each) in a 3 × 6 array (Figure 3A). The sequence of mounting was randomized (using the MSExcel RANDBETWEEN function) (Figure 3B). An error in the experimental set-up caused Mask A (field B6) to be mounted as recto side up rather than verso side up, resulting in four replicates for the recto exposure and two replicates for the verso exposure. The MDF panel was placed on a flat section of the Colorbond® roof of a domestic dwelling in Albury, NSW, Australia (Australia, coordinates −36.071935, 146.905320) and weighed down at the corners with bricks. The panel was exposed to direct sunlight except for the two hours after sunrise and the last hour before sunset. For the duration of the experiment, the non-shaded daily exposure period ranged from approximately 11 h at the beginning of the exposure period to 9.5 h at the end (see Figure 4 for total radiation exposure).

Figure 3.
Layout of the experimental plot. (A) Photograph of masks mounted on board; (B) randomized arrangement of mask types and orientations.
2.3. Documentation
The experiment ran for 10 weeks (5 February to 15 April 2022) with all masks photographically recorded in situ on the mornings of days 7, 14, 22, 32, 42, 48, 54, 55, and 64. On day 69, the board was removed from the roof and formally documented in toto. Each mask was then removed and photographed in its exposure orientation both in reflected and transmitted light (on a light table). Once its appearance had been documented, the mask was turned over and the non-exposed side photographed. On several occasions, during the turning process, large quantities of microfibers fell off the side that had been exposed to the environment. These were also photographed.
2.3.1. Calculation of Material Loss
As the diachronic observations were made while the masks were mounted on the MDF boards, the loss of fabric had to be calculated in terms of the percent of the visible surface. For obvious reasons, that does not account for the material in the pleats. Using MS PowerPoint, each photograph was overlain with a gridded mask of 25 × 32 cells, and the cells covering fabric loss or splits were counted out. Each cell contributed 0.125% to the total area.
The second approach to calculate fabric loss was to compare the final mask weights with control samples. The masks were weighed under laboratory conditions on an Ohaus Analytical Plus scale.
2.3.2. Nomenclatorial Conventions
In the absence of formal, published descriptors, the following definitions of mask elements will apply for this paper: The side of the mask without weld marks attaching the ear loop straps will be called recto, while the side with weld marks for the ear loop straps will be called verso. The top of the mask is determined by orienting the recto side to the mask in such a way that the openings of the pleats point downwards (which prevents dust from being trapped in incompletely opened masks when worn). The nose wire is always on the top. The other parameters of ‘right’, ‘left’, and ‘bottom’ flow on from there. For other terminology, see Figure 1.
It should be noted that when fitting a surgical face mask as recommended, the blue-dyed side always faces outwards (‘outer’). In the case of Mask A and Mask B, the blue spunbonded ‘outer’ fabric is on the (nomenclatorial) verso side.
2.4. Climatic Conditions
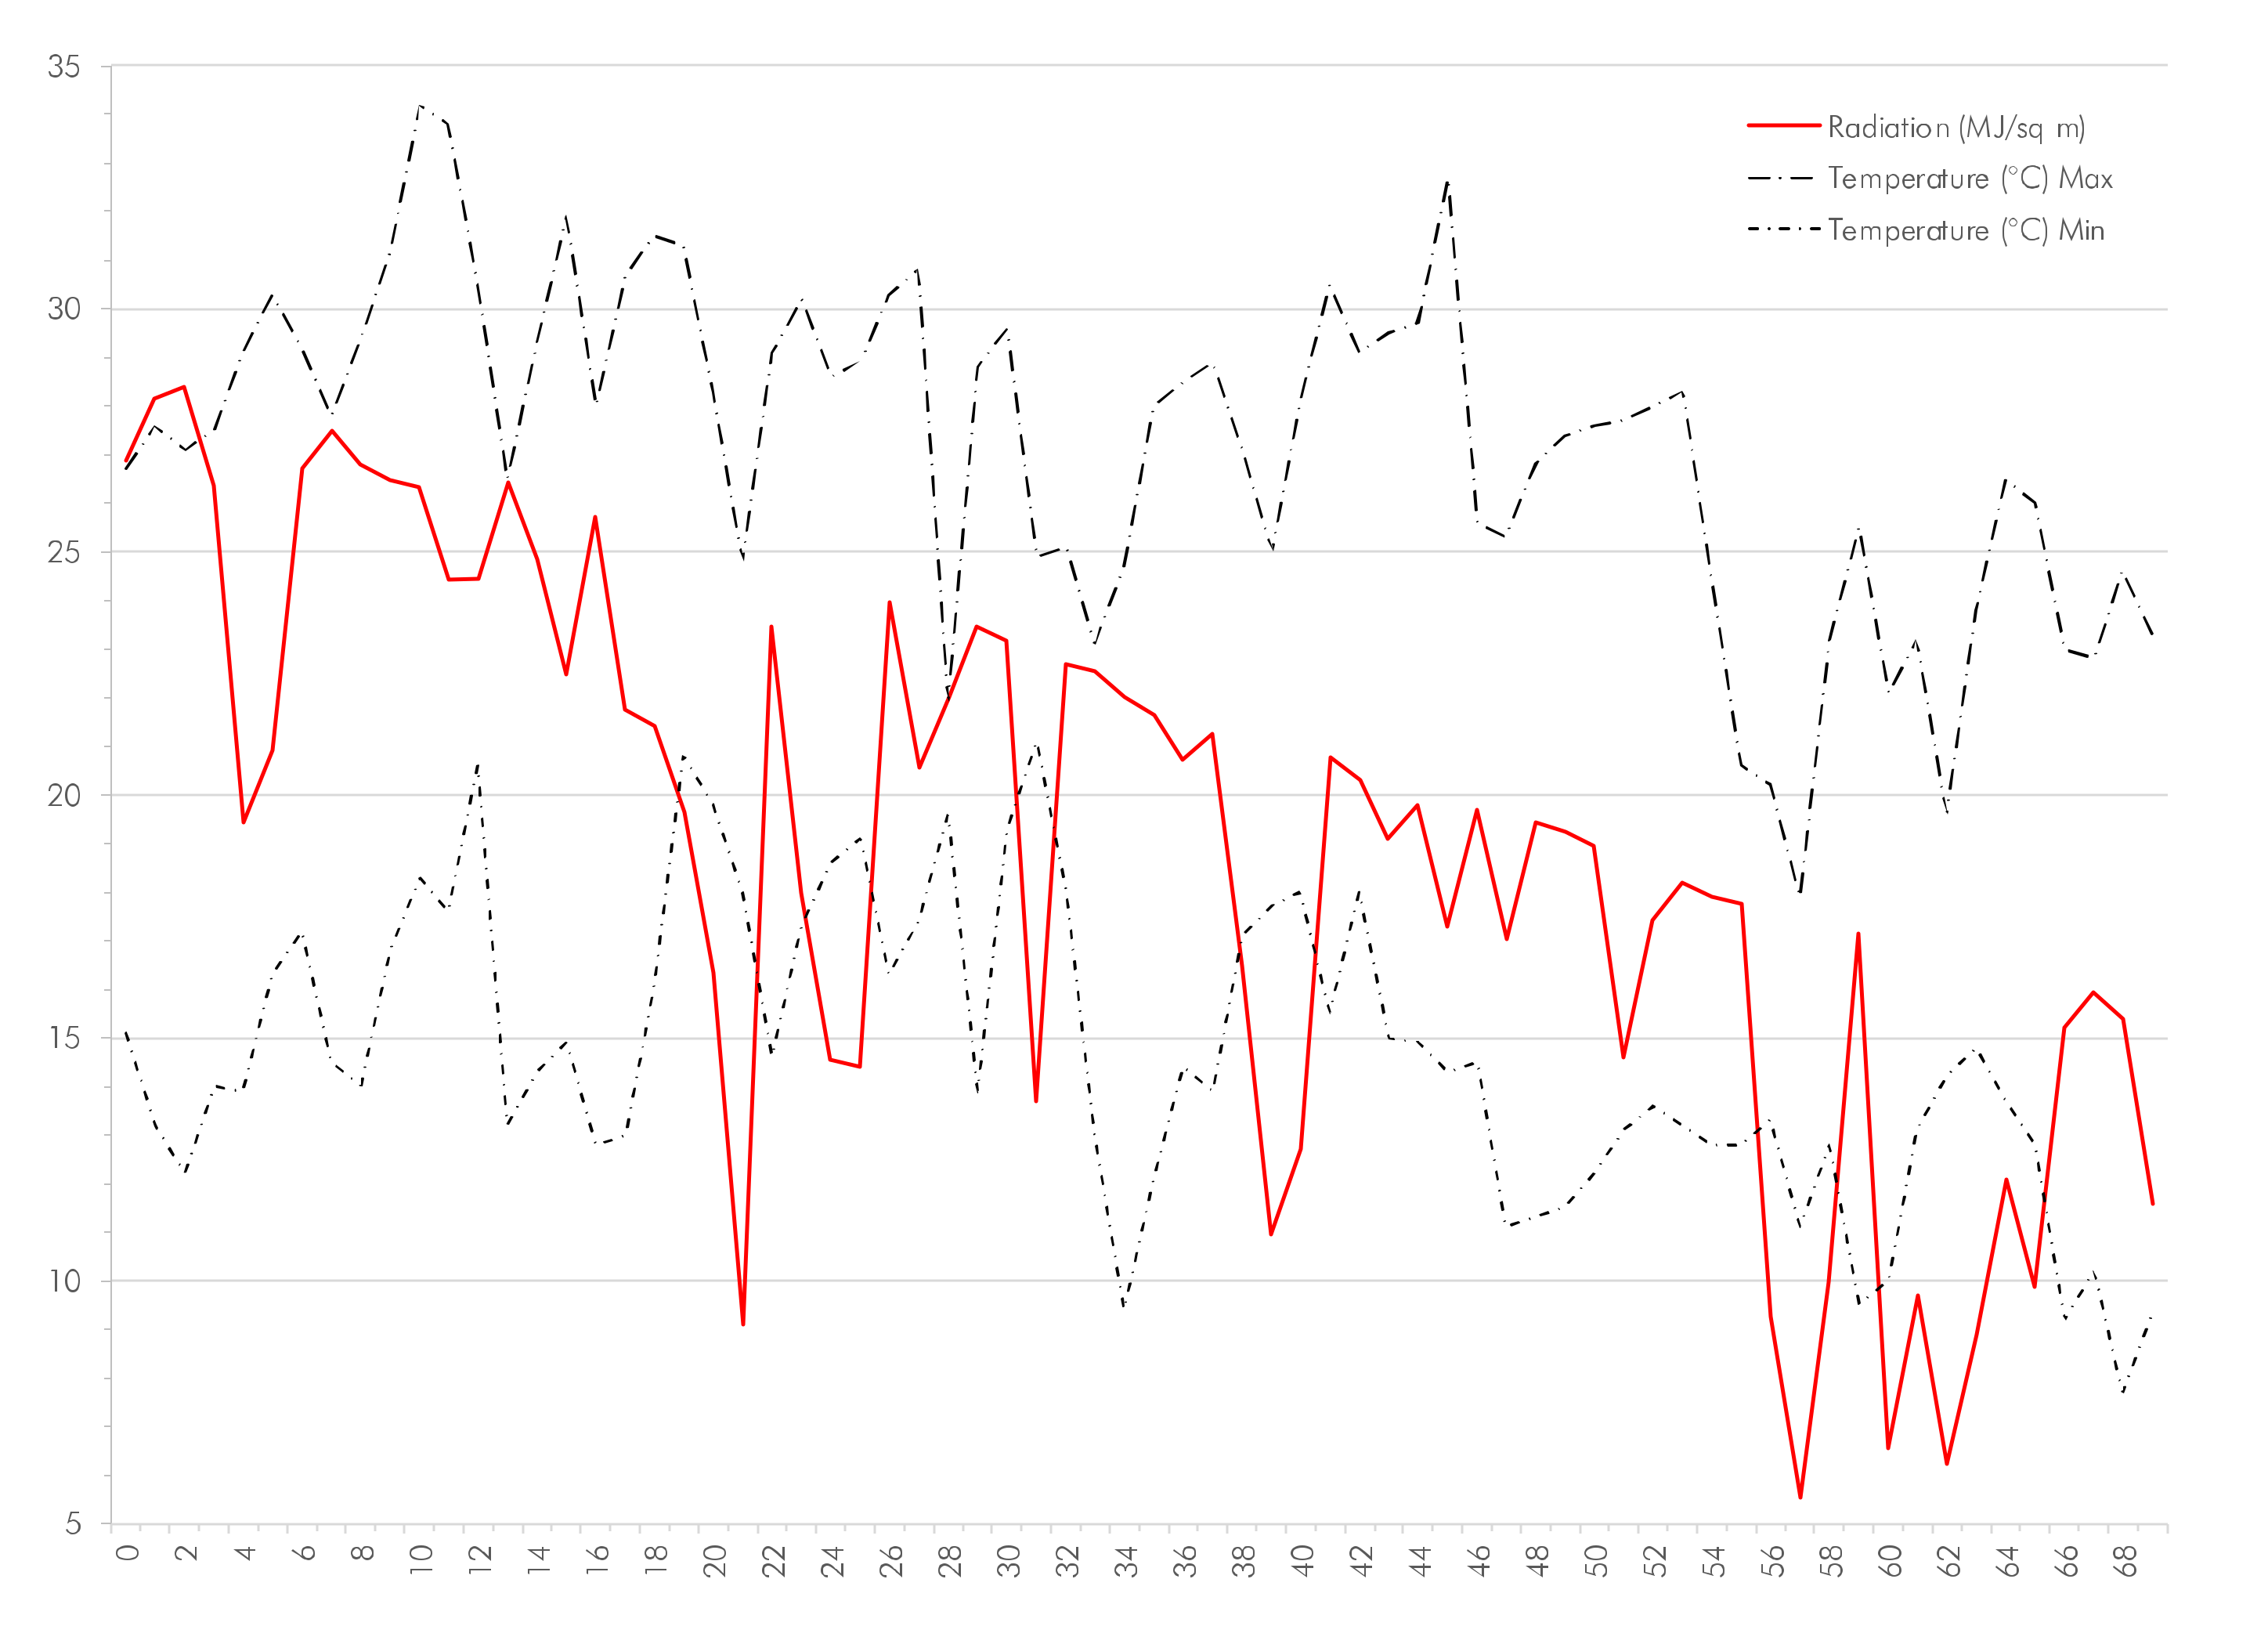
Albury is located in the National Construction Code Zone 4 (hot dry summer, cool winter) [51] or Koeppen zone ‘Grassland, persistently dry’ [52]. The test panel was exposed to a daily average solar radiation of 18.8 ± 5.86 MJ/m2 (range 5.5–28.4 MJ/m2) (Figure 4). The weather station at Albury Airport is located 4.3 km east of the experimental site.
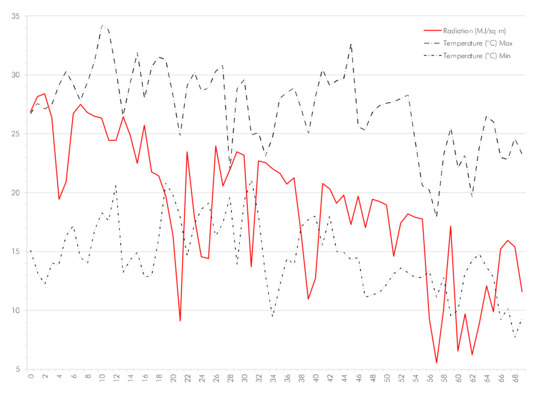
Figure 4.
Temperatures (Min-Max) and Radiation (global sun exposure) at Albury Airport [53] for the duration of the experimental period.
Figure 4.
Temperatures (Min-Max) and Radiation (global sun exposure) at Albury Airport [53] for the duration of the experimental period.
Variations between temperatures in the sun and the shade are considerable, as two sample points may indicate. At 3 pm on day 54, the daytime temp in the shade measured 24 °C, while the temperature in the direct sun was 40 °C. At noon on day 55 the measurements were 24 °C in the shade but 50 °C in the direct sun. Thus, the diurnal temperature variation of objects placed directly in the sun will be considerably greater than that expressed by meteorological recordings. In the case of day 55, the temperatures of the preceding and following night were 12.8 °C each, representing a 37.2 °C range.
As the experiment was carried out in a suburban setting with surrounding hills, the meteorological wind data are indicative only. Of note is the wind event between the evening of day 53 and the morning of day 54 (Figure 5).
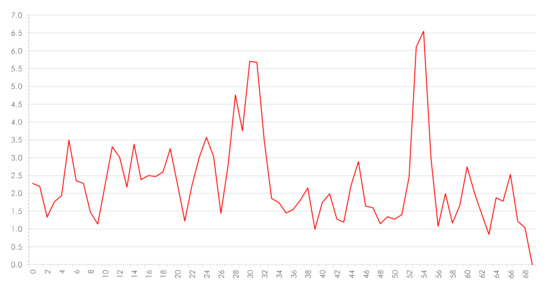
Figure 5.
Wind speeds (m/s) at Albury Airport [53] for the duration of the experimental period. Note the peak on days 53 and 54.
During the experimental period, frequent light rain fell on most days. The physical impact of the raindrops was minimal (no heavy rain or hail).
Thermal Expansion Calculations
The thermal expansion of the mask fibers was calculated using the standard formulae of ΔL = aL1(T2 − T1) for linear expansion and ΔV = bV1(T2 − T1) for volumetric expansion where ΔL is the change in the object’s length; ΔV is the change in object’s volume; a is the linear expansion coefficient; b is the volumetric expansion coefficient; L1 is the initial length; V1 is the initial volume; T1 is the initial temperature; and T2 is the final temperature.
The thermal expansion coefficients for the homopolymer polypropylene used for most face masks are 6–8 × 10⁻⁵ K−1 for linear expansion and 18–24 × 10−5 K−1 for volumetric expansion [54]. For the purposes of this paper, the mid-values (7 and 21) were used.
3. Results
At the end of the ten-week period, the observed decay was comparatively uniform between the three replicates of each exposure experiment and only very minor variations could be observed. These minor variations will be discussed as appropriate.
3.1. Mask A
Mask type A is a three-ply mask comprised of light-blue 34 gsm spunbond fabric at the outward-facing exterior, a filter core of 22 gsm melt-blown fabric, and a white wearer-facing layer of 33 gsm spunbond fabric.
3.1.1. Recto Side Exposed to the Elements
Final State (Day 69)
The white spunbond layer of the recto side is completely intact (Figure 6), with only minor separation of overlapping fibers (Figure 7B,C). None of the thermal bonding points are broken (Figure 7A). The underlying melt-blown layer is fragmented in the area of the pleats (visible in transmitted light), with considerable sections missing in the area between the pleats and the margins (all replicates). The unexposed light blue spunbond layer is completely intact.
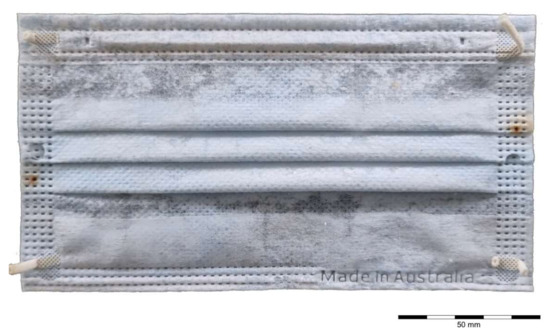
Figure 6.
Mask A, exposure of recto side (sample A4). State at day 69.
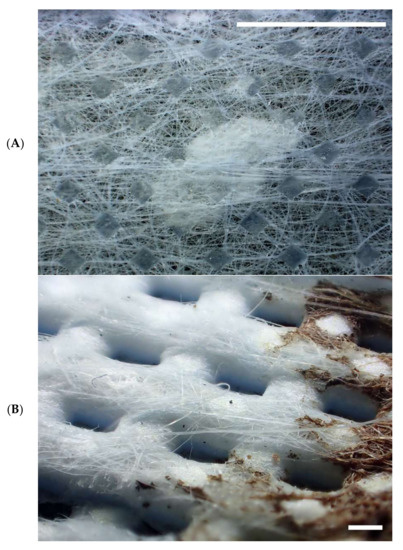

Figure 7.
Mask A, exposure of recto side. (A) Light blue spunbond fabric, showing the residual piece of melt-blown fabric below (C4) (scale bar 5 mm); (B) separation of fibers at the weld points of the right margin (B3) (scale bar 1 mm); and (C) separation of fibers at the fold lines of the pleats (B3) (scale bar 1 mm).
Diachronic Trajectory
In the diachronic trajectory, the mask decay was very slow at the start and then progressed rapidly but without structural failure of the white spunbond layer. Until day 22, all replicates showed no impact on the fabric. By day 32, the melt-blown fabric exhibited cracking in the area between the pleats and the top margin (all replicates), with minor fabric loss in one instance (A2). By day 42, the melt-blown fabric of all replicates exhibited extensive cracking in the area between the pleats and the top margin, with incipient cracking in the area between the pleats and bottom margin. Fabric loss had not accelerated. By day 48, all of the melt-blown fabric exhibited extensive cracking across the whole surface of areas between the pleats and margins, with progressing fabric loss. In sample A2, the cracking extended over the top of the pleats. By day 54, little had changed, but the strong wind event of the afternoon and night of day 54 resulted in further losses of the melt-blown fabric, in particular in replicate A2. By day 64, the appearance of the masks was as recorded on day 69 (see above) (see Appendix A, Appendix B and Appendix C for image series).
3.1.2. Verso Side Exposed to the Elements
Final State (Day 69)
The white spunbonded layer of the verso side is completely intact, with only minor separation of overlapping fibers. None of the thermal bonding points are broken (A4, C3) (Figure 8). When viewed under transmitted light, the underlying melt-blown layer is fragmented in the area of the pleats, partially missing in the area between the pleats and the bottom margin, and largely missing in the area between the pleats and the top margin (A4, C3) (Figure 9). The unexposed blue spunbonded layer is completely intact. When turned over for photography of the non-exposed side, no debris of micro-fiber fragments was observed.
Figure 8.
Mask A, exposure of verso side (sample A4). State at day 69.
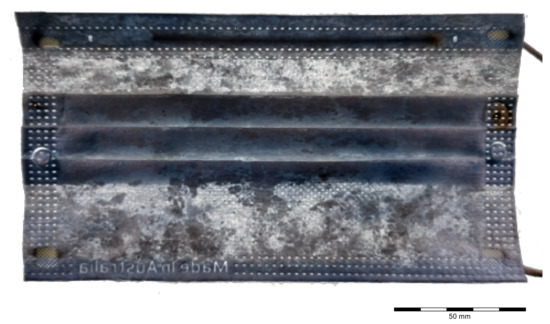
Figure 9.
Mask A, exposure of verso side under transmitted light (sample A4). State at day 69.
Diachronic Trajectory
In the diachronic trajectory, the mask decay was very slow at the start and then progressed rapidly but without structural failure of the white spunbonded layer.
Until day 22, both replicates showed no impact on the fabric. By day 32, the melt-blown fabric exhibited extensive cracking in the areas between the pleats and the margins, with minor fabric loss in the area between the pleats and top margin (C3). The second replicate (A4) exhibited incipient cracks only. By day 42, the melt-blown fabric of both replicates exhibited extensive cracking (less so on top of the pleats), with minor fabric loss in the area between the pleats and top margin (A4, more in C3). By day 48, all of the melt-blown fabric exhibited extensive cracking across the whole surface, including the pleats. By day 54, little had changed, but the strong wind event of the afternoon and night of day 54 resulted in further losses of the melt-blown fabric, in particular, in the area between the pleats and top margin. By day 64, the appearance of the masks was as recorded on day 69 (see above) (see Appendix A, Appendix B and Appendix C for image series for image series).
3.2. Mask B
Mask type B is a four-ply mask comprised of very light-blue 27 gsm spunbond fabric at the outward-facing exterior, another white layer of 25 gsm spunbond fabric, a filter core of 27 gsm melt-blown fabric, and a white wearer-facing layer of 28 gsm spunbond fabric. The wearer-facing layer does not exhibit thermal bonding points (Figure 2).
3.2.1. Recto Side Exposed to the Elements
The white spunbond layer of the recto side is completely intact, with only minor separation of overlapping fibers. None of the thermal bonding points are broken (Figure 10). When viewed under transmitted light, the underlying melt-blown layer is also intact and without cracking. The unexposed blue spunbond layer is completely intact. When turned over for photography of the non-exposed side, no debris of micro-fiber fragments was observed.
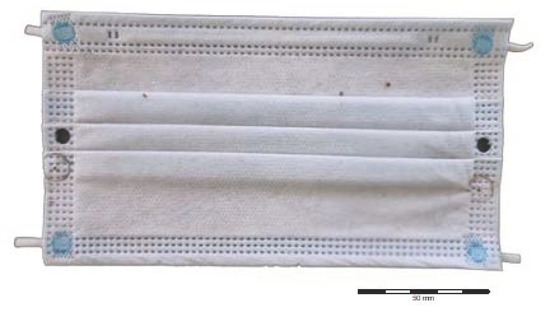
Figure 10.
Mask B, exposure of verso side (sample A6). State at day 69.
3.2.2. Verso Side Exposed to the Elements
Final State (Day 69)
The light blue spunbond layer has almost entirely decayed. The residual exposed remains of the layer, which are generally small (5 × 10 mm) and of amorphous shape, are loosely attached to the top of pleats and in situ under the thumbtacks (C1) (Figure 11, Figure 12). The white spunbond layer underneath the blue layer is intact but shows evidence of separation where fibers overlap. The thermal bonding points appear intact (Figure 12). The underlying white melt-blown layer is unaffected. The white spunbond layer facing the wearer appears to be intact, but, on close examination, some fibers were observed detaching from each other.
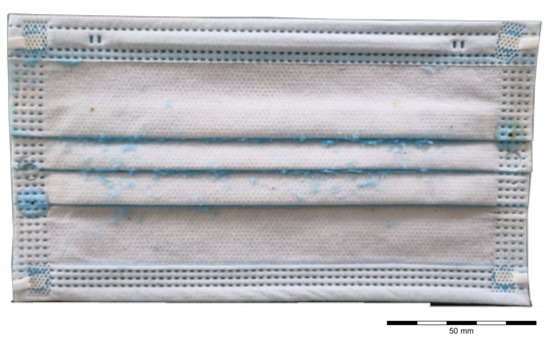
Figure 11.
Mask B, exposure of verso side (sample C1). State at day 69.
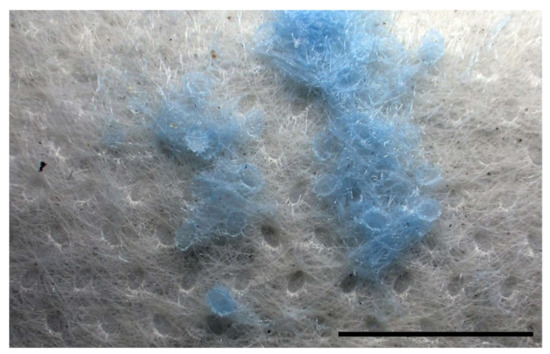
Figure 12.
Mask B, exposure of recto side. Loose debris of blue spunbond fabric in situ. Note that the white spunbond layer covering the melt-blown filter fabric remains intact (A1). Scale bar 5 mm.
When the masks (A1, B5, C1) were turned over for photography of the verso side, numerous small thermal bonding points of the blue fabric fell out as well as a large number of short lengths of blue microfibers and small fragments of the melt-blown fabric (Figure 13). The breakdown of the spunbond fabric resulted in numerous microfibers of 10 µm to 3 mm in length, with the majority in the 1–300 µm range (Figure 16A,C).
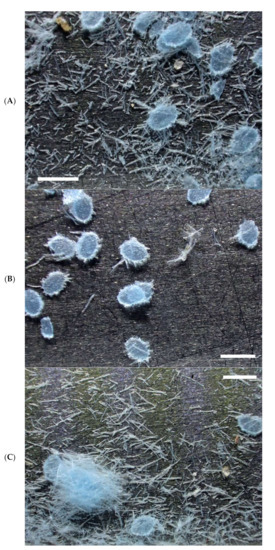
Figure 13.
Mask B, exposure of recto side. (A–C) loose debris of blue spunbond fabric (A1). Scale bars 1 mm.
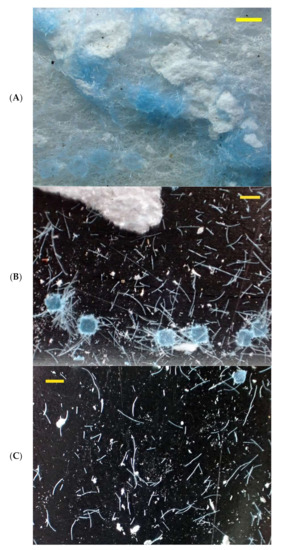
Figure 16.
Mask C, exposure of recto side. (A) Loose debris of blue spunbond and white melt-blown fabric in situ (A3); (B) loose debris of blue spunbond and white melt-blown fabric (C5). Note the isolated thermal bonding points; (C) loose debris of blue spunbond and white melt-blown fabric (A3). Scale bars 1 mm.
Diachronic Trajectory
In the diachronic trajectory, the mask decay was very slow at the start and then progressed rapidly but without structural failure of the white spunbond layer underneath the blue layer. The first split of the blue spunbond layer (in the areas between the pleats and top margin) was observed on day 32 (mask C1). By day 42, a second split had occurred in the same area, as well as in the area between the pleats and bottom margin. By day 48, the blue layer exhibited widespread structural failure with splitting on top of the pleats and fabric loss, and widespread splitting in the areas between the pleats and the margins. By day 54, most of the blue spunbond fabric between the pleats and bottom margin had been lost. The strong wind event of the afternoon and night of day 54 resulted in significant losses of the blue spunbond fabric in the areas between the pleats and margins as well as on top of the pleats. By day 64, all blue spunbond fabric had been lost, with the exception of the small parts still present when recorded at day 69 (see above) (see Appendix A, Appendix B and Appendix C for image series for image series).
3.3. Mask C
Mask type C is a three-ply mask comprised of light blue 28 gsm spunbond fabric at the outward-facing exterior, a filter core of 32 gsm melt-blown fabric, and a white wearer-facing layer of 28 gsm spunbond fabric.
3.3.1. Recto Side Exposed to the Elements
Final State (Day 69)
The light blue spunbond layer has decayed to more than 90% of the exposed coverage, surviving intact only in the non-exposed areas folded under the pleats and under the thumbtacks (sample A3, B2) (Figure 14). The residual exposed remains of the layer, which are generally small (5 × 10 mm) and of amorphous shape, are located primarily on the pleats (Figure 15A) as well as along the bottom margin (Figure 15C). In sample C5, the light blue spunbond layer has decayed to 75–80% with some sections loosely attached to the top of the pleats and at the bottom of the mask.
Figure 14.
Mask C, exposure of recto side (sample B2). State at day 69.
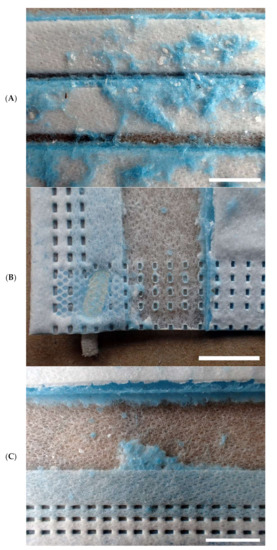
Figure 15.
Mask C, exposure of recto side (sample B2). (A) Recto side, central section with pleats; (B) recto side, weld points bottom right corner; and (C) bottom section, showing residual blue spunbond fabric and isolated thermal bonding points. Scale bars 10 mm.
The white melt-blown layer decayed on the flat sections between the welded seams and the pleats, exposing the white spunbonded layer of the face-side. The melt-blown layer survives in the pleats and underneath the remnants of the light blue spunbond layer (especially in sample C5). Numerous small fragments of the melt-blown fabric were encountered resting on top of the masks (Figure 15A and Figure 16A).
The white spunbond layer facing the wearer appears to be intact, but, on close examination, numerous fibers were observed not only detaching from each other but also from some of the thermal bonding points.
When the masks were turned over for photography of the verso side, numerous small thermal bonding points of the blue fabric fell out (Figure 16C) as well as numerous short lengths of blue microfibers and small fragments of the melt-blown fabric. The breakdown of the spunbond fabric resulted in numerous microfibers of 0.3 to 5 mm in length, with the majority in the sub-2 mm range (Figure 16B,C). The breakdown of the melt-blown fabric resulted in a few small (3–10 mm) fragments as well as a large number of sub-1 mm fragments, many of which are in the 10–30 µm range.
Diachronic Trajectory
In the diachronic trajectory, the mask decay was slow at the start and then accelerated considerably. The control shows that the spunbonded layer, although theoretically uniform, seems to exhibit variations in density, with the white of the melt-blown layer shining through more in some areas than others. By day 14, this ‘blotchiness’ had increased. By day 22, the first cracks in the melt-blown fabric could be observed, both on the upper and the lower sections between the pleats and the margins. By day 32, these cracks not only had widened, but sections of the melt-blown fabric had become dislodged. As the light blue spunbond fabric was still intact, these sections must have slid in front or behind undetached sections of melt-blown fabric. By day 48, sections of the blue spunbond fabric between the pleats and margins had broken, exposing the melt-blown fabric, and, where this had been displaced or lost, also the white spunbond fabric. Some of the blue spunbond fabric split at the fold-lines of the pleats. By day 54, losses of the blue spunbond fabric increased in the areas between the pleats and margins. In addition, sections on top of the pleats were lost, with others split. The strong wind event of the afternoon and night of day 54 resulted in significant losses of the blue spunbond fabric in the areas between the pleats and margins as well as on top of the pleats. The melt-blown fabric was also missing in all sections not covered by the blue spunbond fabric, exposing the underlying white spunbond fabric. By day 64, all blue spunbond fabric had been lost, with the exception of the small parts still present when recorded on day 69 (see above) (see Appendix A, Appendix B and Appendix C for image series).
3.3.2. Verso Side Exposed to the Elements
Final State (Day 69)
The white spunbond layer seems intact but the underlying melt-blown layer is cracking, both in the flat areas and on the pleats. The melt-blown layer is lacking in sections where some of it may have slid in front or behind undetached sections of melt-blown fabric. The transmitted light image shows that much of the melt-blown fabric is completely lost, suggesting it broke into fragments smaller than the interstices of the spunbond layers.
Some areas of the white spunbond layer show mainly intact thermal bonding points, while others (coinciding with the areas of cracking) show the failure of numerous thermal bonding points and separation and loss of fibers. When turned over, numerous small white fibers fell out as well as numerous micro-flakes of melt-blown fabric. Overall, however, the quantity of loose debris was significantly less than that of the recto side (samples A5, B1, and C2). The blue spunbond layer was intact with no evidence of fiber separation.
Diachronic Trajectory
In the diachronic trajectory, the mask decay was slow at the start and then progressed steadily but without structural failure of the white spunbond layer. The first cracking of the melt-blown core layer was observed on day 22 (top part of mask B1 only). By day 32, cracks and small gaps were observed in the area between the pleats and top margin of all three masks. By day 42, the cracking and partial loss of the melt-blown core layer extended to the entire exposed area in two of the three replicates (B1 and C2) but was confined to the pleats and the area between the pleats and top margin for one replicate (B1). By day 48, the cracking and partial loss of fabric had extended over the entire exposed area of the mask as well (see Appendix A, Appendix B and Appendix C for image series).
3.4. Comparative Progress of Decay over Time
3.4.1. Spunbonded Fabric
When considering the decay processes of the external spunbonded fabric of the three masks, the lack of macroscopically discernible decay among the white-colored fabric contrasts with the decay of the blue-colored fabric. The blue-colored fabric of masks type B and C decayed, while the white spunbonded of all three mask types did not. Fabric weight alone does not play a role as the white fabric (in all but one case) is thinner than the blue-colored fabric (see Section 2.1). As the observations were made while the masks were mounted on the boards, the loss of fabric, as summarized in the appendices, is expressed as the percent of the visible surface, not accounting for the material in the pleats.
Visible decay commenced for mask type B (27 gsm) after three weeks, while the onset of decay of mask type C (28 gsm) was delayed until six weeks after exposure (Figure 17). Among mask type B the decay progressed slowly between week three and week six and then accelerated until the overnight wind event between days 53 and 54, which caused substantial fabric loss (Figure 17). After that, event decay progressed more rapidly, with an endpoint loss of between 75 and 81.5% of the total surface area (Appendix A). Mask type C also showed slow progress of decay until the wind event, followed by a faster rate of progress (Figure 17) with an endpoint loss between 64 and 76% of the total surface area (Appendix A). The decay curves for mask types B and C are very strongly correlated (Spearman’s r = 0.9121). While the fabric loss during the wind event was more extensive among type C masks, it contributed to 30% surface loss in both mask types.

Figure 17.
Progress of decay of fabric. Loss expressed in % of the visible surface area of mask type B (verso) and type C (recto). Note the sudden increase in the loss at day 54, following the overnight wind event.
3.4.2. Melt Blown Fabric
In the structure of a mask, the filter layer, which is comprised of melt-blown fabric, is sandwiched between and protected by two spunbond layers. Consequently, any assessment of the decay of the melt-blown fabric layer needs to take into account that the actual fiber loss after breakdown may be reduced as loose fibers may be caught and retained between the spunbond layers until such time that the spunbond layer ruptures. The assessment documented the extent of layer disintegration as evidenced by cracking (Appendix B, Figure 18) and the amount of loss (Appendix C, Figure 19). It should be noted that any observable ‘loss’ may also entail a breakdown of the fabric with fragments sliding behind intact sections of the melt-blown layer thereby being ‘out of sight’. Not surprisingly then, the decay curves for the spunbonded fabric (Figure 17) are very strongly correlated with the curves for the loss of melt-blown fabric (Figure 19) for mask type B (Spearman’s r = 0.9578) and type C (r = 0.9056).

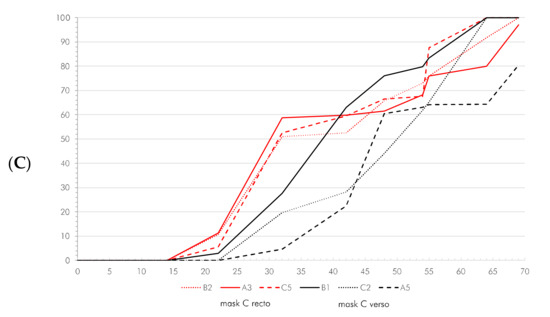
Figure 18.
Progress of decay of melt-blown fabric. Fragmentation and loss are expressed in % of visible surface area. (A) Mask A recto and verso; (B) mask B recto; and (C) mask C recto and verso.
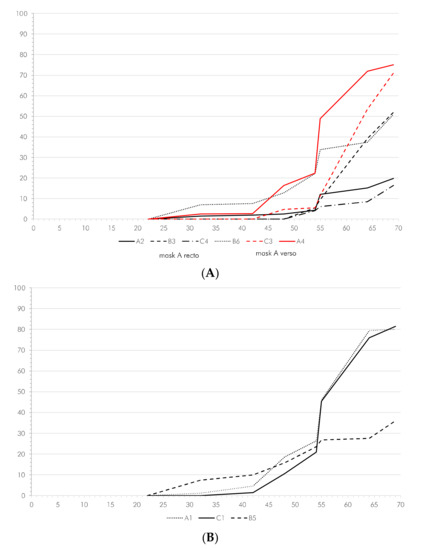
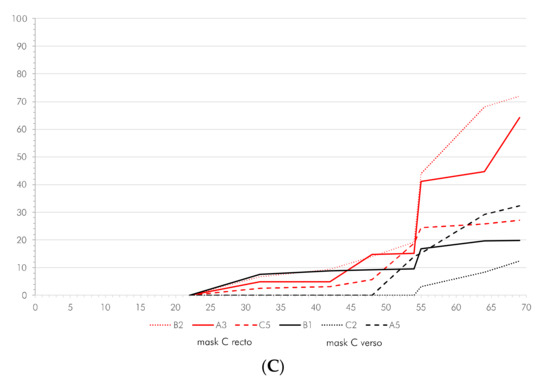
Figure 19.
Progress of decay of melt-blown fabric. Loss expressed in % of visible surface area. (A) Mask A recto and verso; (B) mask B recto; and (C) mask C recto and verso.
The cracking on the melt-blown fabric does not commence until after week 3, with the exception of mask type C where cracking commences after week 2 (Appendix B, Figure 18). Mask type A shows a faster and steady rate of cracking on the verso side than on the recto side where rapid decay seems to be delayed until week 7 (Figure 18). The loss of melt-blown fabric among mask type A commenced after week 22 but progressed slowly until the overnight wind event when some replicates showed a dramatic increase (Figure 19). The development of cracking and loss over time is strongly correlated for the recto (Spearman’s r = 0.8316) and very strongly correlated for the verso side (r = 0.9549).
Both faces of mask type C show a more linear increase in cracking of the melt-blown fabric than type A masks (Figure 18), with the decay of both the recto and verso side showing a very strong correlation (Spearman’s r = 0.9112). The loss of melt-blown fabric among mask type C also commenced after week 22, with slow progress until the overnight wind event which affected the exposed recto side more than the verso side (Figure 19). The decay curves show a strong correlation (r = 0.8230). Overall, the development of cracking and loss over time is strongly correlated for the verso side (Spearman’s r = 0.8260) and very strongly correlated for the recto side (r = 0.9358).
Mask type B is an exception, as the white-colored recto side does not exhibit any indication of cracking of the melt-blown fabric layer. The decay of the melt-blown fabric on the blue-colored verso side commences after 3 weeks and progresses rapidly after week 6, followed by a marked jump, due to the wind event, and a steep increase in the rate of decay thereafter (Figure 18 and Figure 19). The decay rates of cracking and loss of the melt-blown fabric are very strongly correlated (Spearman’s r = 0.9385).
While for mask type B (verso), the amount of cracking of the melt-blown fabric and the loss of spunbonded fabric are very strongly correlated (Spearman’s r = 0.9660), while the correlation is only moderate for mask type C (recto) (r = 0.7410). A comparison of the decay rate of the melt-blown fabric of both mask types shows a very strong correlation (r = 0. 9668), suggesting that the differences may rest either in differential UV filtering or in the fact that the spunbonded fabric used for mask type C is marginally heavier than that used for mask type B (28 gsm vs. 27 gsm).
In an attempt at further quantifying the discharge of microfibers, the final weights of the masks, once removed from the MDF board, were compared with control samples. The average differences in weights were not uniform and these data are inconclusive. In four instances, the weight loss ranged between 1.1% and 7.2%, with significant differences observed for mask type A recto and mask type B verso (Table 1). In two of the six masks and exposed side combinations, however, the masks were in fact heavier than the controls. This was the case for mask type B, exposed with their (white) recto side, and significantly so for mask type C exposed with their (white) verso side (Table 1). It can be surmised that the exposed fabric of these masks trapped fine mineral dust, either cumulatively or during the wind event.

Table 1.
Weight (in g) of controls and exposed masks and average weight loss (in %) at the end of the experiment. Significance based on two-tailed t-test.
4. Discussion
Factors that influence the environmental degradation of the mask fabric are photo-oxidation, the effects of which can be accelerated and exacerbated by thermal expansion and contraction, and differential heat absorption. The underlying primary process of environmental weathering is photo-oxidation, which causes the polymer chains to break, resulting in the material becoming increasingly brittle [26,27].
As noted in the introduction, the majority of research on UV degradation of polypropylene investigated the processes under accelerated laboratory conditions [1,2,3,4,5,6,7,8,9], often when exploring different polymer additives. As the majority of laboratory-based studies exposed the masks to UV radiation only for a short time, they are unsuitable to assess the structural breakdown of masks in the environment. As observed in this study, the photo-oxidative decay of polypropylene spunbond fibers becomes visible after 21 days and accelerates thereafter. It should be noted, however, that microfiber shedding occurs after a short time of use due to physical impact, and increases if masks are exposed to UV or solar radiation {Li, 2021 #1588} The majority of studies of mask decay in the environment are primarily observational studies [10,11,12]. Exceptions to this are few and most have methodological limitations.
Rathinamoorthy and Balasaraswathi examined the stability of an unstated number of new masks exposed to the environment for 30 days [12] and then subjected them to rubbing tests to assess the number of fibers shed. Again, as the result of the masks after exposure but before physical manipulation was not documented, the study does not provide useful comparative data. While the rubbing tests are intriguing, they are not replicable, as only the number of events was predetermined but not the applied force or the length and direction of the rubbing movement in relation to the fabric and pleats. The direction of abrasion matters since much of the spunbonded fabric exhibits a linear arrangement of fibers even though the filaments are theoretically deposited in an irregular fashion [19].
Saliu et al. carried out laboratory tests on seven different masks obtained from Italian supermarkets and also examined masks sampled from Italian beaches [13]. In addition to seawater immersion tests of the purchased masks, the authors exposed purchased mask samples (single sample, no replicates) to 16 cycles of 10-h exposures to UV-A and then to subsequent immersion in simulated turbulent seawater. As the resulting condition of the UV-exposed masks was not documented, the study does not provide useful comparative data.
Another study, by De-la-Torre et al., extracted used and discarded masks from the marine environment and used them for exposure studies and detailed assessment of subsequent decay [14]. While informative, the study did not control for the specific manufacture of the masks, the duration of exposure to the environment before collection, or the nature of the environment they were from, i.e., “sandy and/or rocky beaches” [14], and, thus, the physical impact they had been exposed to.
A fundamental problem inherent in using found masks for experimentation is the lack of data on how, how long, and in which environments these masks were used. While these masks are single use masks, there is ample evidence that people not only reuse masks for the duration of a day but often for several days as well as wash and re-use them [15,16,17,18]. Thus, even if the masks were to come from the same manufactured batch, their ‘use life histories’ and, thus, the physical and chemical forces that impact them during use will differ.
Further, given the large number of mask manufacturers (an online portal for Chinese manufacturing listed over 1500 suppliers of surgical type face masks in January 2022 [20]) who use polypropylene fabric of different densities and manufacturing processes, as well as polypropylene with different chemical composition in the form of stabilizing additives, it is virtually impossible to compare laboratory samples with masks that have been found in the environment. Indeed, a study of the physical appearance and manufacturing details of 71 different masks from 47 different manufacturers showed substantial variation in physical characteristics [21].
4.1. Processes of Observed Decay: Thermal Expansion and Contraction
Assuming a thermal expansion coefficient for polypropylene (at 20 °C) of 150 × 10−6 K−1 for linear expansion and 450 × 10−6 K−1 for volumetric expansion, and using the climatic data for the exposure period [55], the linear thermal expansion is on average 0.088 ± 0.024% (range: 0.016–0.129%) and the volumetric expansion is 0.264 ± 0.071% (range: 0.048–0.386%).
The actual variations between the temperatures in the sun and the shade are considerable, however, as two sample points may indicate. At 3 p.m. on day 54, the daytime temp in the shade measured 24 °C, while the temperature in the direct sun was 40 °C. At noon on day 55, the measurements were 24 °C in the shade but 50 °C in the direct sun. Thus, the diurnal temperature variation of objects placed directly in the sun will be considerably greater than that expressed by meteorological recordings. In the case of day 55, the temperatures of the preceding and following night were 12.8 °C each, representing a 37.2 °C thermal range. This equates to a 0.26% linear and 0.78% volumetric thermal expansion.
As the thermal contraction and expansion are comparatively small, the impact on the fibers will be limited, irrespective of whether the thermal range that occurs is gradual or rapid [23]. Even though the fabric is comparatively unconstrained, the physical impact on linear expansion and contraction on spunbond fabric rests in the fact that the spunbond fibers are fixed by the thermal bonding points into short-length segments (Figure 2). The majority of the fibers are 1 mm to 3 mm long before they are terminated at another binding point. Fibers longer than 5 mm exist but are extremely rare. In consequence, the thermal expansion places greater stresses on the short-length fibers than on the longer lengths which have more room to flex. The stresses are the greatest at the thermal bonding points, leading to eventual structural failure.
The Effects of Color
A major difference could be observed among masks B and C, where the light-blue-colored side is far more susceptible to decay than the white-colored side. This cannot be explained by differences in fabric strength alone as their fabric weights differ only marginally: the light blue layer of mask B (mask C) has a density of 27 gsm (28 gsm), while the white layer has a near-equivalent density of 28 gsm (26 gsm) (see above). Even though the blue is only a light blue (mask B: 1020-B10G; mask C: 0030-B10G [49]), the reflectiveness of the color is less than that of white, resulting in a higher heat absorption [56], which in turn will have some effect of thermal expansion. Given the lightness of the blue, however, that effect is likely to be minimal.
The fabric used for the external side of the mask is usually moisture-repellent, while the fabric used for the side facing the wearer is usually moisture-absorbent. Polypropylene is an electret where the net electric dipole moment can be enhanced with additional charging [14]. That charge is not stable but undergoes significant degradation, however, when exposed to increasing temperature, especially when coupled with moisture [57].
As immersion in pure water does not affect the charge of the electret fibers [58], the degrading agents are likely to be environmental salts dissolved in rainwater as well as mechanical forces [23].
In addition, the increased susceptibility of the light-blue colored side to UV decay may be due to differences in the chemical structure of the polypropylene polymer used for the spunbond fabric. It is possible that the decay is caused either by the nature of the dye used or by the process of dyeing, in particular the dyeing temperature [59]. Further, as noted earlier, it can be speculated that added pigments, such as titanium dioxide in white plastics, may have antioxidant properties which would affect the rate of decay.
4.2. Spunbond vs. Melt-Blown Fabric
While degradation through photo-oxidation could only be noted for the blue-colored spunbond fabric of masks B and C, two of the masks (A and C) exhibited photo-oxidative decay of the melt-blown layer, irrespective of which mask face was exposed to the elements (Appendix B) and despite the fact that the melt-blown layer was sandwiched between spunbond fabric that was unaffected by photo-oxidation. A breakdown of the melt-blown layer while the spunbond layers were still intact has also been observed in field observations [38]. Mask B, on the other hand, exhibits no damage to the melt-blown fabric. The difference can be explained by the nature of the spunbond fabric. While the pattern of the spunbond fabric of masks A and C exhibits a considerable number of sufficiently wide interstices for UV radiation to penetrate, the external spunbond fabric of both the recto and verso side of mask B is made up of thinner fibers that are laid in a denser fashion with fewer and far smaller interstices, thereby reducing penetration by UV radiation (Figure 2).
The observed loss of melt-blown fabric of masks A and C, while the spunbond fabric remained intact (Appendix A), suggests not only a separation of the fibers in the fabric but also embrittlement and fragmentation of the fibers themselves, which then escaped through the interstices.
4.3. Duration of Exposure
Several laboratory-based studies have shown that short-term exposure to UV has no impact [45,46,47]. The observations made in this experiment confirm that short-term exposure has no discernible effect. The progress of photo-oxidation is governed not only by UV wavelength and intensity but also by the cumulative total solar radiation that the polymer receives over time [26,27]. Indeed, the degrading effect of photo-oxidation observed in this experiment had a slow onset followed by an exponential rate of decay. Mechanical forces through thermal expansion and contraction of the fibers, or external agencies, such as wind/vehicle draught or the impact of raindrops, will cause physical breakage of the embrittled fibers into small fragments. Wind, in particular, will cause an intermittent stress loading on protruding elements, with fibers in the same area subjected to repeated mechanical force, breaking weakened fibers.
4.4. Limitations
This study has some limitations. This experiment used new, unused masks drawn from unopened packets. Yet, almost all lost or discarded masks encountered in the open environment had been worn/used [8]. While surgical-type masks are meant to be single use only, many people wear them repeatedly for a prolonged period of time [60,61,62,63]. This reuse was encouraged to reduce the waste footprint. In addition, a number of studies considered disinfection treatments to encourage reuse [64,65]. Clearly, while surgical-type masks are designed not to disintegrate over the short term, wear and tear through use will affect their performance and structural integrity. In addition, as the experiment commenced in February, it did not expose the masks to the maxima of daily UV radiation and temperatures, which occur from December to January. Thus, it can be posited that the decay of worn masks in the environment can be quicker, or more pronounced, than that of the masks assessed in the experiment.
Finally, the fact that the masks were fixed to the MDF board made them stationary. In a ‘real life’ scenario, masks, especially those that had been worn (and thus had their pleats unfolded) would be moved about by the wind (or draught caused by vehicles) until such time that they become trapped in vegetation. In consequence, these masks would be exposed to an increased amount of physical impact which would speed up their disintegration, in particular, that of the melt-blown filter layer with its lesser tensile strength.
4.5. Surgical-Type Face Masks as Contributors to the Microplastics Problem
In recent years, microplastics, i.e., particle fragments of artificial polymers of between 1 nm and 5 mm in size or fiber fragments between 3 nm and 15 mm in length [66], have been increasingly recognized as a major problem of long-term pollution of both aquatic [67,68,69] and terrestrial environments [70,71]. Microplastics have been found ingested in all trophic levels of the food web [72,73,74]. Sources of the microplastics range from intentional additives to cosmetics and personal care products, in the form of microbeads [75,76], to physical and chemical degradation products derived from discarded manufactured items such as plastic containers, bags, and fishing nets; or derived from the wear and tear of polymers used in clothing or vehicle tires. Unless produced on a nanometer scale as microbeads, microplastics follow a gradual degradation trajectory from a complete item of varied size to ever smaller fragments due to mechanical impact and abrasion.
The surgical-type face masks which were produced in the billions to reduce the risk of aerosol transmission of SARS-CoV-2 differ fundamentally from other sources of microplastics. Setting aside the ear loops, which are made from braided polypropylene, the face masks manufactured are comprised of short-length microfibers which are thermally bonded with (spunbonded) or without (melt-blown) heated raised node points. Due to the lack of thermal bonding points, the melt-blown fabric has low tensile strength and, as the experiments have shown, thus ruptures readily even when stationary. Photo-oxidation degrades the spunbonded fabric, resulting in shredded macro-fragments (which will further degrade) as well as ‘large’ pieces of microplastics represented by the 1 mm-sized thermal bonding points and a large quantity of smaller short-length polypropylene fibers. Some parts of the masks have a greater resistance to decay, such as the welded seams, but if exposed for long enough, they too will disintegrate into micro fragments, the largest being the individual 1 mm-sized weld points [38].
Effectively, in volumetric terms, the decay of surgical-type face masks exposed to ultraviolet light proceeds straight from an intact mask to an overwhelming quantity of microplastics without any intermediate sizes (setting aside seams and ear loops). On a practical level, therefore, as the wind event on day 53/54 has shown, the physical impact on masks that have been allowed to decay in place for several weeks will have catastrophic effects on the integrity of some fabrics. With this in mind, it can be posited that the mechanical removal of such masks from the environment (by picking them up by hand or with a pick-up tool) will result in the shedding of microfibers and macro fragments too small to be retrieved individually.
5. Conclusions
Single use surgical-type face masks, the most ubiquitous type of fitted face covering worn during the COVID-19 pandemic, are susceptible to environmental decay once they are lost or intentionally discarded in the environment. The mask fabric primarily degrades through photo-oxidation initiated by exposure to UV, leading to embrittlement of the fibers. The subsequent breakage is accelerated through thermal expansion and contraction of the fibers, but particularly so through mechanical impact derived from rainfall and, especially, wind. The study has shown that the initial progress of decay is not linear. The onset of macroscopically observable decay starts after three weeks of exposure and becomes noticeable after four to five weeks. Thereafter, the rate of decay accelerates exponentially, generating a multitude of microplastics, mainly in the sub-2 mm range for spun-bond fabric. The experiments demonstrated a differential decay between the spunbonded and the melt-blown fabric, which cracks and breaks down much faster, most likely due to thinner fibers of shorter length and the lack of thermal bonding points.
Moreover, the experiment showed that while a cursory observation may suggest that decaying masks may still be intact in their shape, as evidenced by the external spunbond, the integrity of the melt-blown filter layer is not only compromised, but the disintegrating fabric generates microplastics in the sub-1 mm range which escape through the interstices of the spunbond fabric.
The longer a mask is subjected to UV, the faster the mask will shed microplastics that are readily dispersed by wind action. Essentially, the sooner a discarded or lost mask is removed from the open environment, the better. This experiment has highlighted the fact that municipal agencies have only a short window of time to remove stray face masks from the urban environment if micro-fiber pollution is to be reduced or even prevented.
Funding
This research received no external funding.
Data Availability Statement
All data can be found in the main text.
Acknowledgments
The author extends thanks to Mohsin Iqbal (Softmed) for the details of the fabric used for the manufacture of that company’s masks.
Conflicts of Interest
The author declares no conflict of interest.
Appendix A
Progress of decay of spunbond fabric. Loss expressed in % of visible surface area. Masks not listed show no decay.
| Side | Day | ||||||||||
| Mask | Face-Up | Color | 22 | 32 | 42 | 48 | 54 | 55 | 64 | 69 | |
| A | recto | white | A2 | — | — | — | — | — | — | — | — |
| A | recto | white | B3 | — | — | — | — | — | — | — | — |
| A | recto | white | C4 | — | — | — | — | — | — | — | — |
| A | recto | white | B6 | — | — | — | — | — | — | — | — |
| A | verso | white | C3 | — | — | — | — | — | — | — | — |
| A | verso | white | A4 | — | — | — | — | — | — | — | — |
| B | recto | white | A6 | — | — | — | — | — | — | — | — |
| B | recto | white | B4 | — | — | — | — | — | — | — | — |
| B | recto | white | C6 | — | — | — | — | — | — | — | — |
| B | verso | blue | A1 | — | 2.50 | 2.63 | 16.38 | 22.38 | 48.88 | 72.00 | 75.00 |
| B | verso | blue | C1 | — | 1.13 | 4.63 | 18.63 | 26.38 | 46.00 | 78.13 | 80.00 |
| B | verso | blue | B5 | — | 0.63 | 2.88 | 15.50 | 21.00 | 45.38 | 76.00 | 81.50 |
| C | recto | blue | B2 | — | — | — | 3.13 | 3.88 | 37.88 | 52.00 | 76.00 |
| C | recto | blue | A3 | — | — | — | — | 2.00 | 38.25 | 55.25 | 64.00 |
| C | recto | blue | C5 | — | — | — | — | 7.25 | 40.38 | 42.50 | 64.13 |
| C | verso | white | B1 | — | — | — | — | — | — | — | — |
| C | verso | white | C2 | — | — | — | — | — | — | — | — |
| C | verso | white | A5 | — | — | — | — | — | — | — | — |
Appendix B
Progress of decay of melt-blown fabric. Fragmentation and loss expressed in % of visible surface area.
| Side | Day | ||||||||||
| Mask | Face-Up | Color | 22 | 32 | 42 | 48 | 54 | 55 | 64 | 69 | |
| A | recto | white | A2 | 4.63 | 9.63 | 18.13 | 24.38 | 63.25 | 63.25 | 65.50 | 90.63 |
| A | recto | white | B3 | — | 6.88 | 12.38 | 14.25 | 80.50 | 100.00 | 100.00 | 100.00 |
| A | recto | white | C4 | — | 7.75 | 18.13 | 20.13 | 38.50 | 41.50 | 72.00 | 91.00 |
| A | recto | white | B6 | — | 6.25 | 23.13 | 16.25 | 49.13 | 55.25 | 56.00 | 79.38 |
| A | verso | white | C3 | — | 22.88 | 56.88 | 77.00 | 79.75 | 84.75 | 100.00 | 100.00 |
| A | verso | white | A4 | — | 13.63 | 43.50 | 83.00 | 89.25 | 93.50 | 100.00 | 100.00 |
| B | recto | white | A6 | — | — | — | — | — | — | — | — |
| B | recto | white | B4 | — | — | — | — | — | — | — | — |
| B | recto | white | C6 | — | — | — | — | — | — | — | — |
| B | verso | blue | A1 | — | 2.50 | 2.63 | 16.38 | 22.38 | 48.88 | 72.00 | 75.00 |
| B | verso | blue | C1 | — | 1.13 | 4.63 | 18.63 | 26.38 | 46.75 | 80.00 | 80.00 |
| B | verso | blue | B5 | — | 7.38 | 10.00 | 65.38 | 66.50 | 67.50 | 80.00 | 81.50 |
| C | recto | blue | B2 | 10.63 | 51.00 | 52.50 | 65.63 | 73.00 | 76.00 | 91.75 | 100.00 |
| C | recto | blue | A3 | 11.25 | 58.75 | 59.75 | 61.50 | 68.25 | 76.00 | 80.00 | 97.00 |
| C | recto | blue | C5 | 5.63 | 52.50 | 59.50 | 66.50 | 67.50 | 87.50 | 100.00 | 100.00 |
| C | verso | white | B1 | 2.88 | 27.50 | 63.00 | 76.13 | 79.88 | 83.38 | 100.00 | 100.00 |
| C | verso | white | C2 | — | 19.63 | 28.25 | 44.00 | 61.75 | 65.25 | 100.00 | 100.00 |
| C | verso | white | A5 | — | 4.63 | 22.50 | 60.50 | 63.00 | 64.13 | 64.38 | 80.50 |
Appendix C
Progress of decay of melt-blown fabric. Loss expressed in % of visible surface area.
| Side | Day | ||||||||||
| Mask | Face-Up | Color | 22 | 32 | 42 | 48 | 54 | 55 | 64 | 69 | |
| A | recto | white | A2 | — | 1.50 | 1.88 | 2.50 | 4.25 | 12.13 | 15.25 | 19.75 |
| A | recto | white | B3 | — | — | — | — | 5.50 | 9.50 | 39.13 | 52.00 |
| A | recto | white | C4 | — | — | — | — | 4.13 | 6.13 | 8.50 | 16.38 |
| A | recto | white | B6 | — | 7.00 | 7.63 | 12.75 | 22.25 | 33.75 | 37.38 | 50.88 |
| A | verso | white | C3 | — | — | — | 4.75 | 5.50 | 11.50 | 53.50 | 71.13 |
| A | verso | white | A4 | — | 2.50 | 2.63 | 16.38 | 22.38 | 48.88 | 72.00 | 75.00 |
| B | recto | white | A6 | — | — | — | — | — | — | — | — |
| B | recto | white | B4 | — | — | — | — | — | — | — | — |
| B | recto | white | C6 | — | — | — | — | — | — | — | — |
| B | verso | blue | A1 | — | 1.13 | 4.63 | 18.63 | 26.38 | 46.00 | 79.38 | 80.00 |
| B | verso | blue | C1 | — | — | 1.50 | 10.63 | 21.00 | 45.38 | 76.00 | 81.50 |
| B | verso | blue | B5 | — | 7.38 | 10.00 | 15.75 | 23.50 | 26.75 | 27.50 | 36.00 |
| C | recto | blue | B2 | — | 6.63 | 9.38 | 14.00 | 19.25 | 43.88 | 68.00 | 72.00 |
| C | recto | blue | A3 | — | 4.88 | 4.88 | 14.75 | 15.25 | 41.13 | 44.75 | 64.13 |
| C | recto | blue | C5 | — | 2.50 | 3.13 | 5.63 | 18.75 | 24.38 | 25.75 | 27.13 |
| C | verso | white | B1 | — | 7.63 | 8.75 | 9.25 | 9.50 | 16.88 | 19.63 | 19.88 |
| C | verso | white | C2 | — | — | — | — | — | 3.13 | 8.38 | 12.38 |
| C | verso | white | A5 | — | — | — | — | 14.00 | 15.13 | 29.25 | 32.38 |
References
- Storen, R.; Corrigan, N. COVID-19: A Chronology of State and Territory Government Announcements (up Until 30 June 2020); Parliamentary Library, Commonwealth of Australia: Canberra, ACT, Australia, 2020.
- Spennemann, D.H.R. Collecting COVID-19 Ephemera: A Photographic Documentation of Examples from Regional Australia; Institute for Land, Water and Society, Charles Sturt University: Albury, NSW, Australia, 2021. [Google Scholar]
- Spennemann, D.H.R. Facing COVID-19: Quantifying the use of reusable vs disposable facemasks. Hygiene 2021, 1, 120–128. [Google Scholar] [CrossRef]
- Spennemann, D.H.R. A Rapid Observational Survey of Face Mask Use in a Major Shopping Centre in Melbourne (Victoria); Institute for Land, Water and Society, Charles Sturt University: Albury, NSW, Australia, 2021. [Google Scholar]
- Spennemann, D.H.R. A Rapid Observational Survey of Face Mask Use in a Major Shopping Centre in Sydney (New South Wales); Institute for Land, Water and Society, Charles Sturt University: Albury, NSW, Australia, 2022. [Google Scholar]
- MedicalXpress. China exported more than 220 Billion Masks in 2020: Government. Available online: https://medicalxpress.com/news/2021-01-china-exported-billion-masks.html (accessed on 15 May 2022).
- Spennemann, D.H.R. COVID face masks: Policy shift results in increased littering. Sustainability 2021, 13, 9875. [Google Scholar] [CrossRef]
- Spennemann, D.H.R. Patterns of a Pandemic. A Documentation of COVID-19 Masks Sold, Lost and Discarded in a Regional Australian city; Institute for Land, Water and Society, Charles Sturt University: Albury, NSW, Australia, 2021; p. 164. [Google Scholar]
- Spennemann, D.H.R. COVID-19 Face Masks as a Long-Term Source of Microplastics in Recycled Urban Green Waste. Sustainability 2022, 14, 207. [Google Scholar] [CrossRef]
- Forouzandeh, P.; O’Dowd, K.; Pillai, S.C. Face masks and respirators in the fight against the COVID-19 pandemic: An overview of the standards and testing methods. Saf. Sci. 2021, 133, 104995. [Google Scholar] [CrossRef] [PubMed]
- Liao, M.; Liu, H.; Wang, X.; Hu, X.; Huang, Y.; Liu, X.; Brenan, K.; Mecha, J.; Nirmalan, M.; Lu, J.R. A technical review of face mask wearing in preventing respiratory COVID-19 transmission. Curr. Opin. Colloid Interface Sci. 2021, 52, 101417. [Google Scholar] [CrossRef] [PubMed]
- Kellie, G. Advances in Technical Nonwovens; Woodhead Publishing: Cambridge, UK, 2016. [Google Scholar]
- Essa, W.K.; Yasin, S.A.; Saeed, I.A.; Ali, G.A. Nanofiber-based face masks and respirators as COVID-19 protection: A review. Membranes 2021, 11, 250. [Google Scholar] [CrossRef] [PubMed]
- Sessler, G.M. Physical principles of electrets. In Electrets; Sessler, G.M., Ed.; Topics in Applied Physics; Springer: Berlin/Heidelberg, Germany, 1980; Volume 33, pp. 13–80. [Google Scholar]
- Wu, P.; Li, J.; Lu, X.; Tang, Y.; Cai, Z. Release of tens of thousands of microfibers from discarded face masks under simulated environmental conditions. Sci. Total Environ. 2022, 806, 150458. [Google Scholar] [CrossRef]
- Spennemann, D.H.R. The Material Culture of the COVID-19 Pandemic. A Photographic Documentation of the Mechanical Degradation of Single-Use Surgical Face Masks on Road Surfaces; SAEVS, Charles Sturt University: Albury, NSW, Australia, 2022. [Google Scholar]
- Spennemann, D.H.R. The Material Culture of the COVID-19 Pandemic. A Photographic Documentation of the Mechanical Degradation of Single-Use Surgical Face Masks embedded in Bitumen Patches on Road Surfaces; SAEVS, Charles Sturt University: Albury, NSW, Australia, 2022. [Google Scholar]
- Saliu, F.; Veronelli, M.; Raguso, C.; Barana, D.; Galli, P.; Lasagni, M. The release process of microfibers: From surgical face masks into the marine environment. Environ. Adv. 2021, 4, 100042. [Google Scholar] [CrossRef]
- Shen, M.; Zeng, Z.; Song, B.; Yi, H.; Hu, T.; Zhang, Y.; Zeng, G.; Xiao, R. Neglected microplastics pollution in global COVID-19: Disposable surgical masks. Sci. Total Environ. 2021, 790, 148130. [Google Scholar] [CrossRef]
- Liang, H.; Ji, Y.; Ge, W.; Wu, J.; Song, N.; Yin, Z.; Chai, C. Release kinetics of microplastics from disposable face masks into the aqueous environment. Sci. Total Environ. 2022, 816, 151650. [Google Scholar] [CrossRef]
- Pizarro-Ortega, C.I.; Dioses-Salinas, D.C.; Severini, M.D.F.; López, A.F.; Rimondino, G.N.; Benson, N.U.; Dobaradaran, S.; De-la-Torre, G.E. Degradation of plastics associated with the COVID-19 pandemic. Mar. Pollut. Bull. 2022, 176, 113474. [Google Scholar] [CrossRef] [PubMed]
- Rathinamoorthy, R.; Balasaraswathi, S.R. Disposable tri-layer masks and microfiber pollution–an experimental analysis on dry and wet state emission. Sci. Total Environ. 2022, 816, 151562. [Google Scholar] [CrossRef] [PubMed]
- Spennemann, D.H.R. The Material Culture of the COVID-19 Pandemic. The impact of Freeze-Thaw Action on the Structural Integrity of Single-Use-Use SURGICAL Face Masks; SAEVS, Charles Sturt University: Albury, NSW, Australia, 2022. [Google Scholar]
- Sales, E.; Mulatier, N.; Wittmann, L.; Fernandes, A.; Vacher, B.; Penuelas, J. Effect of dry heat treatment between room temperature and 160 °C on surgical mask. Mater. Lett. 2021, 308, 131270. [Google Scholar] [CrossRef] [PubMed]
- Wang, D.; Sun, B.-C.; Wang, J.-X.; Zhou, Y.-Y.; Chen, Z.-W.; Fang, Y.; Yue, W.-H.; Liu, S.-M.; Liu, K.-Y.; Zeng, X.-F. Can masks be reused after hot water decontamination during the COVID-19 pandemic? Engineering 2020, 6, 1115–1121. [Google Scholar] [CrossRef]
- Rajakumar, K.; Sarasvathy, V.; Chelvan, A.T.; Chitra, R.; Vijayakumar, C. Natural weathering studies of polypropylene. J. Polym. Environ. 2009, 17, 191–202. [Google Scholar] [CrossRef]
- Feldman, D. Polymer Weathering: Photo-Oxidation. J. Polym. Environ. 2002, 10, 163–173. [Google Scholar] [CrossRef]
- Shimizu, K.; Tokuta, Y.; Oishi, A.; Kuriyama, T.; Kunioka, M. Weatherability of polypropylene by accelerated weathering tests and outdoor exposure tests in Japan. J. Polym. 2016, 2016, 6539567. [Google Scholar] [CrossRef]
- Yang, X.; Ding, X. Prediction of outdoor weathering performance of polypropylene filaments by accelerated weathering tests. Geotext. Geomembr. 2006, 24, 103–109. [Google Scholar] [CrossRef]
- Lv, Y.; Huang, Y.; Kong, M.; Yang, Q.; Li, G. Multivariate correlation analysis of outdoor weathering behavior of polypropylene under diverse climate scenarios. Polym. Test. 2017, 64, 65–76. [Google Scholar] [CrossRef]
- Cheng, F.; Zhang, T.; Liu, Y.; Zhang, Y.; Qu, J. Non-Negligible Effects of UV Irradiation on Transformation and Environmental Risks of Microplastics in the Water Environment. J. Xenobiot. 2021, 12, 1–12. [Google Scholar] [CrossRef]
- Song, Y.K.; Hong, S.H.; Jang, M.; Han, G.M.; Jung, S.W.; Shim, W.J. Combined effects of UV exposure duration and mechanical abrasion on microplastic fragmentation by polymer type. Environ. Sci. Technol. 2017, 51, 4368–4376. [Google Scholar] [CrossRef] [PubMed]
- Andrady, A.; Pegram, J.; Tropsha, Y. Changes in carbonyl index and average molecular weight on embrittlement of enhanced-photodegradable polyethylenes. J. Environ. Polym. Degrad. 1993, 1, 171–179. [Google Scholar] [CrossRef]
- Richaud, E.; Farcas, F.; Divet, L.; Benneton, J.P. Accelerated ageing of polypropylene geotextiles, the effect of temperature, oxygen pressure and aqueous media on fibers—Methodological aspects. Geotext. Geomembr. 2008, 26, 71–81. [Google Scholar] [CrossRef]
- Valentin, C.A.; Kobelnik, M.; Franco, Y.B.; Lavoie, F.L.; Silva, J.L.d.; Luz, M.P.d. Study of the ultraviolet effect and thermal analysis on polypropylene nonwoven geotextile. Materials 2021, 14, 1080. [Google Scholar] [CrossRef] [PubMed]
- Rabello, M.; White, J. The role of physical structure and morphology in the photodegradation behaviour of polypropylene. Polym. Degrad. Stab. 1997, 56, 55–73. [Google Scholar] [CrossRef]
- Zhang, G.; Xiao, Y.; Yan, J.; Xie, N.; Liu, R.; Zhang, Y. Ultraviolet Light-degradation Behavior and Antibacterial Activity of Polypropylene/ZnO Nanoparticles Fibers. Polymers 2019, 11, 1841. [Google Scholar] [CrossRef] [Green Version]
- Spennemann, D.H.R. The Material Culture of the COVID-19 Pandemic. A Photographic Documentation of UV Degradation of Discarded Single-Use Surgical Face Masks; SAEVS, Charles Sturt University: Albury, NSW, Australia, 2022. [Google Scholar]
- Fadare, O.O.; Okoffo, E.D. COVID-19 face masks: A potential source of microplastic fibers in the environment. Sci. Total Environ. 2020, 737, 140279. [Google Scholar] [CrossRef]
- Carneiro, J.R.; Almeida, P.J.; de Lurdes Lopes, M. Evaluation of the resistance of a polypropylene geotextile against ultraviolet radiation. Microsc. Microanal. 2019, 25, 196–202. [Google Scholar] [CrossRef]
- Aparicio-Ardila, M.A.; Pedroso, G.O.M.; Kobelnik, M.; Valentin, C.A.; da Luz, M.P.; Lins da Silva, J. Evaluating the Degradation of a Nonwoven Polypropylene Geotextile Exposed to Natural Weathering for 3 Years. Int. J. Geosynth. Ground Eng. 2021, 7, 69. [Google Scholar] [CrossRef]
- Guimarães, M.; de Mattos Vidal, D.; de Carvalho Urashima, D.; Castro, C. Degradation of polypropylene woven geotextile: Tensile creep and weathering. Geosynth. Int. 2017, 24, 213–223. [Google Scholar] [CrossRef]
- Rivaton, A.; Gardette, J.L.; Mailhot, B.; Morlat-Therlas, S. Basic aspects of polymer degradation. In Macromolecular Symposia; WILEY-VCH: Weinheim, Germany, 2005; pp. 129–146. [Google Scholar]
- Rabek, J.F. Polymer Photodegradation: Mechanisms and Experimental Methods; Springer Science & Business Media: Berlin, Germany, 1994. [Google Scholar]
- Zhao, Z.; Zhang, Z.; Lanzarini-Lopes, M.; Sinha, S.; Rho, H.; Herckes, P.; Westerhoff, P. Germicidal Ultraviolet Light Does Not Damage or Impede Performance of N95 Masks Upon Multiple Uses. Environ. Sci. Technol. Lett. 2020, 7, 600–605. [Google Scholar] [CrossRef]
- Nicolau, T.; Filho, N.G.; Zille, A. Ultraviolet-C as a Viable Reprocessing Method for Disposable Masks and Filtering Facepiece Respirators. Polymers 2021, 13, 801. [Google Scholar] [CrossRef] [PubMed]
- Purschke, M.; Elsamaloty, M.; Wilde, J.P.; Starr, N.; Anderson, R.R.; Farinelli, W.A.; Sakamoto, F.H.; Tung, M.; Tam, J.; Hesselink, L. Construction and validation of UV-C decontamination cabinets for filtering facepiece respirators. Appl. Opt. 2020, 59, 7585–7595. [Google Scholar] [CrossRef] [PubMed]
- Spennemann, D.H.R. The archaeological signature of single-use surgical face masks, the most ubiquitous artefact of the COVID-19 pandemic. Heritage 2021, 4, 2140–2162. [Google Scholar] [CrossRef]
- Färginstitutet. Natural Colour System Index; Skandinaviska Färginstitutet AG: Stockholm, Sweden, 1985. [Google Scholar]
- Alpine MDF. Alpine MDF Premium Panels; Alpine MDF Industries Pty Ltd.: North Wangaratta, VIC, Australia, 2011. [Google Scholar]
- Australian Building Codes Board. Climate Zone Map Australia Wide. Available online: https://www.abcb.gov.au/Resources/Tools-Calculators/Climate-Zone-Map-Australia-Wide (accessed on 15 May 2022).
- Bureau of Meteorology. Map of Climate Zones of Australia. Available online: http://www.bom.gov.au/climate/how/newproducts/images/zones.shtml (accessed on 15 May 2022).
- Bureau of Meterology. Evapotranspiration Calculations. Albury Airport. Available online: http://www.bom.gov.au/watl/eto/tables/nsw/albury_airport/albury_airport.html (accessed on 15 May 2022).
- Ineos Olefins & Polymers. Typical Engineering Properties of Polypropylene; INEOS: League City, TX, USA, 2014. [Google Scholar]
- Bureau of Meteorology. Climate statistics for Australian locations. Monthly Climate Statistics. Albury Airport (Station nº 072146). Available online: http://www.bom.gov.au/climate/averages/tables/cw_072146.shtml (accessed on 15 May 2022).
- Emmanuel, P.; Hassan, S. Potentials of Polypropylene Sheets in Trapping Solar Heat for the Management of Callosobruchus maculatus (Fab.) Infestation. J. Appl. Sci. 2019, 19, 349–354. [Google Scholar] [CrossRef] [Green Version]
- Hossain, E.; Bhadra, S.; Jain, H.; Das, S.; Bhattacharya, A.; Ghosh, S.; Levine, D. Recharging and rejuvenation of decontaminated N95 masks. Phys. Fluids 2020, 32, 093304. [Google Scholar] [CrossRef]
- Xiao, H.; Song, Y.; Chen, G. Correlation between charge decay and solvent effect for melt-blown polypropylene electret filter fabrics. J. Electrost. 2014, 72, 311–314. [Google Scholar] [CrossRef]
- Mirjalili, F.; Moradian, S.; Ameri, F. Enhancing the dyeability of polypropylene fibers by melt blending with polyethylene terephthalate. Sci. World J. 2013, 2013, 468542. [Google Scholar] [CrossRef] [Green Version]
- Lee, L.Y.-K.; Chan, I.C.-W.; Wong, O.P.-M.; Ng, Y.H.-Y.; Ng, C.K.-Y.; Chan, M.H.-W.; Ng, J.K.-C.; Koo, H.H.-T.; Lam, S.-T.; Chu, A.C.-W. Reuse of face masks among adults in Hong Kong during the COVID-19 pandemic. BMC Public Health 2021, 21, 1267. [Google Scholar] [CrossRef]
- Tan, M.; Wang, Y.; Luo, L.; Hu, J. How the public used face masks in China during the coronavirus disease pandemic: A survey study. Int. J. Nurs. Stud. 2021, 115, 103853. [Google Scholar] [CrossRef]
- Tam, V.C.; Tam, S.Y.; Poon, W.K.; Law, H.K.W.; Lee, S.W. A reality check on the use of face masks during the COVID-19 outbreak in Hong Kong. EClinicalMedicine 2020, 22, 100356. [Google Scholar] [CrossRef] [PubMed]
- Pereira-Ávila, F.M.V.; Lam, S.C.; Góes, F.G.B.; Gir, E.; Pereira-Caldeira, N.M.V.; Teles, S.A.; Caetano, K.A.A.; Goulart, M.D.C.; Bazilio, T.R.; Silva, A.C.D.O. Factors associated with the use and reuse of face masks among Brazilian individuals during the COVID-19 pandemic. Rev. Lat -Am. De Enferm. 2020, 28. [Google Scholar] [CrossRef] [PubMed]
- Suen, C.Y.; Leung, H.H.; Lam, K.W.; Hung, K.; Chan, M.Y.; Kwan, J.K. Feasibility of reusing surgical mask under different disinfection treatments. MedRxiv 2020. [Google Scholar] [CrossRef]
- Teo, J.Y.; Kng, J.; Periaswamy, B.; Liu, S.; Lim, P.C.; Lee, C.E.; Tan, B.H.; Loh, X.J.; Ni, X.; Tiang, D. Exploring Reusability of Disposable Face Masks: Effects of Disinfection Methods on Filtration Efficiency, Breathability, and Fluid Resistance. Glob. Chall. 2021, 5, 2100030. [Google Scholar] [CrossRef] [PubMed]
- European Chemicals Agency. Annex XV Restriction Report. Proposal for a Restriction. Substance Name(s): Intentionally Added Microplastics, 1.2nd ed.; European Chemicals Agency: Helsinki, Finland, 2019. [Google Scholar]
- Andrady, A.L. The plastic in microplastics: A review. Mar. Pollut. Bull. 2017, 119, 12–22. [Google Scholar] [CrossRef] [PubMed]
- Cole, M.; Lindeque, P.; Halsband, C.; Galloway, T.S. Microplastics as contaminants in the marine environment: A review. Mar. Pollut. Bull. 2011, 62, 2588–2597. [Google Scholar] [CrossRef] [PubMed]
- Silva, A.B.; Bastos, A.S.; Justino, C.I.; da Costa, J.P.; Duarte, A.C.; Rocha-Santos, T.A. Microplastics in the environment: Challenges in analytical chemistry—A review. Anal. Chim. Acta 2018, 1017, 1–19. [Google Scholar] [CrossRef]
- de Souza Machado, A.A.; Lau, C.W.; Till, J.; Kloas, W.; Lehmann, A.; Becker, R.; Rillig, M.C. Impacts of microplastics on the soil biophysical environment. Environ. Sci. Technol. 2018, 52, 9656–9665. [Google Scholar] [CrossRef] [Green Version]
- Wang, J.; Liu, X.; Li, Y.; Powell, T.; Wang, X.; Wang, G.; Zhang, P. Microplastics as contaminants in the soil environment: A mini-review. Sci. Total Environ. 2019, 691, 848–857. [Google Scholar] [CrossRef]
- Senathirajah, K.; Attwood, S.; Bhagwat, G.; Carbery, M.; Wilson, S.; Palanisami, T. Estimation of the mass of microplastics ingested–A pivotal first step towards human health risk assessment. J. Hazard. Mater. 2021, 404, 124004. [Google Scholar] [CrossRef]
- Smith, M.; Love, D.C.; Rochman, C.M.; Neff, R.A. Microplastics in seafood and the implications for human health. Curr. Environ. Health Rep. 2018, 5, 375–386. [Google Scholar] [CrossRef] [PubMed] [Green Version]
- Carbery, M.; O’Connor, W.; Palanisami, T. Trophic transfer of microplastics and mixed contaminants in the marine food web and implications for human health. Environ. Int. 2018, 115, 400–409. [Google Scholar] [CrossRef] [PubMed] [Green Version]
- Hunt, C.F.; Lin, W.H.; Voulvoulis, N. Evaluating alternatives to plastic microbeads in cosmetics. Nat. Sustain. 2021, 4, 366–372. [Google Scholar] [CrossRef]
- Sun, Q.; Ren, S.-Y.; Ni, H.-G. Incidence of microplastics in personal care products: An appreciable part of plastic pollution. Sci. Total Environ. 2020, 742, 140218. [Google Scholar] [CrossRef] [PubMed]

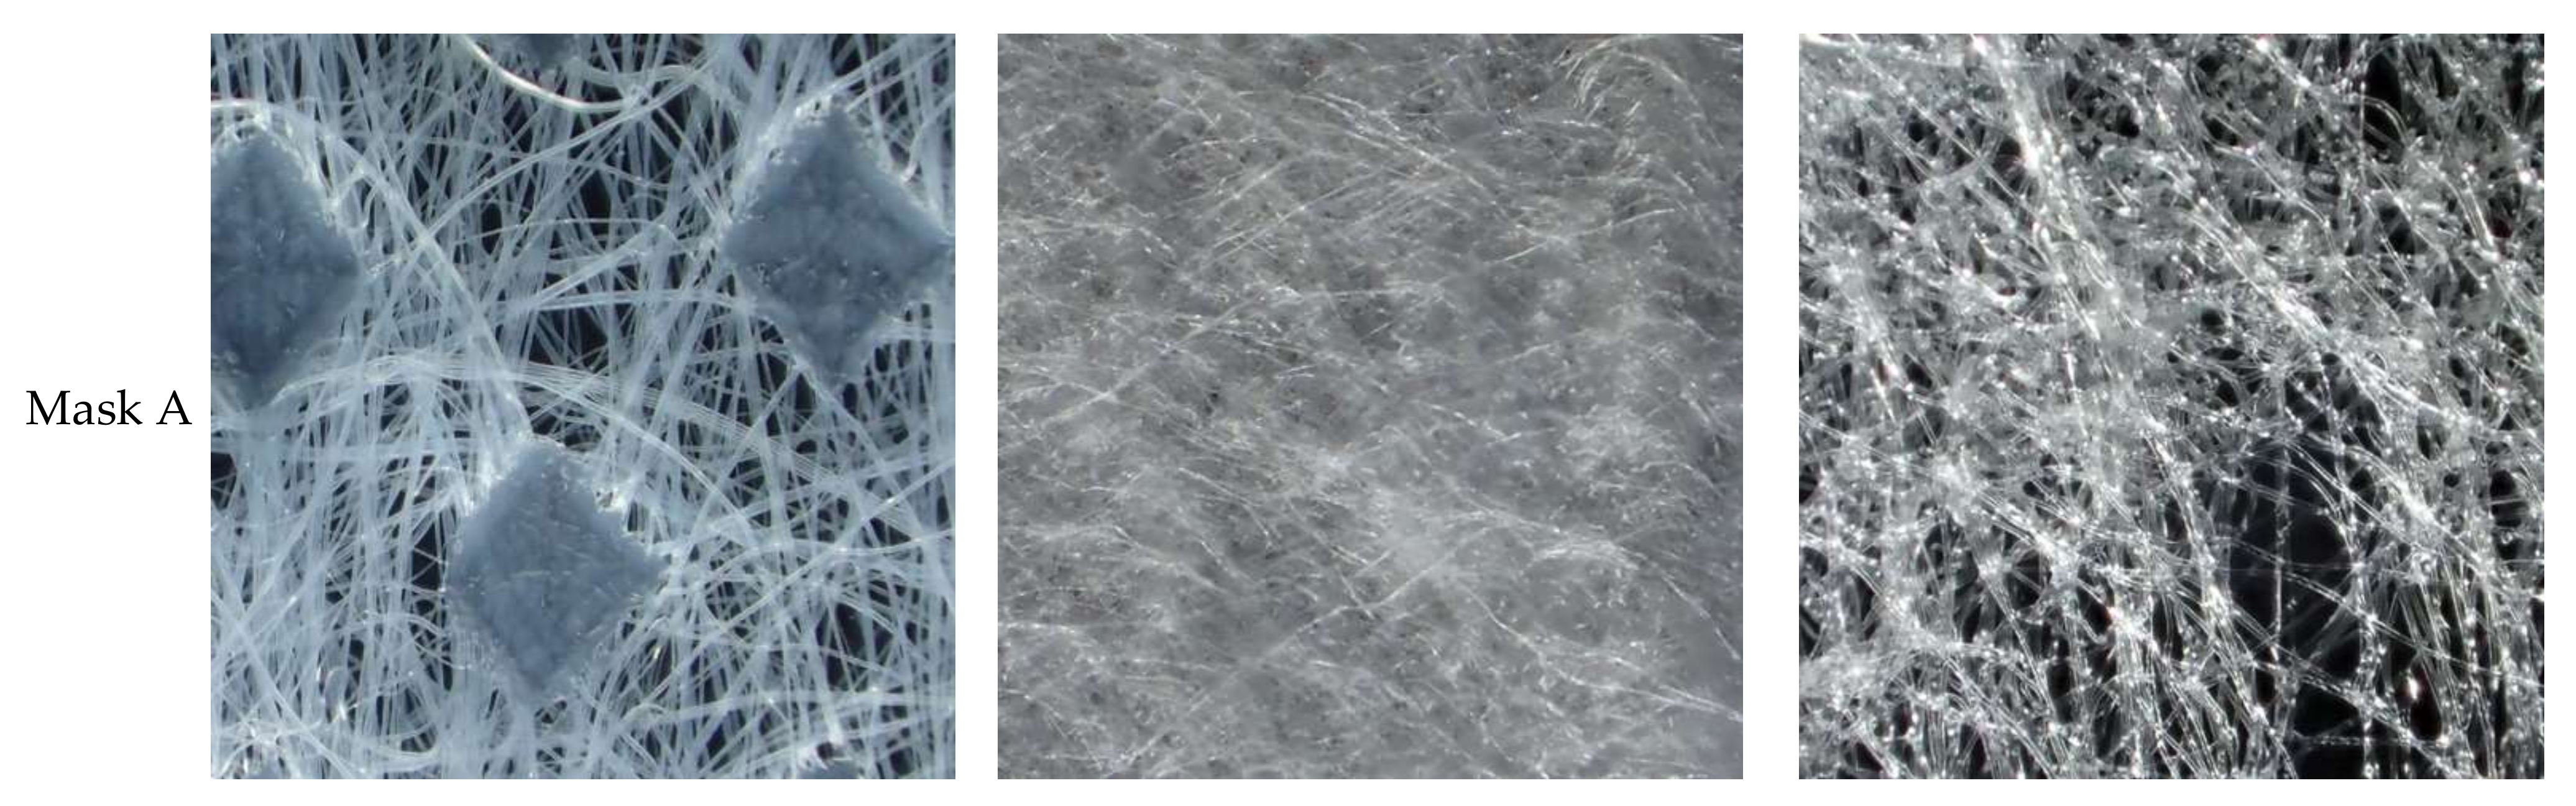

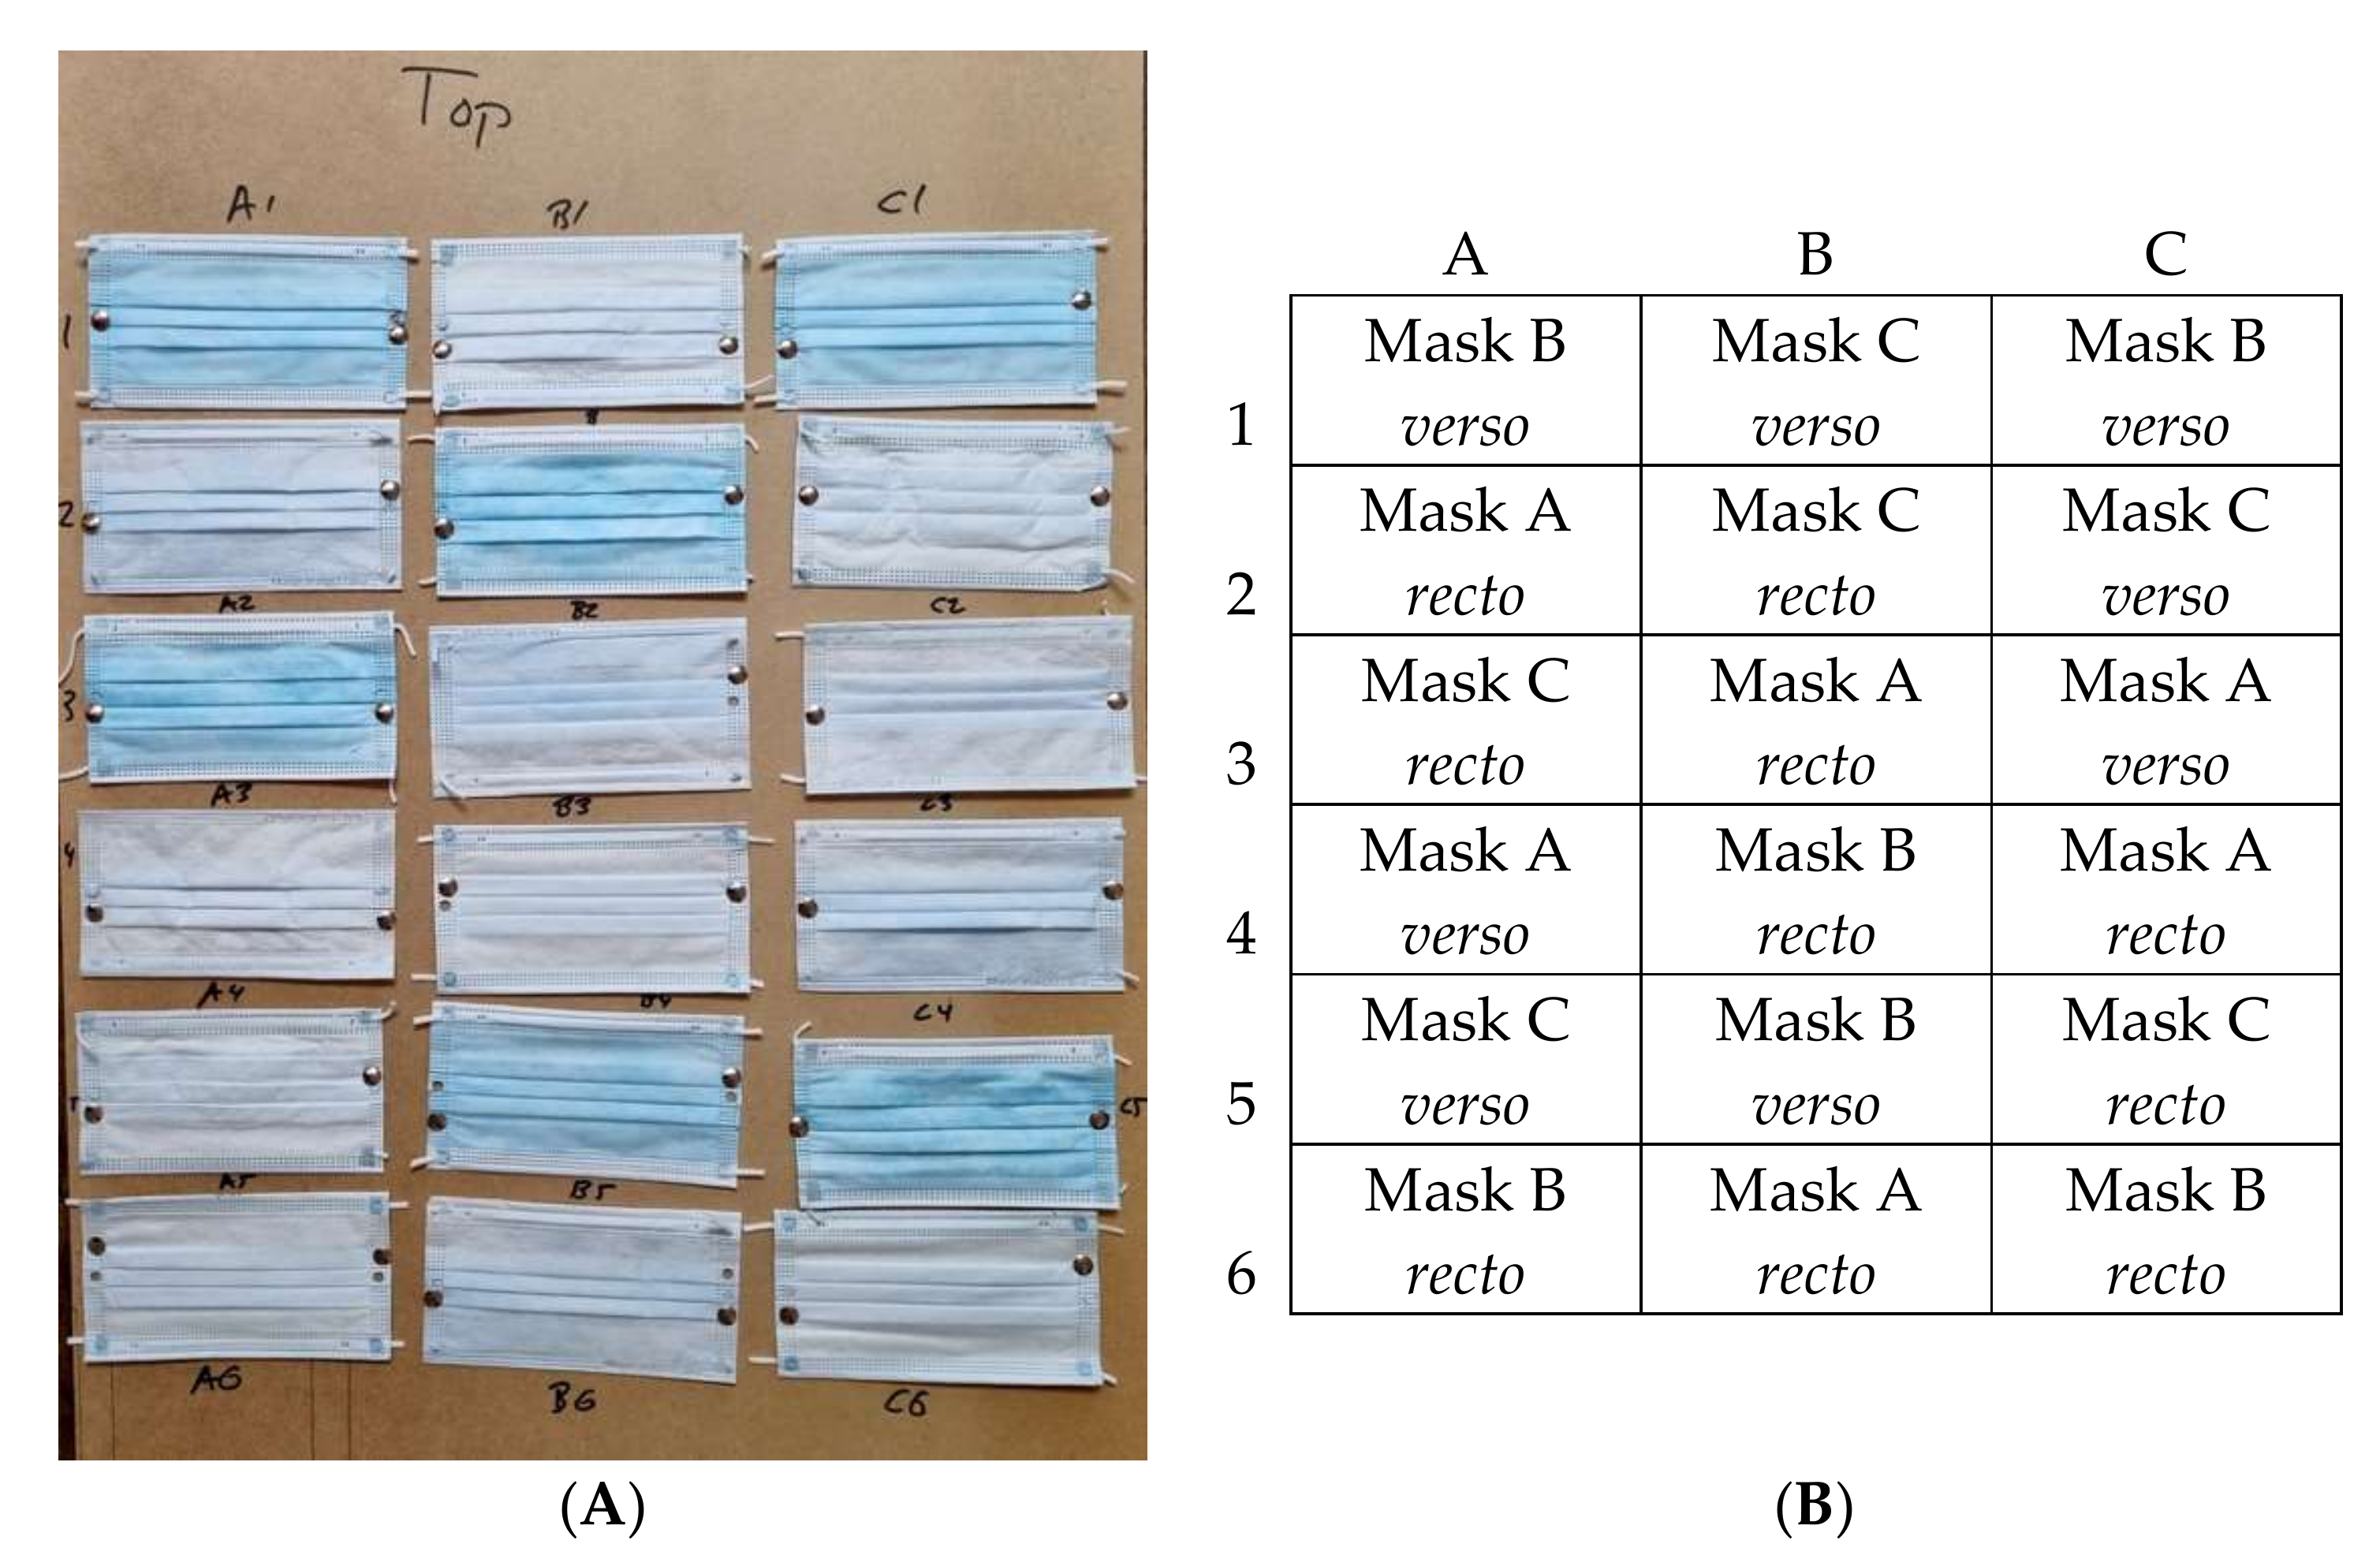
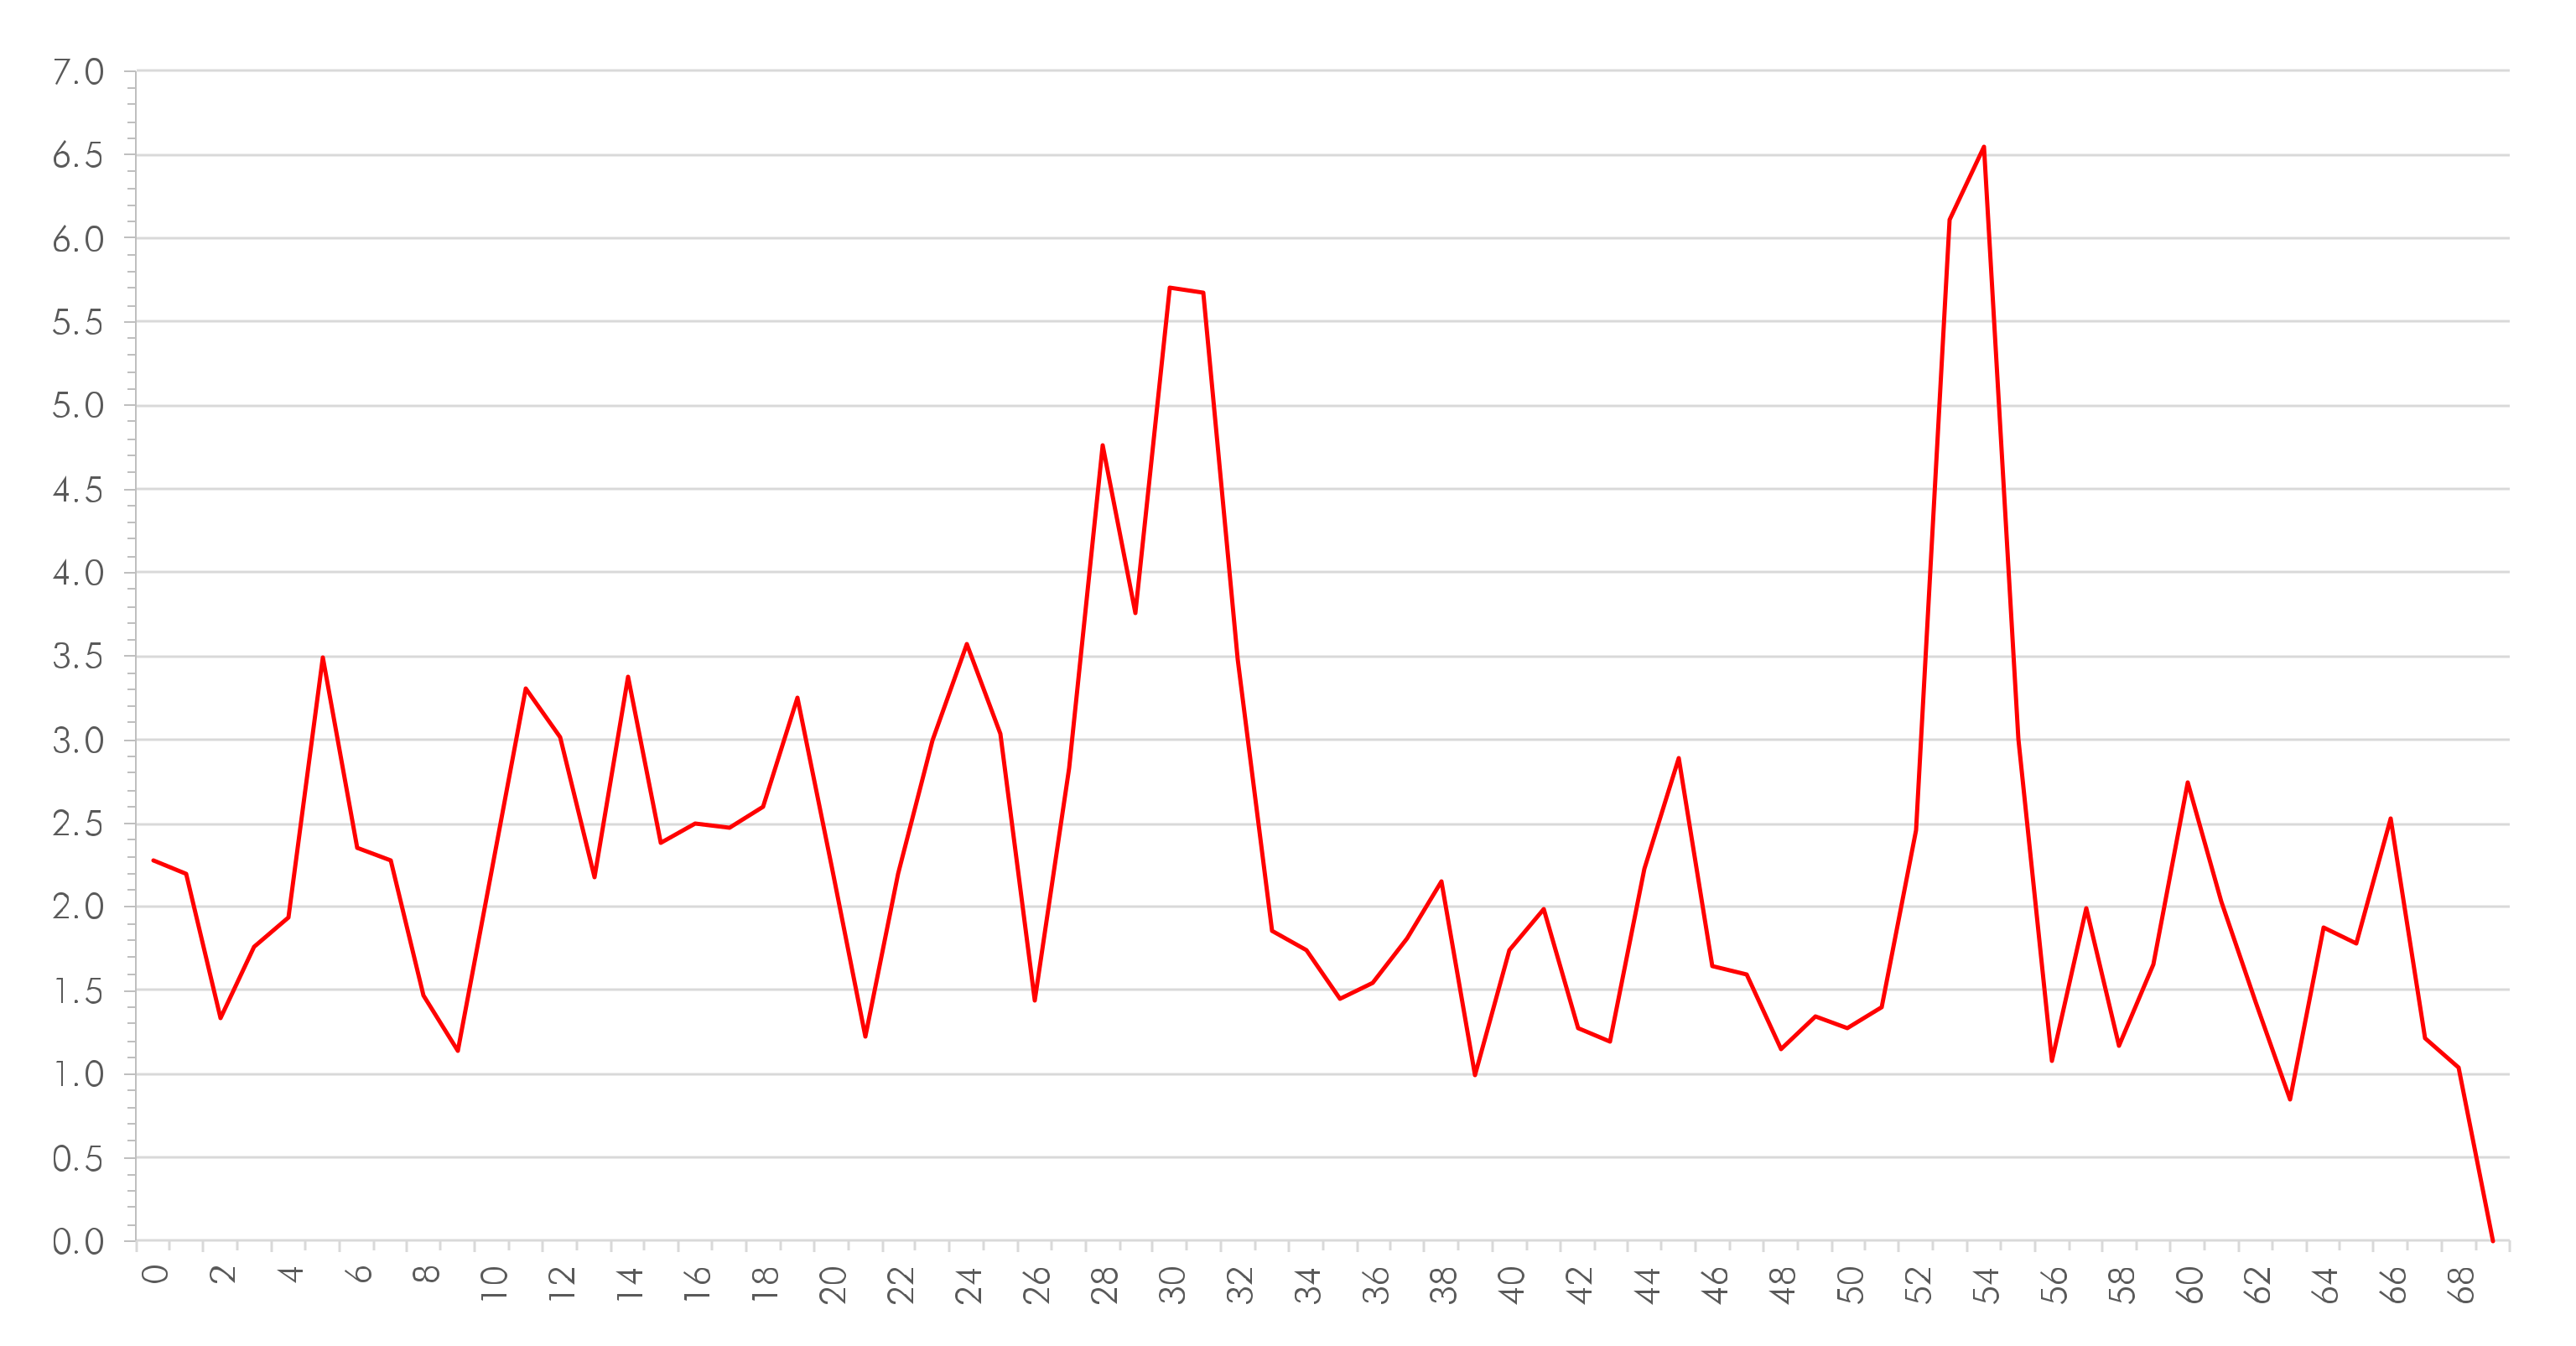

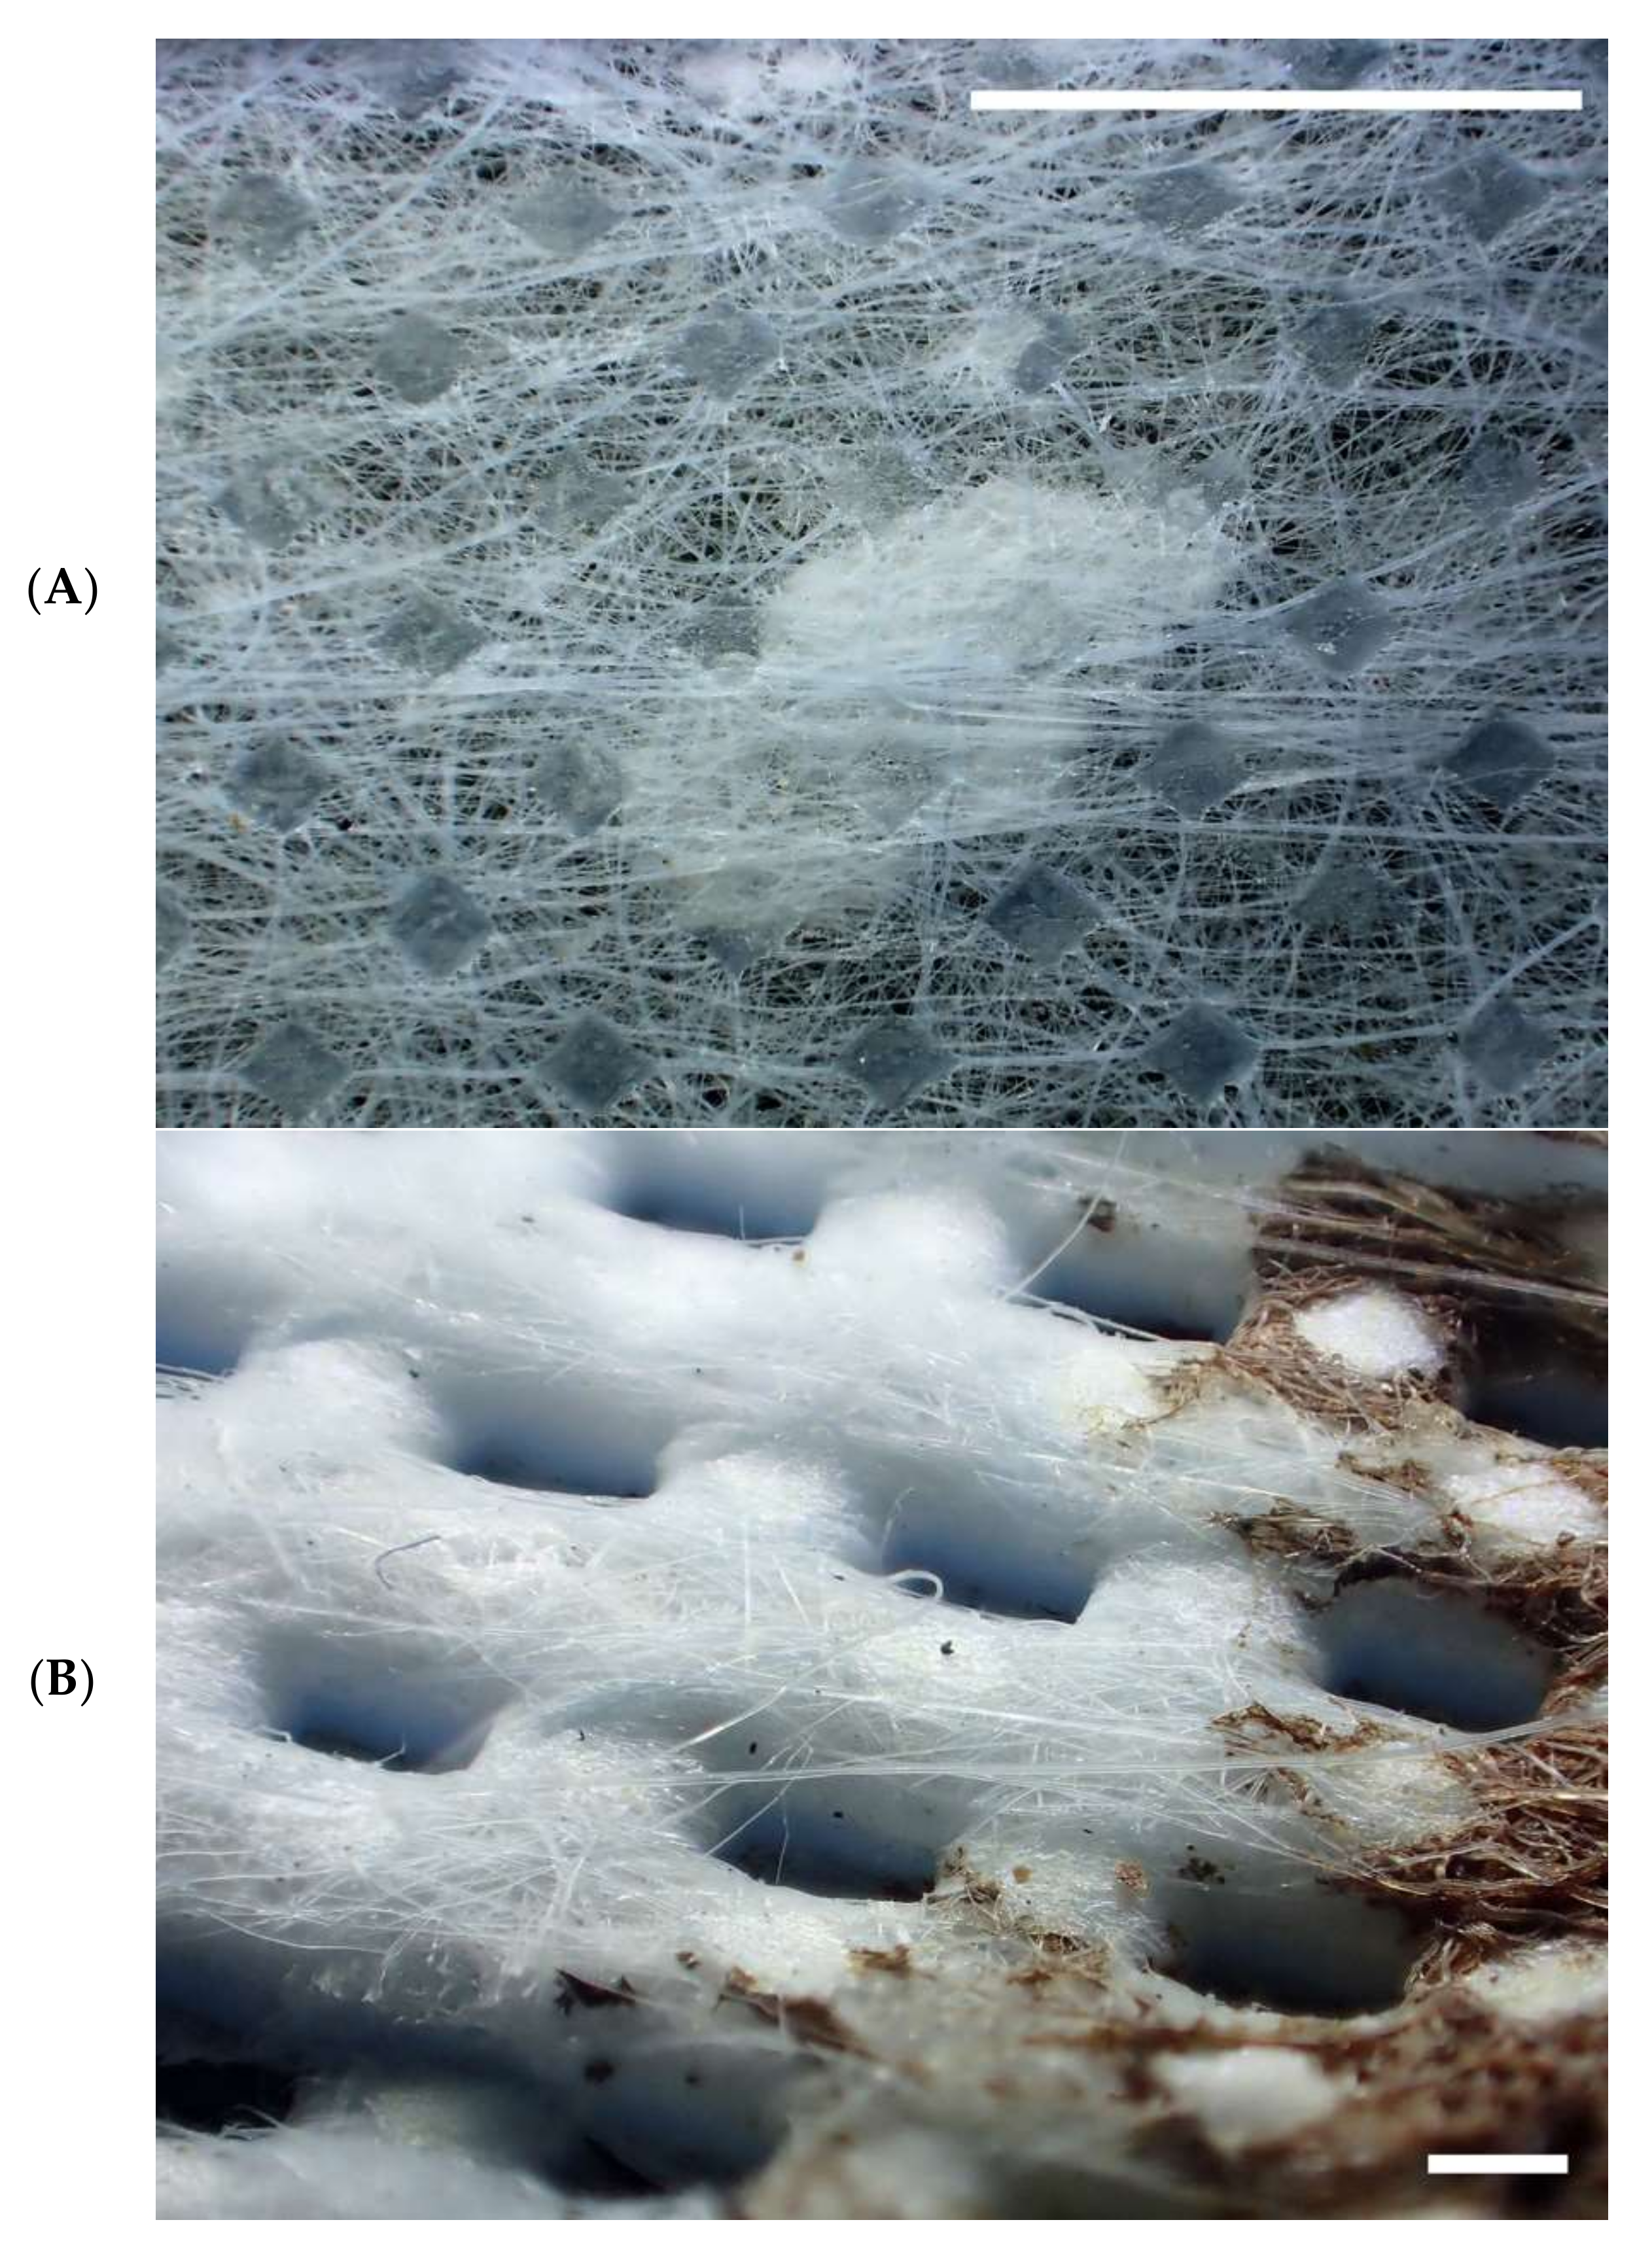
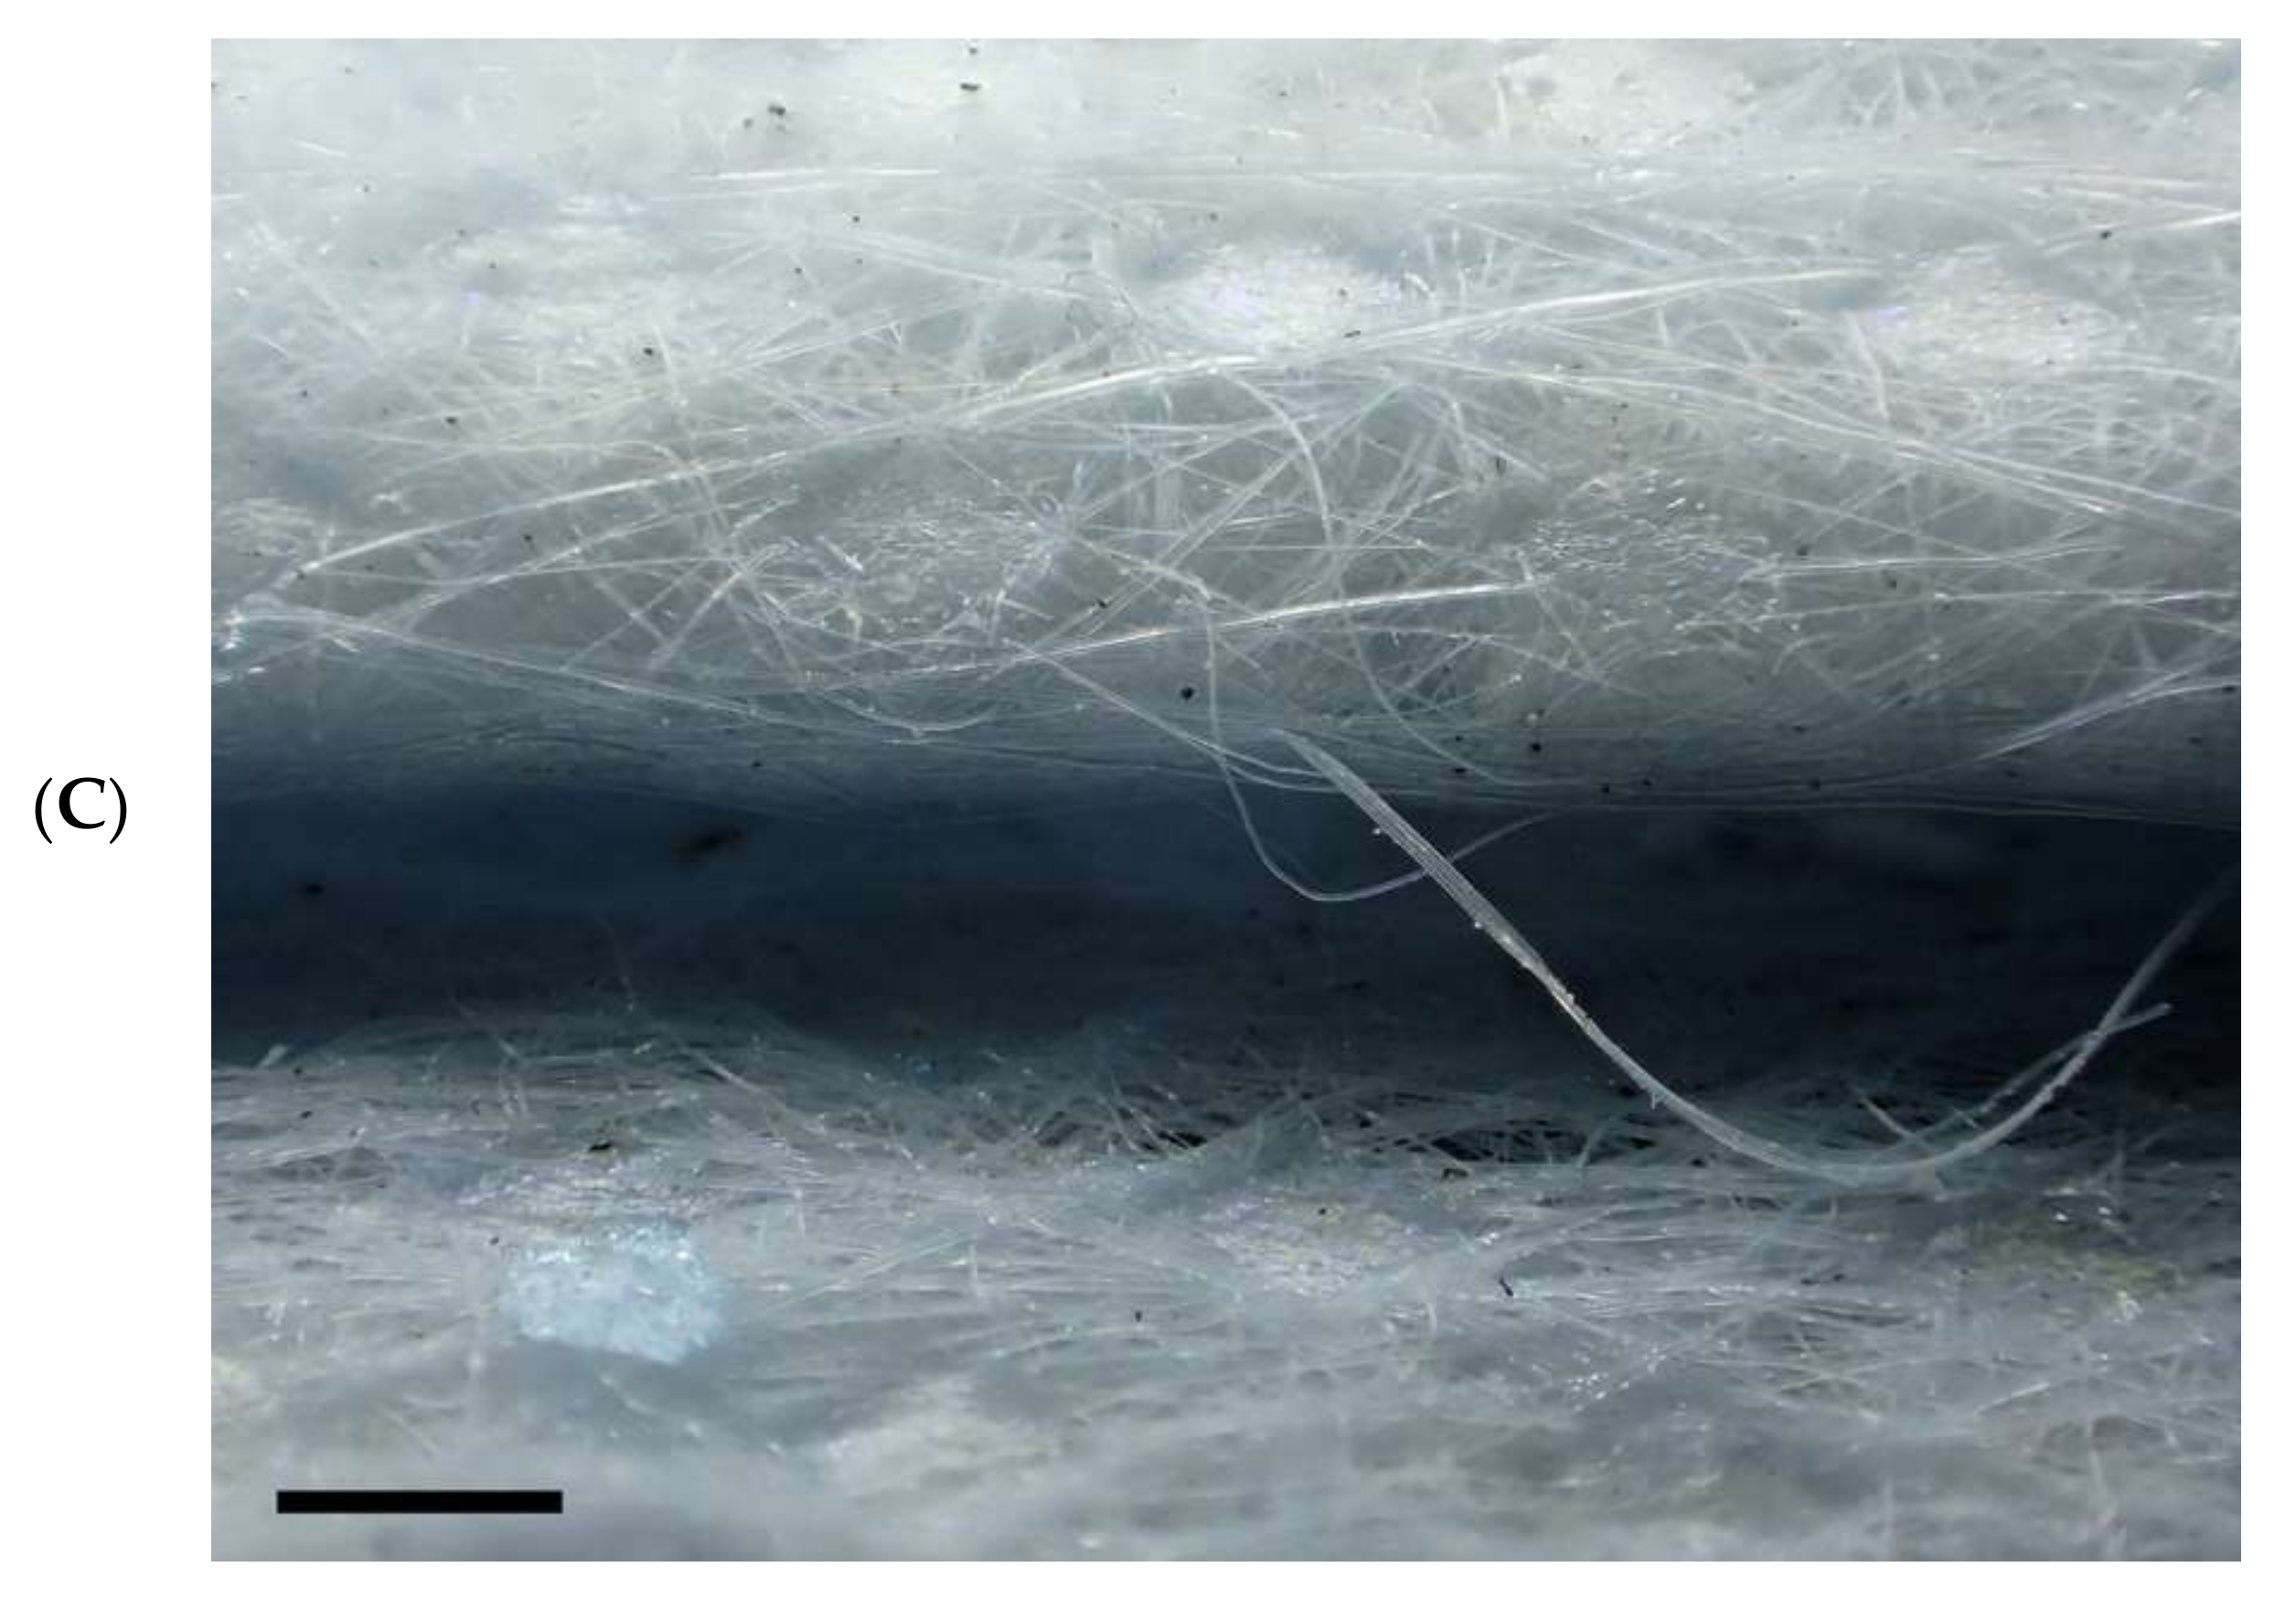
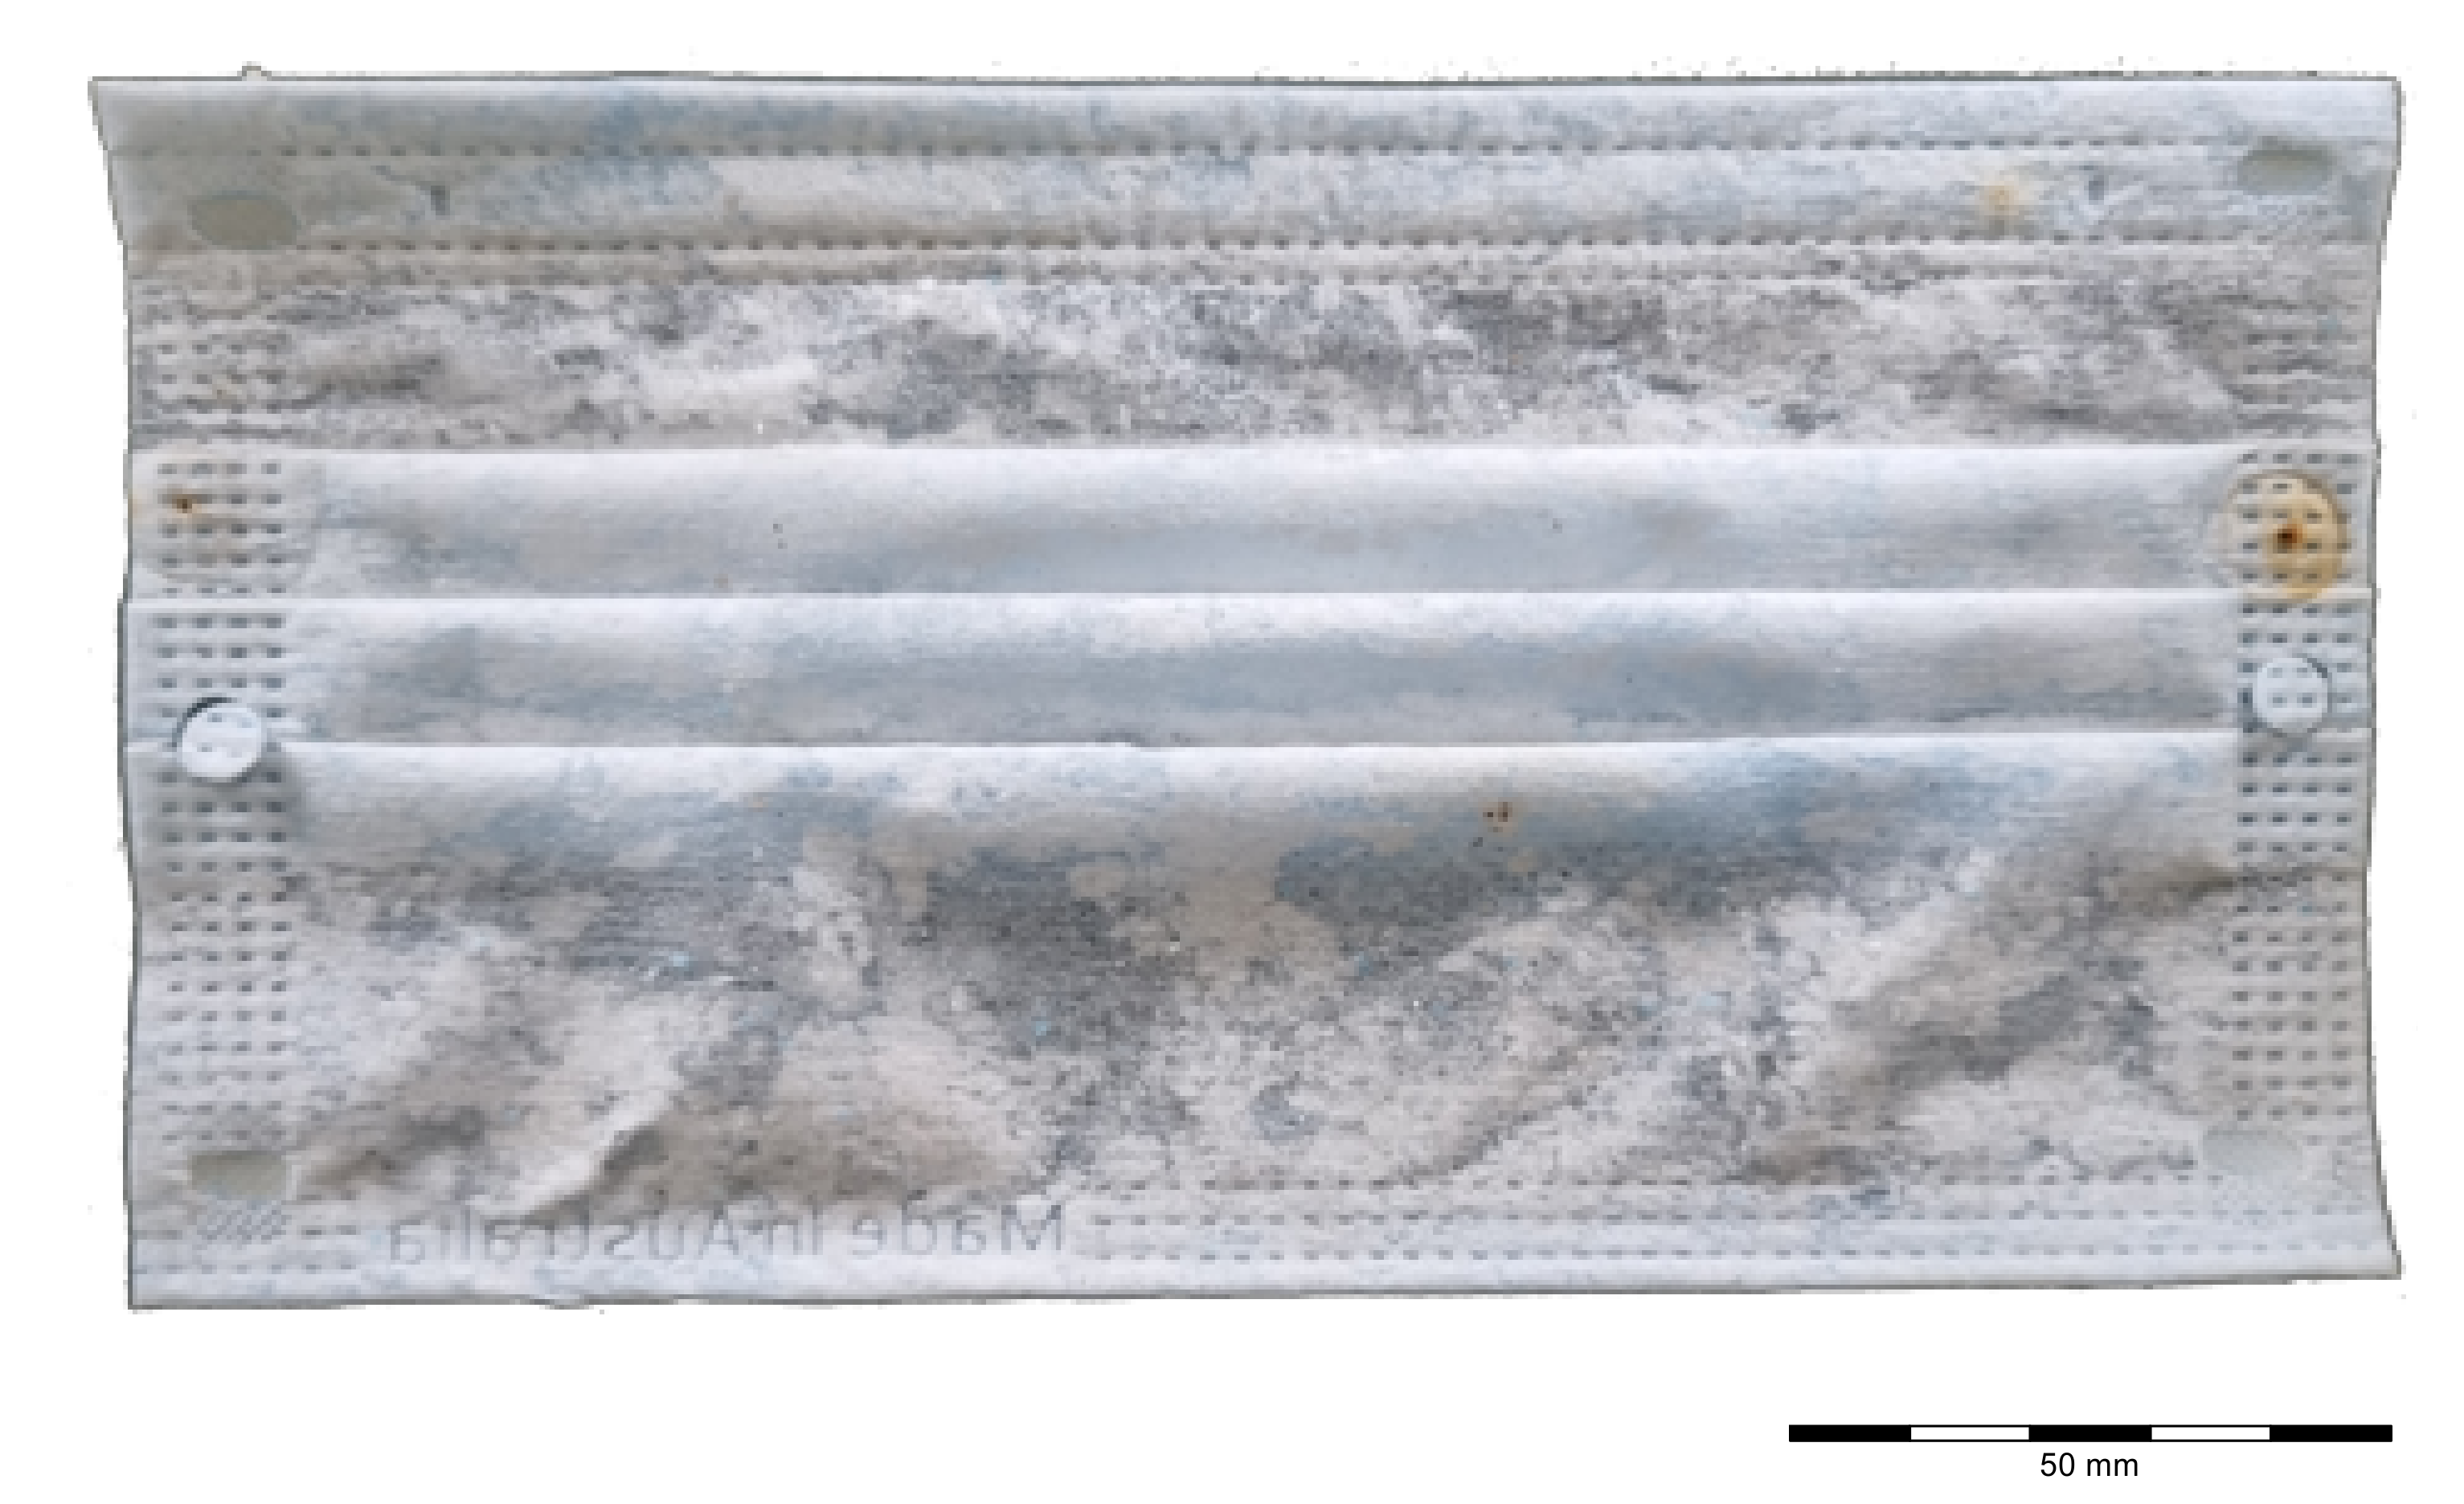

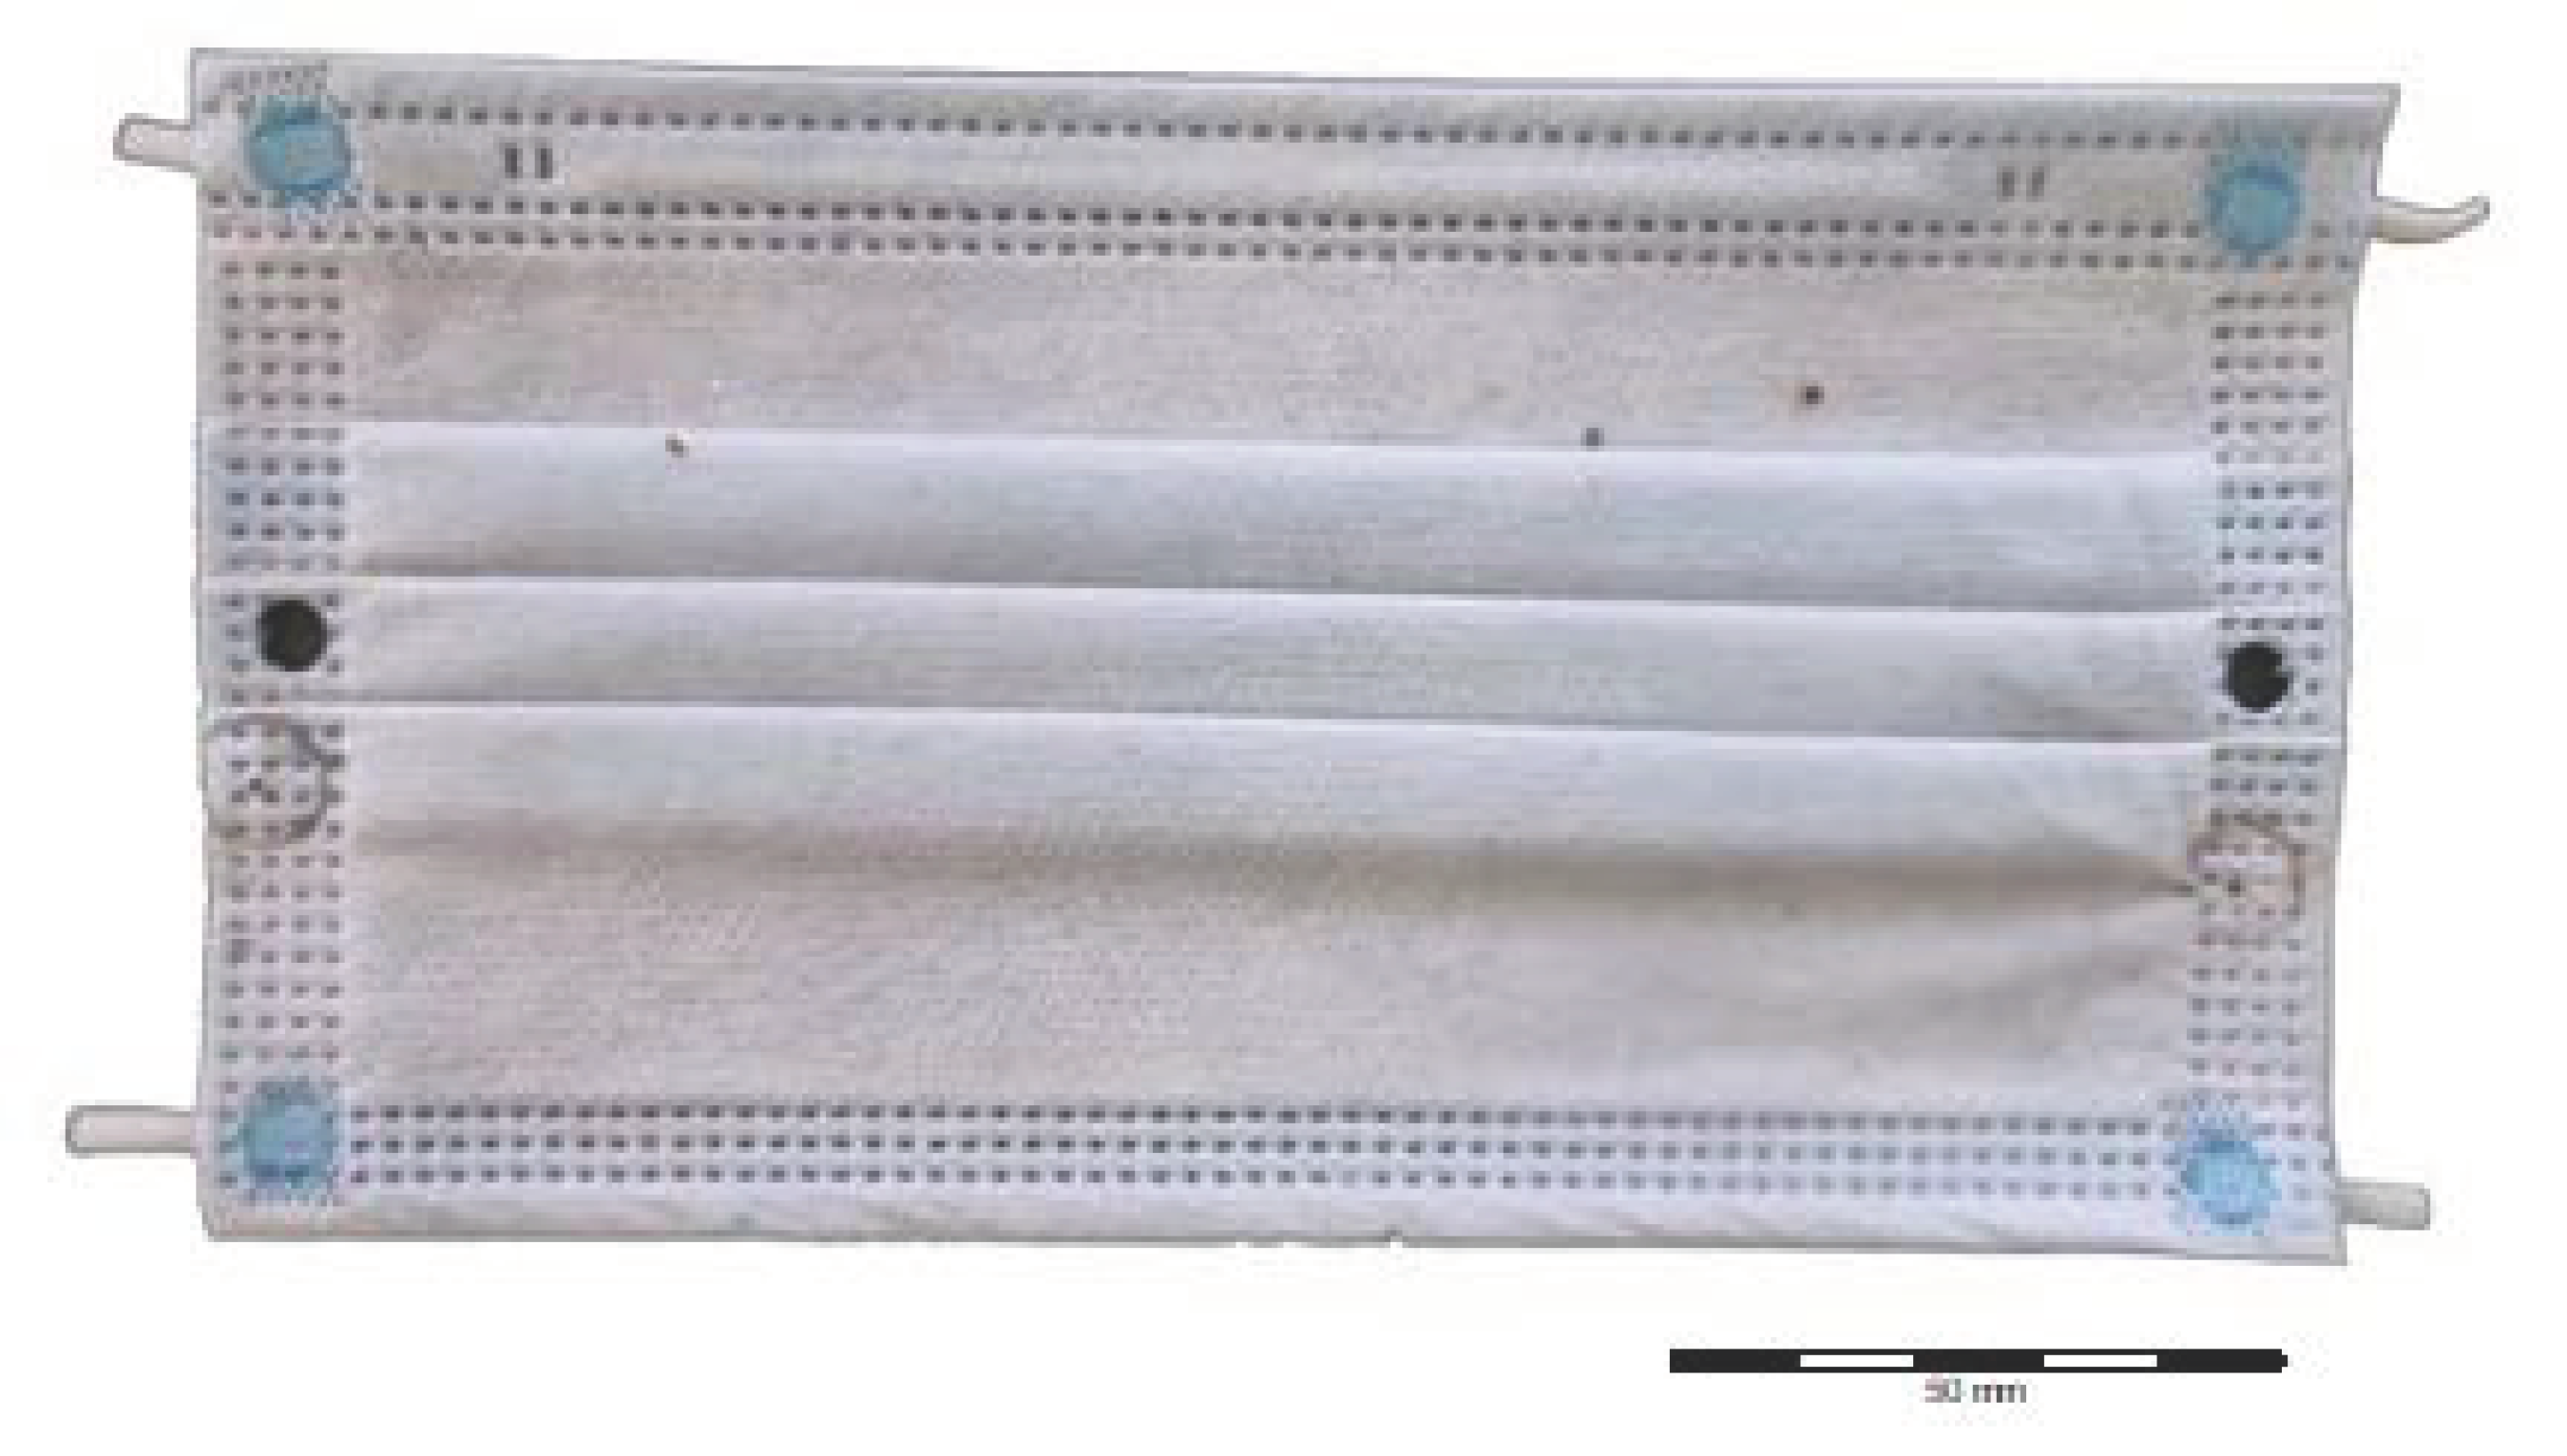
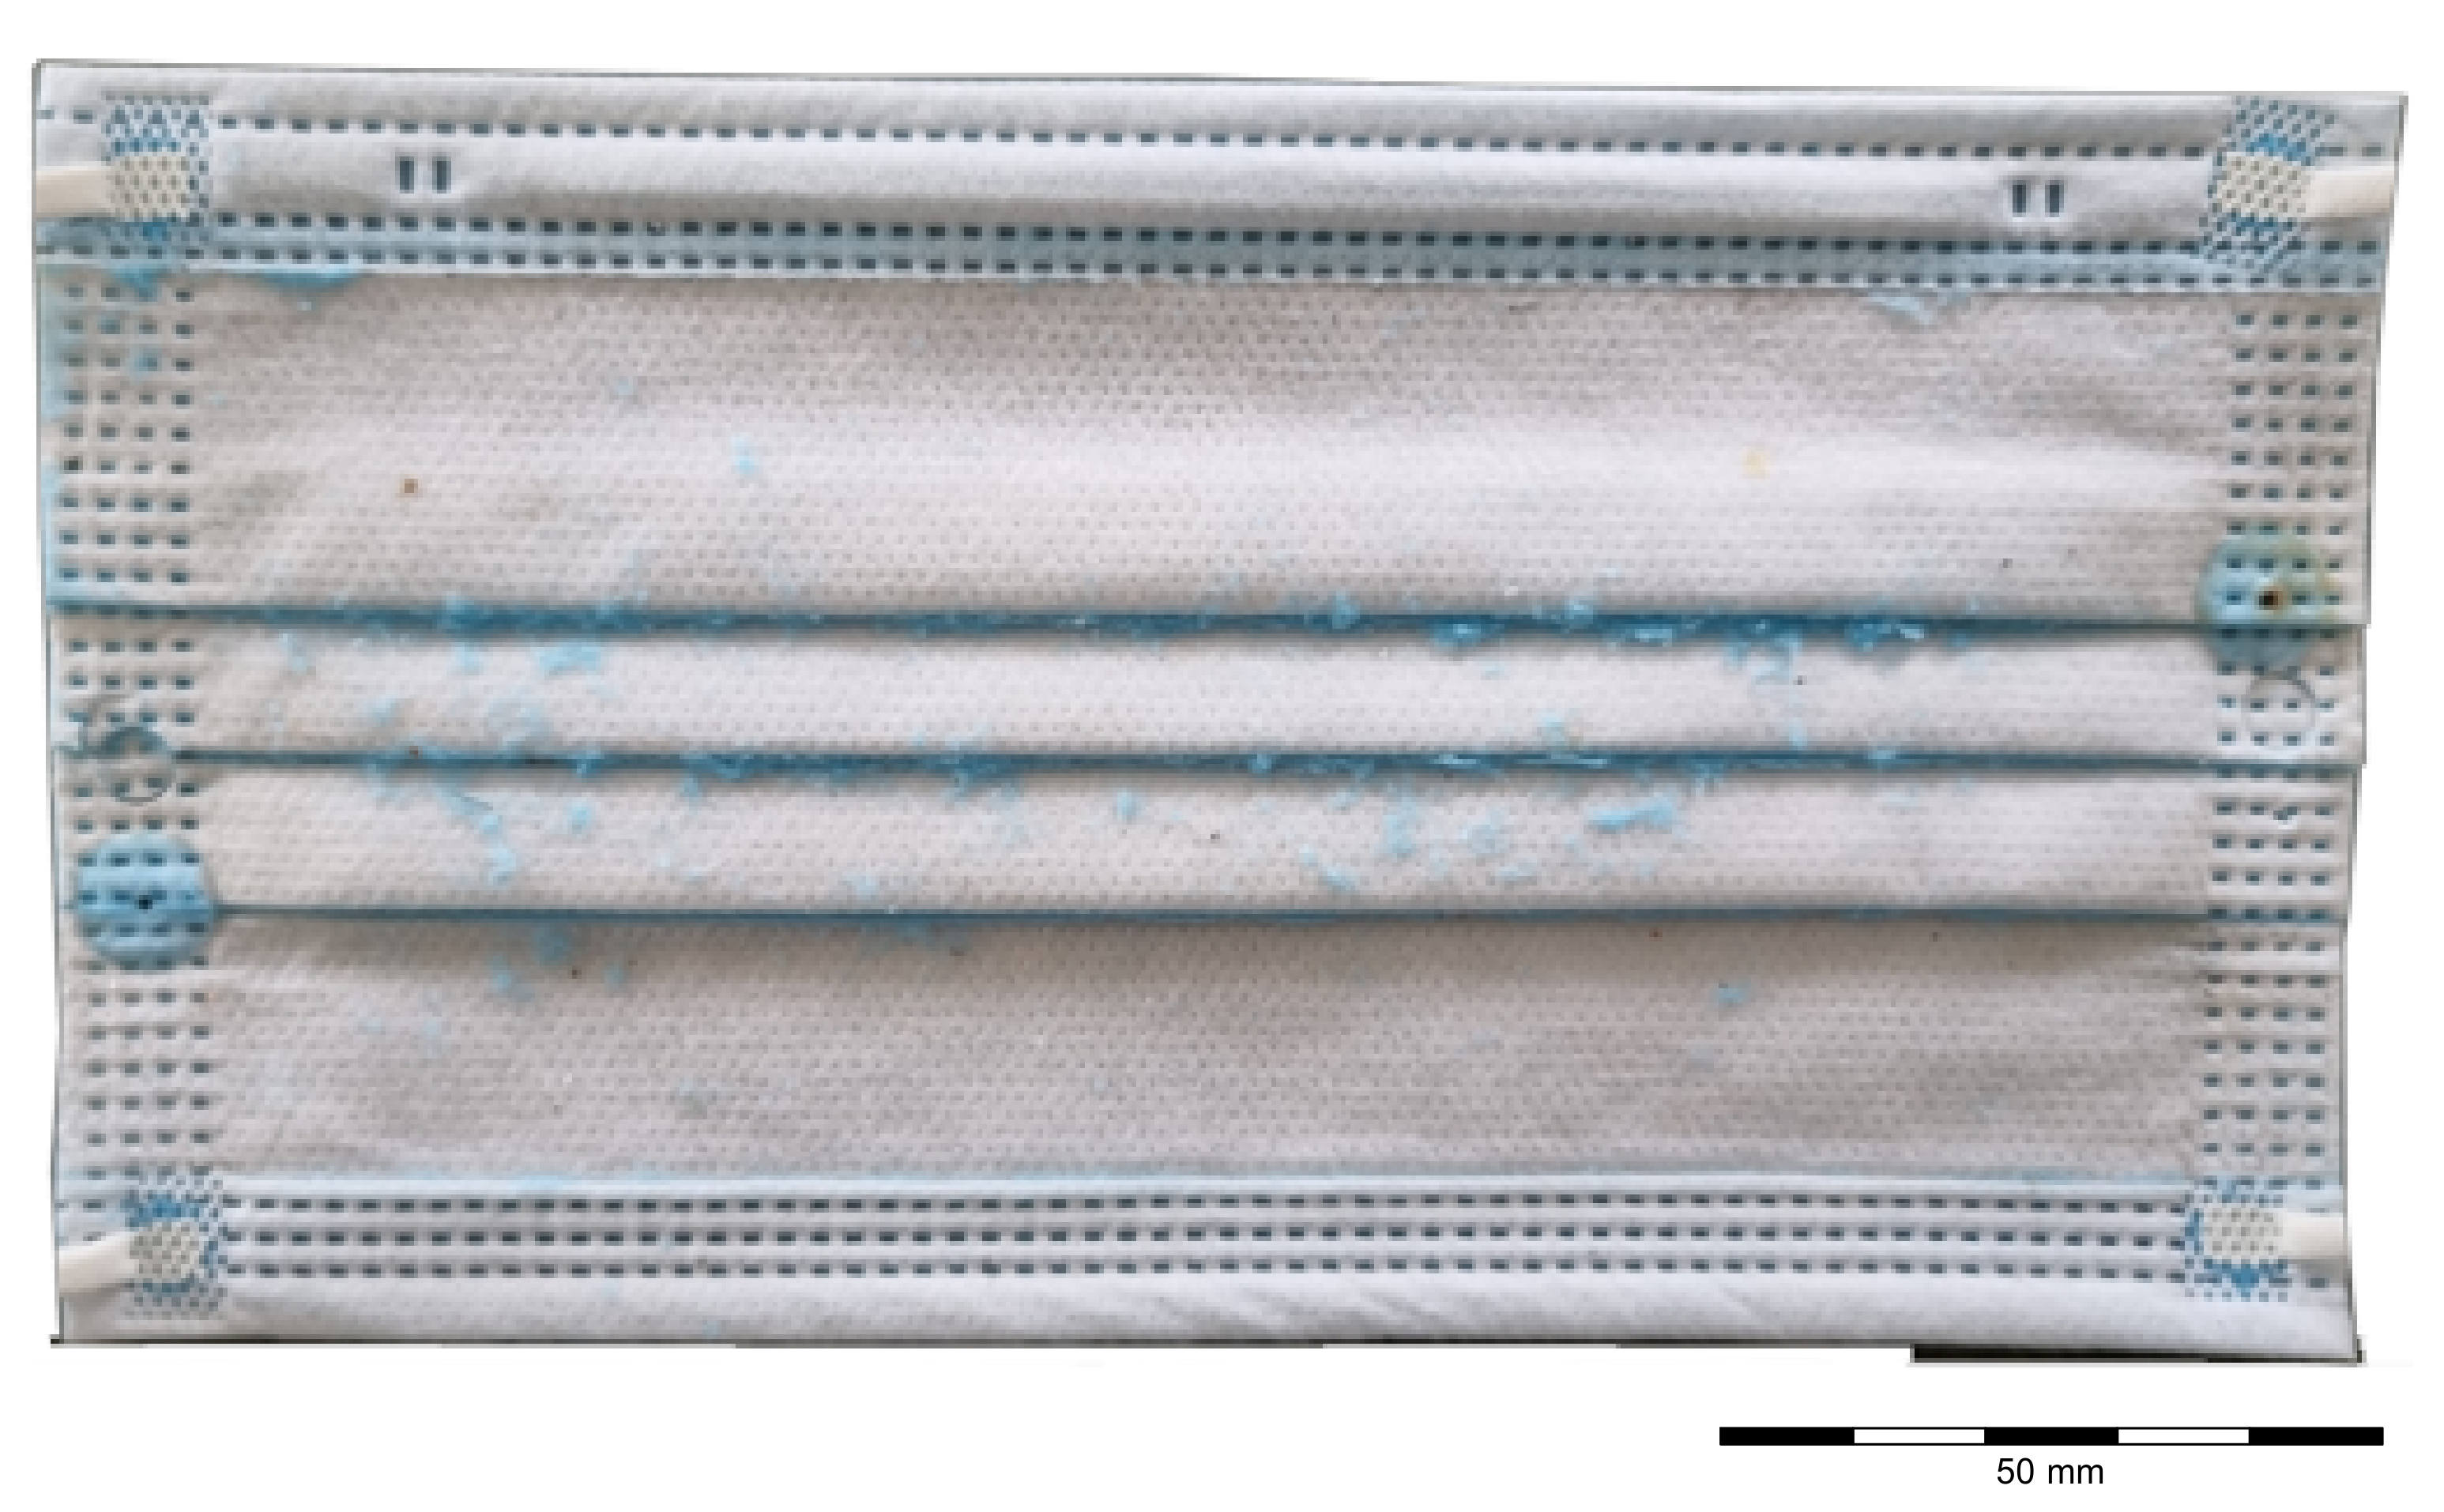
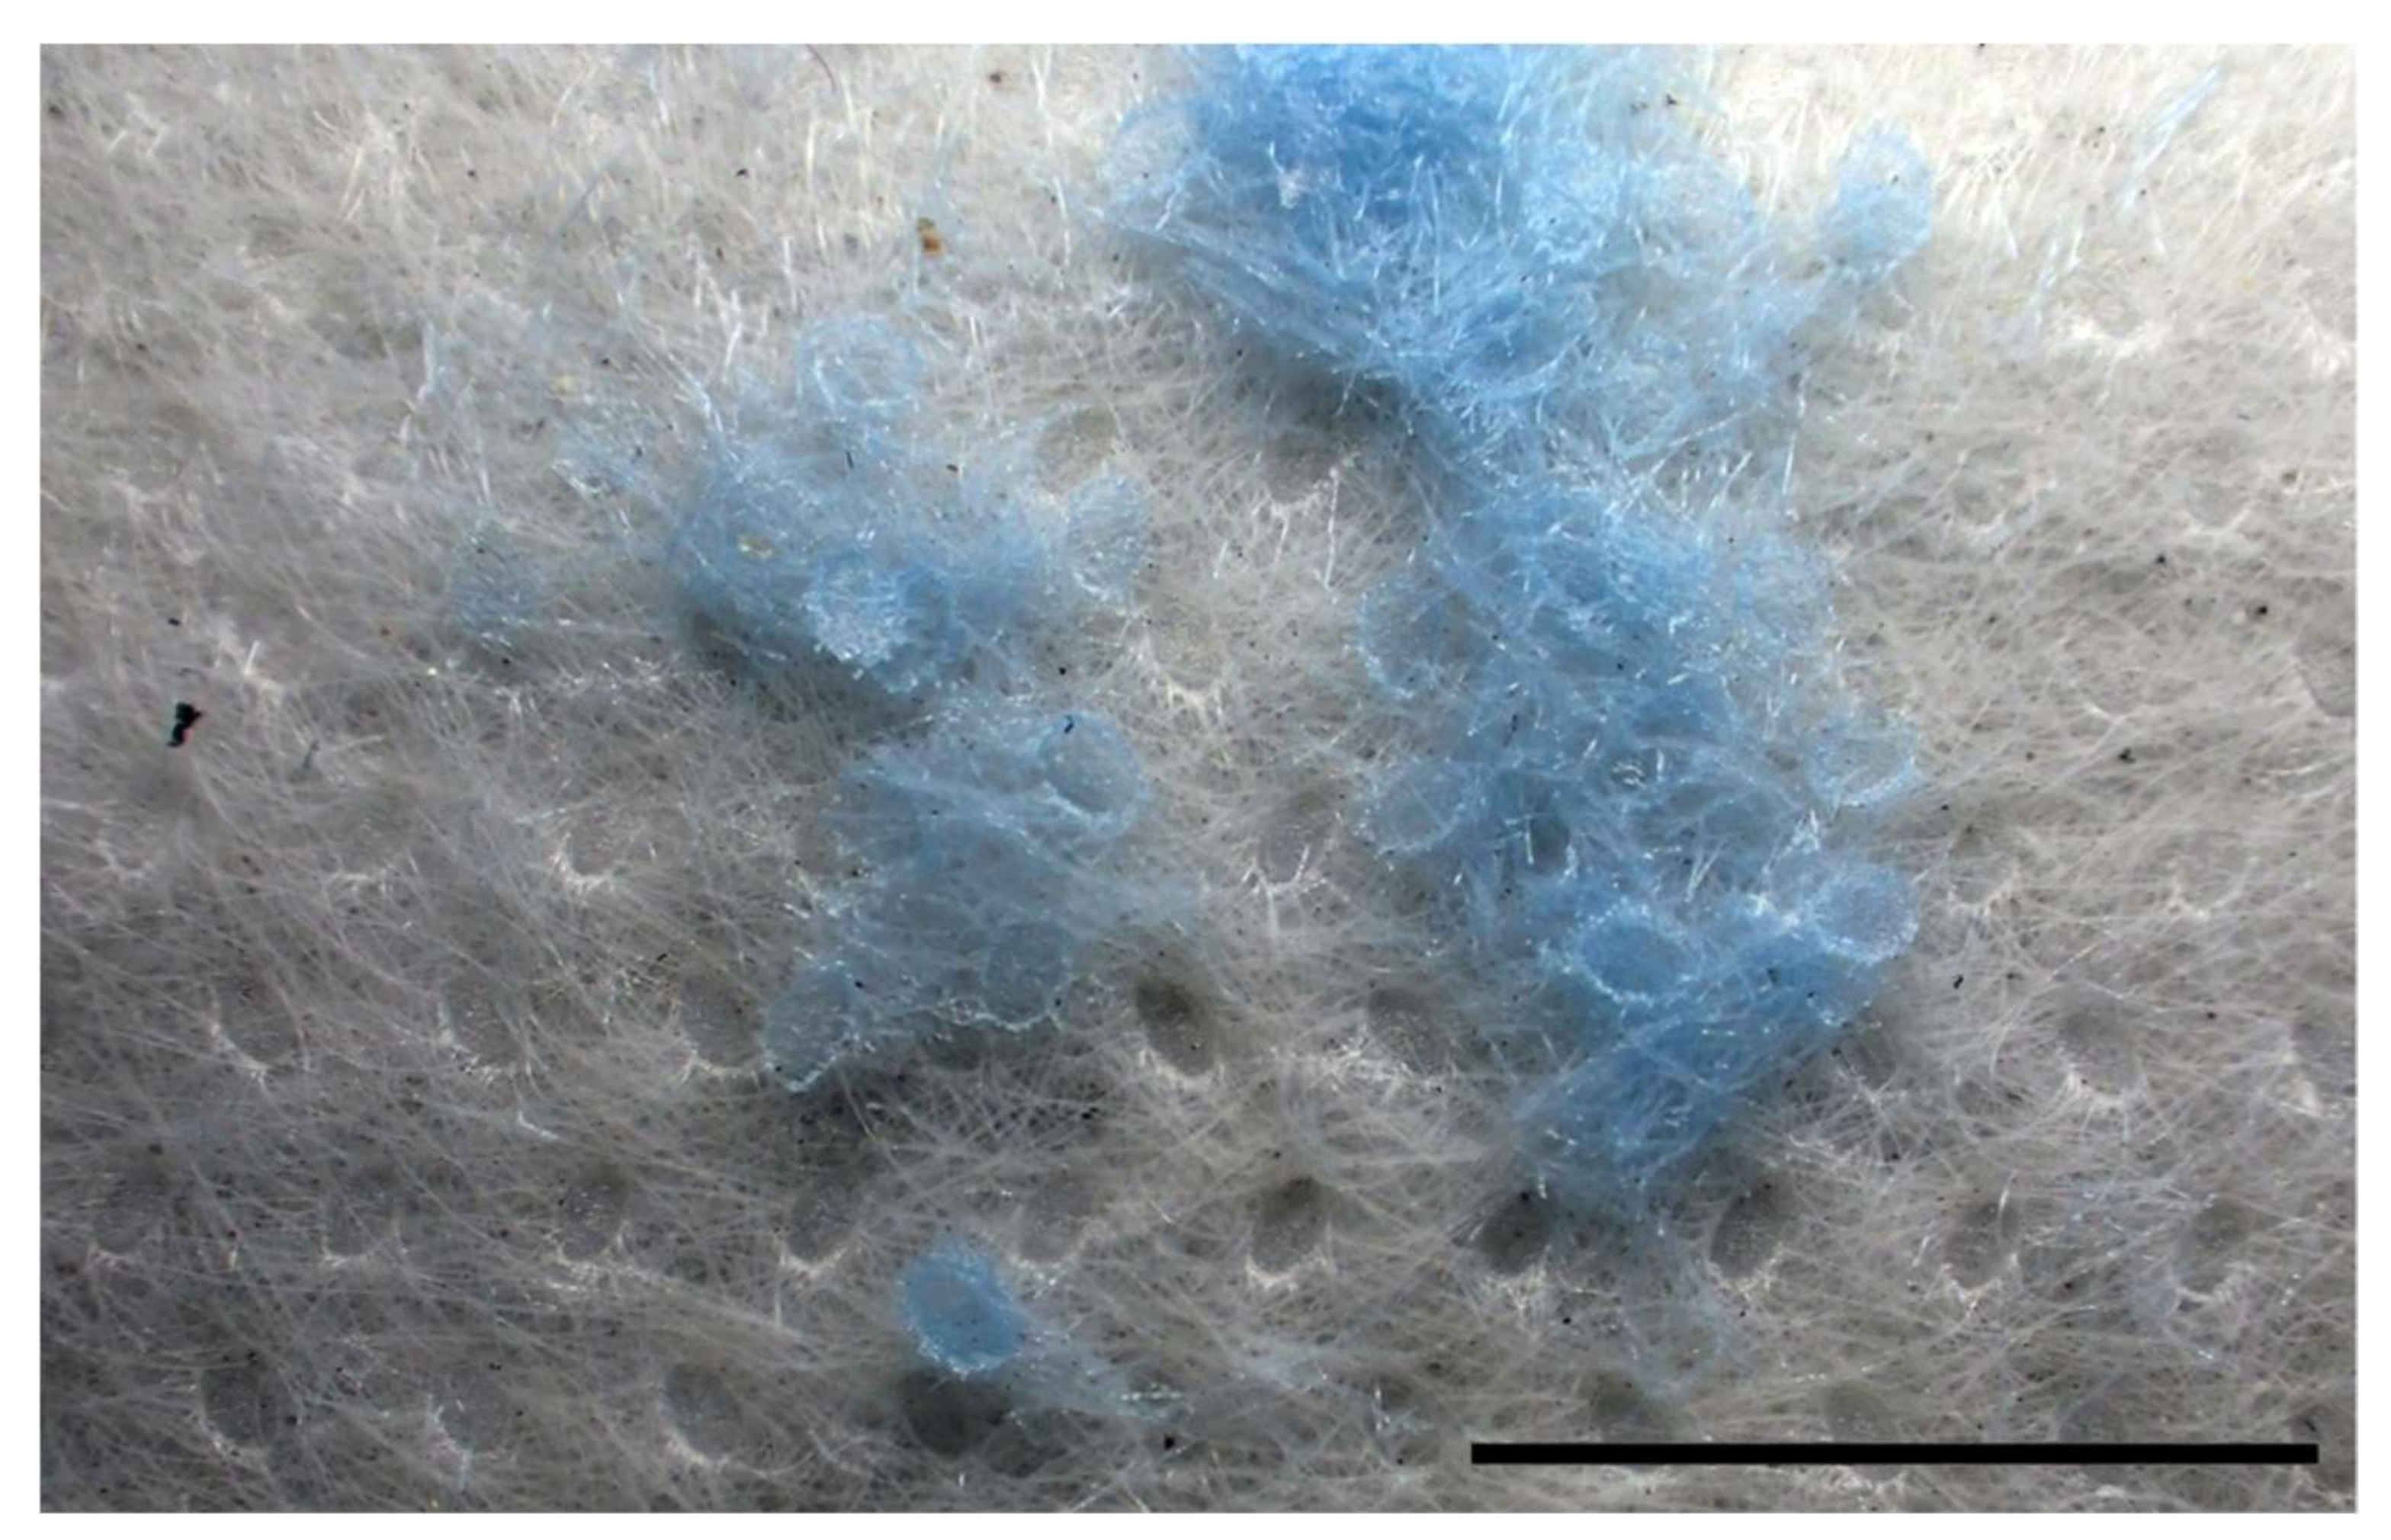


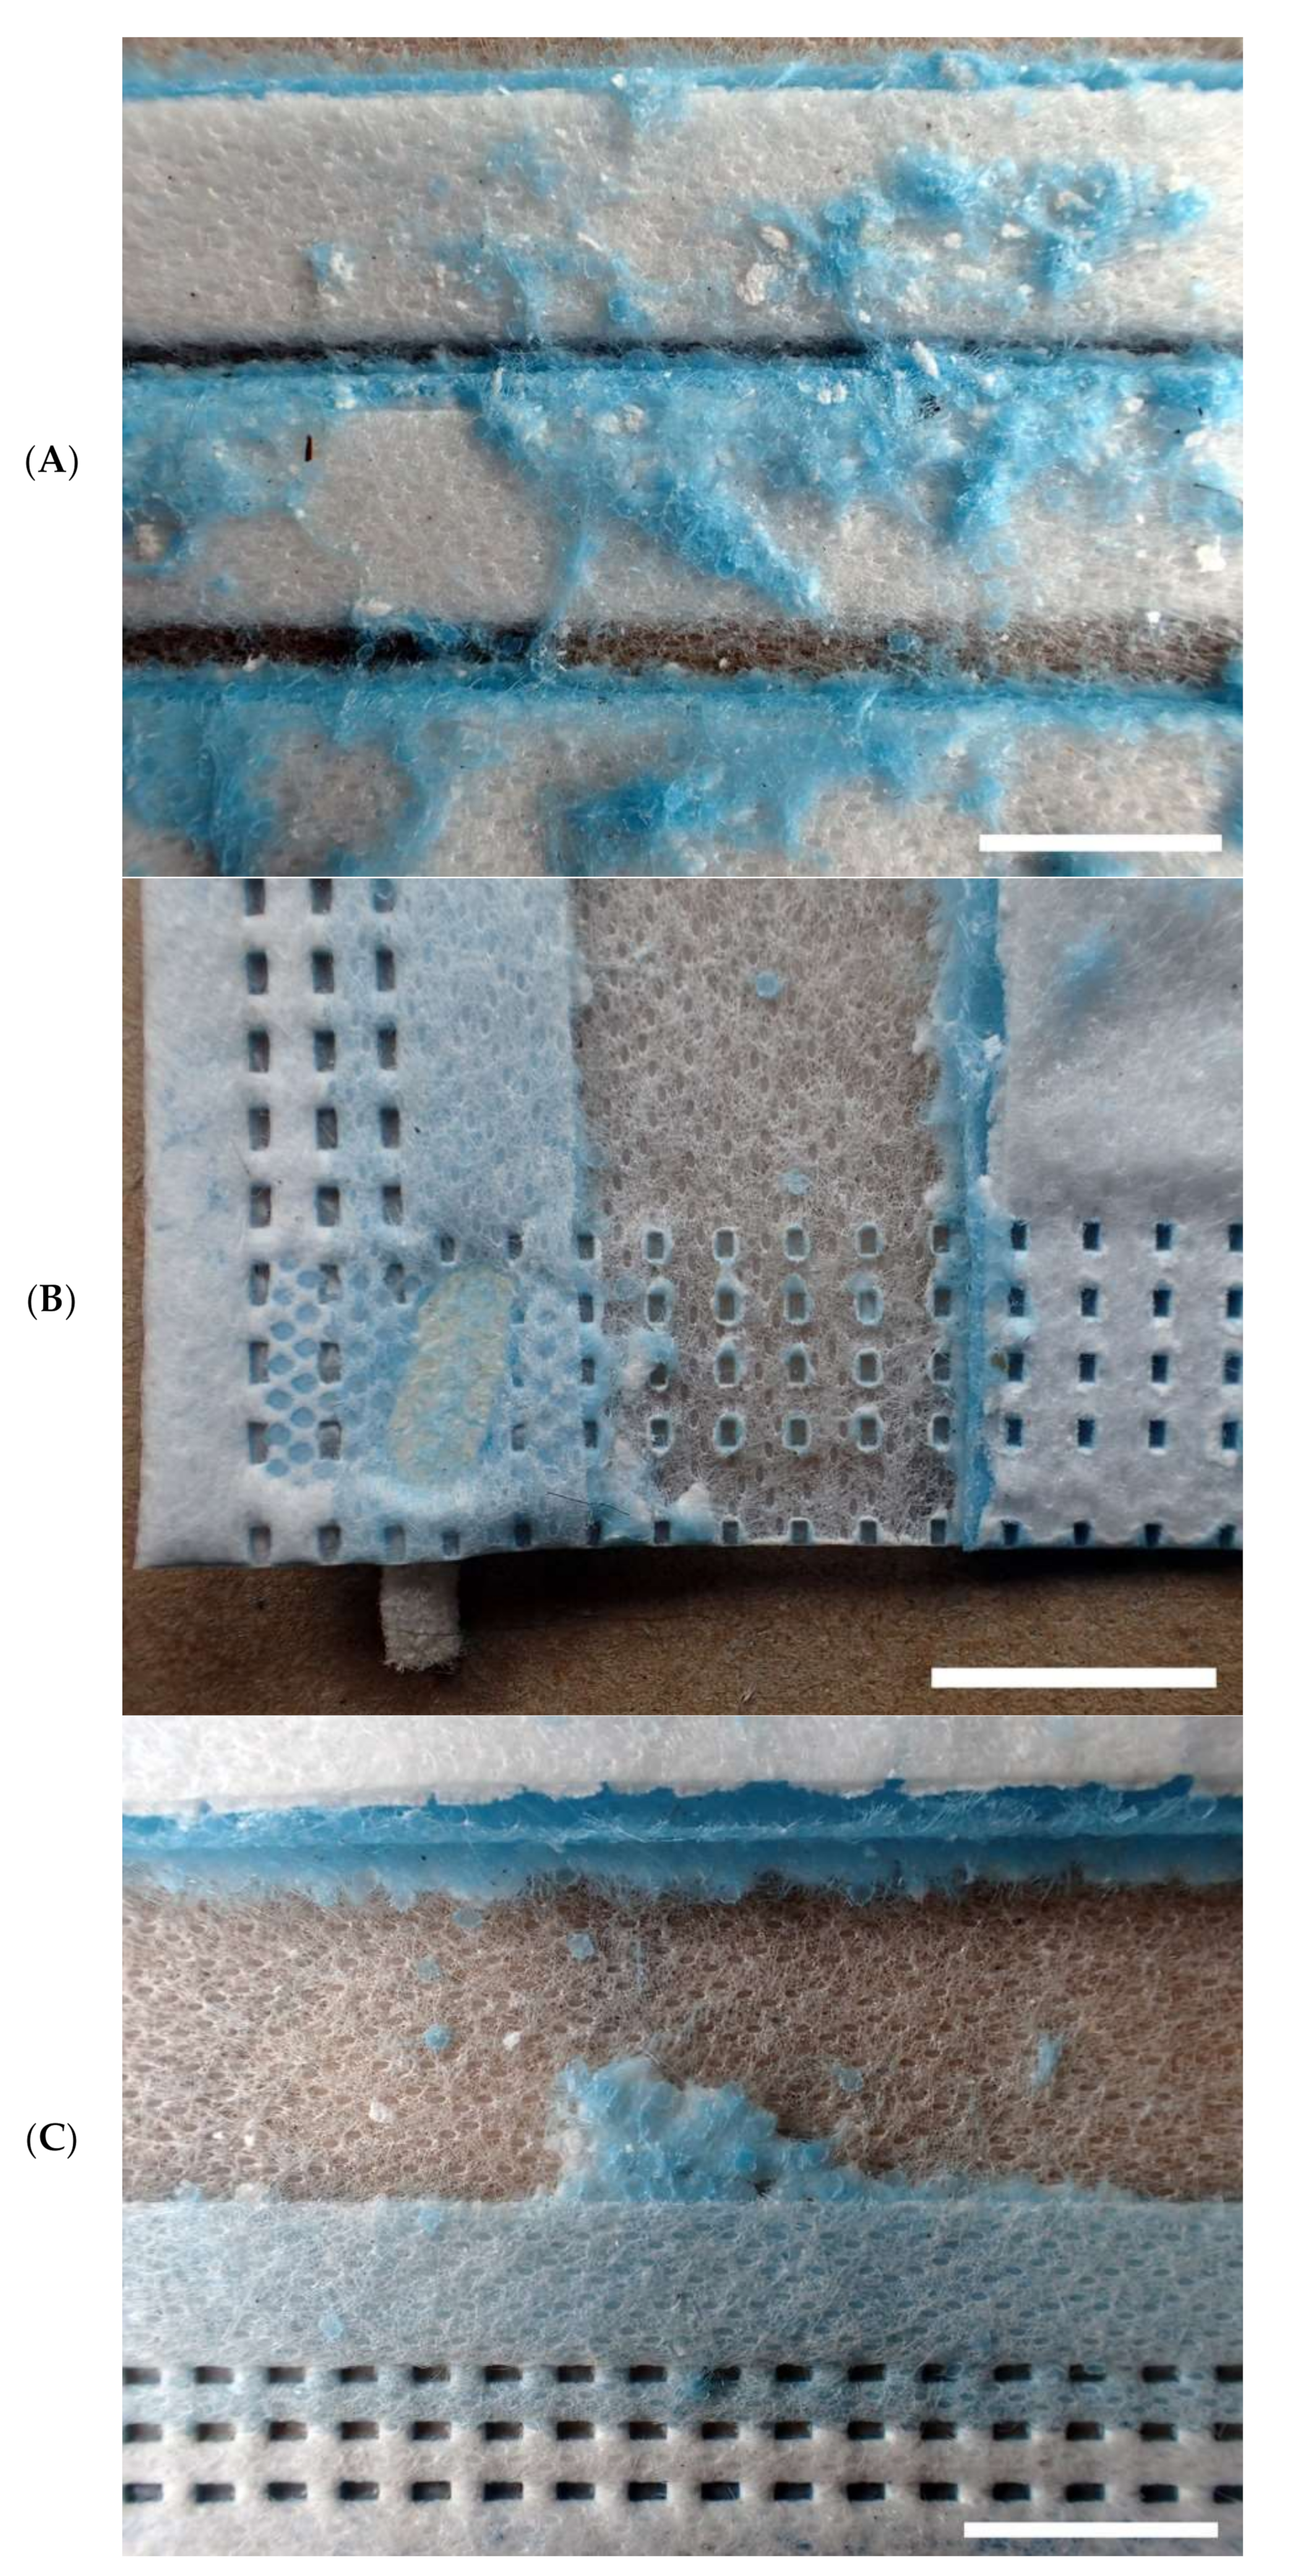

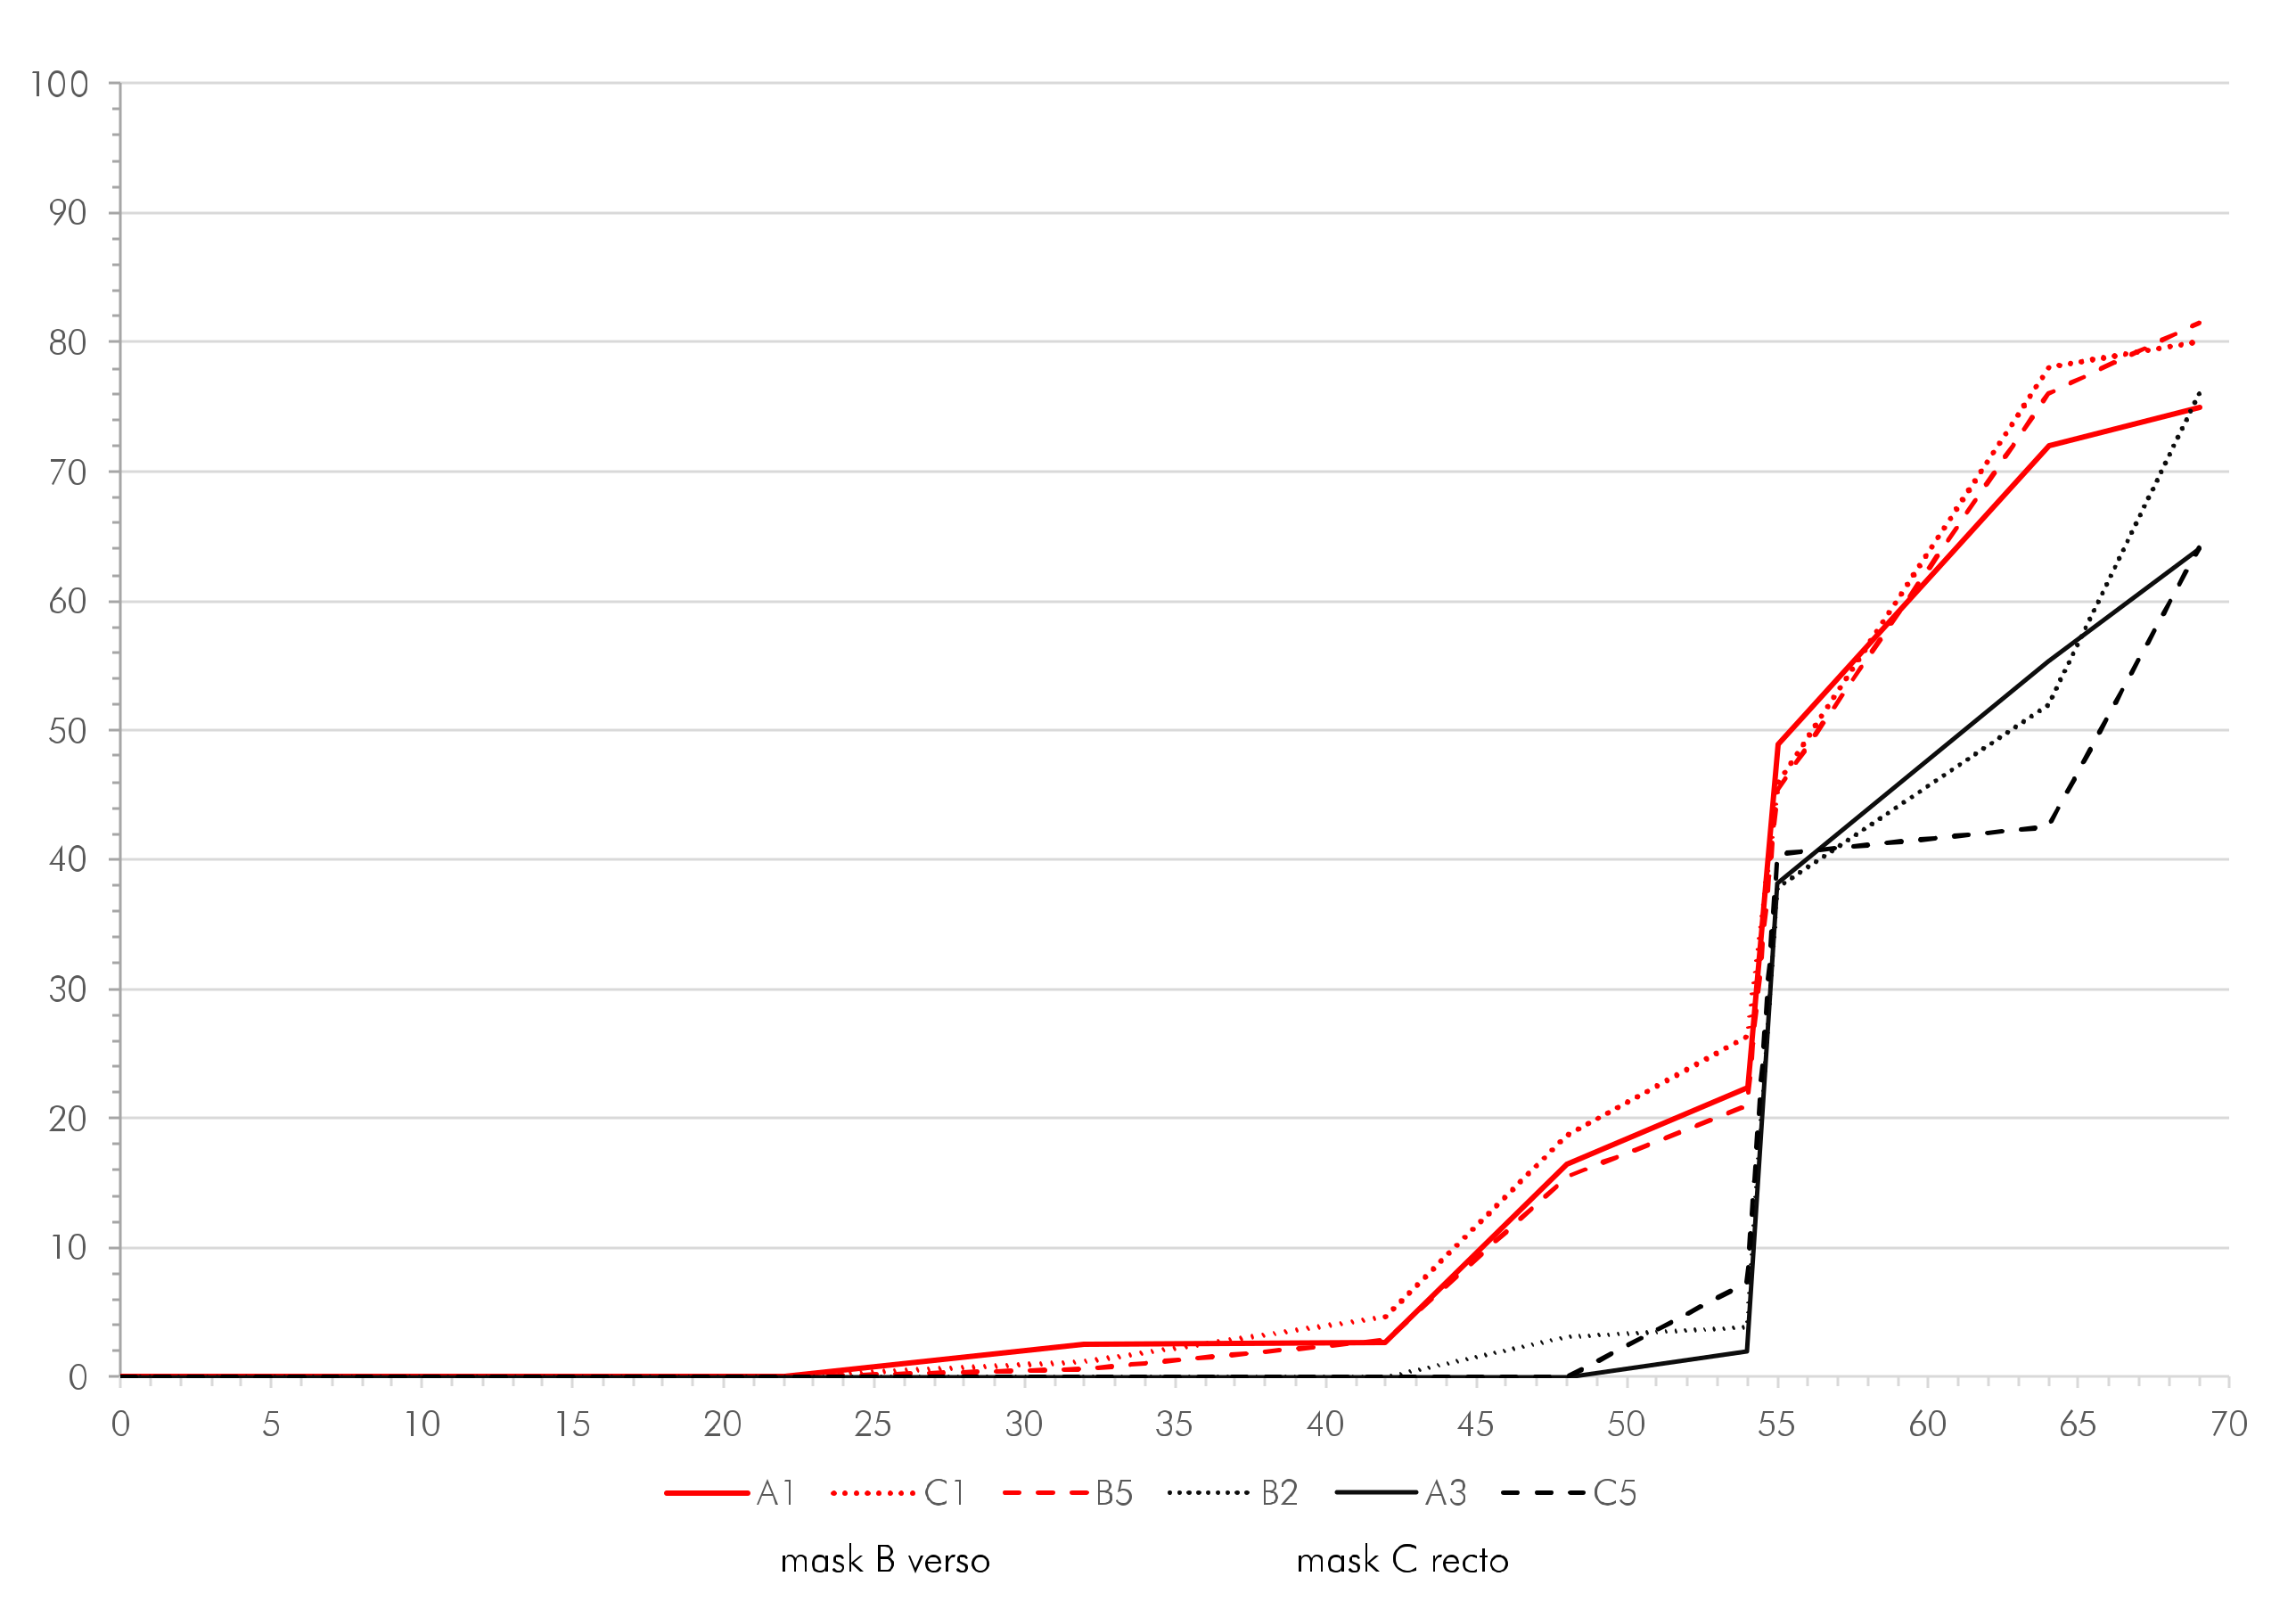
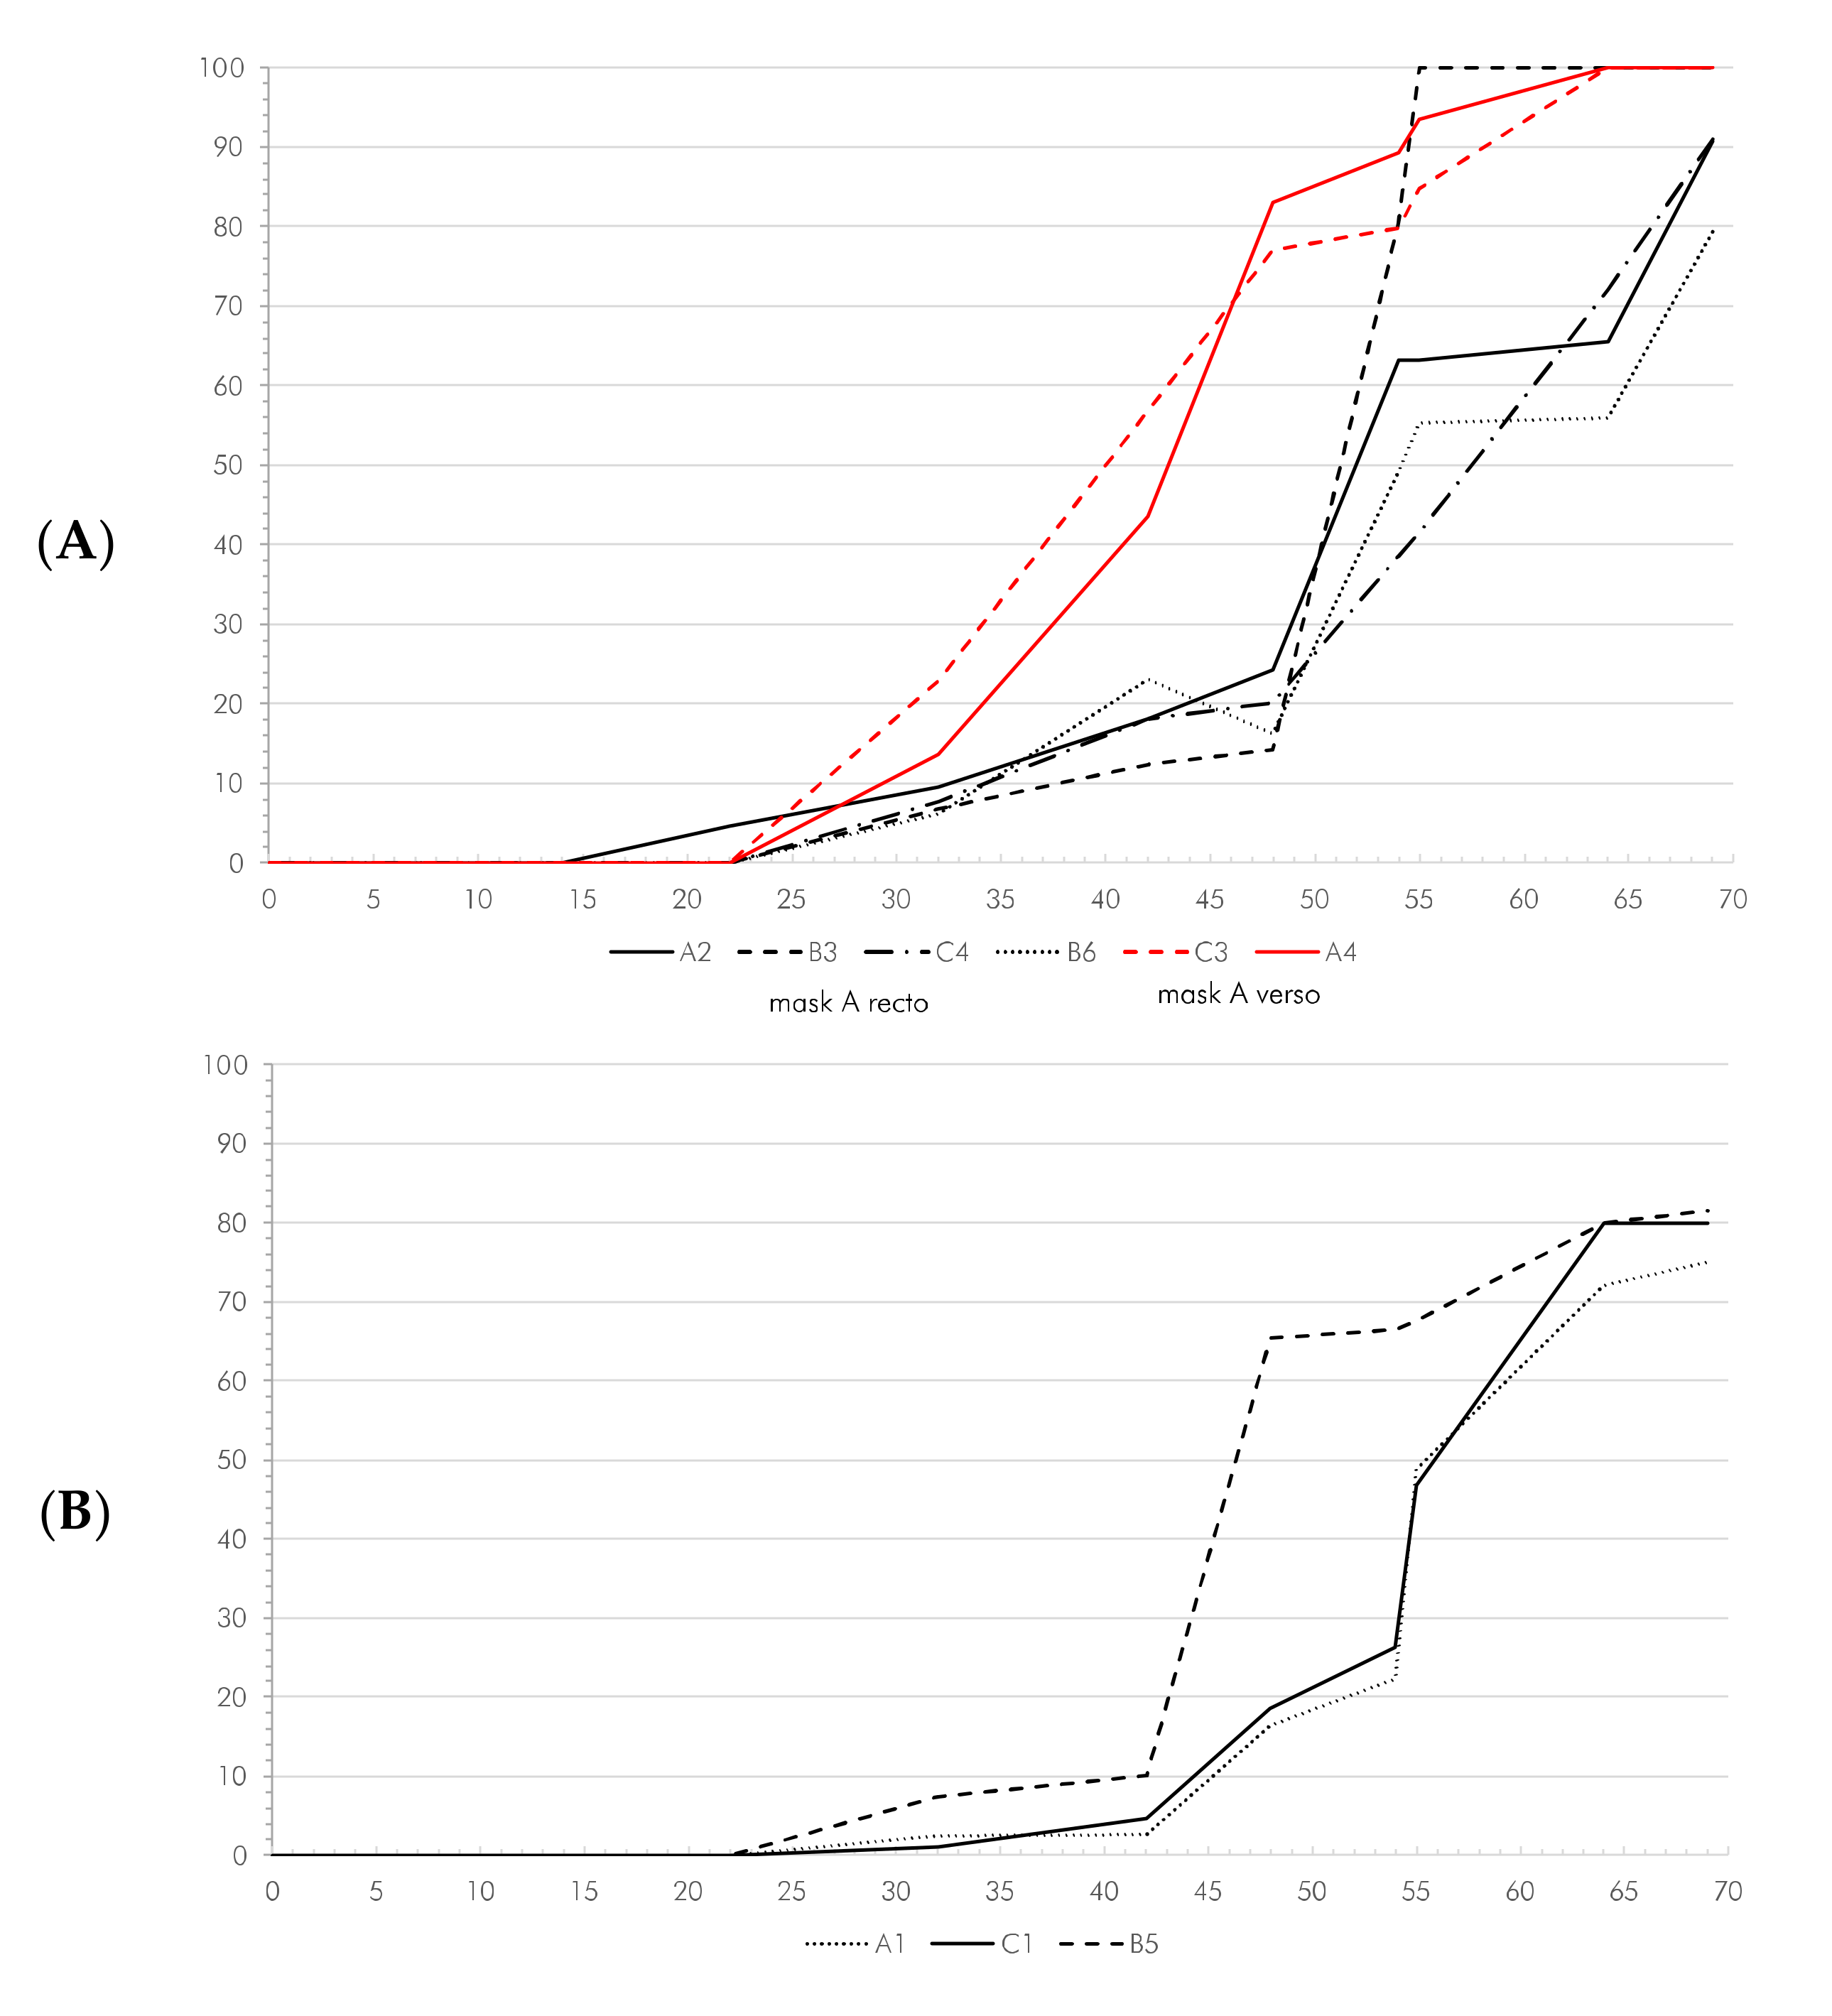
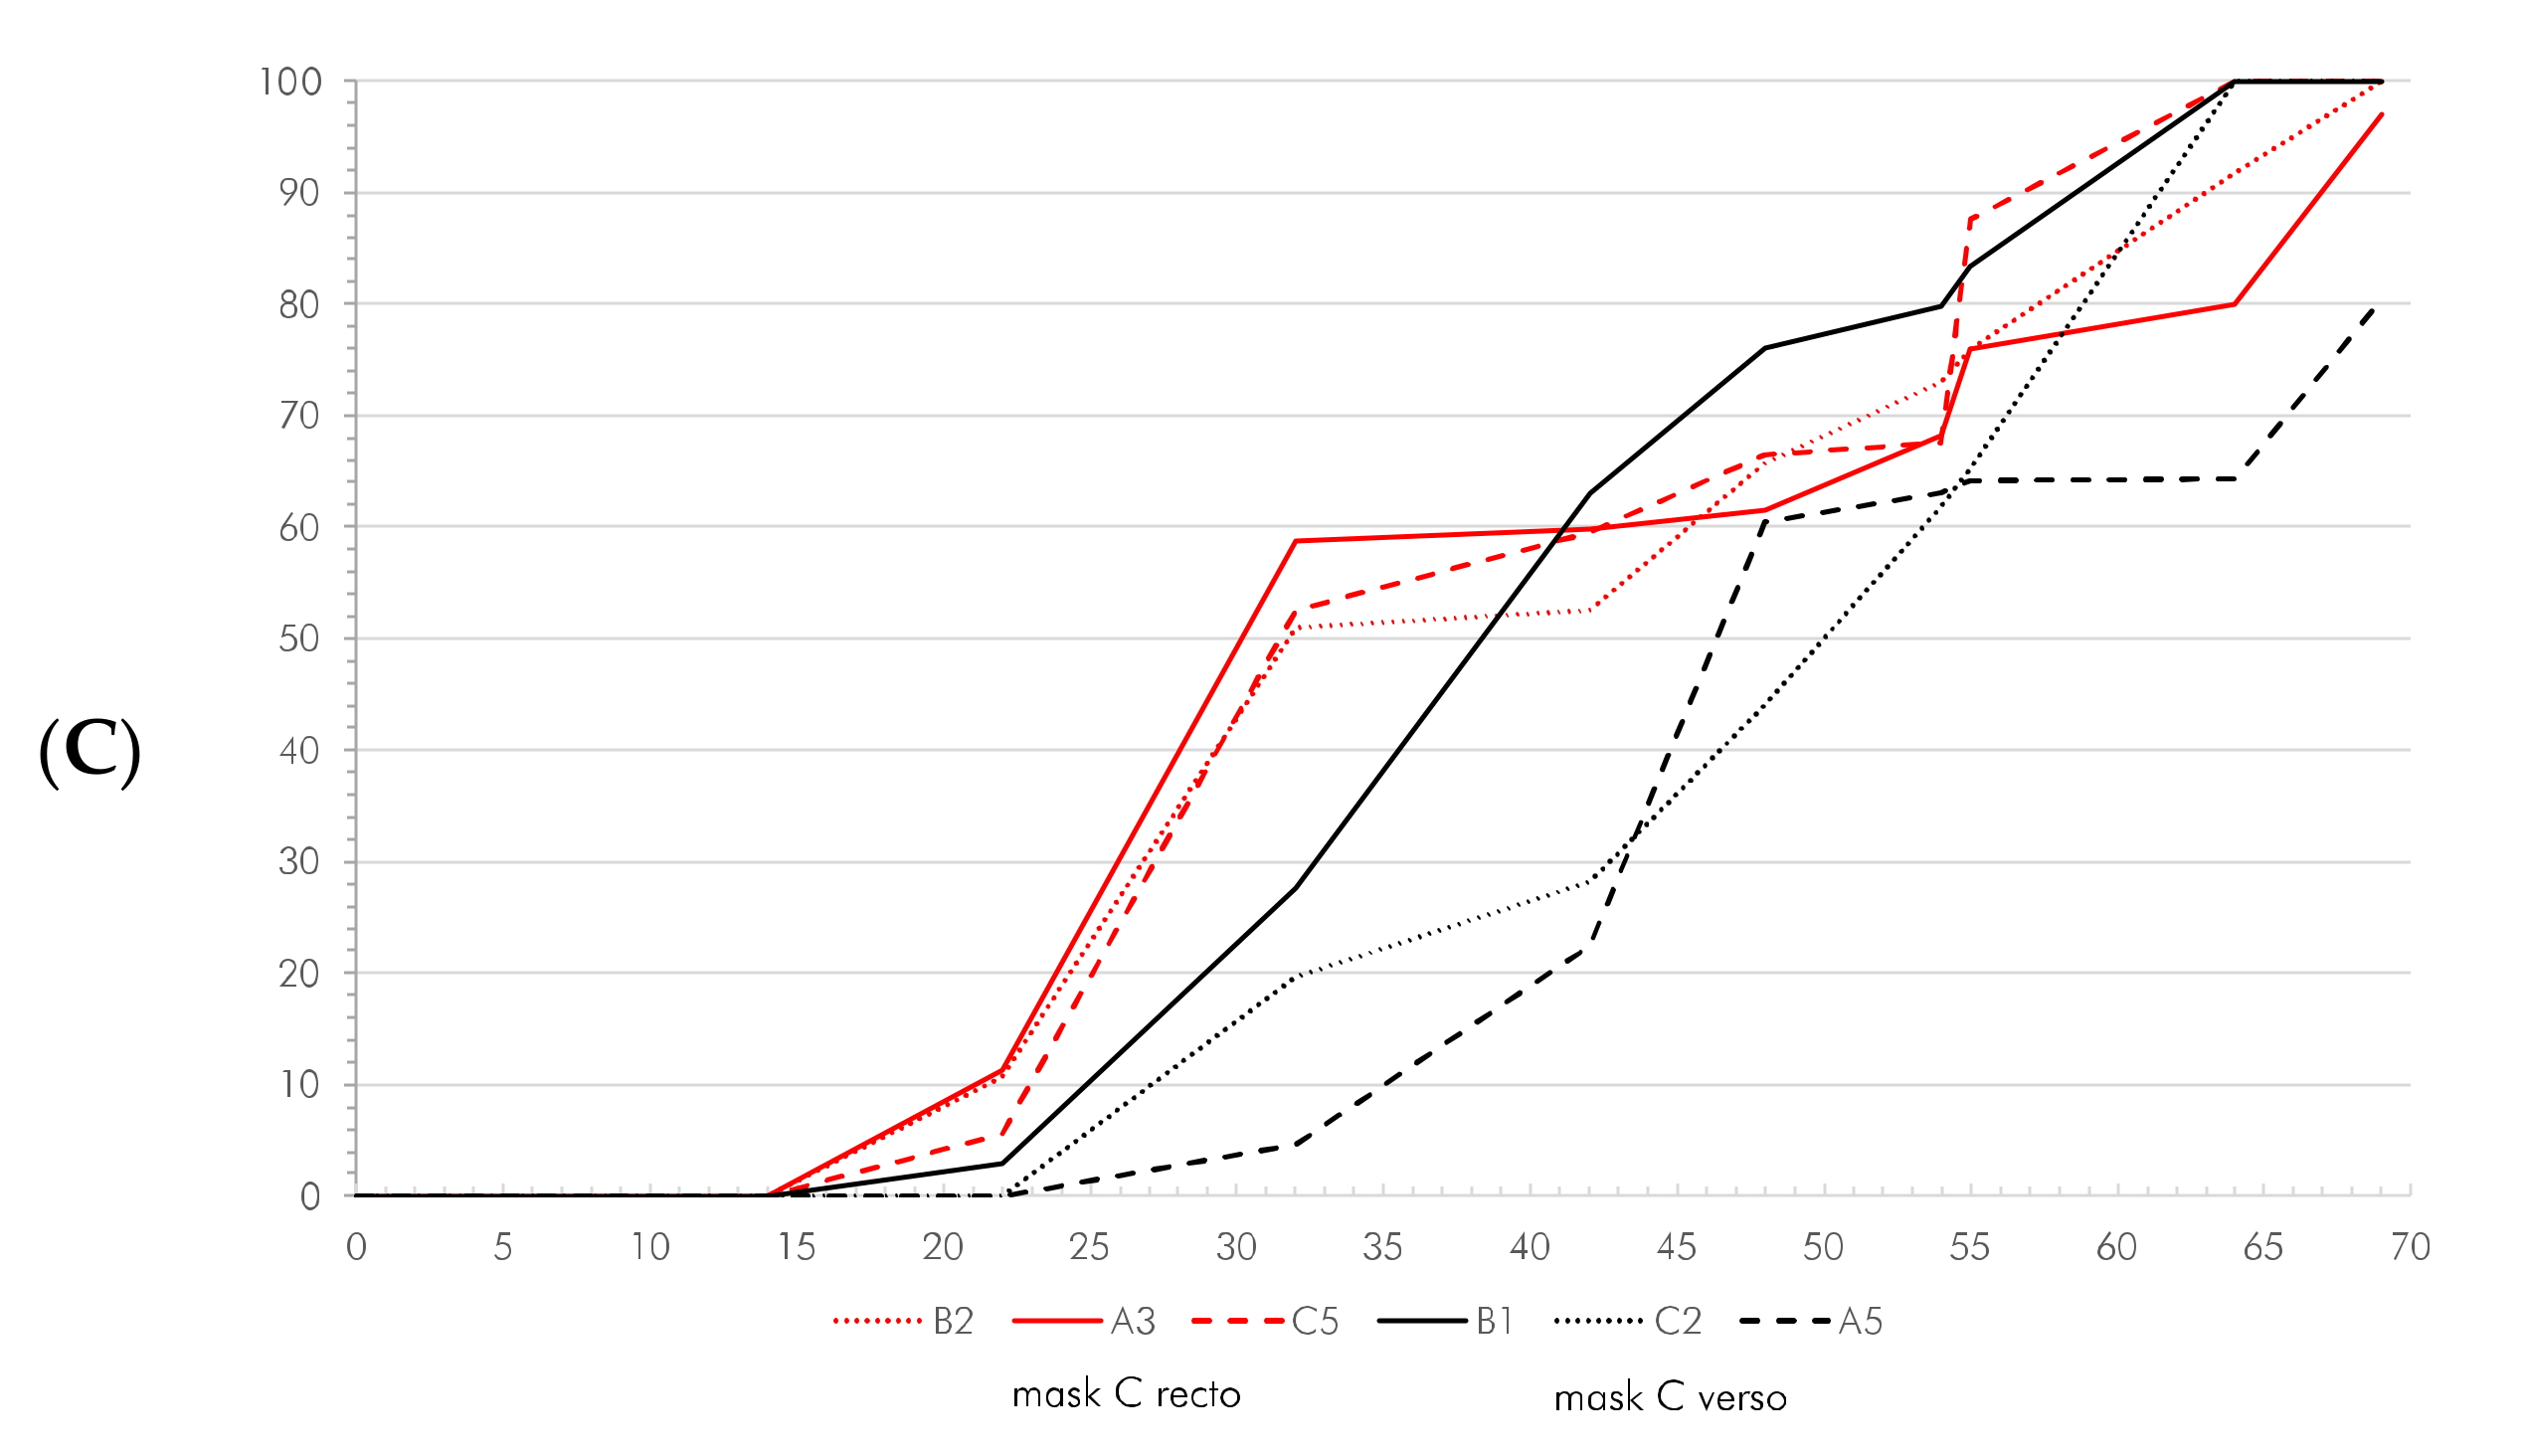
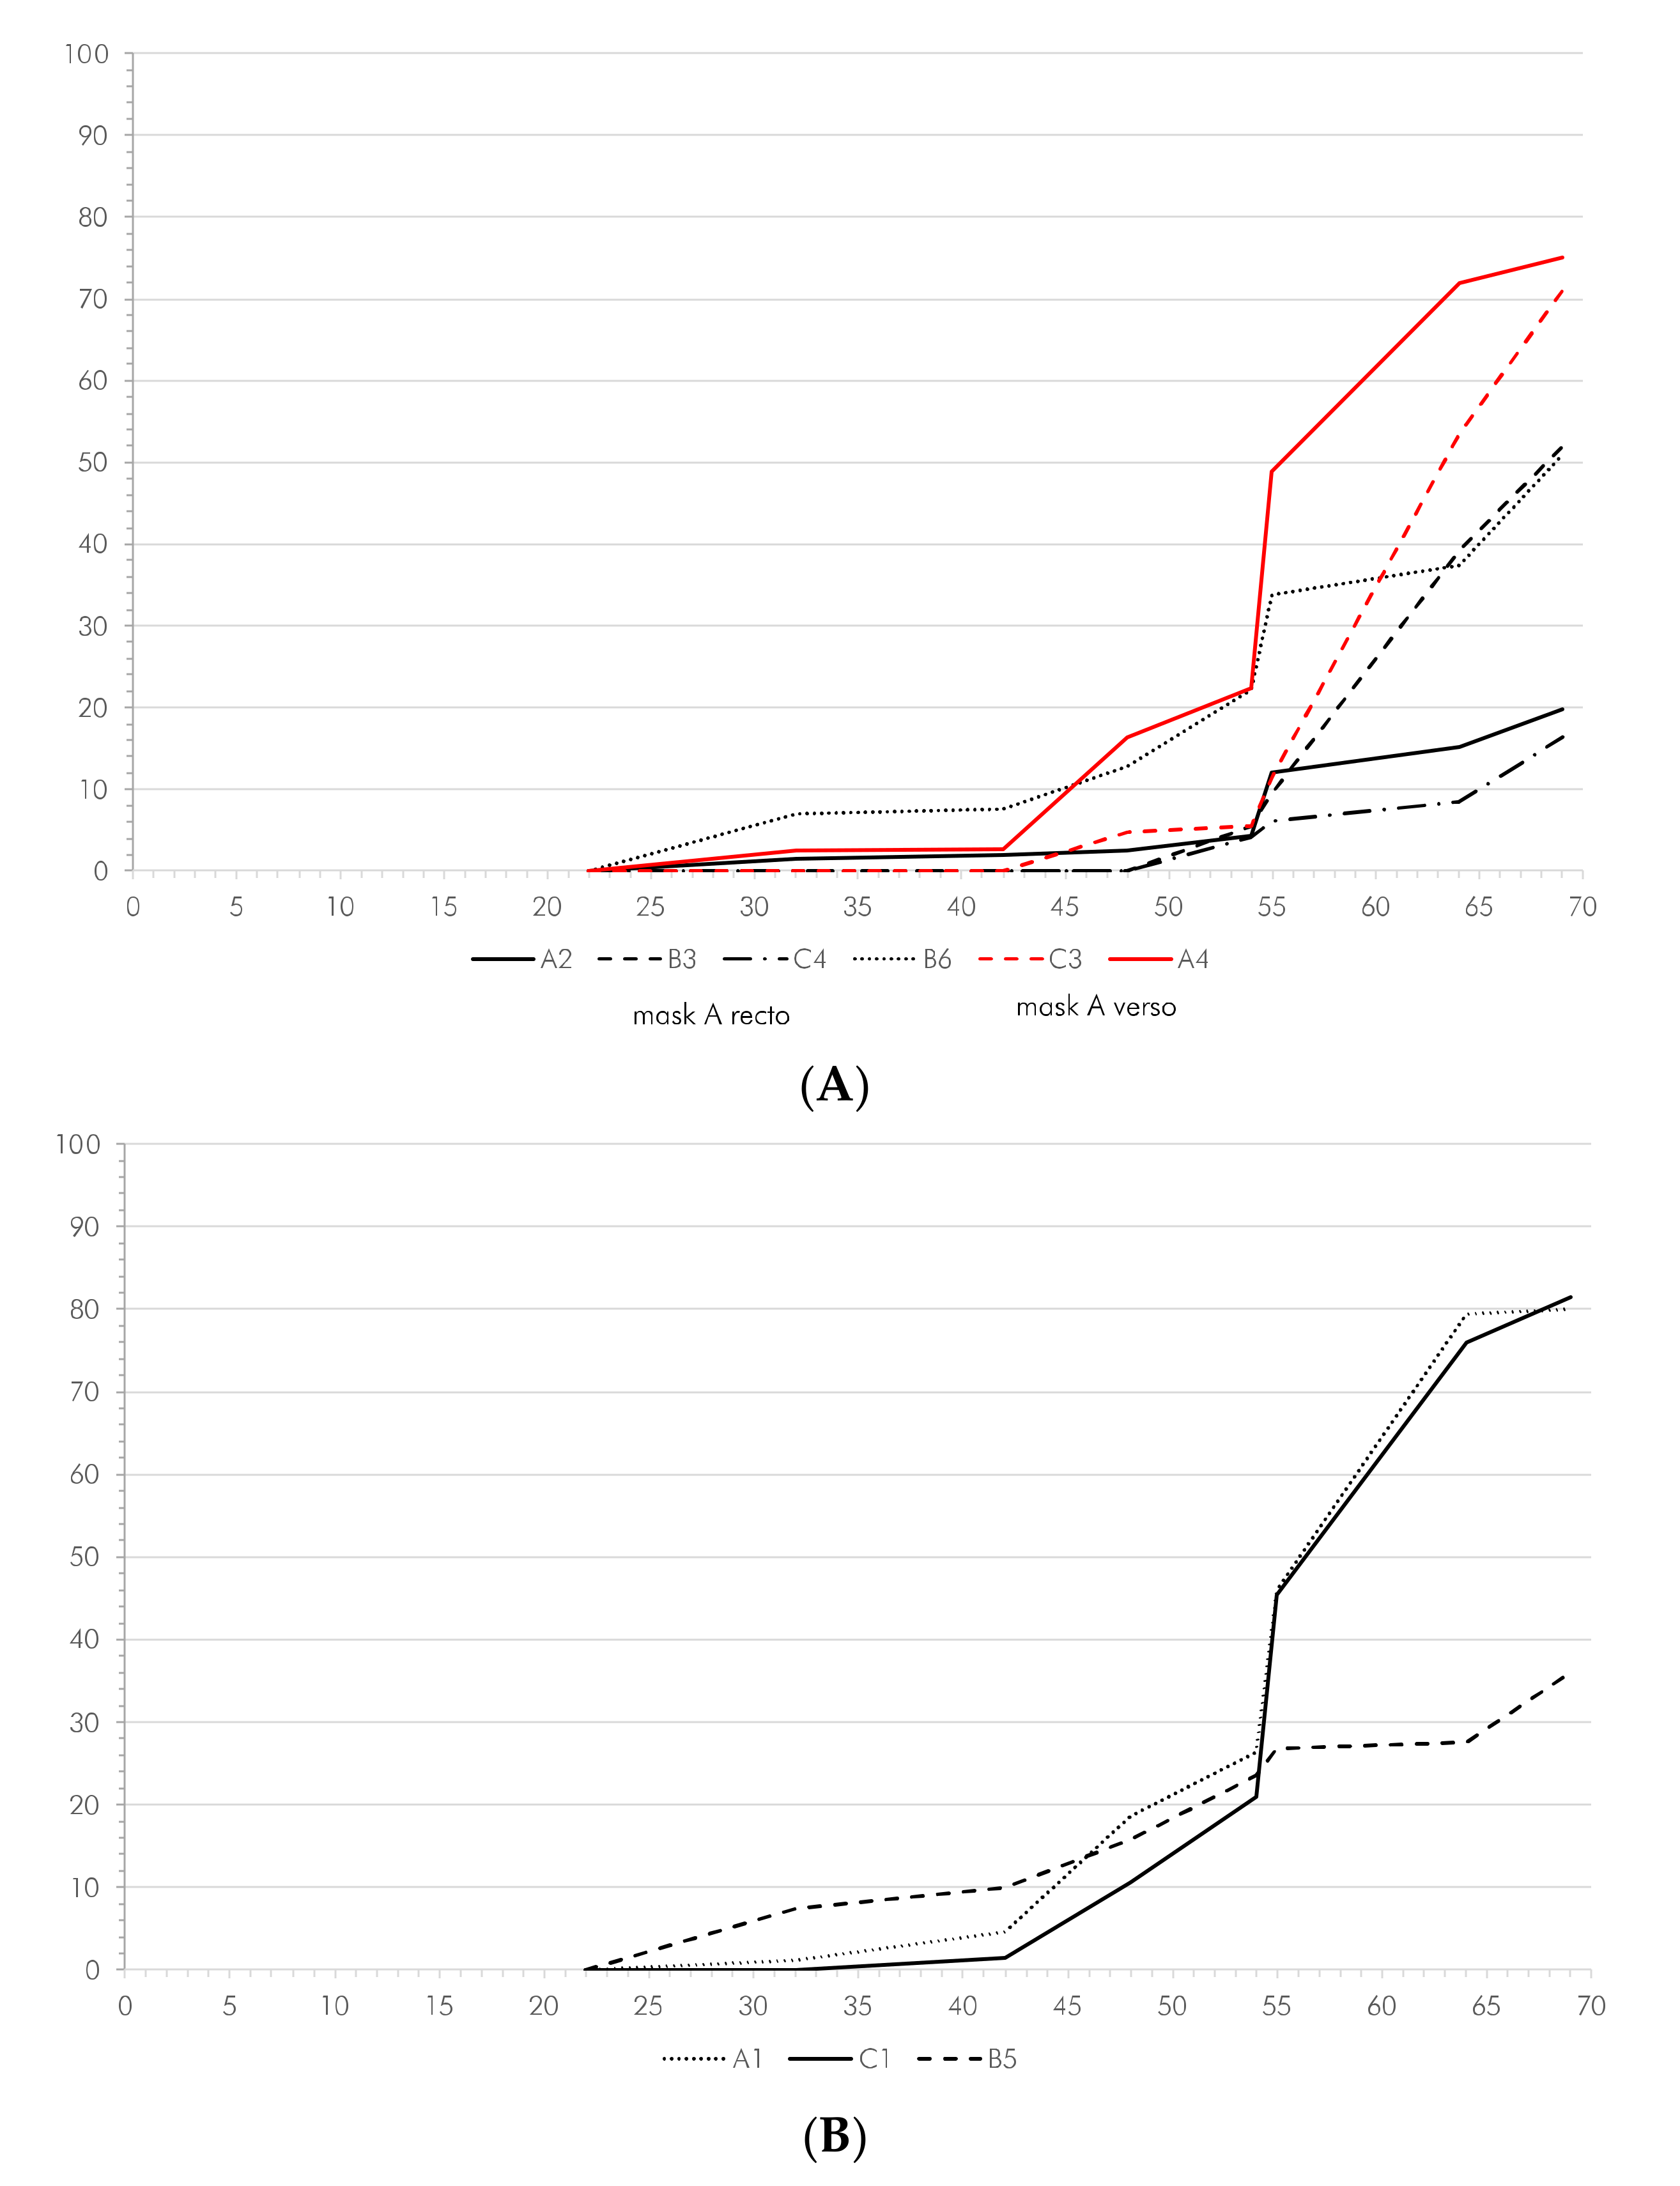

Publisher’s Note: MDPI stays neutral with regard to jurisdictional claims in published maps and institutional affiliations. |
© 2022 by the author. Licensee MDPI, Basel, Switzerland. This article is an open access article distributed under the terms and conditions of the Creative Commons Attribution (CC BY) license (https://creativecommons.org/licenses/by/4.0/).