Article

CH4 and CO2 Emissions from the Decomposition of Microplastics in the Bottom Sediment—Preliminary Studies

Department of Environmental and Chemistry Engineering, Faculty of Civil and Environmental Engineering and Architecture, Rzeszow University of Technology, AVE Powstańców Warszawy 6, 35-959 Rzeszów, Poland
*
Authors to whom correspondence should be addressed.
Environments 2022, 9(7), 91; https://doi.org/10.3390/environments9070091
Submission received: 22 March 2022 / Revised: 7 July 2022 / Accepted: 8 July 2022 / Published: 11 July 2022
(This article belongs to the Special Issue Plastic Contamination: Challenges and Solutions Volume II)

Abstract

:
In recent years, a significant new threat to the environment has emerged, namely contamination with microplastics and their degradation products. The decomposition products of microplastics include, among others, greenhouse gases that are responsible for climate change. The article analyzes the emission of carbon dioxide and methane during the decomposition of various types of plastics in the form of microplastics in the bottom sediments in the presence of water. The research covers plastic materials made of polyvinyl chloride with a high and low content of plasticizers, polypropylene, and rubber. All analyzed microplastics generated the tested greenhouse gases. However, the quantity of gases generated depended on the type of polymer used. The highest concentration of methane, at 25,253 ppm after 180 days of incubation, was characterized by high plasticizer polyvinyl chloride, i.e., di (2-ethylhexyl) phthalate. In the case of carbon dioxide emissions, the values were comparable. The maximum value was obtained at 65,662 ppm for polypropylene microplastics. The influence of particle size on the amount of the emissions of these gases was also investigated. During the decomposition of microplastics in the bottom sediments in the presence of water, it was observed that the smaller the microplastic particles are, the greater the production of methane and carbon dioxide.

1. Introduction

The production and use of plastics have grown rapidly in recent decades. However, the problem of the presence of plastics in the environment is a relatively new area of research. In recent years, the so-called microplastics (MPs) have come to the fore in terms of the risks posed by plastics. These are fine granules and particles derived from the decomposition of plastics, with a diameter of less than 5 mm. They come in a variety of shapes and colors. Commonly used plastics are polyethylene terephthalate (PET), polyurethane, (PU), polystyrene (PS), polyvinylchloride (PVC), polypropylene (PP), polyethylene (PE) and polyamide nylon (PA) [1,2,3]. Most plastics are made of synthetic polymers, mainly derived from petroleum processing. Commonly used plastics are polyethylene terephthalate (PET), polyurethane (PU), polystyrene (PS), polyvinyl chloride (PVC), polypropylene (PP), and polyethylene (PE) [1,2,3]. The increasing amount of plastic waste with the development of the economy constitutes a serious environmental and economic problem in industrialized countries. Due to this, there is a need to search for new polymer materials with biodegradable properties. Biodegradable polymers are macromolecular compounds produced from natural resources such as corn, sugar cane, agricultural waste, or biomass [4]. Microplastics can be classified based on their origin in primary and secondary microplastics. Primary microplastics are plastics produced in microscopic sizes. Secondary microplastics are the result of the breakdown of large plastic particles as a result of the action of physical, chemical, biological, and environmental factors. Any piece of plastic material can be a potential source of microplastics and pollutants [5,6,7,8,9]. The presence of microplastic particles in the environment poses a threat to the environment because of the toxicity of the components of the polymer matrix leached from the plastics. In 2015, around the world, only approximately 9% of the plastic produced was recycled, 12% was incinerated, and approximately 79% of the plastics produced were landfilled or ended up in the natural environment. Plastic waste also ends up in surface waters and oceans [10]. The components of polymeric materials present in natural water reservoirs break down into smaller and smaller fragments under the influence of wave movements and sunlight [11]. So far, water samples for MPs analysis have been taken primarily from the surface-water layer, which was based on the assumption that MPs particles, due to their size and density of plastics, float primarily on the surface of the water table. However, more detailed studies have shown that, despite the lower density, MPs particles can also be found in the water and sediment phases. Their position in the water column depends on the density of the material and the size of the particles. Moreover, particles with a density lower than that of water, as a result of aging processes and biofouling phenomena, increase their mass and, thus, fall, accumulating in bottom sediments [12,13]. Currently, it is recommended to take samples not only from the surface, but also from the water column and from bottom sediments [12]. Until now, research on the contamination of the environment by microplastics has mainly focused on the marine environment, and research on this subject is still ongoing and is being developed. The number of molecules determined in surface waters can also vary widely, from several to tens of thousands of particles in 1 m3 [14]. The level of pollution with these particles was analyzed, among others, by Norén (2007) [15], Tunçer et al. (2018) [16], Zhu et al. (2018) [12], Zhang et al. (2019) [17], and Han et al. (2018) [18]. Table 1 summarizes some of the most recent MP studies reporting the occurrence and fate of MPs in various components of the environment.
Currently, research is conducted around the world to assess the contribution of various natural and anthropogenic processes to the production of greenhouse gases, which gradually increase the average temperature of the Earth’s atmosphere. Opinions on the causes and effects of this phenomenon are extremely divided; nevertheless, one should look for answers to the questions of why this is happening, providing real data resulting from research under natural conditions. Greenhouse-gas emissions occur at every stage of the plastic lifecycle, during fossil-fuel extraction and transportation, refining and product manufacturing, plastic-waste management, and, in the long term, during environmental degradation. Greenhouse-gas emissions from the plastic lifecycle threaten the ability of the global community to keep global temperature rise below 1.5 °C degrees [23]. This fact may be very important, mainly due to the quantity of plastics produced. Industrially produced plastics are synthesized from natural gases. Their decomposition during and after use is expected to be accompanied by the emission of the same or different gases, mainly hydrocarbons [23]. The only available research results, on the estimation of gas emissions from MP decomposition, are presented by Royer et al. (2018) [24], who report that when exposed to solar radiation, polyethylene and polypropylene emit two greenhouse gases in particular: methane and ethylene. The production of gases from low-density polyethylene increased with time; after 212 days of incubation, the rate of formation of methane and ethylene was 5.8 nmol/g∙d and 14.5 nmol/g∙d, respectively. A large proportion of plastics end up in the aquatic environment in an uncontrolled manner. The particle diameters of these materials reach even micro- or nanometers. When exposed to various physical or chemical effects, they decompose in the same or similar way as organic matter of natural origin. They can be located in the water column or in the anaerobic zone of the bottom sediments; therefore, the mechanisms of their decomposition may differ depending on the deposition zone. Polymer degradation occurs through two main mechanisms, hydrolysis and photo-oxidation. Hydrolytic degradation is defined as the interaction with water leading to breakage of the chemical bonds in the polymer. In turn, photo-oxidation involves radical reactions in which oxygen enters the polymer chain after breaking the C=C bonds. These processes are strongly enhanced by UV light because it induces the formation of oxygen radicals. It may be particularly important to take into account the process of micropollutant decomposition in the sedimentation zone of the bottom, where the access of light is limited. There are no reports on the quantitative and qualitative parameters of the decomposition of MPs and the production of gases and other substances from them under natural conditions, particularly in the bottom sediments [25,26].
The objective of the article is to supplement the existing research and provide new information on the impact of the microplastic-decomposition-process conditions on greenhouse-gas emissions (CO2 and CH4) in the bottom sediments. The importance of this research in terrestrial systems is unknown; therefore, there is a great need for research in this area, especially in ecosystems exposed to long-term anaerobic conditions that can prevail, among others, in degraded dam reservoirs. Acquiring the above information may contribute to changing the existing views on the harmfulness of the microplastic-degradation process in inland water systems.

2. Materials and Methods

2.1. Reagents and Materials

Standard methane and carbon dioxide gases were obtained from Air Products (Allentown, PA, USA) as a 100-ppm mixture of each component. Gastight syringes were obtained from Hamilton (Reno, NV, USA). The emission of methane and carbon dioxide from the decomposition of microplastics in the water environment was analyzed for three types of plastics, polyvinyl chloride (PVC), polypropylene (PP), and rubber (Table 2). Two types of polyvinyl chloride materials with low plasticizer content (gasket) and high plasticizer content (foil) were analyzed [27]. Polypropylene gloves were for everyday use, while rubber tires were used as car tires.

2.2. Sample Preparation and Experimental Conditions

The materials were cut into particles of a size of 1000–3000 µm. In turn, the tires were cut into several fractions (3000–8000 µm, 1000–3000 µm, 1000 µm, 600 µm) in order to analyze the effect of particle size on the emission of selected greenhouse gases. The incubation was carried out in 100 mL glass containers with a screw cap. In total, 7 g of homogeneous bottom sediments were placed in bottles. The bottom sediments were not sterilized. The bottom sediments in this work were collected from Rzeszów Reservoir (Poland), from three points located along the axis of the reservoir. A gravity sediment corer (KC Kajak of Denmark) was used in all cases. The total weight of the sample taken was about 10 kg. The characteristics of the collected sediments are presented in Table 3. Then, 2 g of the analyzed microplastics and 14 mL of deoxygenated distilled water were introduced. Three parallel samples were prepared. Blank samples were carried out in parallel—without the addition of plastics (Supplementary Material, Figure S1a,b). The prepared samples were sealed and incubated at 20 ± 2 °C in the absence of light (in the dark). Incubation was carried out for 30, 180, and 360 days, respectively. Three repetitions were carried out for each test variant. The samples were prepared in a helium atmosphere using a Glove Box from Plas Labs, Inc. (Lansing, MI, USA). Next, 1 mL samples were taken with gastight syringes for chromatographic analysis. Chromatographic analyses of the amount of CH4 and CO2 formed were performed three times for each sample.

2.3. Instrumental Analysis

2.3.1. Determination of CH4 and CO2

The amount of methane and carbon dioxide produced was analyzed using a GC 2010 Plus gas chromatograph (Shimadzu, MD, USA) equipped with a Barrier Discharge (BID) ionization detector. The operating parameters of the chromatograph are presented in Table 4.

2.3.2. Particle Analysis

Microplastic samples were deposited on infrared reflective glass slides (7.5 × 2.5 cm; MirrIR, Kevley Technologies, Chesterland, OH, USA). Glass slides were analyzed in transflection by automated LDIR (QCL) Imaging (8700 LDIR, Agilent Technologies, Santa Clara, CA, USA). The characteristics of the materials analyzed are presented in Figure 1 and Table 5.
The characteristics of the exemplary particles analyzed, in terms of size and shape, are presented in Table 5. Values of parameters such as solidity or circularity are presented. Solidity is the ratio of the actual surface area of an object to the surface area constituted by a thread stretched around the particle. Circularity, on the other hand, determines how close a given particle shape is to a perfect circle.

2.4. Statistical Analysis

The results were analyzed with MS Excel 2013. Before statistical analysis, values below the LOQ were replaced by the LOQ/2 value for each compound. Each substance was tested in the concentration range present in at least three independent experiments. The basic descriptive statistics were then defined to achieve a general characterization of the results. The results in the graphs are presented in the form of an arithmetic mean. The coefficients of variation for all experiments did not exceed 5; therefore, they were not shown in the figures.

3. Results and Discussion

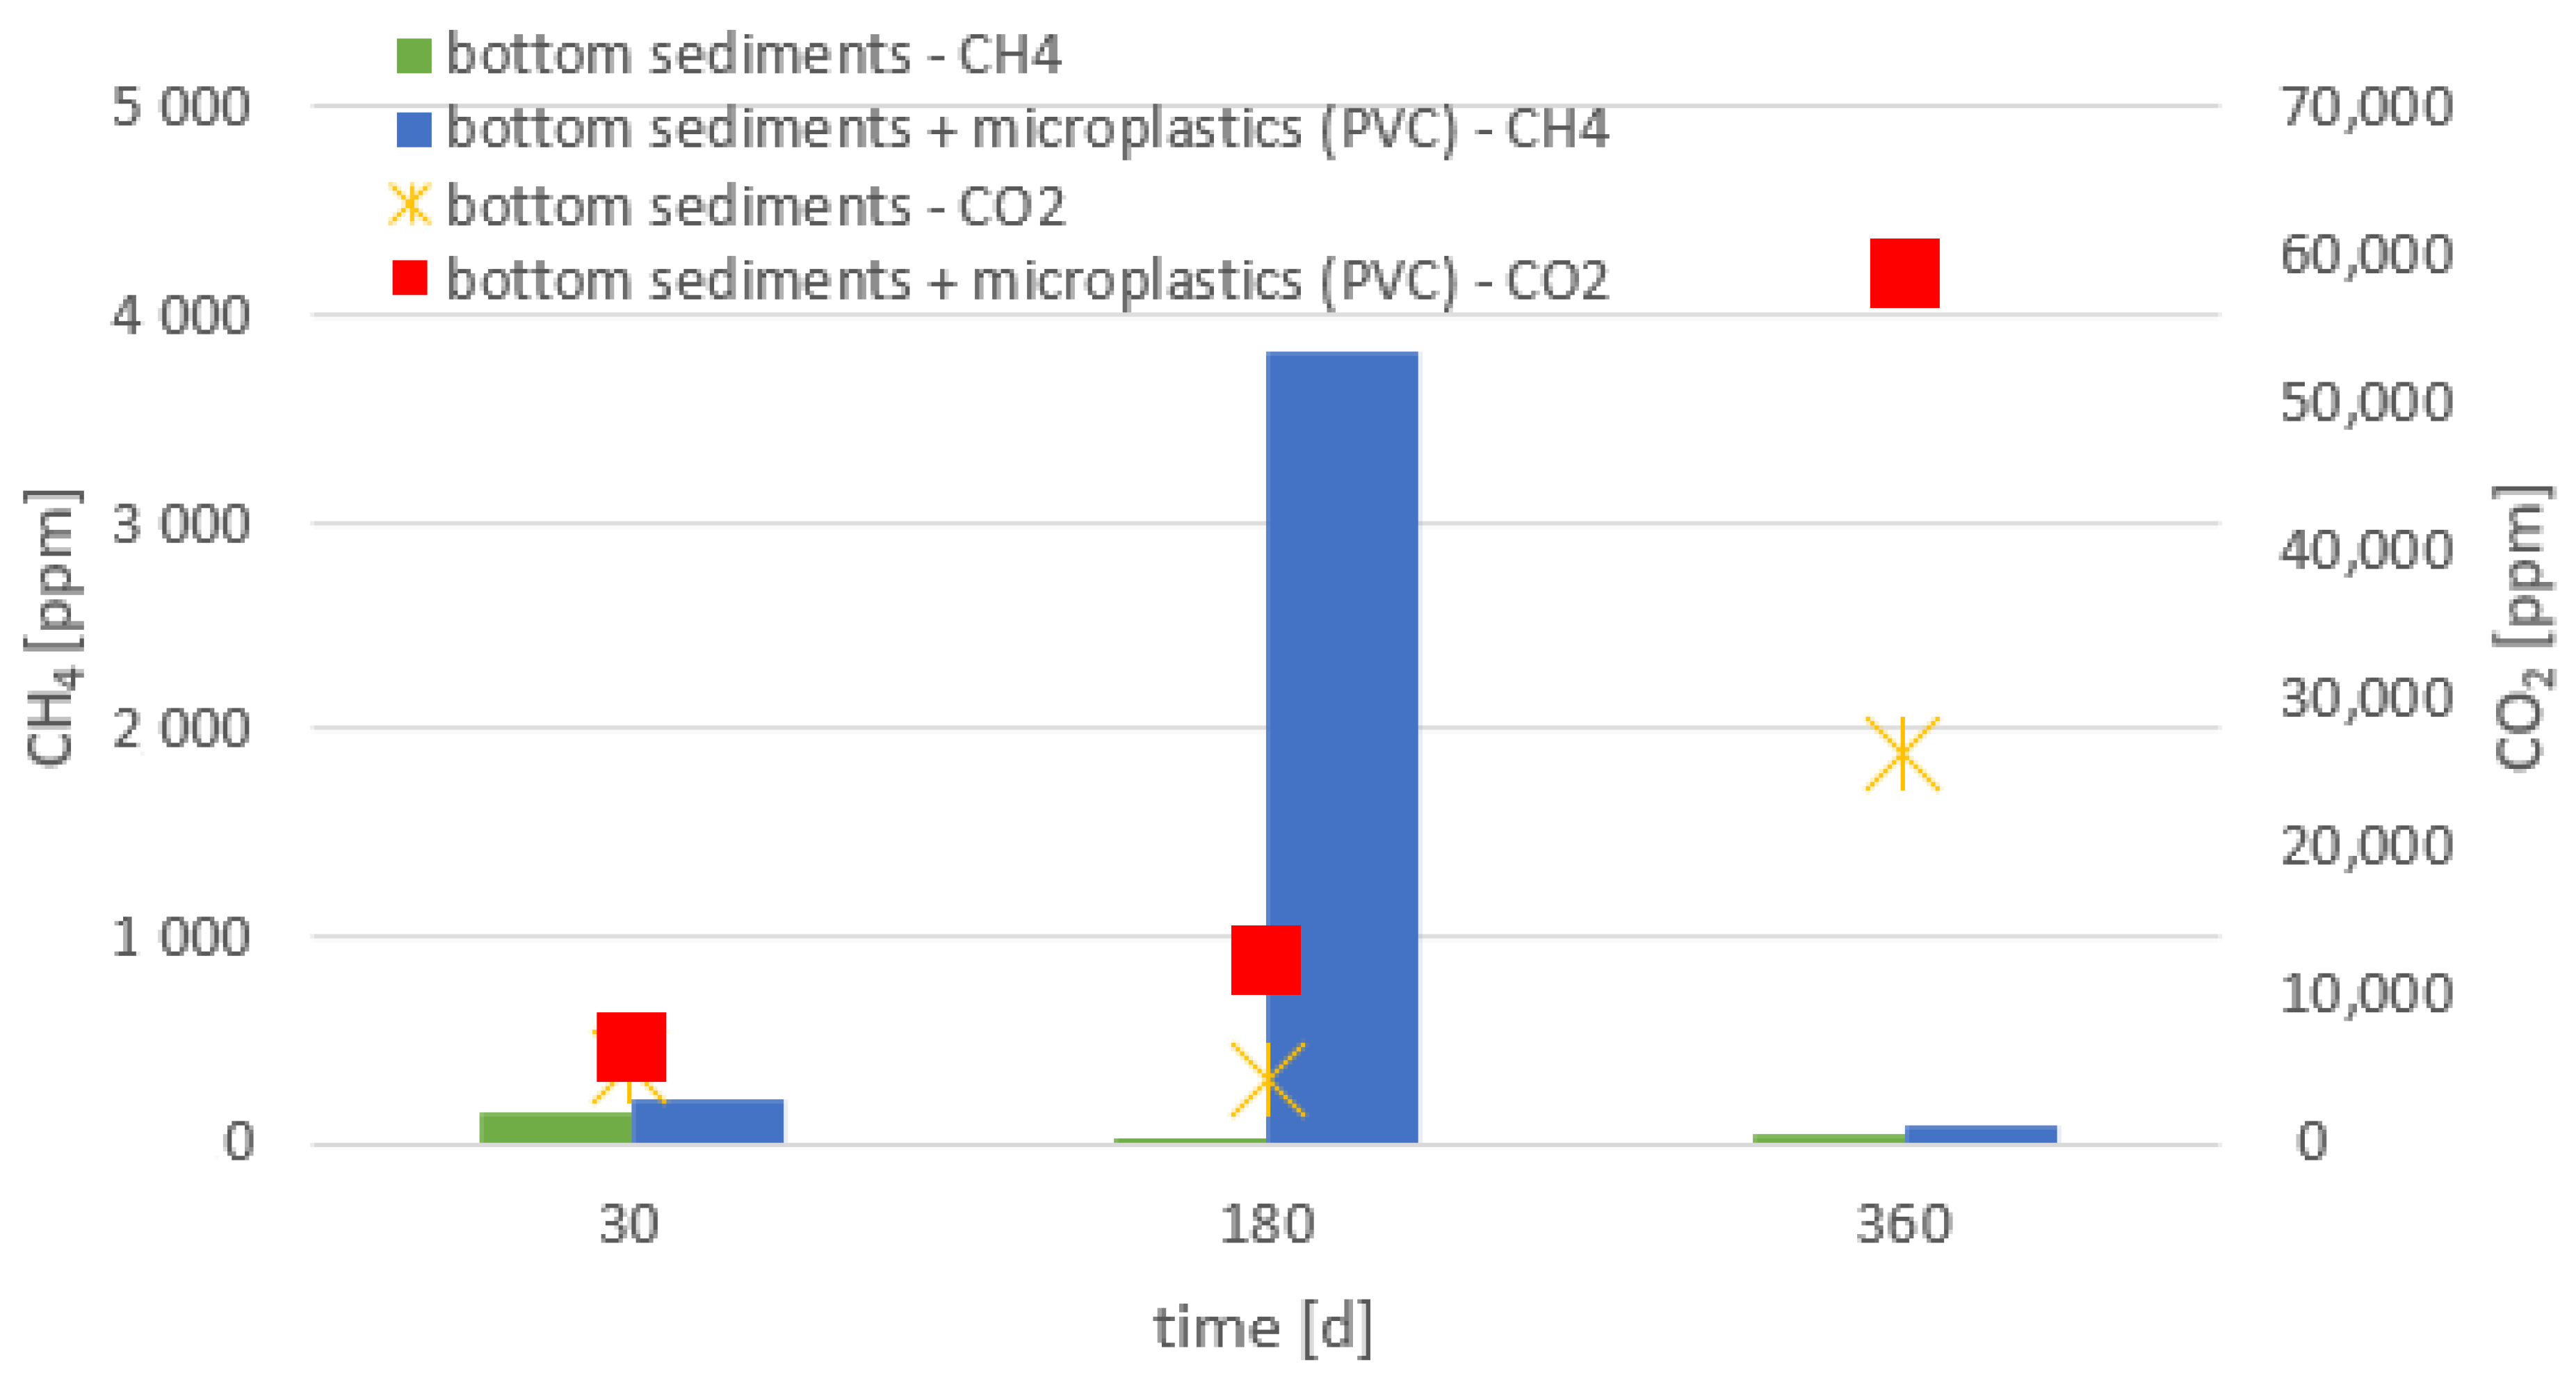
Research on greenhouse-gas emissions, for the example of the methane and carbon dioxide generated during the decomposition of microplastics located at the bottom of water reservoirs in bottom sediments, showed significant differences in the production of these gases depending on the material used (Figure S1, Supplementary Material, Table 1). During the decomposition of polyvinyl chloride, after 30 days, the concentration of methane was recorded in the amount of 215 ppm, while the decomposition of natural organic matter contained in the collected bottom sediments resulted in the emission of methane in the amount of 150 ppm, and this value decreased along with the incubation time. On the other hand, the presence of PVC in the bottom sediments after 180 days resulted in a significant increase in CH4 concentration—3811 ppm (Figure 1). However, after 360 days, a significant reduction in the concentration of this gas emission was observed, which requires further analyses to identify the degradation processes and mechanisms that are taking place.
Gases produced during the decomposition of organic matter can be used in aquatic ecosystems (e.g., photosynthesis, CH4 oxidation). However, it should be remembered that only in an undisturbed state are the processes of production and consumption in equilibrium. During the decomposition of this type of microplastic, an increase in carbon dioxide emission was also observed. These values were twice as high as those of the bottom sediment distribution without the addition of plastics. After 360 days of incubation, the carbon dioxide concentration was 58,727 ppm (Figure 2). Although CO2 is formed under the conditions of aerobic-polymer degradation, reports in the literature indicate that some polymers can produce some CO2 under anaerobic conditions [28]. In anaerobic conditions, soluble carbon compounds (additives, e.g., plasticizers) are metabolized by methanogens or sulfate reducers, producing CH4 and CO2, respectively [29].
Methane can be oxidized under anaerobic conditions by archaea present in bottom sediments. Some archaea are capable of obtaining energy in the process of methane oxidation, i.e., reverse methanogenesis. Methane is oxidized to bicarbonate or CO2 with the simultaneous reduction in sulfates acting as an electron acceptor. Such a reaction is possible due to the symbiotic interactions between archaea and sulfate-reducing bacteria, which together form a biofilm [30].
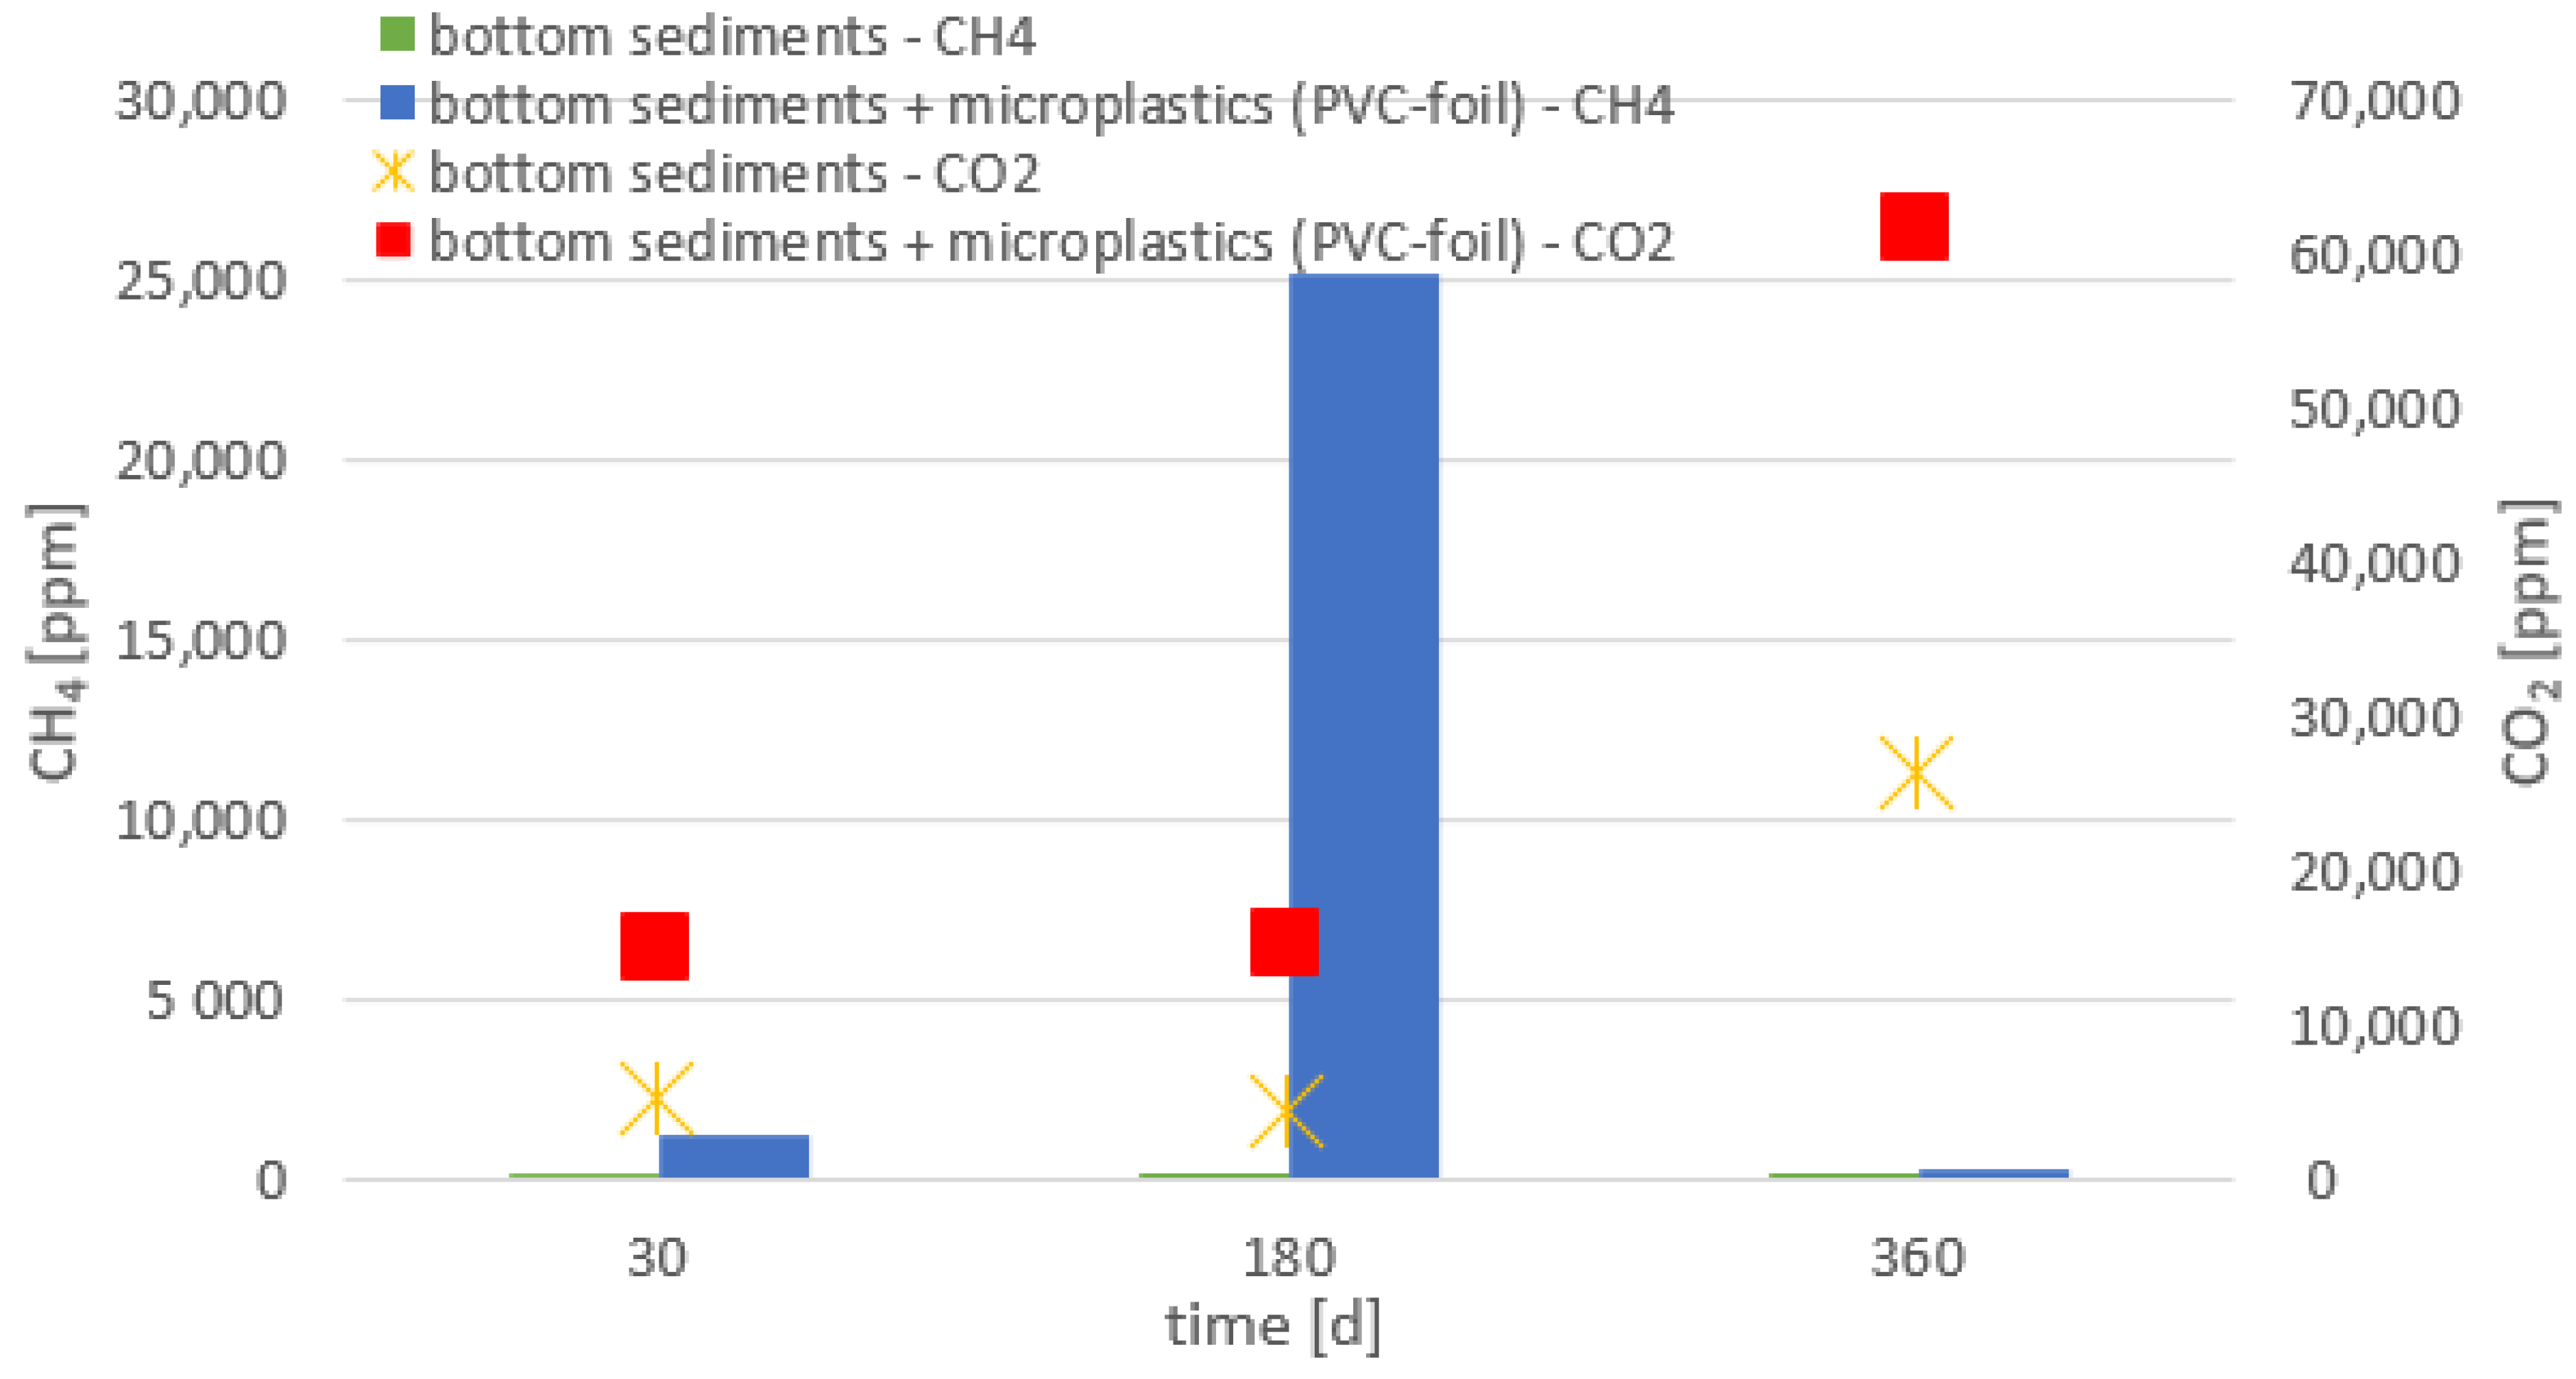
In the next stage, the influence of the content of the most popular plasticizer from the group of phthalic acid esters on the emission of the analyzed greenhouse gases was taken into account. Two types of polyvinyl chloride materials with low (gasket) and high (foil) plasticizer content were analyzed. The mass fraction of di (2-ethylhexyl) phthalate in the tested material (polyvinyl chloride foil) was approximately 60% of the total mass (Figure 3). The effect of polymer additives was found to have a significant impact on the volume of methane and carbon dioxide emissions in the bottom-sediment environment, particularly with respect to this methane. After 30 days of foil incubation, the methane concentration was almost six times higher compared to the gasket, and after 180 days it was almost seven times. Smaller differences were observed for carbon dioxide emissions. After the first 30 days, the methane concentration for the foil was almost 2.5 times higher (14,895 ppm) compared to the gasket (6364 ppm). In the days following the degradation of microplastics in the aquatic environment, this difference was not significant. Probably, the differences in the amount of CH4 and CO2 emissions during the degradation of the two materials could also be due to the easier degradation of the film compared to the gasket. PVC is very sensitive to high temperature and light and is significantly degraded under the influence of temperature and light. Chemical compounds with a stabilizing effect are used to prevent thermal degradation during the processing and degradation of the finished product under the influence of light. In the case of the conducted analyses, the access to light was eliminated (the samples were incubated in the dark), while the temperature remained constant. The differences in the emissions of these gases were probably also due to the additives used in these plastics. Several chemical compounds are very effective in preventing the degradation of this material under the influence of temperature. The decomposition of polyvinyl chloride is a very complex phenomenon. This process is mainly due to dichlorination, which varies with the stabilizers used. The most characteristic changes that occur during this process are the formation of new C=C double bonds, C=O carbonyl groups, and −OH carboxyl groups in the chain and the production of hydrogen chloride and carbon dioxide. There is no experimentally confirmed information in the literature on the biodegradation of polyvinyl chloride or its oligomers. Under the influence of environmental factors, PVC degrades, as a result of which its strength deteriorates and becomes more brittle. The auxiliary substances added in the processing processes, such as plasticizers (constituting up to 40% of its mass), stabilizers, dyes, or oxidants, accelerate the process of PVC degradation under environmental conditions. These compounds are susceptible to the action of microorganisms and decompose under their influence [4]. The wide range of these additives, the combinations, and the amounts used exacerbate the problem of estimating the harmful effects of microplastics on the aquatic environment. The impact of the degradation of a wide range of polymer products on environmental pollution is necessary.
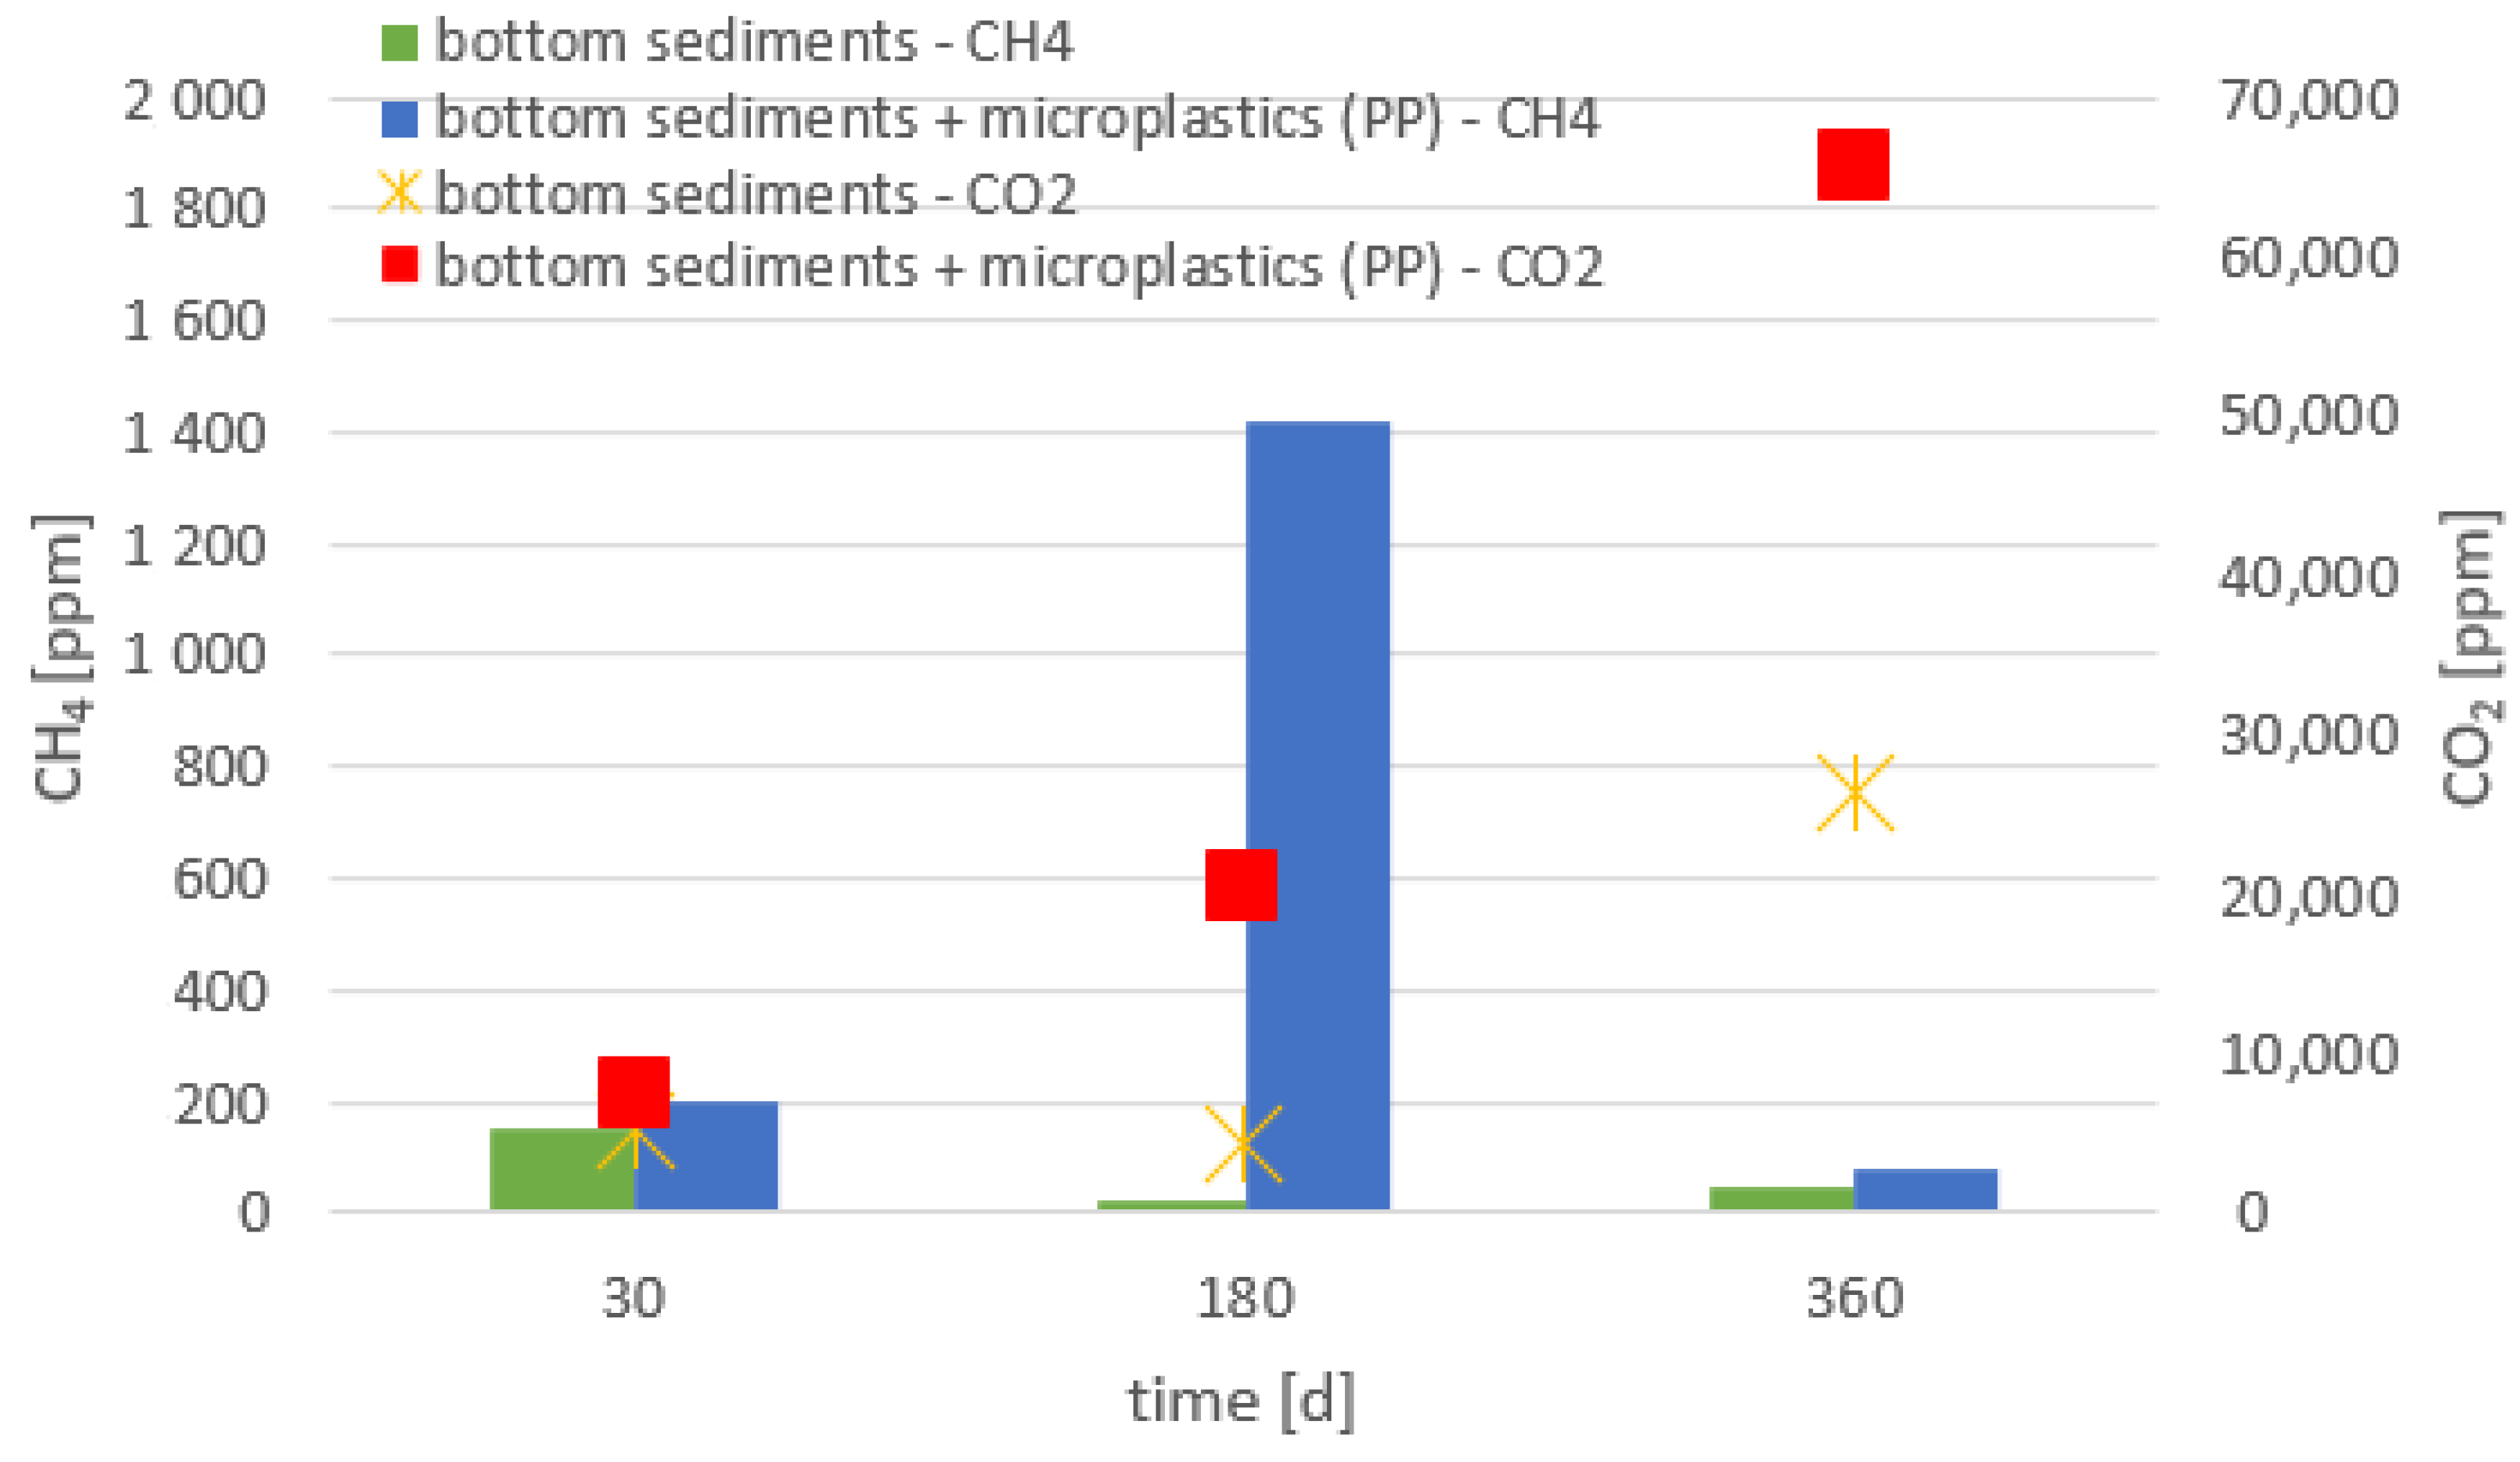
The next material analyzed was polypropylene (Figure 4). The highest concentration of methane was observed after 180 d, and this value was at the level of 1416 ppm. In turn, carbon dioxide emission was highest after 360 d—65,662 ppm. Additionally, the release of CO2 may also be the result of the metabolic activity of anaerobic microorganisms present in the bottom sediments. These values are comparable to those obtained during the degradation of the PVC gasket. According to research by Royer et al. (2018) [24], who were the only ones to conduct research on the emission of selected gases during the decomposition of microplastics, it was observed that during the decomposition of polypropylene in conditions without access to light, no methane was found. These results are inconsistent with the obtained research, which proves the necessity of conducting research in this direction. However, Royer et al. (2018) [24] observed that greenhouse gases are formed in the presence of UV radiation.
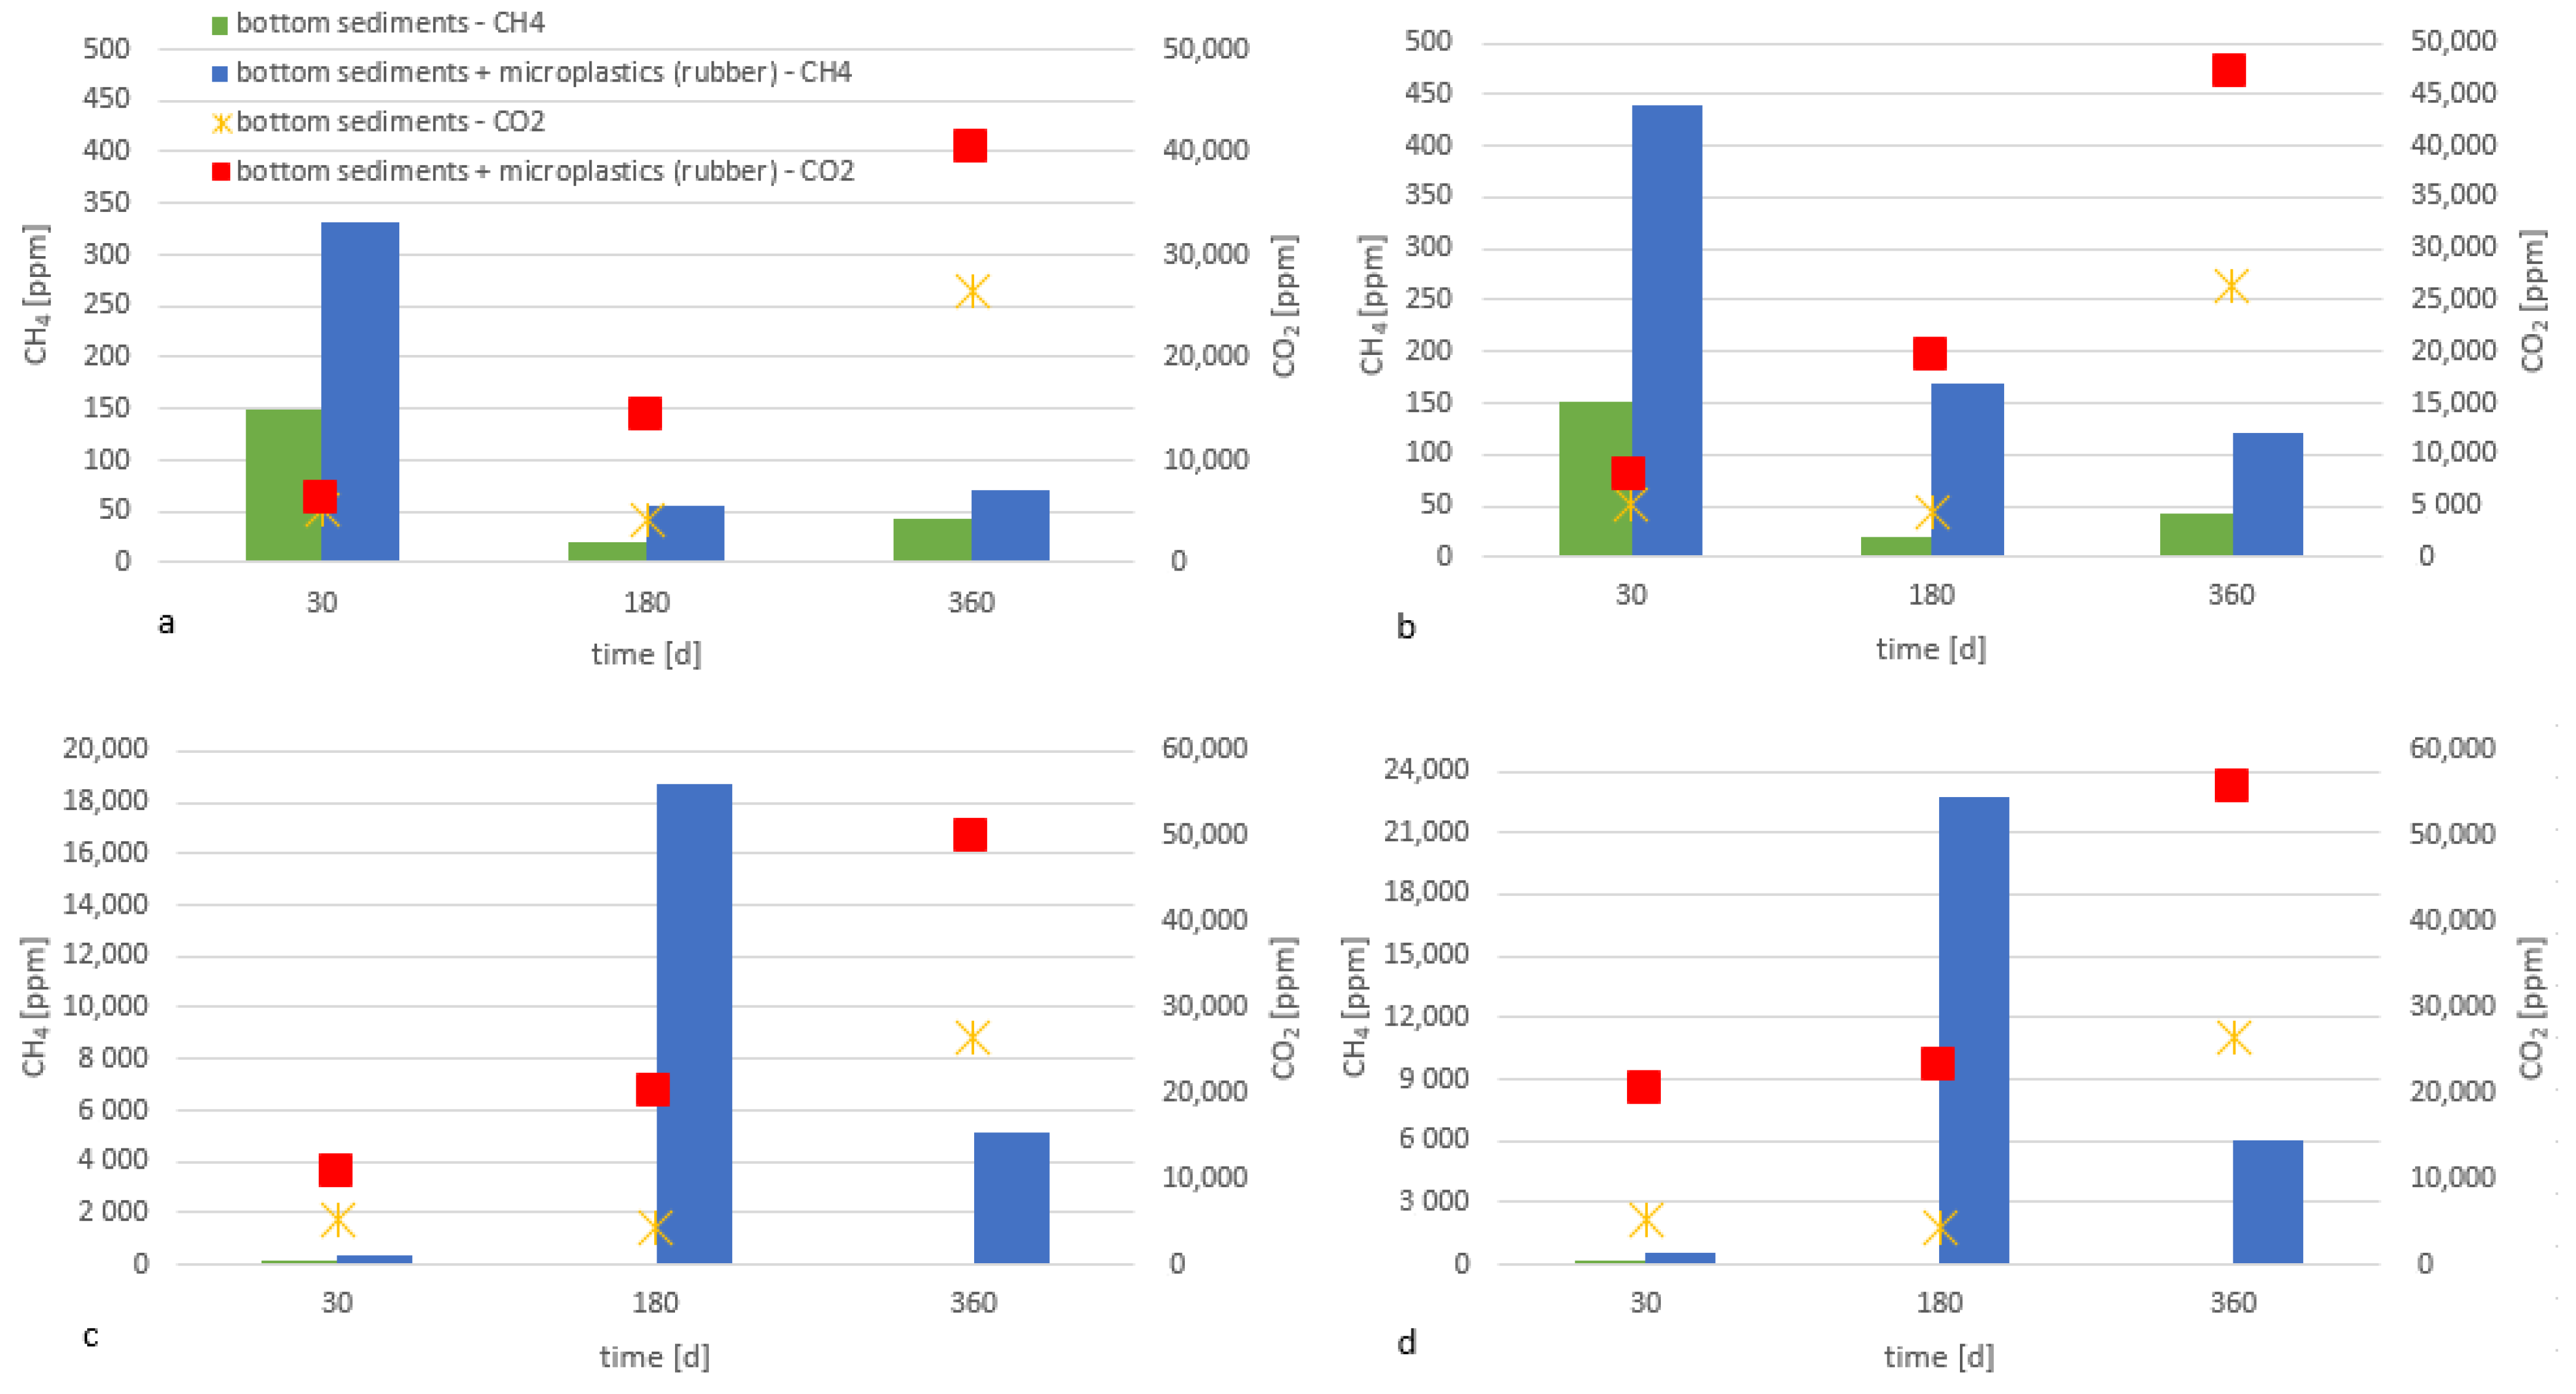
The material made of rubber, which was a material in the form of fragmented car tires, was also analyzed (Figure 5). The influence of the size of the rubber particles on the amount of CO2 and CH4 emissions was also taken into account. It was observed that the size of the microplastic influences the emission of the tested greenhouse gases. The smaller the particle is, the higher the concentration of CO2 and CH4. This is due to the larger contact surface of the microplastic with the medium in which the reactions take place, resulting in the degradation of the plastic material. When comparing the largest and the smallest rubber fractions, it was observed that for the smallest fraction (600 µm), the concentration of CH4 was 412 times higher compared to the fraction in the range of 3000–8000 µm (t = 180 days). On the other hand, after 360 d in all fractions, except for the 3000–8000 µm fraction, a decrease in methane emission was observed in relation to 180 days. In the case of carbon dioxide concentration, the greatest differences were visible after 30 days of incubation, but only a 3.24-fold increase was recorded. Smaller fragments not only have a greater surface-to-volume ratio than larger items, but also tend to have longer edge lengths relative to their volume. As plastic particles degrade and become smaller, they will also emit more hydrocarbon gases per unit mass [31].
The research carried out shows that the presence of microplastics and their decomposition in the aquatic environment contributes to an increase in methane and carbon dioxide emissions into the air and, therefore, to an exacerbation of the greenhouse effect. Emissions of methane and carbon dioxide were also observed in the bottom sediments without microplastics, but at a much lower level. The release of greenhouse gases is the result of the metabolic activity of microorganisms present in the bottom sediments. The relative amounts of CH4 and CO2 molecules released from plastic material depend on the molecular structure of the plastic, including degree of branching, the addition of plasticizers, and the manufacturing process. For example, among the plastic materials tested, PVC with a higher plasticizer content produced the highest amounts of CH4, probably due to its weaker structure and more exposed hydrocarbon branches. In contrast, with a more compact structure, lower permeability, and fewer accessible active sites, the degradation of PVC with a lower plasticizer content resulted in lower emission of CH4. The degradation of plastic polymers can follow both abiotic and biotic pathways. Abiotic degradation precedes biodegradation and is initiated thermally, hydrolytically, or by UV light in the environment. Most plastics degrade first on the polymer surface, which is exposed and susceptible to chemical or enzymatic attack. The first visual effects of polymer degradation are color changes and surface cracking. Surface cracks make the interior of the material susceptible to further degradation, ultimately leading to fragility and disintegration. The degradation of microparticles, depending on environmental conditions, leads to a reduction in the mass of the material and conversion to carbon dioxide and methane. The loss of mass may result from not only the mineralization of plastics but also the washing out of the components of the polymer material [32,33,34].

4. Limitations of the Study

The study has potential limitation. Given the still-early stage of development, several constraints and gaps need to be addressed before we can satisfactorily understand the mechanisms of microplastic decomposition and greenhouse-gas emissions. The first limitation of the study was the small sample size; therefore, further tests should be carried out on a larger number of samples. Research should also be carried out over an extended period of time. Tests should also be carried out taking into account the different properties of bottom sediments and water. Accurate microbiological analyses are also required to determine the effect of microplastics itself on greenhouse-gas emissions. The methane and carbon dioxide emissions were carried out at a constant temperature; the greenhouse-gas emissions should be estimated at different temperatures to reflect different environmental conditions. Extensive research in this direction may help, in the future, estimate the contribution of microplastic emissions to the global production of methane and other gases emitted to the atmosphere. Adoption of a more holistic conceptual framework for research can help guide future and more specific research.

5. Conclusions

The presence of microplastics in the natural environment poses a serious threat to the quality of each of its components. This risk results not only from the very presence of microparticles of plastic but also from their decomposition products. Most plastics are non-biodegradable or are very slow to decompose. Items made of polymer materials take 100 to 1000 years to decompose. In the case of microplastics, this process is much faster due to the larger contact surface with the surrounding medium and the easier migration of plastic components. During the decomposition process of these materials, many harmful and toxic substances are formed, even after a month of the degradation process. The research conducted proved that:
  • Microplastic accumulated in the bottom sediments in surface waters is degraded even in the absence of UV radiation and under anaerobic conditions.
  • The presence of all tested materials made of polymers in the bottom sediments resulted in an increased emission of greenhouse gases (methane and carbon dioxide), compared to the bottom sediments without the addition of the analyzed microplastics.
  • Higher emissions of carbon dioxide were observed compared to methane; methane can be oxidized to carbon dioxide (i.e., reverse methanogenesis).
  • The emission of the gases analyzed depended on the chemical composition of the material and the size of the plastic particles. The highest emission of these gases was recorded for the smallest particles.
  • The obtained results confirm the need for further research in this area and the extension of research in other components of the environment.

Supplementary Materials

The following supporting information can be downloaded at: https://www.mdpi.com/article/10.3390/environments9070091/s1, Figure S1a,b: Prepared experimental samples; Table S1: Average concentrations of methane and carbon dioxide.

Author Contributions

Conceptualization, M.K., S.Z. and P.K.; Investigation, M.K. and S.Z.; Methodology, M.K., S.Z. and P.K.; Supervision, M.K. and P.K.; Visualization, S.Z.; Writing—original draft, M.K. and S.Z.; Writing—review & editing, M.K., S.Z. and P.K. All authors have read and agreed to the published version of the manuscript.

Funding

This publication reflects the implementation of Research Project No. 2019/03/X/ST10/01557 funded by the Poland National Science Center.

Data Availability Statement

Not applicable.

Conflicts of Interest

The authors declare the following financial interests/personal relationships which may be considered as potential competing interests: This publication reflects the implementation of Research Project No. 2019/03/X/ST10/01557 funded by Poland National Science Centre.

References

  1. Park, H.; Park, B.S. Review of Microplastic Distribution, Toxicity, Analysis Methods, and Removal Technologies. Water 2021, 13, 2736. [Google Scholar] [CrossRef]
  2. Li, Y.; Zhang, Y.; Chen, G.; Xu, K.; Gong, H.; Huang, K.; Wang, J. Microplastics in Surface Waters and Sediments from Guangdong Coastal Areas, South China. Sustainability 2021, 13, 2691. [Google Scholar] [CrossRef]
  3. Padervand, M.; Lichtfouse, E.; Robert, D.; Wang, C. Removal of microplastics from the environment. A review. Environ. Chem. Lett. 2020, 18, 807–828. [Google Scholar] [CrossRef]
  4. Stachurek, I. Problems with biodegradation of plastics in the environment. Sci. Pap. Coll. Labor Prot. Manag. Katow. 2012, 1, 74–108. [Google Scholar]
  5. Vaid, M.; Mehra, K.; Gupta, A. Microplastics as contaminants in Indian environment: A review. Environ. Sci. Pollut. Res. 2021, 28, 1–28. [Google Scholar] [CrossRef]
  6. Koyilath Nandakumar, V.; Palani, S.G.; Raja Raja Varma, M. Interactions between microplastics and unit processes of wastewater treatment plants: A critical review. Water Sci. Technol. 2022, 85, 496–514. [Google Scholar] [CrossRef] [PubMed]
  7. Książek, S.; Kida, M.; Koszelnik, P. The occurrence and source of polycyclic aromatic hydrocarbons in bottom sediments of the Wisłok river. Polish J. Natural Sci. 2016, 31, 373–386. [Google Scholar]
  8. Mourgkogiannis, N.; Kalavrouziotis, I.K.; Karapanagioti, H.K. Questionnaire-based survey to managers of 101 wastewater treatment plants in Greece confirms their potential as plastic marine litter sources. Mar. Pollut. Bull. 2018, 133, 822–827. [Google Scholar] [CrossRef]
  9. Karapanagioti, H.; Kalavrouziotis, I.K. (Eds.) Microplastics in Water and Wastewater, 2nd ed.; IWA Book: London, UK, 2019; ISBN 13:9781789061680. Available online: https://www.iwapublishing.com/books/9781789061680/microplastics-water-and-wastewater-2nd-edition (accessed on 5 July 2022).
  10. Geyer, R.; Jambeck, J.R.; Law, K.L. Production, use, and fate of all plastics ever made. Sci. Adv. 2017, 3, e1700782. [Google Scholar] [CrossRef] [Green Version]
  11. Jemec, A.; Horvat, P.; Kunej, U.; Bele, M.; Kržan, A. Uptake and effects of microplastic textile fibers on freshwater crustacean Daphnia magna. Environ. Pollut. 2016, 219, 201–209. [Google Scholar] [CrossRef]
  12. Zhu, L.; Bai, H.; Chen, B.; Sun, X.; Qu, K.; Xia, B. Microplastic pollution in North Yellow Sea, China: Observations on occurrence, distribution and identification. Sci. Total Environ. 2018, 636, 20–29. [Google Scholar] [CrossRef]
  13. Kaiser, D.; Kowalski, N.; Waniek, J.J. Effects of biofouling on the sinking behavior of microplastics. Environ. Res. Lett. 2017, 12, 124003. [Google Scholar] [CrossRef] [Green Version]
  14. Glas, M.; Schludermann, E. The Danube so colourful: A potpourri of plasticlitter outnumbers fish larvae in Europe’s second largest river. Environ. Pollut. 2014, 188, 177–181. [Google Scholar] [CrossRef] [Green Version]
  15. Norén, F. Small plastic particles in coastal Swedish waters. KIMO Swed. 2007, 11, 1–11. [Google Scholar]
  16. Tunçer, S.; Artüz, O.B.; Demirkol, M.; Artüz, M.L. First report of occurrence, distribution, and composition of microplastics in surface waters of the Sea of Marmara, Turkey. Mar. Pollut. Bull. 2018, 135, 283–289. [Google Scholar] [CrossRef]
  17. Zhang, K.; Hamidian, A.H.; Tubić, A.; Zhang, Y.; Fang, J.K.; Wu, C.; Lam, P.K. Understanding plastic degradation and microplastic formation in the environment: A review. Environ. Pollut. 2021, 274, 116554. [Google Scholar] [CrossRef]
  18. Han, M.; Niu, X.; Tang, M.; Zhang, B.T.; Wang, G.; Yue, W.; Zhu, J. Distribution of microplastics in surface water of the lower Yellow River near estuary. Sci. Total Environ. 2019, 707, 135601. [Google Scholar] [CrossRef]
  19. Lin, L.; Zuo, L.Z.; Peng, J.P.; Cai, L.Q.; Fok, L.; Yan, Y.; Xu, X.R. Occurrence and distribution of microplastics in an urban river: A case study in the Pearl River along Guangzhou City, China. Sci. Total Environ. 2018, 644, 375–381. [Google Scholar] [CrossRef]
  20. Su, L.; Xue, Y.; Li, L. Microplastics in Taihu Lake, China. Environ. Pollut. 2016, 216, 711–719. [Google Scholar] [CrossRef]
  21. Ballent, A.; Corcoran, P.; Madden, O. Sources and sinks of microplastics in Canadian Lake Ontario nearshore, tributary and beach sediments. Mar. Pollut. Bull. 2016, 110, 383–395. [Google Scholar] [CrossRef] [Green Version]
  22. Talvitie, J.; Heinonen, M.; Pääkkönen, J.P.; Vahtera, E.; Mikola, A.; Setälä, O.; Vahala, R. Do wastewater treatment plants act as a potential point source of microplastics? Preliminary study in the coastal Gulf of Finland, Baltic Sea. Water Sci. Technol. 2015, 72, 1495–1504. [Google Scholar] [CrossRef]
  23. Hamilton, L.A.; Feit, S.; Muffett, C.; Kelso, M.; Rubright, S.M.; Bernhardt, C.; Labbé Bellas, R. Plastic and Climate: The Hidden Cost of A Plastic Planet. Cent. Int. Environ. Law 2019, 1–96. Available online: https://www.ciel.org/plasticandclimate/ (accessed on 21 March 2022).
  24. Royer, S.J.; Ferrón, S.; Wilson, S.T.; Karl, D.M. Production of methane and ethylene from plastic in the environment. PLoS ONE 2018, 13, e0200574. [Google Scholar] [CrossRef]
  25. Cerruti, P.; Lavorgna, M.; Carfagna, C.; Nicolais, L. Comparison of photo-oxidative degradation of polyamide 6, 6 films stabilized with HALS and CuCl2+ KI mixtures. Polymer 2005, 46, 4571–4583. [Google Scholar] [CrossRef]
  26. Gijsman, P.; Meijers, G.; Vitarelli, G. Comparison of the UV-degradation chemistry of polypropylene, polyethylene, polyamide 6 and polybutylene terephthalate. Polym. Degrad. Stab. 1999, 65, 433–441. [Google Scholar] [CrossRef]
  27. Kida, M.; Koszelnik, P. Investigation of the presence and possible migration from microplastics of phthalic acid esters and polycyclic aromatic hydrocarbons. J. Polym. Environ. 2021, 29, 599–611. [Google Scholar] [CrossRef]
  28. Yagi, H.; Ninomiya, F.; Funabashi, M.; Kunioka, M. Anaerobic biodegradation tests of poly (lactic acid) under mesophilic and thermophilic conditions using a new evaluation system for methane fermentation in anaerobic sludge. Int. J. Mol. Sci. 2009, 10, 3824–3835. [Google Scholar] [CrossRef] [Green Version]
  29. Chamas, A.; Moon, H.; Zheng, J.; Qiu, Y.; Tabassum, T.; Jang, J.H.; Abu-Omar, M.; Scott, S.L.; Suh, S. Degradation rates of plastics in the environment. ACS Sustain. Chem. Eng. 2020, 8, 3494–3511. [Google Scholar] [CrossRef] [Green Version]
  30. Orphan, V.J.; House, C.H.; Hinrichs, K.U.; McKeegan, K.D.; DeLong, E.F. Multiple archaeal groups mediate methane oxidation in anoxic cold seep sediments. Proc. Natl. Acad. Sci. USA 2002, 99, 7663–7668. [Google Scholar] [CrossRef] [Green Version]
  31. Ryan, P.G. Does size and buoyancy affect the long-distance transport of floating debris? Environ. Res. Lett. 2015, 10, 084019. [Google Scholar] [CrossRef]
  32. Pochwat, K. Assessment of Rainwater Retention Efficiency in Urban Drainage Systems—Model Studies. Resources 2022, 11, 14. [Google Scholar] [CrossRef]
  33. Binda, G.; Spanu, D.; Monticelli, D.; Pozzi, A.; Bellasi, A.; Bettinetti, R.; Carnati, S.; Nizzetto, L. Unfolding the interaction between microplastics and (trace) elements in water: A critical review. Water Res. 2021, 204, 117637. [Google Scholar] [CrossRef]
  34. Wei, W.; Huang, Q.S.; Sun, J.; Wang, J.Y.; Wu, S.L.; Ni, B.J. Polyvinyl chloride microplastics affect methane production from the anaerobic digestion of waste activated sludge through leaching toxic bisphenol-A. Environ. Sci. Technol. 2019, 53, 2509–2517. [Google Scholar] [CrossRef]
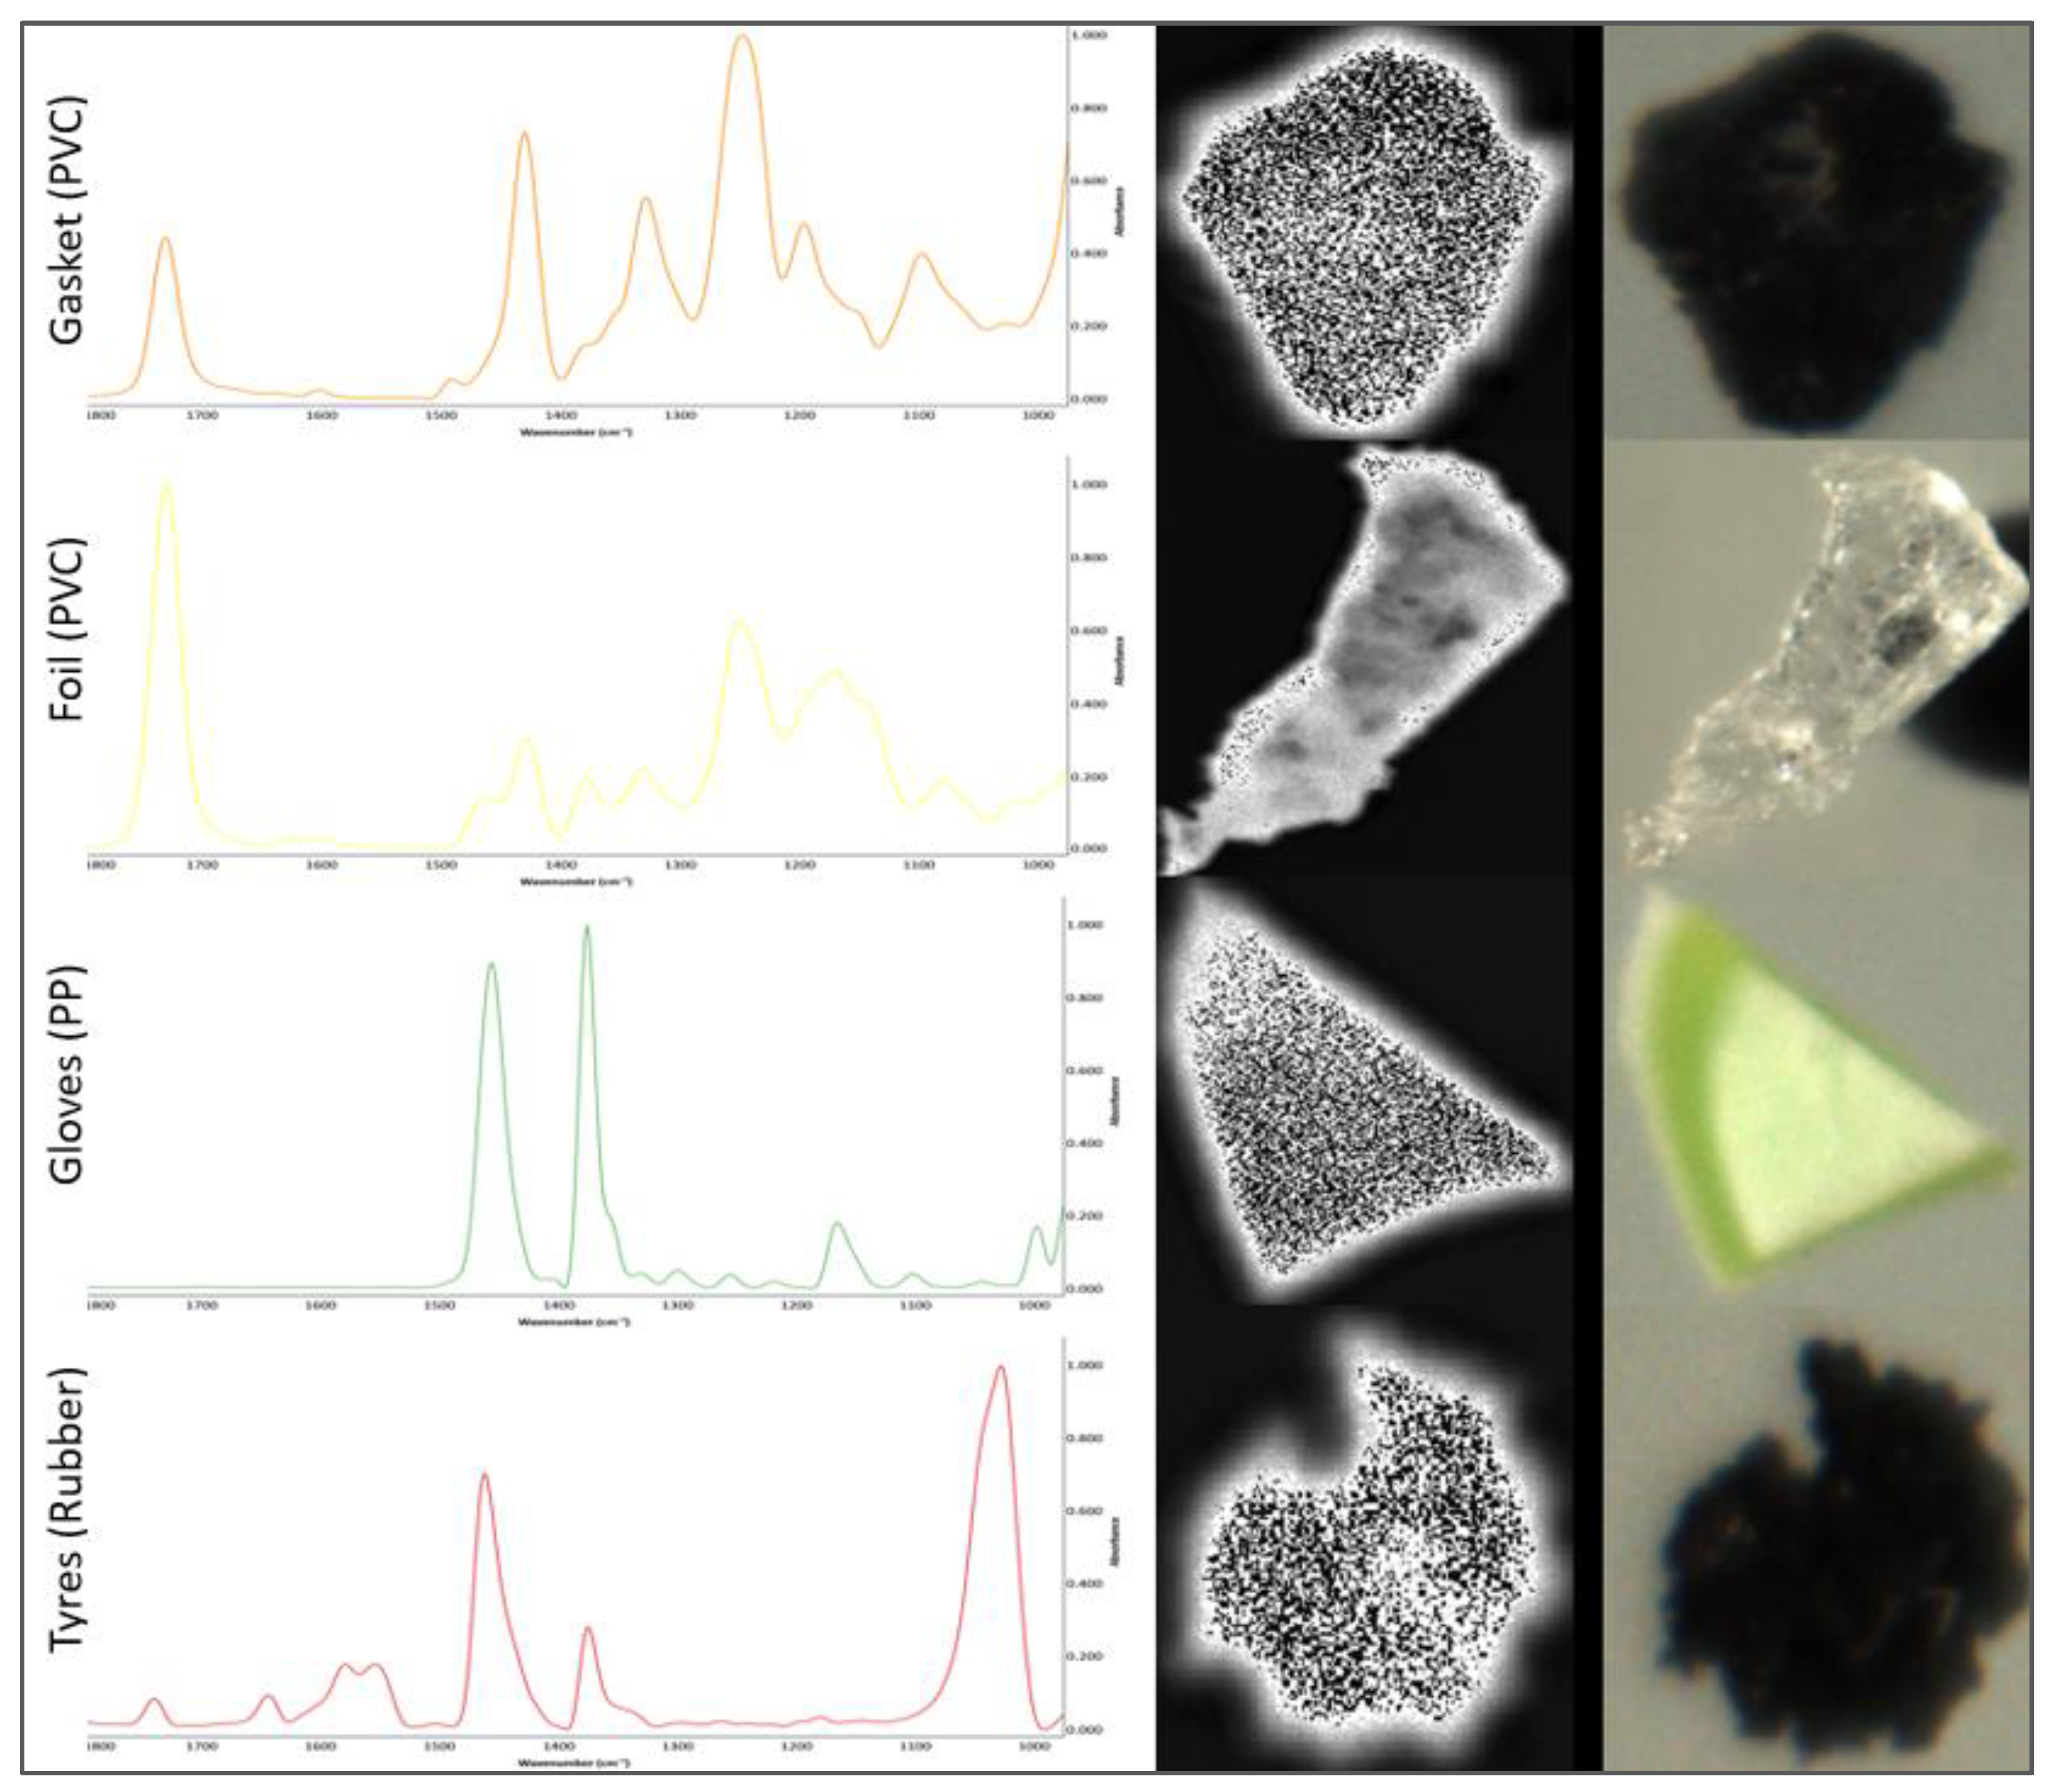
Figure 1. Visual images IR spectra (left) and visual images (right) of microplastics analyzed.
Environments 09 00091 g001
Figure 2. CH4 and CO2 emissions from PVC (gasket).
Environments 09 00091 g002
Figure 3. CH4 and CO2 emissions from PVC (foil).
Environments 09 00091 g003
Figure 4. CH4 and CO2 emissions from PP.
Environments 09 00091 g004
Figure 5. CH4 and CO2 emissions from rubber at sizes (a) 3000–8000 µm; (b) 1000–3000 µm; (c) 1000 µm; (d) 600 µm.
Environments 09 00091 g005
Table 1. Summary of selected references with data on the occurrence and fate of MPs in the various components of the environment.
MatrixLocationConcentrationReference
Surface WatersMa’an Archipelago200 ± 100 to 600 ± 200 pieces/m3[19]
Marmara Sea1263 pieces/m2[16]
Yellow Sea545 ± 282 pieces/m3[12]
West Coast of Sweden102,550 pieces/m3[15]
Yellow River930,000 (dry season) and 497,000 (wet season) pieces/m3[18]
Pearl River (China)379–7924 pieces/m3[19]
Lake Taihu6.8 × 106 pieces/km2[20]
Bottom SedimentsMa’an Archipelago30 to 80 pieces/kg d.w.[17]
Yellow Sea37.1 ± 42.7 pieces/kg d.w.[12]
Pearl River (China)80–9597 pieces/kg d.w.[19]
Lake Ontario2.8 × 104 pieces/kg[21]
Treated WastewaterHelsinki8600 pieces/m3[22]
Table 2. Plastic products included in the study.
PolymerProductColorSource
polyvinyl chloridePVCgasket blackJano, Poland
polyvinyl chloridePVCphthalate foiltransparentEuropak, Poland
rubber (caoutchouc)Rubber (caoutchouc)tiresblack-
polypropylenePPglovesgreenW5, Germany
Table 3. Selected physicochemical parameters of the bottom sediments.
ParameterpHOMDOCCaCO3FeNiCuZnPbAl
[–][%][mg/g d.w.][%]g/kg d.w.mg/kg d.w.g/kg d.w.
7.888.454.383.2234.1236.2035.60116.7042.9139.96
Table 4. Parameters of chromatographic analysis.
Parameters
Type of columnShin Carbon ST column (2 m, 1.00 mm ID)
Injector temperature150 °C
Detector temperature100 °C
Column temperature60 °C
Carrier gashelium
Carrier gas flow rate50.0 mL/min
Table 5. Parameters of selected particles.
ParametersUnitGasket (PVC)Foil (PVC)Gloves (PP)Tires (Rubber)—600 µm
Widthµm96414701207734
Heightµm89833941051799
Diameterµm91319321013744
Areaµm2655,02529,331,00806,875435,875
Circularity-0.670.350.580.62
Solidity-0.960.820.960.93
Publisher’s Note: MDPI stays neutral with regard to jurisdictional claims in published maps and institutional affiliations.