Article

Nickel and Chromium Origin in Fluvisols of the Petruševec Well Field, Zagreb Aquifer

1
Faculty of Mining, Geology and Petroleum Engineering, University of Zagreb, 10000 Zagreb, Croatia
2
Faculty of Agriculture, University of Zagreb, 10000 Zagreb, Croatia
3
Vinkovci Water Supply and Sewerage, 32100 Vinkovci, Croatia
*
Author to whom correspondence should be addressed.
Environments 2022, 9(12), 154; https://doi.org/10.3390/environments9120154
Submission received: 31 October 2022 / Revised: 1 December 2022 / Accepted: 6 December 2022 / Published: 9 December 2022

Abstract

:
Soil plays an important role in the accumulation and transport of potentially toxic elements (PTEs), from surface into aquifer. PTEs can get to the environment naturally, but also from different kinds of contamination sources. In this study, a soil profile located in the vicinity of well field Petruševec, one of the most important well fields related to the public water supply of the City of Zagreb, was analyzed. The main aim of this study was to determine soil properties which can influence retention/mobilization of Ni and Cr in alluvial soil, as well as to define their origin in the investigated soil profile. Results suggest that Cr is geogenic, while Ni is probably of dominantly anthropogenic origin. Observed concentrations, enrichment factors and Igeo values showed no enrichment for Cr, while for Ni, they showed minor to very severe enrichment, i.e., that in some soil horizons, moderate to strong pollution exists. Evaluation of wind directions and location of possible contamination sources that prevail in the study area suggest that Ni can come by aerodeposition from different sources. Results showed that mineral composition can have important influence on retention of analyzed PTEs. Soil horizons, which have very high concentrations of Ni, in general have higher proportion of clay minerals, especially chlorites, as well as Fe oxyhydroxides which can act as an adsorption phase for the investigated PTEs. Results suggest that more detailed research about the investigated PTEs presents a necessity if measures for soil and groundwater protection want to be effectively implemented.

1. Introduction

Soil plays an important role in a substance’s circulation in nature, including potentially toxic elements (PTEs). The accumulation of PTEs in the soil, and their transport through soil into the aquifer, is a serious problem in the preservation of the soil and groundwater which is used for human consumption. PTEs can get to the environment naturally, for example from geogenic sources such as parent materials, and can be anthropogenically induced from different kinds of contamination sources.
The parent material largely influences PTE content in many soil types, with concentrations sometimes exceeding the critical values [1,2]. Some PTEs, such as Ni, Cr and Mn, may be contained as trace elements in some rock types of volcanic and metamorphic origin [3]. In general, minerals, which are carriers of Ni and Cr, can be divided into two groups: (i) primary—originating from the parent rock, and (ii) secondary—formed in the soil as a result of weathering of primary minerals. Primary minerals were formed under magmatic or metamorphic conditions, and these are olivines, pyroxenes, minerals from the spinel and serpentine groups, and to a lesser extent, sulfides. The second group includes clay minerals as well as minerals belonging to iron and manganese oxyhydroxides, in which Ni and Cr may occur in both the crystal structure and in the form adsorbed on the surface [4].
During weathering processes, the primary crystalline structures of some rock minerals are completely broken, and relevant chemical elements may be thus either adsorbed in the topsoil or transported towards surface water or groundwater [5].
Exploration of chromium (Cr) and nickel (Ni) concentrations are also very important because both can be carcinogenic via inhalation [6,7]. Chromium may also be carcinogenic if ingested [7,8]. Nickel occurs predominantly as Ni (II) in natural settings and Cr is present as both Cr (III) and Cr (VI). In ultramafic rocks, Cr is present as Cr (III) which has relatively low toxicity and is relatively insoluble and immobile at neutral to alkaline pH. In contrast, Cr (VI) is an environmental toxin and human carcinogen [9,10] and is highly soluble and mobile at neutral to alkaline pH. Elevated Cr (VI) concentrations in soil and groundwater adjacent to magmatic rocks have been reported [11,12,13,14,15,16] and showed that the Cr and Ni content in soils is elevated within the Sacramento Valley region of California due to transport and deposition of alluvium from adjacent uplands. In their study, Mills et al. [17] found that Cr (VI) is generated naturally in Sacramento Valley soils and sediments from ultramafic rocks.
Nickel (Ni) is an essential nutrient for animals and a beneficial element for plants [18]. High contents of Ni in soils as PTE can cause toxicity and adverse impacts on soil functions as well as considerable environmental problems regarding the mobility and thus the soil–plant transfer, and consequently, the transfer of Ni into the food chain [19]. Nickel in soils can be derived from both parent materials and anthropogenic sources [20,21]. Anthropogenic nickel is derived from various sources such as domestic detergents, street run off, hospital waste, surface treatment industries, batteries manufacturers and foundries [22]. On the other side, using treated wastewater in agricultural irrigation increases the risk of soil contamination by persistent pollutants such as heavy metals.
Research focus in recent years in the study area was mostly related to the exploration of groundwater velocities [23] and its relationship with the Sava River [24,25]. Newest research in the wider study area has been focused to the statistical analysis of the Sava and Kupa River [26], as well as to the definition of the soil water origin in sloped vineyard [27]. Additionally, evaluation of sorption of some PTEs has been investigated in the dominant type of soils in the Zagreb aquifer area [28]. Furthermore, few studies related to the contamination of soils and sediments with Ni and Cr were carried out in the research area [5,29,30,31]. According to Miko et al. [29] and Halamić and Miko [31], increased nickel and chromium concentrations are mostly derived from basic and ultrabasic rocks of Medvednica mountain. Although some research related to the exploration of Ni and Cr concentrations in soil and groundwater has been carried out, a detailed inspection of their origin has not been of primary interest.
In this study, a soil profile located in the vicinity of well field Petruševec, one of the most important well fields related to the public water supply of the City of Zagreb, is analyzed. The main objectives of this research were to (a) determine main soil properties which can influence retention/mobilization of Ni and Cr in alluvial soil, (b) determine the origin of Ni and Cr in the investigated soil profile.

2. Materials and Methods

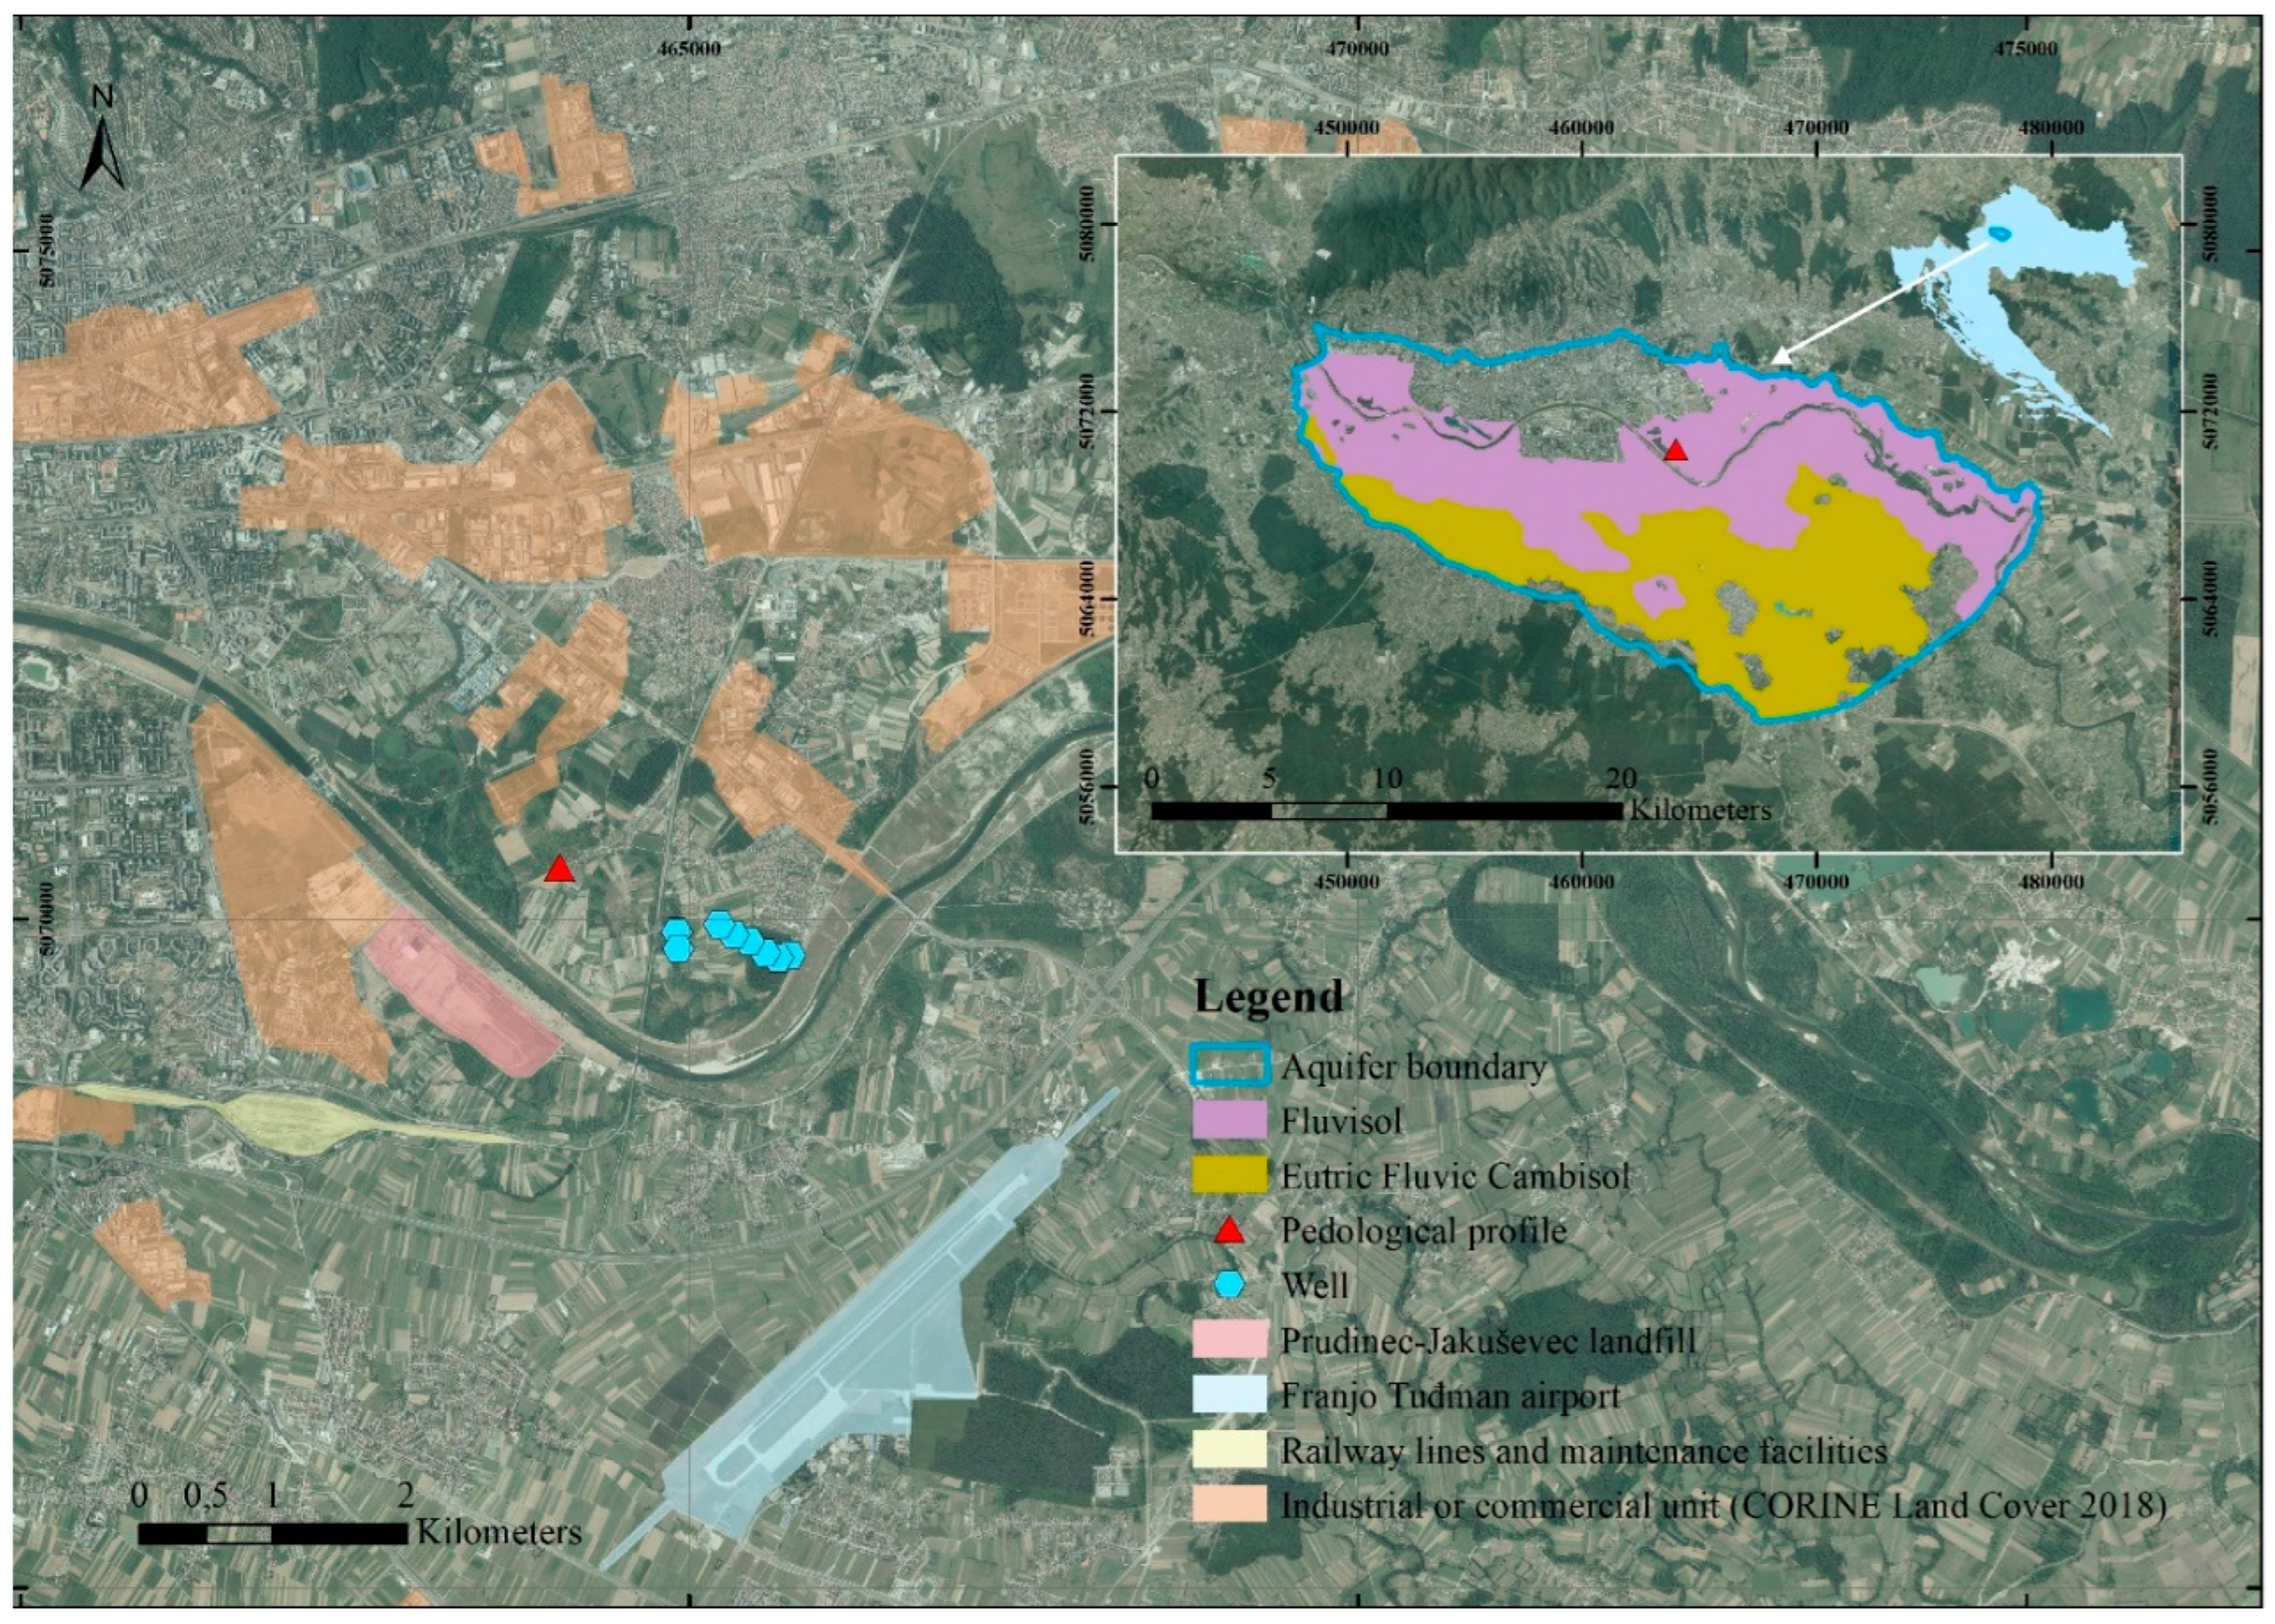
2.1. Study Area Description

The study area is in the vicinity of the well field Petruševec, which is located in the eastern part of the City of Zagreb and presents one of the most important well fields for the public water supply (Figure 1). The Zagreb aquifer is situated in NW Croatia (Figure 1) covering the area of approximately 350 km2 which includes the metropolitan area and its surroundings. It presents strategic water reserves protected by Croatian state. Variable lithology, pedological characteristics and land use characterize the study area, which consists of a large alluvial plain that has two marked geomorphological features: the raised sealed terrace of the Sava River (varying in width down the rivers length), and a Holocene terrace [32]. The area is characterized by the moderate continental climate (Cfwbx in the Köppen climate classification system) with four separate seasons. The Zagreb aquifer is an unconfined type, in which PTEs have been identified as one of five main groups of contaminants [32].
The study site Petruševec consists mainly of the Deluvial–Proluvial Holocene sediments. According to Basch [33], deposits are mainly composed of fine-grained and unbound rocks formed by deposition of terrestrial loess and Pliocene sediments, entrained silts and sands, quartz boulders, and fragments of interbedded Quaternary and Paleozoic rocks of Medvednica mountain, as well as intermixed stream sediments. Furthermore, according to Velić et al. [34], the thickness of the Holocene deposits in the Jakuševac area are approximately 50 m. The predominant fraction is gravel followed by sand, while silt and clay are the least represented [34]. In addition, Velić and Saftić [35] explained that after the Pleistocene deposits, the early Holocene caused a sudden warming, which started a new cycle of sedimentation.
Zagreb aquifer system contains two different, but connected, aquifer layers. The first layer contains Holocene alluvial deposits [36], which are in direct contact with the Sava River [23,25], with more pronounced influence in the vicinity of the Sava River [24]. It has been shown that groundwater levels have been declined approximately 3 to 6 m when comparing to the levels in 1960s [37]. According to Velić and Durn [36], the second aquifer layer contains Pleistocene lacustrine-marshy deposits. The thickness of the unsaturated zone in the Zagreb area generally varies from 8 m in NW part to 2 m in SE part [38].
In the area of the Zagreb aquifer, several types of soil have been formed: Fluvisols, Eutric Fluvic Cambisols, Gleysols and Fluvic Phaeozems [39]. According to Ružičić et al. [40], two soils are dominant, Fluvisols and Eutric Fluvic Cambisols (Figure 1).
Investigated soil profile is located in the Fluvisols, which form a belt a few kilometers wide along the Sava River (as well as some narrow belts along the smaller streams). The location of the soil profile is in meadow near the arable agricultural land. Given that most of these soils have been protected from flooding, they now have a moderately developed A (or Ap) horizon overlying several fluvial layers that are often separated one from another by a lithic discontinuity. In some specific pedological environments, the A horizon is fully developed, and Fluvisols grade into Fluvic Phaeozems. Fluvisols of the area are largely well-drained loams (or even sandy loams) with highly fluctuating groundwater that may rise into the top 1 m of the soil profile. Generally, they are calcareous throughout and accordingly, slightly alkaline. According to the WRB system, the study soil was classified as Fluvisols.

2.2. Field and Laboratory Work

Field research was conducted in the spring of 2018 in the area of the well field Petruševec, which is located in the eastern part of the City of Zagreb. The field research consisted of borehole drilling and sampling. The soil profile was further divided into intervals based on the visible macro features and field estimation of the soil texture and mineralogical changes along the profile. Soil is determined as Calcaric Fluvisol (Humic, Siltic), with horizons A-2AC1-2AC2-3C1-3C2-4AC-5AC-5C. Eight disturbed soil samples for laboratory analysis were collected from soil horizons. Soil samples were air-dried and passed through a 2 mm sieve for laboratory analysis. Soil particle size distribution was determined by the pipette method with sieving and sedimentation after dispersion with sodium pyrophosphate and interpreted according to Jahn et al. [41]. Electrical conductivity (EC) of soil was measured in water with a 1:5 soil to water ratio using a Mettler Toledo MPC 227 EC meter. Soil pH was measured in water with a 1:5 soil to water ratio [42] using a Multi 340i WTW pH meter. Carbonate content was determined by the volumetric method [43]. Cation exchange capacity (CEC) was determined using barium chloride solution [44]. EC values have an average standard deviation of ±8.13 µS/cm, pH of ±0.03, CaCO3 of ±1.32% and CEC of ±0.63 cmol/kg.
Mineral composition of a <2 mm fraction of the analyzed soils was determined by X-ray powder diffraction (XRD) using a Philips diffractometer (graphite monochromator, CuKα radiation, proportional counter). The identification of clay minerals was generally based on the methods outlined by Moore and Reynolds [45]. Concentration of PTEs, i.e., Cr, Ni, and Mn were analyzed by flame atomic absorption spectrometry (AAnalyst 700, Perkin Elmer) after dissolving of samples using aquaregia solution. All samples were measured in three replicates, while the average value was chosen as representative. The accuracy of analysis was controlled by analysis of the USGS geological reference soil standard GXR-2 in the analyzed sample batches. The average standard deviation for Cr, Ni and Mn concentrations was ±1.21 mg/kg, ±1.65 mg/kg and ±3.30 mg/kg, respectively. The correlation between the analyzed soil properties and PTEs was carried out using TIBCO Statistica (version 14.0.0.15).

2.3. Enrichment Factor and Index of Geoaccumulation

Enrichment factor (EF) is generally employed to understand the contribution of metals other than lithogenic origin. The calculation of EF can be provided by comparing a ratio of the studied element to a ‘conservative’ element. In general, the metal which is naturally occurring in high concentrations and originates mostly from the earth’s crust is used as the conservative element [46,47,48]. Conservative elements, such as Mn, Fe, Al, Me, Sc, Ti, or Ca are generally used as reference elements for calculation of EF [49,50]. Fe and Mn have been measured in this study, but we used Mn because it is expected to be more conservative element than Fe in our case, which was confirmed with mineralogical analysis. Furthermore, in the results and discussion part, it can be clearly seen that manganese concentrations are decreasing with depth, but also that the highest concentration is much lower than the median value for the investigated area which is estimated to be slightly more than 500 mg/kg [31]. Several authors have employed Mn to normalize PTEs [51,52,53]. Mn concentrations are not the main subject of this research which is the reason why they were not analyzed and discussed within the results and discussion part.
The equation for the calculation of EF can be generalized to be (where ‘‘crust’’ can be replaced by a local or/and state background):
E F E l = E l s a m p l e / X s a m p l e E l c r u s t / X c r u s t
where Elsample/Xsample represents the ratio of concentration of the analyzed elements (Cr and Ni) and concentration of Mn, and Elcrust/Xcrust is the ratio of element concentrations (Cr and Ni) in local and state background materials and background concentration of Mn in local and state materials.
According to Birch [54], if EF is <1, the soil is free from pollution or no enrichment. Likewise, EF < 3 is minor; 3–5 moderate; 5–10 moderately severe; 10–25 severe; 25–50 very severe; and >50 extremely severe enrichment [55].
Furthermore, the index of geoaccumulation (Igeo) was used to estimate the anthropogenic influence of Ni and Cr concentrations [56,57,58,59]:
I g e o = l o g 2 ( C n / 1.5 B n )
where Cn presents the average content of the element n through soil profile, while Bn is the pedogeochemical content of the same element in the analyzed soil. Within this research, for Bn, we used the median for Cr and Ni at the local (Central Croatia) and state scale (Croatia) according to [31]. It has been shown that pollution status of soil can be defined in seven classes based on Igeo, from <0 up to 6 [60,61,62]: <0 unpolluted, 0–1 polluted to moderately polluted, 1–2 moderately polluted, 2–3 moderately to strongly polluted, 3–4 strongly polluted, 4–5 strongly to extremely polluted, >5 extremely polluted.

3. Results and Discussion

Soil texture is mainly silty loam. The highest proportion of sand is determined in 5C horizon (170–190 cm), while the smallest is in the second sampling depth (Figure 2), which is in line with the CEC values (Table 1). The smallest CEC value is determined in 3C2 horizon (100–120 cm) which is in correlation with the proportion of clay (Table 1).
Electrical conductivity (EC) fluctuates between the horizons from 198 µS/cm in the A horizon to 140 µS/cm in 5C horizon. Ružičić et al. [63] found the same distribution of pH, CEC and EC in the previous research of Fluvisols in the Zagreb aquifer area. In some studies of Fluvisol soils [40,64], a positive correlation between EC and silty material has been pointed out. According to Officer et al. [65], soil EC in similar soils has the same distribution as CEC values through soil profile. Values of pH vary from 7.34 to 7.66. According to Ružičić and Jašaragić-Rako [66], the possible reason for pH variation along the soil profile can be associated with a change of carbonates, which, at this site, show an increase through a soil depth (Table 1, Figure 3).
According to Table 2, the dominant mineral phase in the soil fraction (<2 mm, after dilution of carbonate minerals) is quartz, plagioclase, hematite and kaolinite. As minor mineral phases, there are goethites, feldspars and clay minerals (mica minerals, chlorites, and interstratified clay minerals). The second most-appearing clay mineral in the analyzed soil is chlorite. Ružičić and Jašaragić-Rako [66] found similar clay mineral composition in Fluvisol soils.
Clay minerals have a large number of binding sites, so they can act as adsorption surfaces for PTEs in soils. The type of clay mineral present (kaolinite, chlorite, montmorillonite, etc.) will also affect the specific surface area [67]. As a result, soils with high clay and silt (fine fractions) tend to retain higher amounts of PTEs, compared to course textured sandy soils [68]. McGrath and Loveland [69] found positive correlations between elevated concentrations of Cr and Ni and increasing soil clay contents through soil profile. This trend is not that evident in our study, where clay proportion ranges from 6.3% in the A horizon up to 15.1% in 4AC horizon, while a general increase in Cr and Ni concentrations can be seen with depth (Figure 2 and Figure 4). In addition, sand particles from 3CI and 5C horizons have elevated quartz (Table 2) and Fe oxyhydroxides (goethite) content. According to Pils et al. [70], iron oxides, which can exist as nodules, concretions and coatings on soil particles, retain metals by adsorption or co-precipitation processes. In our study, goethite probably coats quartz particles and enables metal adsorption in these soil horizons. Ni enrichment in alluvial soils developed in the vicinity of Ganga and Gandak rivers was reported by Rajmohan et al. [55]. Authors explain this phenomenon that Ni has a common source for its origin and strong affinity with Fe or Mn oxyhydroxides. In our study, mineralogical analysis confirmed goethite mineral as a major phase for adsorption of PTE in 5C horizon. In addition, it is well-known that Ni, as being siderophilic in nature [18], can easily coprecipitate or be bounded to oxides. The role of Fe or Mn (hydr)oxides as scavengers for soil Ni was pointed out in many studies [71,72]. Additionally, major Ni associations to relative stable soil solid phases are in a good agreement with mineralogical analysis.
Nickel concentration is 62 mg/kg in A horizon (0–30 cm) and varies through depth, increasing to 379 mg/kg in 5C horizon (170–190 cm). Chromium showed a similar, in general, increasing trend through soil depth with concentrations from 23 mg/kg (A horizon) to 51 mg/kg (5C horizon) (Figure 4). In most cases, metals showed elevated concentrations in subsurface soil horizons [5,31,73]. In our study site, concentrations of both PTEs generally increased with depth. However, in the 3C2 soil horizon, PTEs rapidly decrease due to smaller quantity of Fe oxyhydroxides and chlorite clay minerals. This is not the case for 5AC soil horizons, where only chlorite minerals are present, with a lack of Fe oxyhydroxides.
In the subsurface horizons, soil is predominantly developed of finer particle size such as silt and clay, which have a low permeability. However, it is possible that intense precipitation and periodic snowmelt in the spring can cause infiltration of the Ni and Cr into a deeper, more permeable part of the profile. This is supported by soil texture data (Figure 2) which shows increased fraction of sand in the lower part of the profile, where the highest concentrations of Cr and Ni were measured. Ružičić et al. [74] showed that in Fluvisols in the Zagreb aquifer area, the upper part of the soil profile can be permeable through the whole hydrologic year.
Correlation analysis did not show any statistically significant results except when observing the correlation between Cr and Ni concentrations (Table 3). However, although not statistically significant, it can be seen that Ni and Cr concentrations are positively correlated with pH, sand and carbonates, while they are negatively correlated with silt and CEC. Pils et al. [70] found that silt negatively correlated with Cr and Ni concentrations in alluvial soils. In the analyzed soil, the presence of carbonate minerals probably led to an elevated pH level (Table 1) which may have enhanced metal carbonate precipitation reactions. According to He et al. [75], the adsorption of heavy metals in soils increases with increasing CaCO3 content. In addition, previous research has shown that soils with pH between 7 and 8, due to the presence of carbonates, exhibited strong sorption for all heavy metals [76].
Smallest values of correlations coefficients were observed for correlation between inspected PTEs, clay and EC. Results suggest that nickel is slightly affected by the clay content of soils (r = 0.22). This is explained by the fact that, although growing with depth, all soil samples show neutral pH values (7.3–7.7). Retention by clays of a cationic species is generally attributed to the exchange between an ion in a soil–water system and a labile ion already fixed on the site of the exchanger [22]. In our case, the type of clay minerals (chlorites) is in line with CEC values.
The EF values calculated for the soil samples of the study site are given in Table 4. EF values range from 4.31 to 28.51 for Ni, and 0.68 to 2.09 for Cr at state level. Furthermore, values vary from 5.46 to 36.11 for Ni, and from 0.70 to 2.17 for Cr at local level. The maximum values of EF (21.8) at state level for Ni are determined in 3CI horizon (70–100 cm) and in 5C (28.51, 170–190 cm). The same trend of a maximum EF for Ni can be seen at local level. The maximum values of EF (1.60) at state level for Cr are determined in 4AC horizon (120 to 150 cm) and for 5C horizon (2.09, 170–190 cm). As it is the case for Ni, Cr also shows the same trend at local stage. According to Birch [54], the soil samples for Ni are classified as minor to very severe enrichment, while in the case of Cr, as no enrichment. These results pointed out that the highest enrichment of PTEs is in the deepest soil horizons which corresponds with the highest Ni and Cr concentrations.
Enrichment factors for Ni show an increase due to higher quantity of Fe oxyhydroxides and clay minerals (especially chlorite) in different soil horizons (3CI, 4AC, 5C). Explanation of this variability among soil horizons can be by water percolation and retention in some soil horizons.
Chromium in this study shows a similar trend as nickel. According to Rajmohan et al. [55], PTEs have good positive correlation with Fe and may be bound with its oxides in the sediment matrices. Similar trends can be found for enrichment factors. Elevated concentrations of Cr in 5C horizon of Fluvisol soils suggest parent material derived from basic and ultrabasic rocks of Medvednica mountain [31].
As previously mentioned, Ni is classified as minor to very severe enrichment at local and state scale. Extremely high enrichment can be seen in 3CI and 5C soil horizons. This can be explained with content of Fe oxyhydroxides, related to the Cr enrichment, but it is obvious that for Ni enrichment, this is not only from lithogenic or geogenic sources. If results for Ni concentrations are compared with the Geochemical Atlas of Croatia [31], it is obvious that Ni shows high enrichment. In the mentioned publication, Ni shows a geogenic concentration up to 50 mg/kg in surface soils of Central Croatia, which is in line with our study. However, when water percolates through an unsaturated zone, it transfers Ni to deeper soil horizons (3CI, 4AC, 5C) of which some can retain more Ni concentrations, especially those with clay minerals (chlorite) and Fe oxyhydroxides.
Table 4 depicts the Igeo values and classes of soil samples collected at different depths in the study profile. Igeo values range from −2.72 to −1.37 for Cr, and 0.08 to 2.40 for Ni at state level, while they vary from −2.47 to −1.12 for Cr, and 0.32 to 2.94 for Ni at local level. The maximum values of Igeo (2.24) at the state level for Ni are determined in 3CI horizon (70–100cm) and in 5C (2.40, 170–190cm). The same trend for a maximum of Igeo for Ni can be seen at local level. In the study site, all metals come under four classes: unpolluted (<0), polluted to moderately polluted (0–1), moderately polluted (1–2), and moderately to strongly polluted (2–3). Cr has an Igeo index of less than zero throughout the depth which suggests that the soil in the study site is not polluted by this metal. Nickel has a positive Igeo index which indicates the enrichment of these metals other than by lithogenic origin, with the distribution pattern very similar to those calculated by EF.
Considering the EF and Igeo values of the sampled Fluvisol soil in the Petruševac area, results suggest that the observed concentrations of Cr are probably of geogenic origin, while Ni are probably a result of both geogenic and anthropogenic origin. As previously elaborated, Cr concentrations in Fluvisols are possibly the result of the process of depletion of basic and ultrabasic rocks and the transport of alluvium from Medvednica mountain. According to Morison et al. [16], higher Cr concentrations determined in the soils of Sacramento Valley is derived from ultramafic rocks and the transport of alluvium from the Sierra Nevada area. On the other side, results show that Ni has minor to very severe enrichment, i.e., it is moderately to strongly polluted.
When possible anthropogenic inputs of Cr and Ni are considered, it should be noted that the research area in its vicinity has several potential sources which can generate elevated chromium and nickel environmental concentrations, such as airports, cargo train stations and the waste disposal facility, Jakuševec (Figure 1). Nickel–chromium alloy, comprised of about 50–55% Ni and 17–21% Cr, is used in various industries (especially in aviation) for components subjected to high temperature and high mechanical loads, e.g., gas turbine blades, seals and combustors, pressure vessels, heat exchanger tubing, steam generators and electric submersible well pump motor shafts [77]. Furthermore, Tyle & Scott-Fordsmand [78] identified the sources of excessive Ni concentrations in the environment, from which several could be contributing to excessive Ni concentration in soil in the study area, i.e., combustion processes, corrosion of stainless steel, waste incineration, fertilizers application, road traffic (exhaust fumes, road and brake wear, leakage motor oil), rail and air transport exhaust fumes, as well as stormwater overflow. As shown in Stopić et al. [79], it can be clearly seen that in the study area, NNE, NE, WSW, SW and SSW wind directions prevail. If the above is compared with the location of the investigated soil profile and potential sources of contamination (Figure 1), results suggest that elevated Ni concentrations can be associated with aerodeposition from different contamination sources. From wind directions, it can be concluded that Ni sources can likely be from the city waste disposal facility, Jakuševec, different industrial units and the Franjo Tuđman airport. City waste disposal is exposed to the air and as such is suitable for wind drift and aerodeposition in our study area. According to Ngole and Ekose [80], municipal origin is likely to contain high concentrations of Ni because this metal is used in manufacturing several commodities and products commonly used in homes. In addition, Rajmohan et al. [55] found considerable enrichment of Ni in their study which was related to the alluvial soils, while domestic sewage and agricultural practice were defined as potential sources of contamination.
If enriched in topsoil, metal mobility downward of the soil profile is determined by its speciation (chemical form in which metal is found in the soil solution). Metal species is defined by its total concentration in soil, interactions with soil surfaces (oxidation/reduction, precipitation/dissolution, adsorption/desorption, inorganic and organic complex formation), and soil properties affecting chemical reactions, such as pH, temperature and water content [81]. The presence of variable charge minerals, such as Fe and Mn oxyhydroxides, provide a reaction surface for sorption processes, allowing PTEs, in our case Cr and Ni, to bind and become immobilized [82,83]. Ni is mobile in soil mostly as Ni2+ with its species redistribution to carbonate complexes with an increase in pH, thus its movement downward soil profile may occur. Still, even in this context, very high Ni concentrations in deeper soil horizons resulting from pronounced vertical movement from the presumably contaminated topsoil, is somewhat unexpected if the process is not present for an extended period. Therefore, although data collectively suggest that Cr concentrations are probably of geogenic, and Ni of dominantly anthropogenic origin, their significant positive correlation (Table 3) also points out the possibility of certain connection between their excessive concentrations in soil. For example, Cr and Ni are often enriched in mafic compared to felsic igneous rocks as accompanying elements in rock-forming minerals or in sulfides and oxides, thus correlation between their increased concentrations in soil is frequently confirmed [84]. Additionally, soils derived from ultrabasic indigenous rocks and serpentine may contain high nickel, chromium and cobalt concentrations [85]. Bednářová et al. [86] investigated the impact of flooding on metal concentrations in alluvial soils and, similarly to this study, found lower concentrations of Ni and Cr in topsoil compared to subsoil, which was explained by their long-term natural (preindustrial) accumulation in deeper layers of alluvial sediments, or by the leaching of these elements from topsoil to deeper horizons for a longer period. Soil in the study area is identified as Fluvisol with highly fluctuating groundwater, suggesting that increased Ni and Cr concentrations from diffuse contamination sources, i.e., with no specific point of discharge (of both, geogenic and anthropogenic origin), could result from the watershed input into alluvial deposits, or from the contamination of sediments from point sources [86]. This possibility is further supported by data showing that although Ni concentration was several folds higher than Cr concentration, a similar trend in their vertical distribution in soil was observed (Figure 4). This fact, along with the significant positive correlation found between Cr and Ni concentrations (Table 3), possibly suggests the same driver for their release in the environment, even though anthropogenic contribution to their concentrations in soil seems to be more pronounced for nickel than for chromium.

4. Conclusions

This paper focused on determination of the origin of Ni and Cr in Fluvisols in the vicinity of the well field Petruševec. This is important because transport of analyzed PTEs through soil into the aquifer can present a serious problem in the preservation of the soil and groundwater which is used for human consumption. Our results revealed that Cr is probably dominantly of geogenic origin, while Ni is probably dominantly of anthropogenic origin. EF for Cr showed no enrichment, while Igeo index was less than zero throughout the depth which suggests that the soil in the study site is not polluted by this metal. No enrichment of Cr in Fluvisols is probably the result of the natural processes related to the depletion of basic and ultrabasic rocks and the transport of alluvium from Medvednica mountain, which is not the case for nickel. It is evident that apart from geogenic factors, Ni concentrations are also induced by human influence. Wind directions that prevail in the study area suggest that Ni sources can come by aerodeposition from different sources, i.e., the city waste disposal facility, Jakuševec, different industrial facilities and the Franjo Tuđman airport.
Furthermore, results showed that mineral composition can have big influence on retention of inspected PTEs. Soil horizons (3CI, 4AC, 5C), which have very high concentrations of Ni, in general have clay minerals, especially chlorite, which has high cation exchange capacity, as well as Fe oxyhydroxides which can act as an adsorption phase for the investigated PTEs.
This investigation presents first results and provides the necessity to be expanded with more research and data about water and PTE percolation through soil and unsaturated zones. Additionally, detailed inspection and quantification of concentrations of PTEs in different sources of contamination is necessary. Furthermore, future research should also focus on the determination of soil contaminated areas and the identification of appropriate techniques for its remediation. The implementation of mentioned future research will provide very important information which will present basics for the establishment of effective measures related to the soil and groundwater protection.

Author Contributions

Conceptualization, S.R. and Z.K.; methodology, S.R., B.-I.B. and Z.K.; software, B.-I.B., S.R. and L.F.; validation, Z.N., L.F. and J.K.; formal analysis, B.-I.B.; investigation, B.-I.B. and S.R.; resources, B.-I.B.; data curation, L.F. and Z.K.; writing—original draft preparation, S.R. and Z.K.; writing—review and editing, B.-I.B., L.F., Z.N. and J.K.; visualization, B.-I.B. and Z.K.; supervision, Z.N. and J.K. All authors have read and agreed to the published version of the manuscript.

Funding

This research received no external funding.

Institutional Review Board Statement

Not applicable.

Informed Consent Statement

Not applicable.

Data Availability Statement

Not applicable.

Conflicts of Interest

The authors declare no conflict of interest.

References

  1. Palumbo, B.; Angelone, M.; Bellanca, A.; Dazi, C.; Hauser, S.; Neri, R.; Wilson, J. Influence of inheritance and pedogenesis on heavy metal distribution in soils of Sicily, Italy. Geoderma 2000, 95, 247–266. [Google Scholar] [CrossRef]
  2. Salonen, V.; Korkka-Niemi, K. Influence of parent sediments on the concentration of heavy metals in urban and suburban soils in Turku, Finland. Appl. Geochem. 2007, 22, 906–918. [Google Scholar] [CrossRef]
  3. Alloway, B.J. Heavy Metals in Soils, 2nd ed.; Blackie Academic & Professional: London, UK, 1995; 368p, ISBN 0-7514-0198-6. [Google Scholar]
  4. Kierczak, J.; Pietranik, A.; Pędziwiatr, A. Ultramafic geoecosystems as a natural source of Ni, Cr, and Co to the environment: A review. Sci. Total Environ. 2021, 755, 142620. [Google Scholar] [CrossRef]
  5. Sollitto, D.; Romić, M.; Castrignano, A.; Romić, D.; Bakić, H. Assessing heavy metal contamination in soils of the Zagreb region (Northwest Croatia) using multivariate geostatistics. Catena 2010, 80, 182–194. [Google Scholar] [CrossRef]
  6. Kasprzak, K.S.; Sunderman, W.F.; Salnikow, K. Nickel carcinogenesis. Mutat. Res./Fundam. Mol. Mech. Mutagen. 2003, 533, 67–97. [Google Scholar] [CrossRef] [PubMed]
  7. Sedman, R.M.; Beaumont, J.; McDonald, T.A.; Reynolds, S.; Krowech, G.; Howd, R. Review of the evidence regarding the carcinogencity of hexavalent chromium in drinking water. J. Environ. Sci. Health Part C 2006, 24, 155–182. [Google Scholar] [CrossRef] [PubMed]
  8. Beaumont, J.J.; Sedman, R.M.; Reynolds, S.D.; Sherman, C.D.; Li, L.H.; Howd, R.A.; Sandy, M.S.; Zeise, L.; Alexeeff, G.V. Cancer mortality in a Chinese population exposed to hexavalent chromium in drinking water. Epidemiology 2008, 19, 12–23. [Google Scholar] [CrossRef]
  9. Goyer, R.A. Toxic effects of metals. In Casarett and Doull’s Toxicology: The Basic Science of Poisons; Klassen, C.D., Ed.; McGraw-Hill: New York, NY, USA, 1996; pp. 691–736. [Google Scholar]
  10. Kortenkamp, A.; Casadevall, M.; Faux, S.P.; Jenner, A.; Shayer, R.O.J.; Woodbridge, N.; O’Brien, P. A role for molecular oxygen in the formation of DNA damage during the reduction of the carcinogen chromium (VI) by glutathione. Arch. Biochem. Biophys. 1996, 329, 199–207. [Google Scholar] [CrossRef]
  11. Fantoni, D.; Brozzo, G.; Canepa, M.; Cipolli, F.; Marini, L.; Ottonello, G.; Vetuschi Zuccolini, M. Natural hexavalent chromium in groundwaters interacting with ophiolitic rocks. Environ. Geol. 2022, 42, 871–882. [Google Scholar] [CrossRef]
  12. Ball, J.W.; Izbicki, J.A. Occurrence of hexavalent chromium in ground water in the western Mojave Desert, California. Appl. Geochem. 2004, 19, 1123–1135. [Google Scholar] [CrossRef]
  13. Izbicki, J.A.; Ball, J.W.; Bullen, T.D.; Sutley, S.J. Chromium, chromium isotopes and selected traced elements, western Mojave Desert, USA. Appl. Geochem. 2008, 23, 1325–1352. [Google Scholar] [CrossRef]
  14. Wood, W.W.; Clark, D.; Imes, J.L.; Councell, T.B. Eolian transport of geogenic hexavalent chromium to ground water. Ground Water 2010, 48, 19–29. [Google Scholar] [CrossRef] [PubMed]
  15. Morrison, J.M.; Goldhaber, M.B.; Lee, L.; Holloway, J.M.; Wanty, R.B.; Wolf, R.E.; Ranville, J.F. A regional-scale study of chromium and nickel in soils of northern California, USA. Appl. Geochem. 2009, 24, 1500–1511. [Google Scholar] [CrossRef]
  16. Morrison, J.M.; Goldhaber, M.B.; Mills, C.T.; Breit, G.N.; Hooper, R.L.; Holloway, J.M.; Diehl, S.F.; Ranville, J.F. Weathering and transport of chromium and nickel from serpentinite in the Coast Range ophiolite to the Sacramento Valley, California, USA. Appl. Geochem. 2015, 61, 72–86. [Google Scholar] [CrossRef]
  17. Mills, C.T.; Morrison, J.M.; Goldhaber, M.B.; Ellefsen, K.J. Chromium (VI) generation in vadose zone soils and alluvial sediments of the southwestern Sacramento Valley, California: A potential source of geogenic Cr (VI) to groundwater. Appl. Geochem. 2011, 26, 1488–1501. [Google Scholar] [CrossRef]
  18. Kabata-Pendias, A. Trace Elements in Soils and Plants, 4th ed.; CRC Press: Boca Raton, FL, USA, 2011. [Google Scholar]
  19. Rinklebe, J.; Shaheen, S.M. Redox chemistry of nickel in soils and sediments: A review. Chemosphere 2017, 179, 265–278. [Google Scholar] [CrossRef]
  20. Starr, M.; Lindroos, A.-J.; Ukonmaanaho, L.; Tarvainen, T.; Tanskanen, H. Weathering release of heavy metals from soil in comparison to deposition, litterfall and leaching fluxes in a remote, boreal coniferous forest. Appl. Geochem. 2003, 18, 607–613. [Google Scholar] [CrossRef]
  21. Cheng, C.-H.; Jien, S.-H.; Iizuka, Y.; Tsai, H.; Chang, Y.-H.; Hseu, Z.-Y. Pedogenic chromium and nickel partitioning in serpentine soils along a toposequence. Soil Sci. Soc. Am. J. 2011, 75, 659–668. [Google Scholar] [CrossRef] [Green Version]
  22. Abdelwaheb, M.; Jebali, K.; Dhaouadi, H.; Dridi-Dhaouadi, S. Adsorption of nitrate, phosphate, nickel and lead on soils: Risk of groundwater contamination. Ecotoxicol. Environ. Saf. 2019, 179, 182–187. [Google Scholar] [CrossRef]
  23. Barešić, J.; Parlov, J.; Kovač, Z.; Sironić, A. Use of nuclear power plant released tritium as groundwater 224 tracer. Rud. -Geološko-Naft. Zb. 2020, 35, 25–34. [Google Scholar] [CrossRef]
  24. Posavec, K.; Vukojević, P.; Ratkaj, M.; Bedeniković, T. Cross-correlation Modelling of Surface Water—Groundwater Interaction Using the Excel Spreadsheet Application. Rud.-Geološko-Naft. Zb. 2017, 32, 25. [Google Scholar] [CrossRef]
  25. Parlov, J.; Kovač, Z.; Nakić, Z.; Barešić, J. Using water stable isotopes for identifying groundwater recharge 250 sources of the unconfined alluvial Zagreb aquifer (Croatia). Water 2019, 11, 2177. [Google Scholar] [CrossRef] [Green Version]
  26. Caren, M.; Pavlić, K. Autocorrelation and Cross-Correlation Flow Analysis Along the Confluence of the Kupa and Sava Rivers. Rud.-Geološko-Naft. Zb. 2021, 36, 67–77. [Google Scholar] [CrossRef]
  27. Kovač, Z.; Krevh, V.; Filipović, L.; Defterdarović, J.; Buškulić, P.; Han, L.; Filipović, V. Utilizing stable water isotopes (δ2H and δ18O) to study soil-water origin in sloped vineyard: First results. Rud.-Geološko-Naft. Zb. 2022, 37, 1–14. [Google Scholar] [CrossRef]
  28. Kovač, Z.; Ružičić, S.; Rubinić, V.; Nakić, Z.; Sertić, M. Sorption of cadmium, zinc and copper in dominant soils of the Zagreb aquifer system, Croatia. Geol. Croat. 2022, 75, 177–188. [Google Scholar] [CrossRef]
  29. Miko, S.; Halamić, J.; Peh, Z.; Galović, L. Geochemical Baseline Mapping of Soils Developed on Diverse Bedrock from Two Regions in Croatia. Geol. Croat. 2001, 54, 53–118. [Google Scholar] [CrossRef]
  30. Romić, M.; Romić, D. Heavy metals distribution in agricultural topsoils in urban area. Environ. Geol. 2003, 43, 795–805. [Google Scholar] [CrossRef]
  31. Halamić, J.; Miko, S. Geochemical Atlas of the Republic of Croatia; Croatian Geological Survey: Zagreb, Croatia, 2009; p. 87. [Google Scholar]
  32. Nakić, Z.; Ružičić, S.; Posavec, K.; Mileusnić, M.; Parlov, J.; Bačani, A.; Durn, G. Conceptual model for groundwater status and risk assessment—Ase study of the Zagreb aquifer system. Geol. Croat. 2013, 66, 55. [Google Scholar] [CrossRef]
  33. Basch, O. Osnovna geološka karta SFRJ 1: 100000. Tumač za list Ivanić-Grad [Basic Geological Map of SFRY 1: 100000, Geology of the Ivanić-Grad sheet− in Croatian]; Geološki Zavod: Zagreb, Croatia; Savezni Geološki Zavod: Beograd, Serbia, 1983; pp. 38–40. [Google Scholar]
  34. Velić, J.; Saftić, B.; Malvić, T. Lithologic Composition and Stratigraphy of Quaternary Sediments in the Area of the “Jakusevec” Waste Depository (Zagreb, Northern Croatia). Geol. Croat. 1999, 52, 119–130. [Google Scholar]
  35. Velić, J.; Saftić, B. Subsurface spreading and facies characteristics of middle Pleistocene deposits between Zapresic and Samobor. Geološki Vjesn. 1999, 44, 69–82. [Google Scholar]
  36. Velić, J.; Durn, G. Alternating Lacustrine-Marsh Sedimentation and Subaerial Exposure Phases during Quaternary: Prečko, Zagreb, Croatia. Geol. Croat. 1993, 46, 71. [Google Scholar]
  37. Vujević, M.; Posavec, K. Identification of Groundwater Level Decline in the Zagreb and Samobor-Zapresic 284 Aquifers since the Sixties of the Twentieth Century. Rud.-Geološko-Naft. Zb. 2018, 33, 55–64. [Google Scholar] [CrossRef] [Green Version]
  38. Ružičić, S.; Mileusnić, M.; Posavec, K. Building Conceptual and Mathematical Model for Water Flow and Solute Transport in the Unsaturated zone at Kosnica Site. Rud.-Geološko-Naft. Zb. 2012, 25, 21. [Google Scholar]
  39. IUSS Working Group WRB. World Reference Base for Soil Resources 2014: International Soil Classification System for Naming Soil and Creating Legends for Soil Maps; World Soil Resources Report; FAO: Rome, Italy, 2014; p. 106. [Google Scholar]
  40. Ružičić, S.; Kovač, Z.; Perković, D.; Bačani, L.; Majhen, L. The Relationship between the Physicochemical Properties and Permeability of the Fluvisols and Eutric Cambisols in the Zagreb Aquifer, Croatia. Geosciences 2019, 9, 416. [Google Scholar] [CrossRef]
  41. Jahn, R.; Blume, H.P.; Asio, V.B.; Spaargaren, O.; Schad, P. Guidelines for Soil Description, 4th ed.; FAO: Rome, Italy, 2006; p. 97. [Google Scholar]
  42. ISO 13536; Soil Quality-Determination of pH. International Organisation for Standardisation: Geneva, Switzerland, 2005.
  43. ISO 10693; Soil Quality-Determination of Carbonate Content—Volumetric Method. International Organisation for Standardisation: Geneva, Switzerland, 1995.
  44. ISO 13536; Soil Quality-Determination of the Potential Cation Exchange Capacity and Exchangeable Cations Using Barium Chloride Solution Buffered at pH = 8.1. International Organisation for Standardisation: Geneva, Switzerland, 1995.
  45. Moore, D.M.; Reynolds, R.C. X-ray Diffraction and the Identification and Analysis of Clay Minerals; Oxford University Press: Oxford, UK, 1989. [Google Scholar]
  46. Jain, C. Metal fractionation study on bed sediments of River Yamuna, India. Water. Res. 2004, 38, 569–578. [Google Scholar] [CrossRef]
  47. Thuong, N.T.; Yoneda, M.; Shimada, Y.; Matsui, Y. Assessment of trace metal contamination and exchange between water and sediment systems in the To Lich River in inner Hanoi, Vietnam. Environ. Earth. Sci. 2015, 73, 3925–3936. [Google Scholar] [CrossRef]
  48. Githaiga, K.B.; Njuguna, S.M.; Makokha, V.A.; Wang, J.; Gituru, R.W.; Yan, X. Assessment of Cu, Zn, Mn, and Fe enrichment in Mt. Kenya soils: Evidence for atmospheric deposition and contamination. Environ. Monit. Assess. 2020, 192, 167. [Google Scholar] [CrossRef]
  49. Reimann, C.; Caritat, P. Intrinsic flaws of element enrichment factors (EFS) in environmental geochemistry. Environ. Sci. Technol. 2000, 34, 5084–5091. [Google Scholar] [CrossRef]
  50. Gowd, S.S.; Reddy, M.R.; Govil, P. Assessment of heavy metal contamination in soils at Jajmau (Kanpur) and unnao industrial areas of the ganga plain, uttar pradesh, India. J. Hazard. Mater. 2010, 174, 113–121. [Google Scholar] [CrossRef] [PubMed]
  51. Uduma, A.U.; Awagu, E.F. Manganese as a Reference Element for the Assessment of Zinc Enrichment and Depletion in Selected Farming Soils of Nigeria. Res. J. Environ. Earth Sci. 2013, 5, 497–504. [Google Scholar] [CrossRef]
  52. Bu, J.; Sun, Z.; Zhou, A.; Xu, Y.; Ma, R.; Wei, W.; Liu, M. Heavy Metals in Surface Soils in the Upper Reaches of the Heihe River, Northeastern Tibetan Plateau, China. Int. J. Environ. Res. Public Health 2016, 13, 247. [Google Scholar] [CrossRef] [PubMed] [Green Version]
  53. Githaiga, K.B.; Njuguna, S.M.; Yan, X. Local Geochemical Baselines Reduce Variation Caused by the Use of Different Conservative Elements in Predicting Cu and Zn Enrichment in Agricultural Soils, Kenya. Chem. Afr. 2021, 4, 869–880. [Google Scholar] [CrossRef]
  54. Birch, G. A Scheme for Assessing Human Impacts on Coastal Aquatic Environments Using Sediments; Woodcoffe, C.D., Furness, R.A., Eds.; Coastal GIS 2003; Wollongong University Papers in Center for Maritime Policy: Wollongong, Australia, 2003. [Google Scholar]
  55. Rajmohan, N.; Prathapar, S.A.; Jayaprakash, M.; Nagarajan, R. Vertical distribution of heavy metals in soil profile in a seasonally waterlogging agriculture field in Eastern Ganges Basin. Env. Monit. Assess. 2014, 186, 5411–5427. [Google Scholar] [CrossRef] [PubMed]
  56. Muller, G. Schwermetalle in den sediments des RheinsVeranderungen seitt 1971. Umschan 1979, 79, 778–783. [Google Scholar]
  57. Förstner, U.; Müller, G. Concentrations of heavy metals and polycyclic aromatic hydrocarbons in river sediments: Geochemical background, man’s influence and environmental impact. GeoJournal 1981, 5, 417. [Google Scholar] [CrossRef]
  58. Praveena, S.M.; Ahmed, A.; Radojevic, M.; Abdullah, M.H.; Aris, A.Z. Multivariate and geoaccumulation index evaluation in mangrove surface sediment of Mengkabong Lagoon, Sabah. Bull. Environ. Contam. Toxicol. 2008, 81, 52–56. [Google Scholar] [CrossRef] [PubMed]
  59. Mohammad Ali, B.N.; Lin, C.Y.; Cleophas, F.; Abdullah, M.H.; Musta, B. Assessment of heavy metals contamination in Mamut river sediments using sediment quality guidelines and geochemical indices. Environ. Monit. Assess. 2015, 187, 4190. [Google Scholar] [CrossRef]
  60. Müller, G. The Heavy Metal Pollution of the Sediments of Neckars and its Tributary: A Stocktaking. Chem. Ztg. 1981, 105, 157–164. [Google Scholar]
  61. Banat, K.M.; Howari, F.M.; Al-Hamad, A.A. Heavy metals in urban soils of central Jordan: Should we worry about their environmental risks? Environ. Res. 2005, 97, 258–273. [Google Scholar] [CrossRef]
  62. Sainz, A.; Ruiz, F. Influence of the very polluted inputs of the Tinto-Odiel system on the adjacent littoral sediments of southwestern Spain: A statistical approach. Chemosphere 2006, 62, 1612–1622. [Google Scholar] [CrossRef]
  63. Ružičić, S.; Mileusnić, M.; Posavec, K.; Nakić, Z.; Durn, G.; Filipović, V. Water flow and solute transport model of potentially toxic elements through unsaturated zone at regional wellfield Kosnica. Hydrol. Processes 2016, 30, 4113–4124. [Google Scholar] [CrossRef]
  64. Chaudhari, P.R.; Ahire, D.V.; Chkravarty, M.; Maity, S. Electrical conductivity as a tool for tetermining the physical properties of Indian soils. Int. J. Sci. Res. Publ. 2014, 4, 1–4. [Google Scholar]
  65. Officer, S.J.; Kravchenko, A.; Bollero, G.A.; Sudduth, K.A.; Kitchen, N.R.; Wiebold, W.J.; Palm, H.L.; Bullock, D.G. Relationships between soil bulk electrical conductivity and the principal component analysis of topography and soil fertility values. Plant Soil 2004, 258, 269–280. [Google Scholar] [CrossRef]
  66. Ružičić, S.; Jašaragić-Rako, T. Multielement sorption of cadmium, zinc, copper and lead onto a Fluvisol profile at the Stara Loza site, Croatia. Int. J. Environ. Pollut. 2017, 62, 63. [Google Scholar] [CrossRef]
  67. Meegoda, J.N.; Martin, L. In-situ determination of specific surface area of clays. Geotech. Geol. Eng. 2019, 37, 465–474. [Google Scholar] [CrossRef]
  68. Sherene, T. Mobility and transport of heavy metals in polluted soil environment. Biol. Forum—Int. J. 2010, 2, 112–121. [Google Scholar]
  69. McGrath, S.P.; Loveland, P.J. The Soil Geochemical Atlas of England and Wales; Blackie & Sons: London, UK, 1992. [Google Scholar]
  70. Pils, J.R.V.; Karathanasis, A.D.; Mueller, T.G. Concentration and Distribution of Six Trace Metals in Northern Kentucky Soils. Soil Sediment Contam. 2004, 13, 37–51. [Google Scholar] [CrossRef]
  71. Kierczak, J.; Néel, C.; Aleksander-Kwaterczak, U.; Helios-Rybicka, E.; Bril, H.; Puziewicz, J. Solid speciation and mobility of potentially toxic elements from natural and contaminated soils: A combined approach. Chemosphere 2008, 73, 776–784. [Google Scholar] [CrossRef]
  72. Bani, A.; Echevarria, G.; Montarges-Pelletier, E.; Gjoka, F.; Sulce, S.; Morel, J.L. Pedogenesis and nickel biogeochemistry in a typical Albanian ultramafic toposequence. Environ. Monit. Assess. 2014, 186, 4431–4442. [Google Scholar] [CrossRef]
  73. Schulin, R.; Curchod, F.; Mondeshka, M.; Daskalova, A.; Keller, A. Heavy metal contamination along a soil transect in the vicinity of the iron smelter of Kremikovtzi (Bulgaria). Geoderma 2007, 140, 52–61. [Google Scholar] [CrossRef]
  74. Ružičić, S.; Kovač, Z.; Nakić, Z.; Kireta, D. Fluvisol permeability estimation using soil water content variability. Geofizika 2017, 34, 141–155. [Google Scholar] [CrossRef]
  75. He, G.; Zhang, Z.; Wu, X.; Cui, M.; Zhang, J.; Huang, X. Adsorption of Heavy Metals on Soil Collected from Lixisol of Typical Karst Areas in the Presence of CaCO3 and Soil Clay and Their Competition Behavior. Sustainability 2020, 12, 7315. [Google Scholar] [CrossRef]
  76. Elbana, T.A.; Selim, H.M. Modeling of cadmium and nickel release from different soils. Geoderma 2019, 338, 78–87. [Google Scholar] [CrossRef]
  77. Dennis, J.K.; Such, T.E. Nickel and Chromium Plating, 3rd ed.; Woodhead Publishing Ltd.: Cambridge, UK, 1993. [Google Scholar]
  78. Tyle, H.; Scott-Fordsmand, J. Nickel and nickel compounds. European Union Risk Assessment Report 2008, Denmark. [Google Scholar]
  79. Stopić, D.; Mandarić, A.; Prce, M.; Begić, D.; Malenica, M.; Fratrić, T.; Mirić, S. Report on the State of the Environment in Zagreb County 2017–2020. 2021. Available online: https://www.zagrebacka-zupanija.hr/media/filer_public/17/70/1770fb57-e25f-4c47bd02-1615bca2e620/izvjesce_o_stanju_okolisa_zagrebacke_zupanije_2017_-_2020.pdf (accessed on 11 October 2022). (In Croatian).
  80. Ngole, V.M.; Ekosse, G.I.E. Copper, nickel and zinc contamination in soils within the precincts of mining and landfilling environments. Int. J. Environ. Sci. Technol. 2012, 9, 485–494. [Google Scholar] [CrossRef] [Green Version]
  81. Filipović, L.; Romić, M.; Romić, D.; Filipović, V.; Ondrašek, G. Organic matter and salinity modify cadmium soil (phyto)availability. Ecotoxicol Environ. Saf. 2018, 147, 824–831. [Google Scholar] [CrossRef]
  82. Sipos, P.; Choi, C.; Németh, T.; Szalai, Z.; Póka, T. Relationship between iron and trace metal fractionation in soils. Chem. Speciat. Bioavailab. 2014, 26, 21–30. [Google Scholar] [CrossRef]
  83. Antoniadis, V.; Shaheen, S.M.; Tsadilas, C.D.; Selim, M.H. Zinc sorption by different soils as affected by selective removal of carbonates and hydrous oxides. Appl. Geochem. 2018, 88, 49–58. [Google Scholar] [CrossRef]
  84. Flem, B.; Reimann, C.; Fabian, K. Excess Cr and Ni in top soil: Comparing the effect of geology, diffuse contamination, and biogenic influence. Sci. Total Environ. 2022, 843, 157059. [Google Scholar] [CrossRef]
  85. Mengel, K.; Kirkby, E.A.; Kosegarten, H.; Appel, T. Principles of Plant Nutrition; Springer: Dordrecht, The Netherlands, 2001. [Google Scholar] [CrossRef]
  86. Bednářová, Z.; Komprdová, K.; Kalábová, T.; Sáňka, M. Impact of floods and their frequency on content and distribution of risk elements in alluvial soils. Water Air Soil Pollut. 2015, 226, 15. [Google Scholar] [CrossRef]
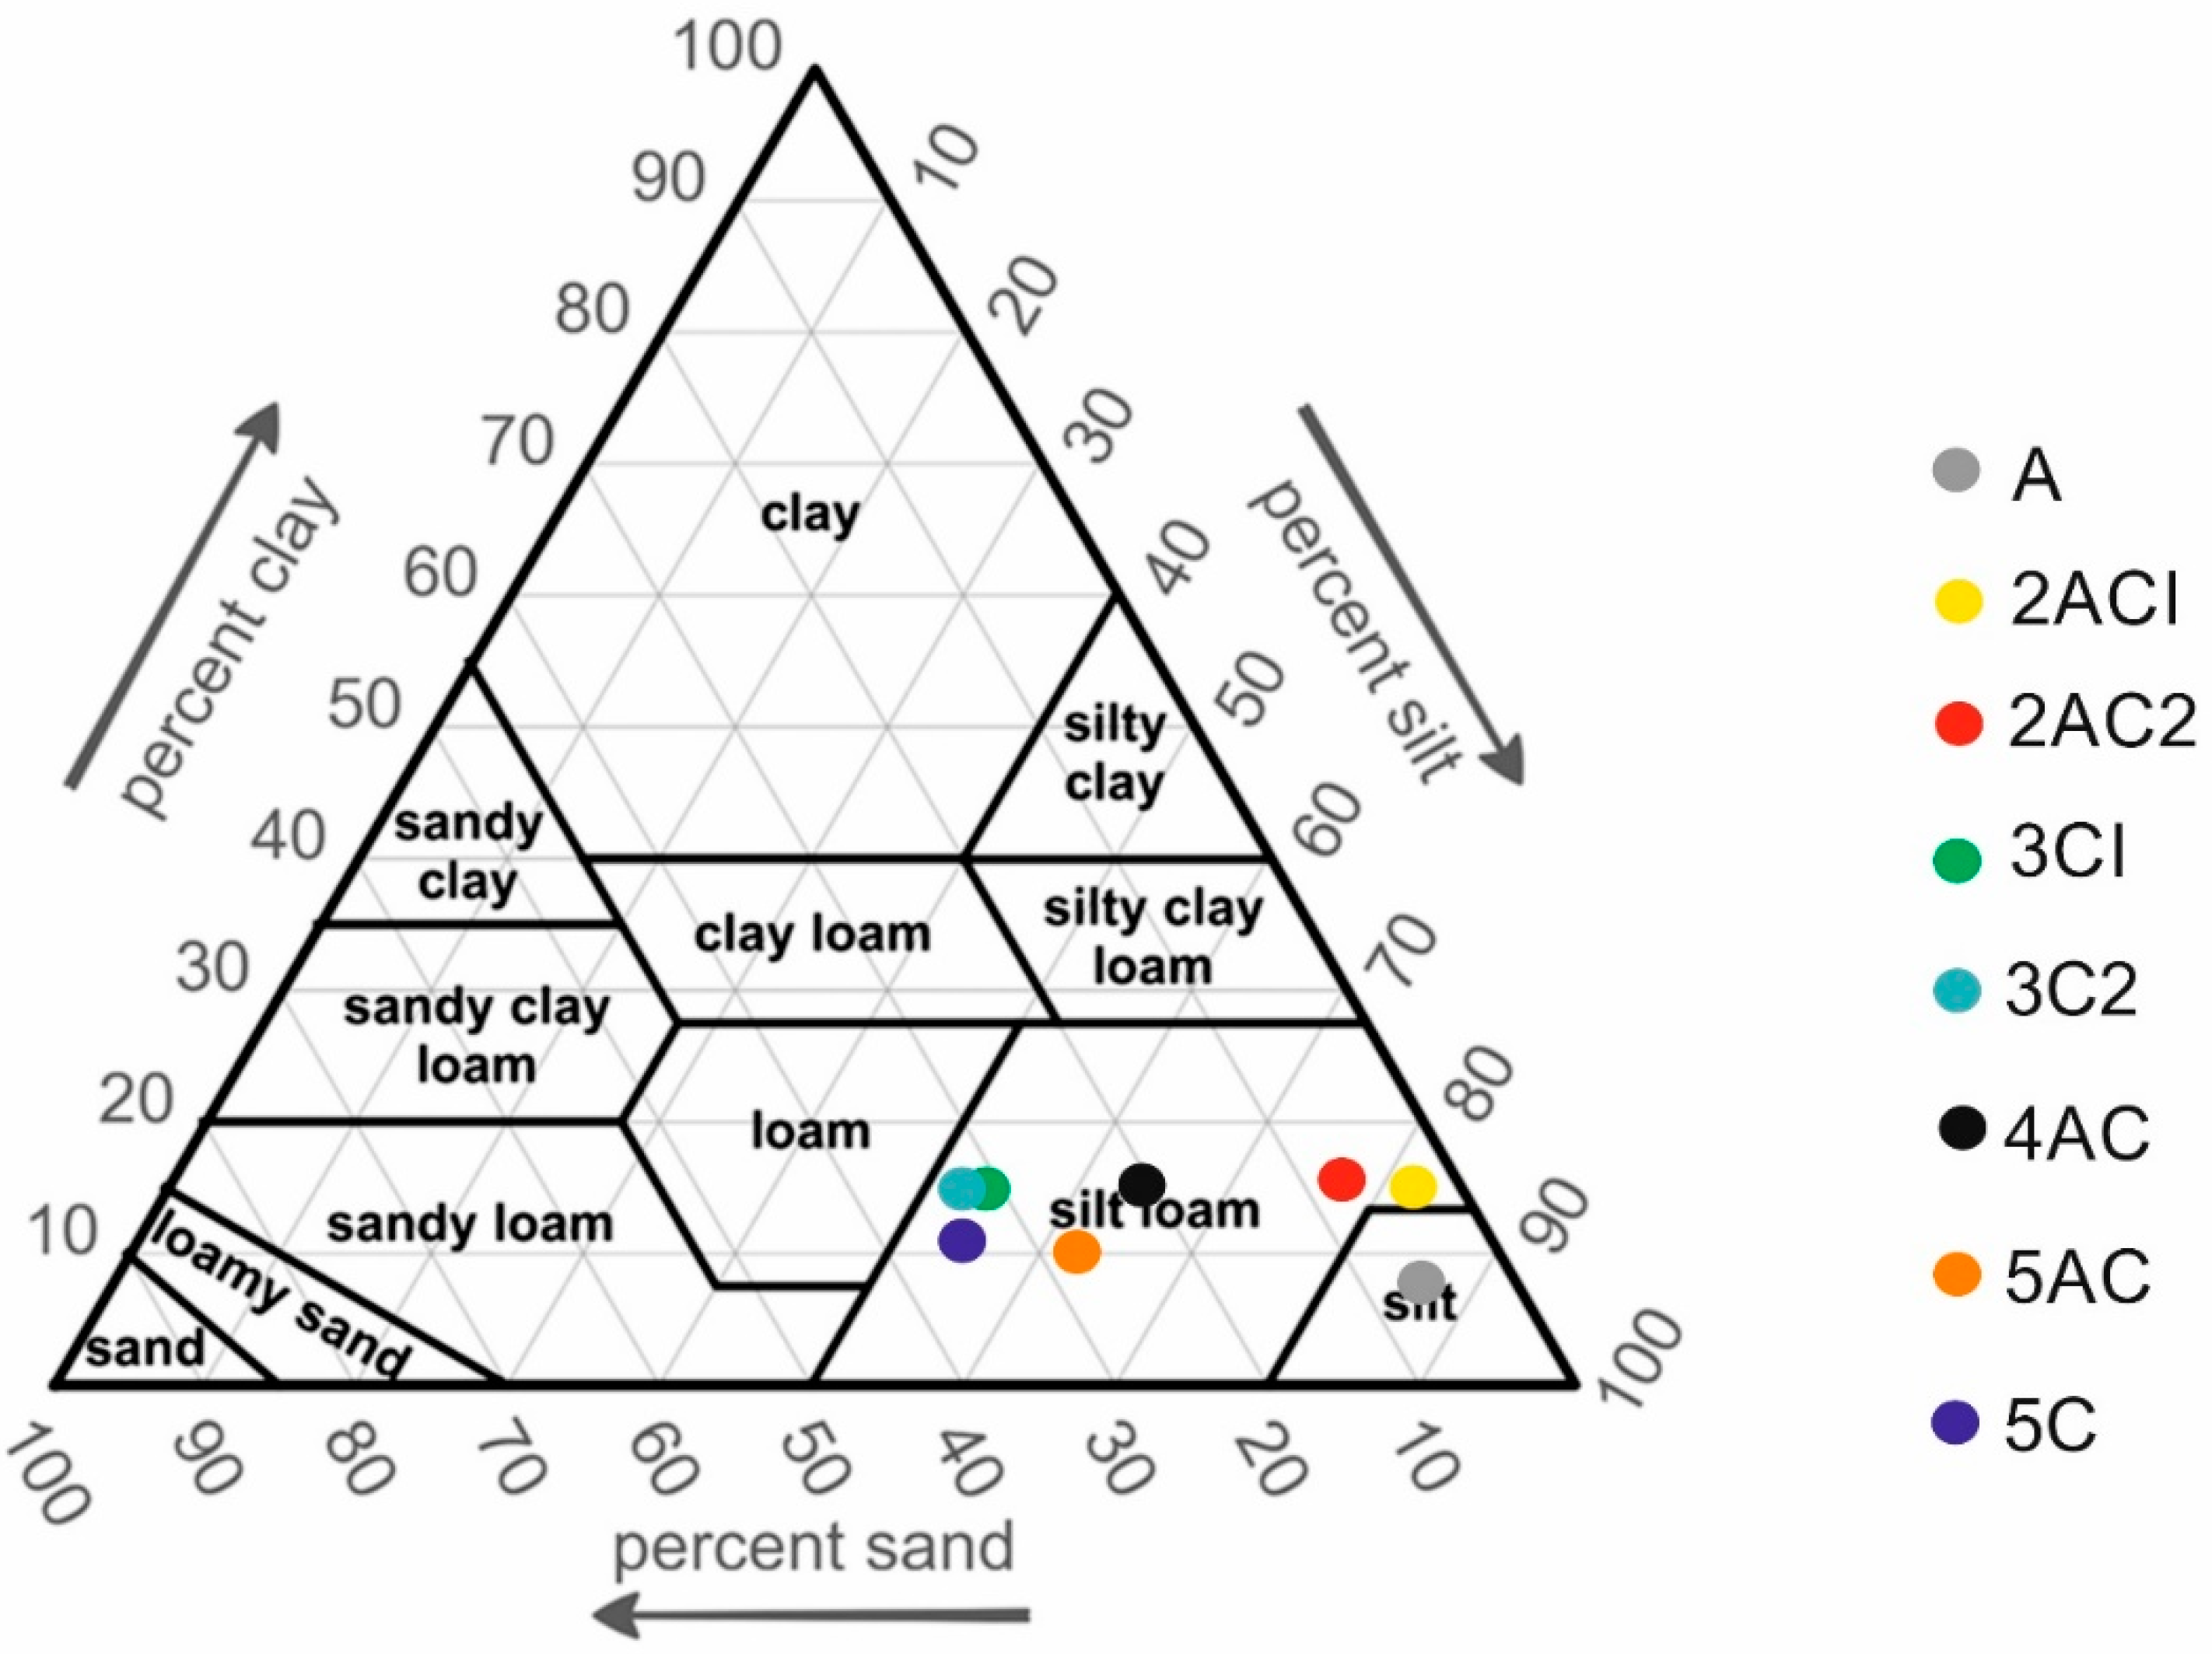
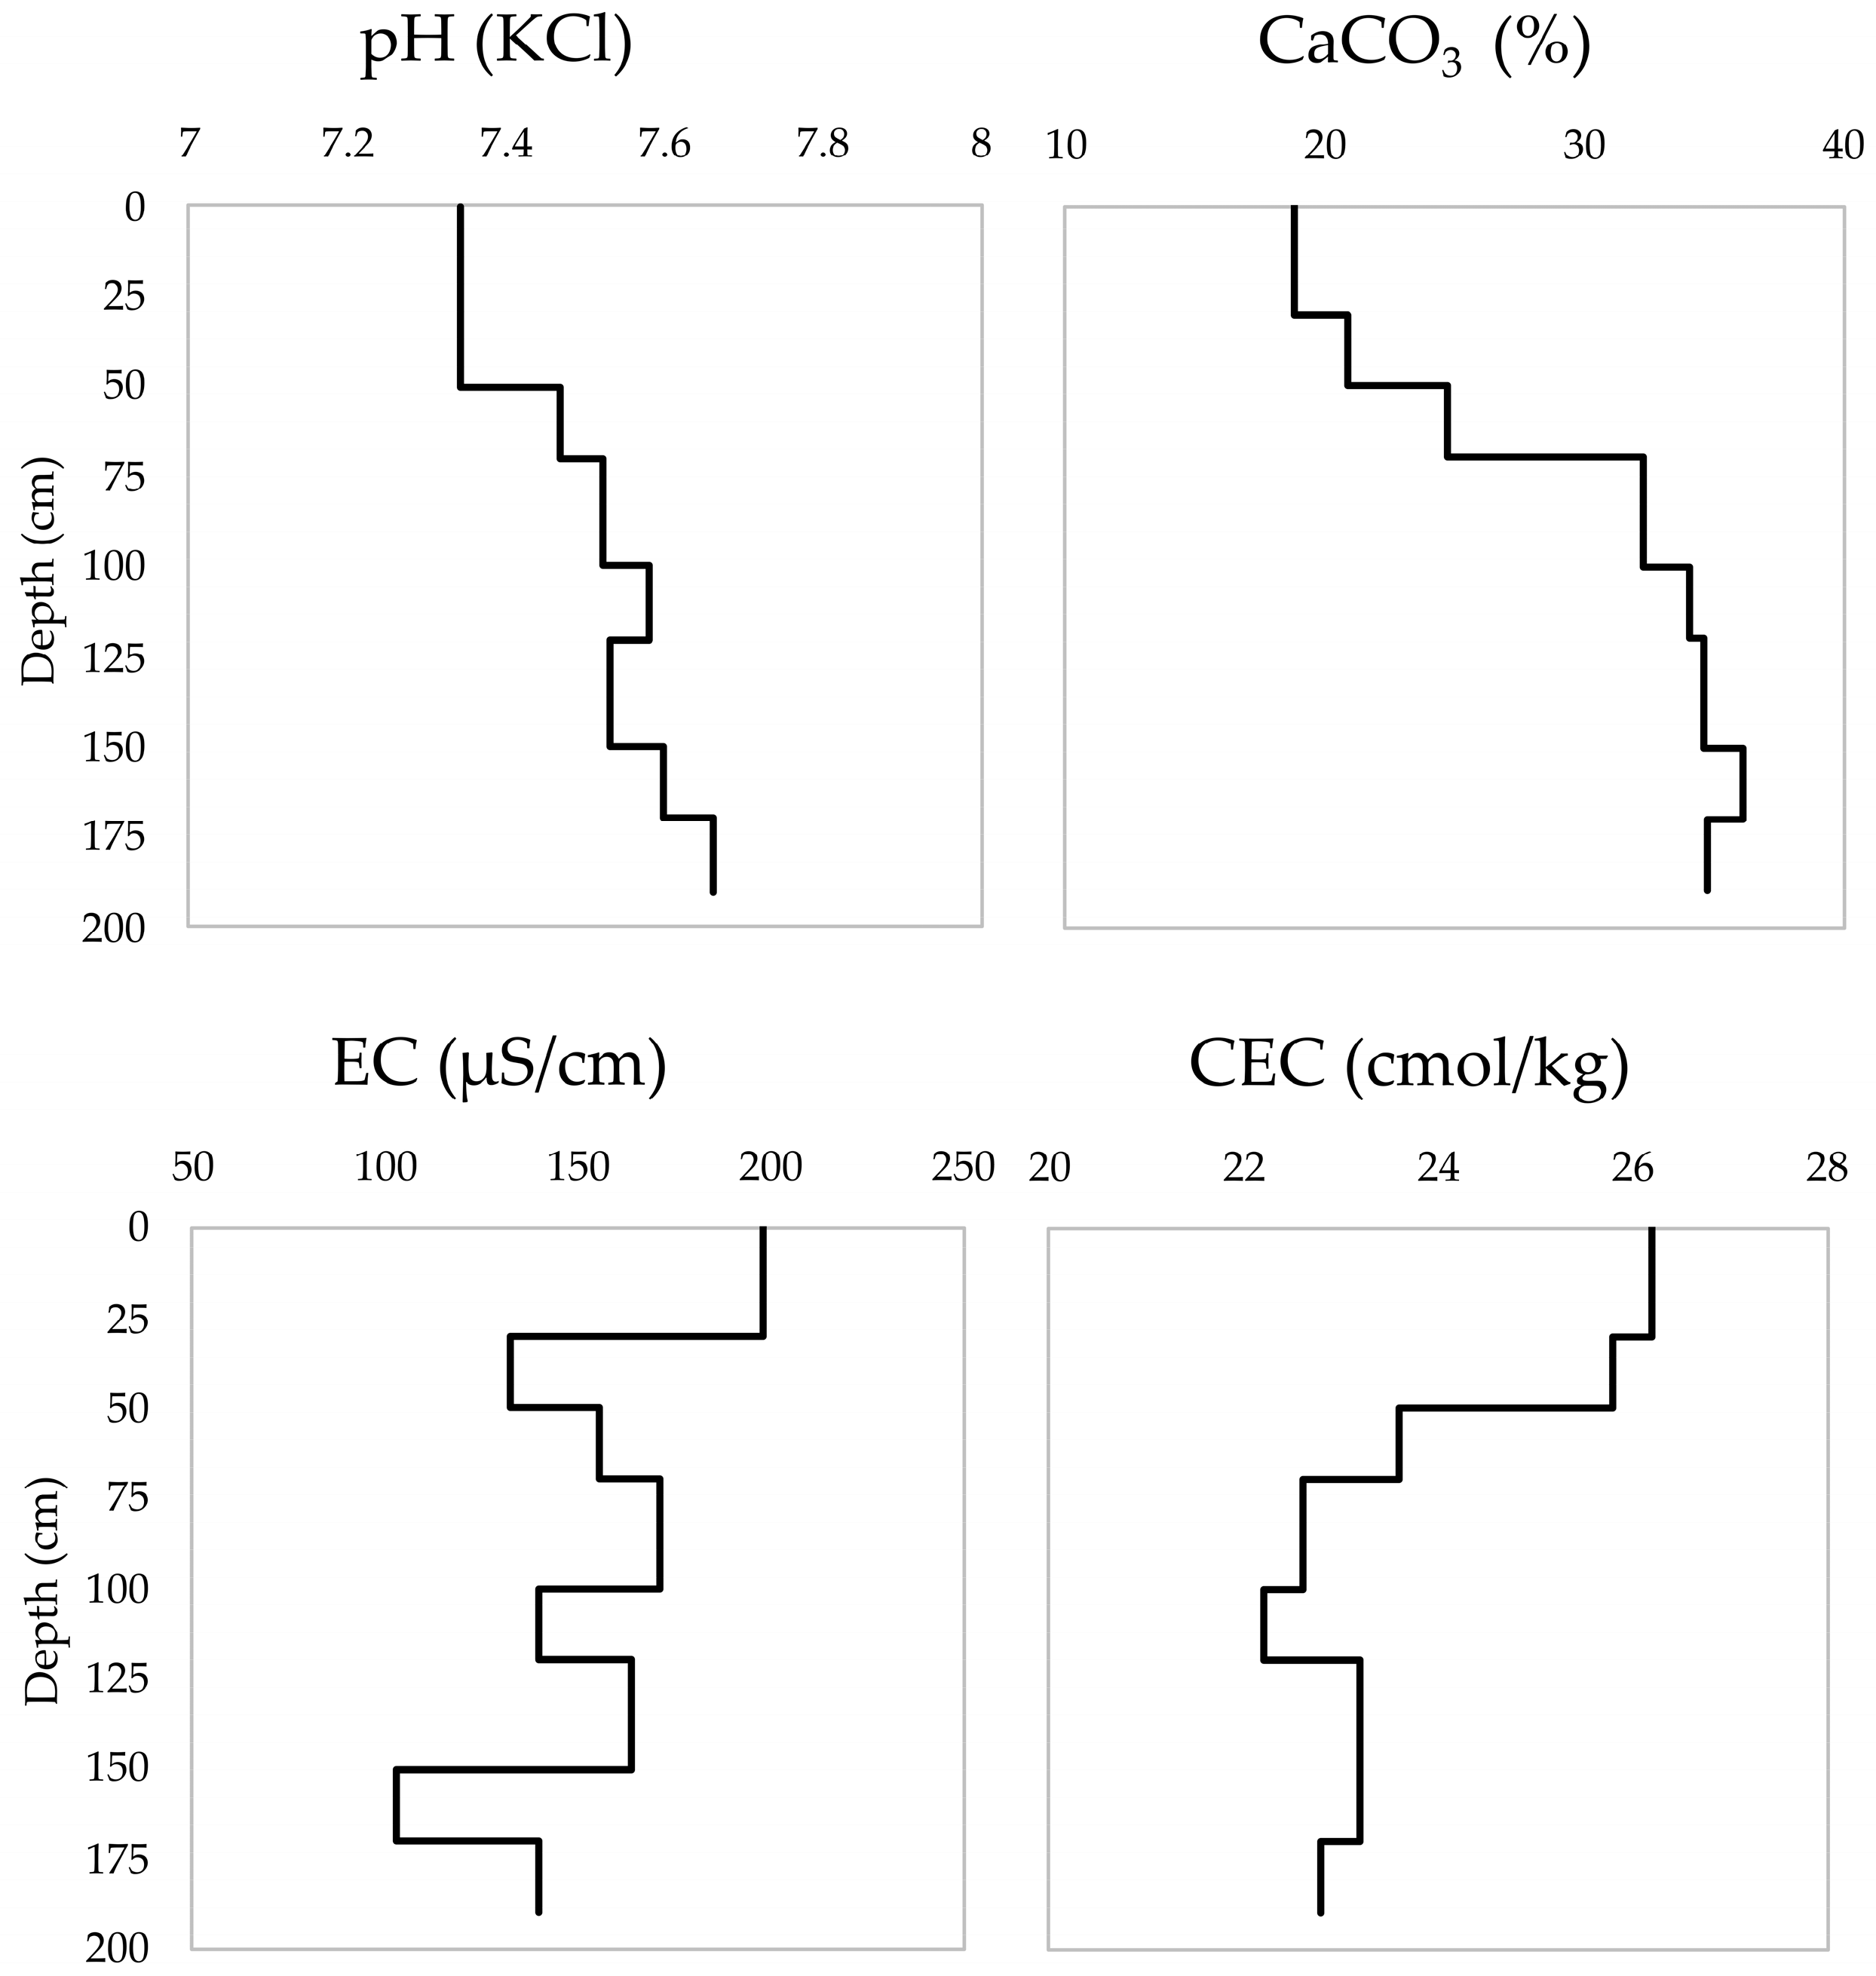
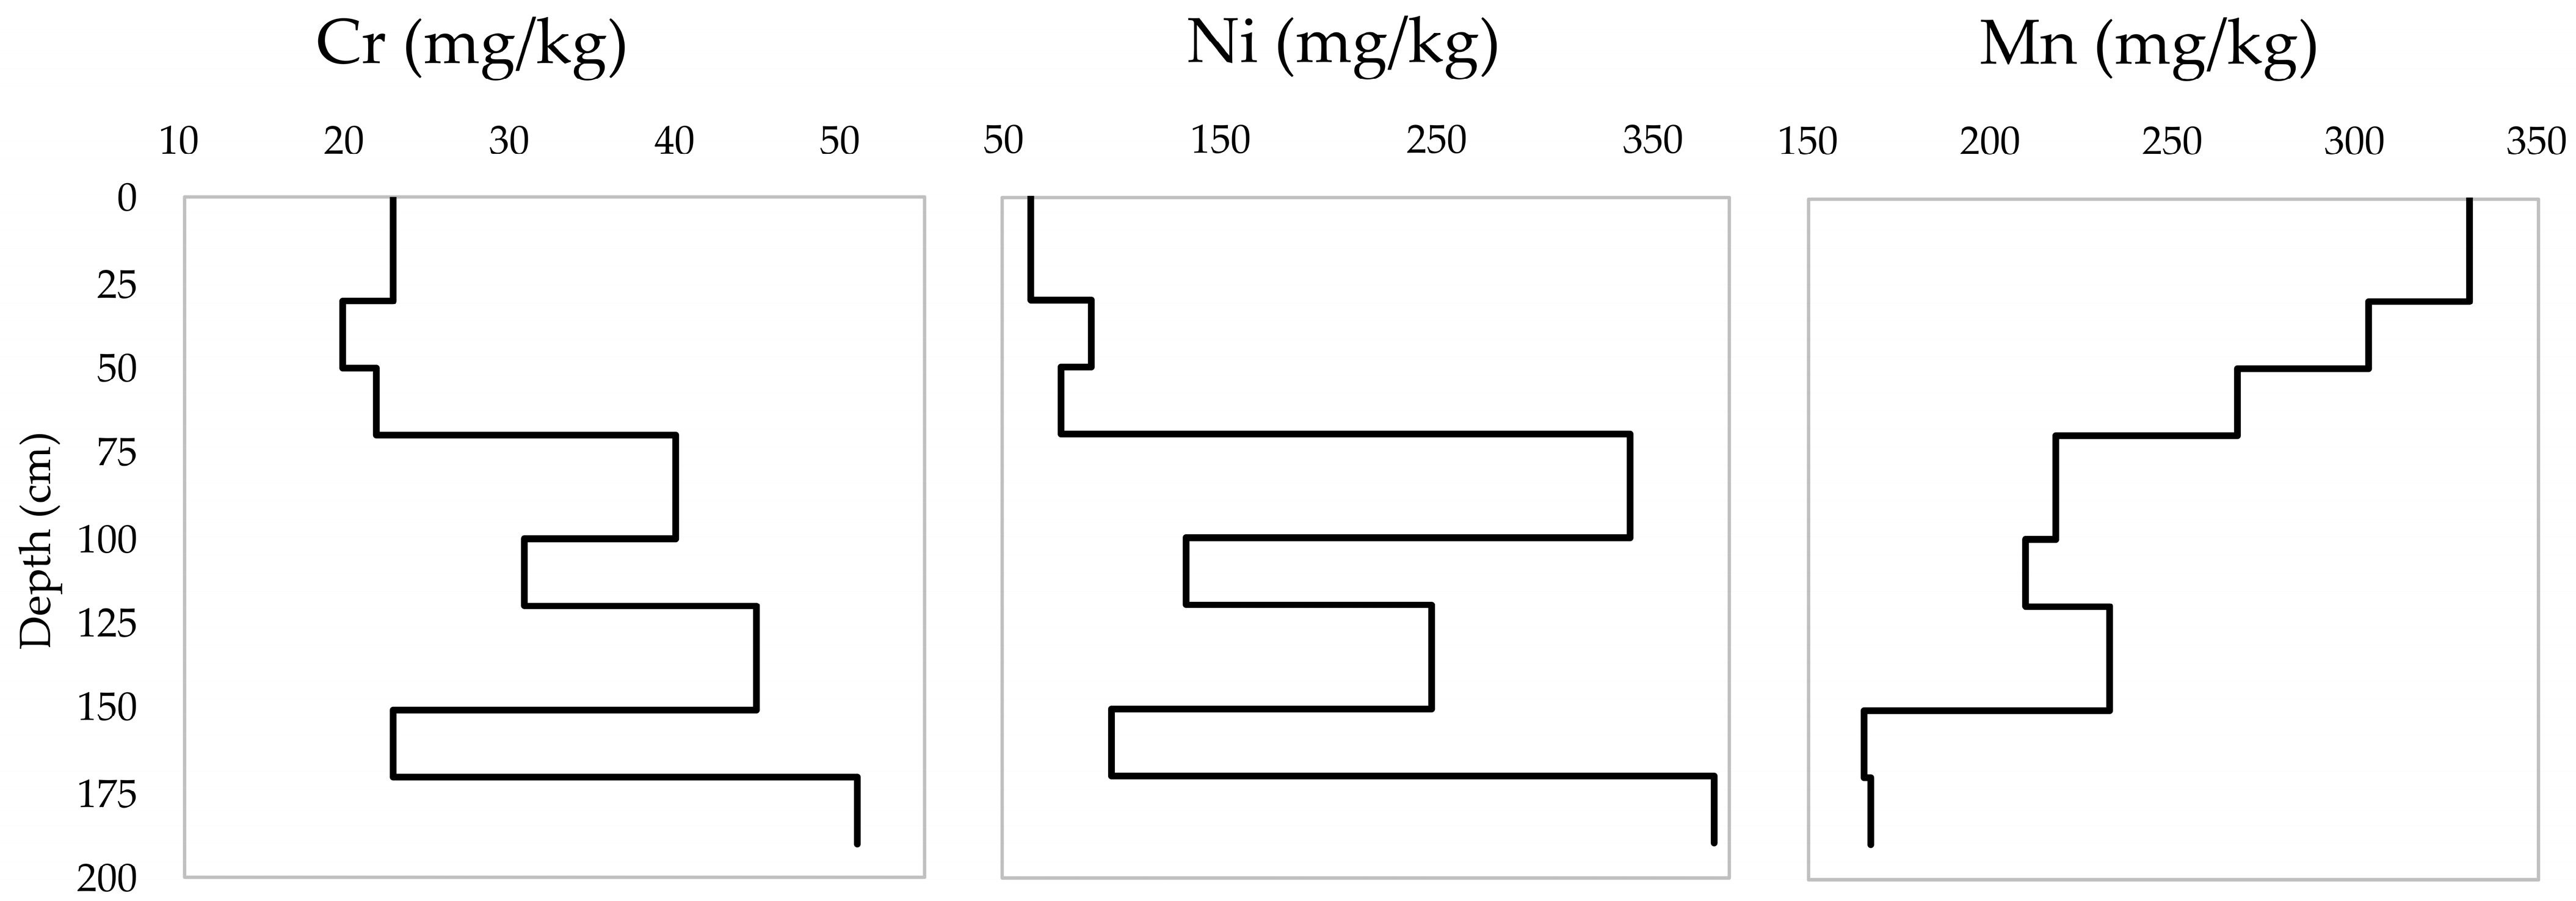
Figure 1. Geographical map of study area with location of pumping wells at the well field Petruševec, investigated soil profile and potentially contamination sources.
Environments 09 00154 g001
Figure 2. Soil texture of analyzed soils.
Environments 09 00154 g002
Figure 3. Vertical distribution of pH, EC, CaCO3 and CEC in the study soil profile.
Environments 09 00154 g003
Figure 4. Vertical distribution of Cr, Ni and Mn concentrations in mg/kg.
Environments 09 00154 g004
Table 1. Physical and chemical characteristics of analyzed soils.
Soil Depth (cm)Soil HorizonsSoil ColorpH (KCl)EC (μS/cm)CaCO3 (%)CEC (cmol/kg)Soil Texture
0–30A10YR/5/37.3419818.826.2silt
30–50 2ACI10YR/5/37.3413220.825.8silt loam
50–70 2AC210YR/5/37.4715524.723.6silt loam
70–100 3CI10YR/4/37.5217132.322.6silt loam
100–1203C210YR/4/37.5814034.122.2silt loam
120–1504AC10YR/4/37.5316434.623.2silt loam
150–170 5AC10YR/4/47.6010336.123.2silt loam
170–190 5C10YR/4/47.6614034.822.8silt loam
Table 2. Semi-quantitative mineral composition of the <2 mm fraction (after dilution of carbonate minerals). Qtz: quartz. Pl: plagioclase. Kfs: potassium feldspar. Gt: goethite. Hem: hematite. M: micaceous minerals (mica and illitic material). Kln: kaolinite. Chl: chlorite. MLCM: mixed-layer clay minerals in which type of interstratification and constituting clay minerals were not recognized with certainty.
Soil Depths (cm)Soil HorizonsQtzPlKfsGtHemMKlnChlMLCM
0–30A237xxxxxxxxx?x
30–50 2ACI238x?xxxxxxxxx
50–70 2AC22610xxxxxxxxxxxx
70–100 3CI369xxxxx-xxxxx
100–1203C23711x-xxx-xx?x
120–1504AC328x?xxx?xxxxxx
150–170 5AC368x?xxx-xxxxx
170–190 5C3712xxxxxxxxxxx
‘x’ relative abundance of minerals based on X-ray diffraction (no quantitative value is assigned to x). ‘?’ mineral phase was not detected with certainty.
Table 3. Correlation analysis results (statistically significant marked red, α = 0.05).
ParameterpH (KCl)ClaySiltSandCarbonateECCECCrNi
Cr0.640.24−0.650.640.640.14−0.59--
Ni0.600.22−0.670.670.590.08−0.570.94-
Table 4. Enrichment factors (EF) and index of geoaccumulation (Igeo) at local and state level for Ni and Cr in analyzed Fluvisols. Within this research, the median for Cr and Ni at local (Central Croatia) and state scale (Croatia) was used according to [31].
Enrichment FactorsIgeo
CroatiaLocal CroatiaLocal
Soil HorizonsNiCrNiCrNiCrNiCr
A2.820.263.130.240.22−2.520.32−2.27
2ACI4.500.234.990.210.34−2.720.88−2.47
2AC24.270.254.730.230.08−2.580.62−2.33
3CI23.400.4525.960.412.24−1.722.78−1.47
3C29.640.3510.710.320.90−2.091.44−1.84
4AC15.940.5117.700.461.78−1.552.32−1.30
5AC9.060.2610.060.240.47−2.521.01−2.27
5C33.930.5837.660.532.40−1.372.94−1.12
Publisher’s Note: MDPI stays neutral with regard to jurisdictional claims in published maps and institutional affiliations.

