Article

An Investigation on Bromine Content Assessment in e-Waste Plastics by Short Wave Infrared (SWIR) Spectroscopy

by
Giuseppe Bonifazi
1,2,*,
Ludovica Fiore
1,
Riccardo Gasbarrone
1,
Pierre Hennebert
3 and
Silvia Serranti
1,2
1
Department of Chemical Engineering, Materials & Environment, Sapienza University of Rome, Via Eudossiana 18, 00184 Rome, Italy
2
Research Center for Biophotonics, Sapienza University of Rome, Polo di Latina, Corso della Repubblica 79, 04100 Latina, Italy
3
French National Institute for Industrial Environment and Risks, CEDEX 03, 13592 Aix-en-Provence, France
*
Author to whom correspondence should be addressed.
Environments 2022, 9(12), 152; https://doi.org/10.3390/environments9120152
Submission received: 17 October 2022 / Revised: 28 November 2022 / Accepted: 2 December 2022 / Published: 5 December 2022

Abstract

:
This paper reported a study based on the application of SWIR (shortwave infrared) spectroscopy to assess the presence of brominated flame retardants (BFRs) in plastic scraps coming from an e-waste stream composed by CRT (i.e., cathode-ray tube) monitors and televisions. An X-ray fluorescence (XRF) analysis was performed on plastic scraps to determine the presence and content of bromine (Br). The presence in plastic waste-flow streams, fed to or resulting from a recycling process, of individuals characterized by high concentrations of Br does not allow their use as secondary raw materials, imposing the need for an ad hoc separation processes. Chemometric methods were adopted for setting up models able to discriminate Br content. In more detail, principal component analysis (PCA) was used as an exploratory tool, while partial least squares (PLS) and locally weighted regression based on PLS regressions (LWRPLS) were used as multivariate regression models to test the ability of the spectra to predict Br content. The LWRPLS, showing an Rp2 of about 0.9, demonstrates the ability of this algorithm to establish a good correlation between the spectral signatures of plastic scraps and their Br content.

Graphical Abstract

1. Introduction

Due to its properties, plastic is largely utilized in various end-use markets such as packaging (39.9%), building and construction (19.8%), automotive (9.9%) and electrical and electronic equipment (EEE) (6.2%) [1]. With reference to the latter category, the waste of electrical and electronic equipment (WEEE) has increased three times compared to that of municipal waste. As a consequence, the best management strategies have to be identified for this class of products [2] in order to maximize their materials and precious element recovery [3,4], thus avoiding environmental pollution [5]. With reference to the recovery of secondary plastics coming from WEEE, one of the main problems to face is the presence of several hazardous elements such as lead, cadmium, and mercury or additives (e.g., as phthalate plasticizers or color formulations, including cadmium) [6]. Furthermore, the identification and separation of plastic scraps containing brominated flame retardants (BFRs) constitutes one of the main challenges in the recycling of such materials.
BFRs are used for their property of increasing fire resistance and delaying flames [7]; however, bromine (Br) is toxic for the environment and harmful for human/animal health because it is lipophilic, persistent, and in bio-accumulative compounds [8]. Plastic scraps containing BFRs are difficult to separate using conventional methods in recycling plants. For this reason, the need to utilize reliable methods for sorting and/or quality control applications arises. As a consequence, the systematic identification of brominated plastic scraps, or the assessment of their Br content, can be considered one of the key issues in certifying and classifying secondary plastics coming from WEEE fed to recycling plants and/or in establishing full control of the resulting processed fractions and by-products, which have to comply with market demands.
A certain number of studies have been carried out with the aim of identifying the best recycling strategies both through chemical [9] and mechanical recycling [4,10]. In a sorting scenario, the Br concentration limit of 2000 mg/kg is commonly utilized, according to the CENELEC CLC/TS 50625-3-1 technical specification [11]: plastic waste fractions characterized by a Br content below 2000 ppm are thus considered BFR-free. The incineration process is pursued when Br content exceeds 2000 ppm [12].
Most of the methods used to detect, separate, and recover polymers characterized by a high Br content are based on density separation [13], or on the utilization of different spectroscopic techniques such as Raman, mass pyrolysis, X-ray fluorescence (XRF), laser-induced plasma spectroscopy (LIPS), near infrared (NIR) and mid infrared (MIR) reflection, and MIR pyrolysis [14]. All these analyses are usually carried out at laboratory scale and on a limited number of individuals. Among the above-mentioned methods, the proposed NIR spectroscopy approach, being non-destructive and not requiring any sample preparation, meets the requirements of being fast, sustainable, and cost-effective. Using this method, waste materials’ recognition can be obtained through their surface spectral response by adopting specialized devices able to collect reflectance spectra.
Visible and NIR spectroscopy techniques are actually utilized to perform both qualitative and quantitative analysis in different fields: i.e., in the raw materials sector [15,16], in cultural heritage [17,18], in the agricultural and food industries [19,20,21,22], in the pharmaceutical and chemical industries [23,24,25], in clinical applications [26,27], and more generally in analytical science [28]. In recent years, NIR-based applications have rapidly emerged and grown quickly with reference to solid waste sectors [2,29,30,31,32].
From a circular economy perspective, this study proposes a new “friendly and green” solution specifically addressed to preventing pollution by properly managing WEEE plastics containing BFRs.
Previous studies have been successfully carried out to explore the possibility of identifying BFR from BFR-free plastics by HyperSpectral Imaging (HSI) techniques [30,31,33]. In this paper, the possibilities and limits of predicting Br content in e-waste plastic scraps following a shortwave infrared (SWIR)-spectroscopy-based approach are presented and discussed. A portable spectrophotoradiometer was used to collect SWIR reflectance spectra. Different chemometric approaches were explored in order to test the ability of this technique to predict Br content in plastic scraps. In more detail, principal component analysis (PCA) was used as an exploratory tool. Partial least squares (PLS) and locally weighted regression (LWR), based on PLS regressions, were used as multivariate regression models to determine Br content, starting from the information contained in the collected reflectance spectra.

2. Materials and Methods

2.1. Materials

The analyzed samples consist of shredded plastic scraps from cathode-ray tubes (CRT) to be incinerated. Samples were provided by a company of the Galloo group (Galloo Plastics, Halluin, France). Forty-two individual scraps were chosen from the pool. Samples were selected according to different characteristics, such as color, size, thickness, and weight (Figure 1). The total content of Br for each individual was evaluated by XRF spectrometry. A handheld portable XRF was used for this purpose.

2.2. X-Ray Fluorescence

The analysis was carried out using a hand-held XRF NitonTM XL2, mounted on a benchtop stand, with an Ag-anode X-ray tube as the X-ray source and a silicon drift detector (SDD) as the detector. Br measurements were performed using specialized software designed specifically for plastics, with automatic thickness correction. Each sample was measured for about one minute. Br determinations were calibrated in different environmental conditions using certified reference material at a concentration of about 1000 mg/kg. The coefficient of variation (CV), which is the ratio of standard deviation (SD) to the collected data mean (M), was thus calculated to be 0.03.

2.3. Vis-SWIR Spectrophotometry

A portable spectroradiometer, the ASD FieldSpec 4® Standard-Res, equipped with a contact probe, was used to acquire randomly five spectra in reflectance mode for each individual scrap. The acquisition of single spectra took about 2 s. The spectroradiometer operates in the Vis-SWIR (350–2500 nm) wavelength range, with a spectral resolution of 3 nm at 700 nm and 10 nm at 1400/2100 nm [34]. A personal computer controls the spectra-acquisition process. Three distinct detectors are housed within the detector case together with three different holographic diffraction gratings. Each detector is covered by an order separation filter to suppress second and higher order light. A VNIR detector (512 element silicon array; 350–1000 nm), a SWIR 1 detector (Graded Index InGaAs. Photodiode, two-stage TE cooled; 1001–1800 nm), and a SWIR 2 detector (Graded Index InGaAs. Photodiode, two-stage TE cooled; 1801–2500 nm) comprise the detector system. The ASD Contact Probe is powered by a halogen bulb with a color temperature of 2901 +/− 10% K. The contact probe has a spot size of 10 mm. The ASD RS3 software was used for data acquisition and calibration [35]. The calibration of the ASD FieldSpec 4® Standard-Res spectroradiometer was carried out by acquiring the black and white reference standards, that is: performing a “dark acquisition” based on the dark current calibration file and acquiring a certified white Spectralon™ ceramic material, respectively.
Using ViewSpec Pro (Ver. 6.2.0), the gathered spectra (“.asd” data files) were combined into an ASCII text file. MATLAB® (MATLAB R2019a; ver. 9.6.0) was used to import the ASCII text file adopting “fieldspec_import2.m,” a script accessible on GitHub (https://doi.org/10.5281/zenodo.3776139, accessed on 1 December 2022. After that, imported data files were examined in the MATLAB® environment using PLS_toolbox (Eigenvector Research, Inc., Wenatchee, WA, USA; ver. 8.2.1). Dataset objects (DSOs) were used to store the data, and classes were defined.

2.4. Reflectance Spectra Analysis

2.4.1. Spectra Preprocessing

Collected reflectance spectra were preliminarily pre-treated by applying Splice Correction (SC), in order to eliminate the signal gaps between the detector domains. As previously outlined, the instrument’s collected signal contains critical transitions at λ = 1000 nm and λ = 1800 nm. SC’s objective is to correct the discrepancy between the values of reflectance R1000nm/R1001nm and the reflectance values R1800nm/R1801 nm [36]. The SC corrects steps in an input spectral matrix using linear interpolation of the values of the middle sensor’s edges.
Spectra collection and analyses were carried out with reference to the spectral range 900–2500 nm. This choice was made to avoid the influence of the colors of the plastic scraps in the further processing. In order to perform the regressions with Br content, the variance in data matrix X, which is orthogonal to the response matrix Y, was removed using orthogonal signal correction (OSC) [37]. Data were then pre-processed by a mean center (MC) algorithm centering columns in order to have a zero mean [38].

2.4.2. Exploratory Analysis

According to the Br content determined by XRF analysis, principal component analysis (PCA) was used to carry out the exploratory analysis of decomposed spectral data. The PCA is a powerful exploratory tool, allowing the extraction of reflectance data from dominant patterns of the matrix X in terms of two smaller matrices of scores (T) and loadings (PT) products [39].
In more detail, two classes of data were explored according to the recommended concentration limits [11]: “High Br content” (i.e., Br content > 2000 mg/kg) and “Low Br content” (i.e., Br content < 2000 mg/kg). PCA was applied to corrected and mean-centered SWIR Spice data. Principal components (PCs) were chosen by exploring the eigenvalue plot. Outliers and non-informative data were identified and excluded.

2.4.3. Regression Models

The spectral dataset (X) and the reference measurements (Y) were randomly divided into two sections using the Kennard-Stone (K-S) algorithm in order to set up the regression models. The first 70% of the data were utilized as a calibration set, while the latter 30% were used as a test set. To determine the ideal model complexity and select the number of latent variables (LVs), Venetian blinds (VBs) were employed as a cross-validation approach, while to evaluate the quality of the set-up regression models, three parameters were considered: root mean square error (RMSE), the bias, and the coefficient of determination R 2 , thus allowing one to evaluate the difference between the estimated response and the observed response and the goodness of the fit. These parameters were evaluated for the calibration (C), cross-validation (CV), and prediction (P) phases of the modelling.
The partial least squares regression (PLSR) and the locally weighted partial least squared regression (LWPLSR) were chosen to predict the Br content from reflectance spectra. The PLSR is a chemometric technique combining features of both multiple regression and PCA. The main objective of PLSR is to predict the matrix Y that stores the dependent variables from X, the matrix containing the predictors, and to describe the underlying common structure of the data [40,41]. It is often applied when a high number of independent variables have to be employed to predict a small number of dependent variables. On the other hand, LWPLSR is a particular case of weighted PLSR that constructs a local regression model according to the similarity between a target sample and the dataset samples [42]. It is an efficient prediction method when data heterogeneity creates nonlinear relations (curvatures and clustering) between the response and the explicative variables [43].

3. Results and Discussion

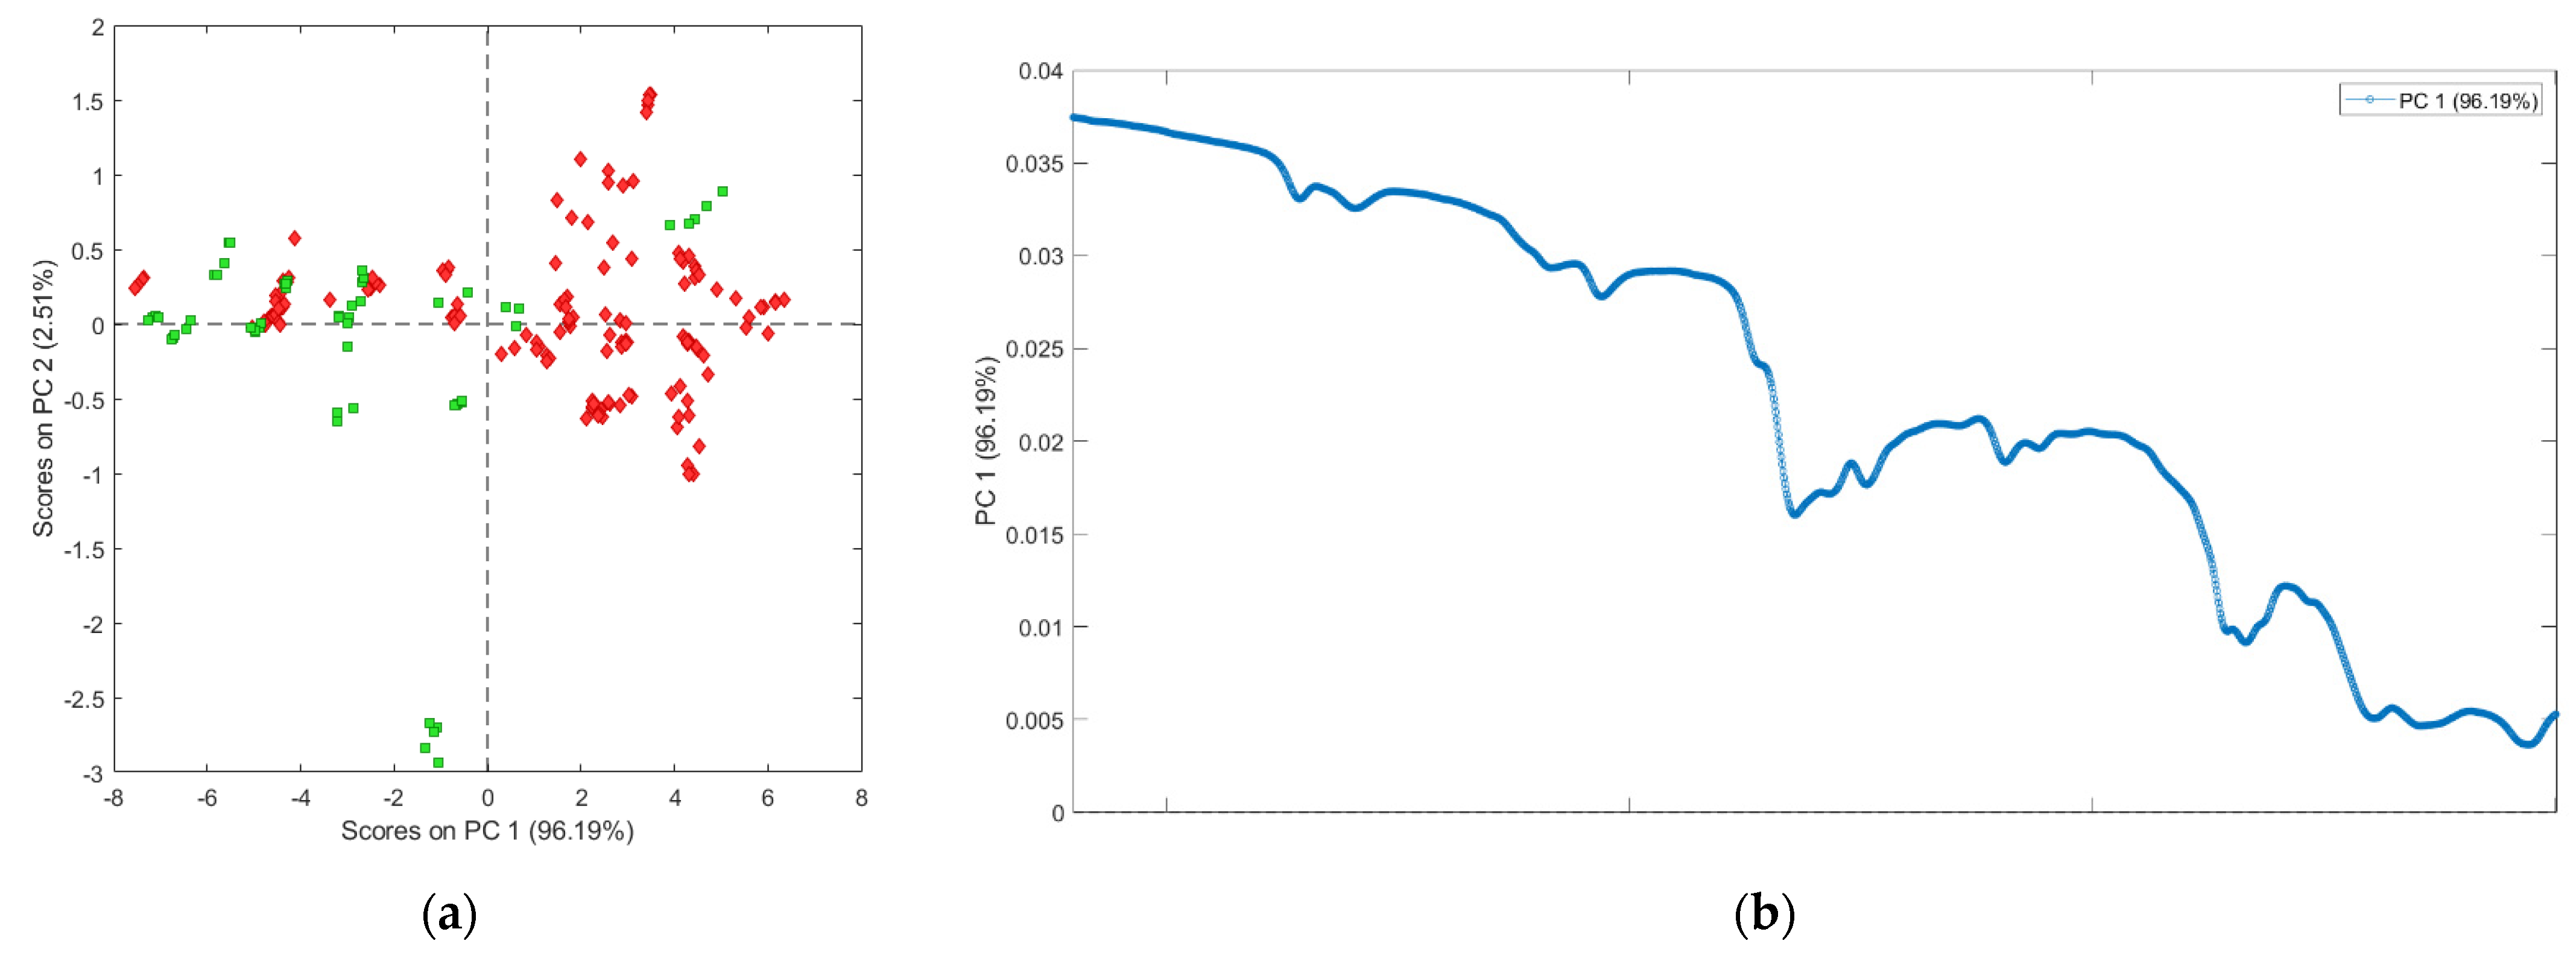
3.1. Exploratory Analysis

3.1.1. XRF Bromine Measurements

The XRF analysis of the 42 plastic scraps (Br content = 49,492 ± 38,780 mg/kg) highlighted that about 66% of the analyzed samples are characterized by a high Br content, while the remaining 34% present a low Br content according to the Br concentration limit of 2000 mg/kg suggested by the technical specification CENELEC CLC/TS 50625-3-1 [11] (Figure 2). The Br content, measured by the XRF spectrometry of the analyzed plastic scraps, ranges from 3 to 123,100 ± 30 mg/kg.

3.1.2. Reflectance Spectra Analysis

Figure 3 shows raw and pre-processed reflectance spectra averaged by Br content classes. Greater spectral differences can be seen around 1600–1700 nm and 2100–2200 nm. These differences are most likely due to the CH 1st overtone region and NH/OH in the combination-band region. In more detail, these differences may arise from the different composition of the analyzed plastic scraps included in the two bromine classes (i.e., presence/absence of acrylonitrile butadiene styrene and polystyrene). Furthermore, the reflectance spectra of “High Br content” samples show an additional absorption peak around 1400–1500 nm, which is most likely caused by the CH 1st overtone combination region [44]. According to previous investigations, this peak can be attributed to the presence of TBBPA (tetrabromobisphenol A) [32].
The score plot of the performed PCAs, as reported in Figure 4a, shows that the classes of Br content are clustered according to the first PC. The first PC explains a variance equal to 96.19%. High content class scores are mainly clustered in the positive space of PC 1, while most of the Br low content class scores can be found in the negative space of scores on PC 1. As shown in the loading plot in Figure 4b, high content class scores are more influenced by the spectral range spanning from 900–1600 nm, corresponding to the range of the loadings that have higher values.

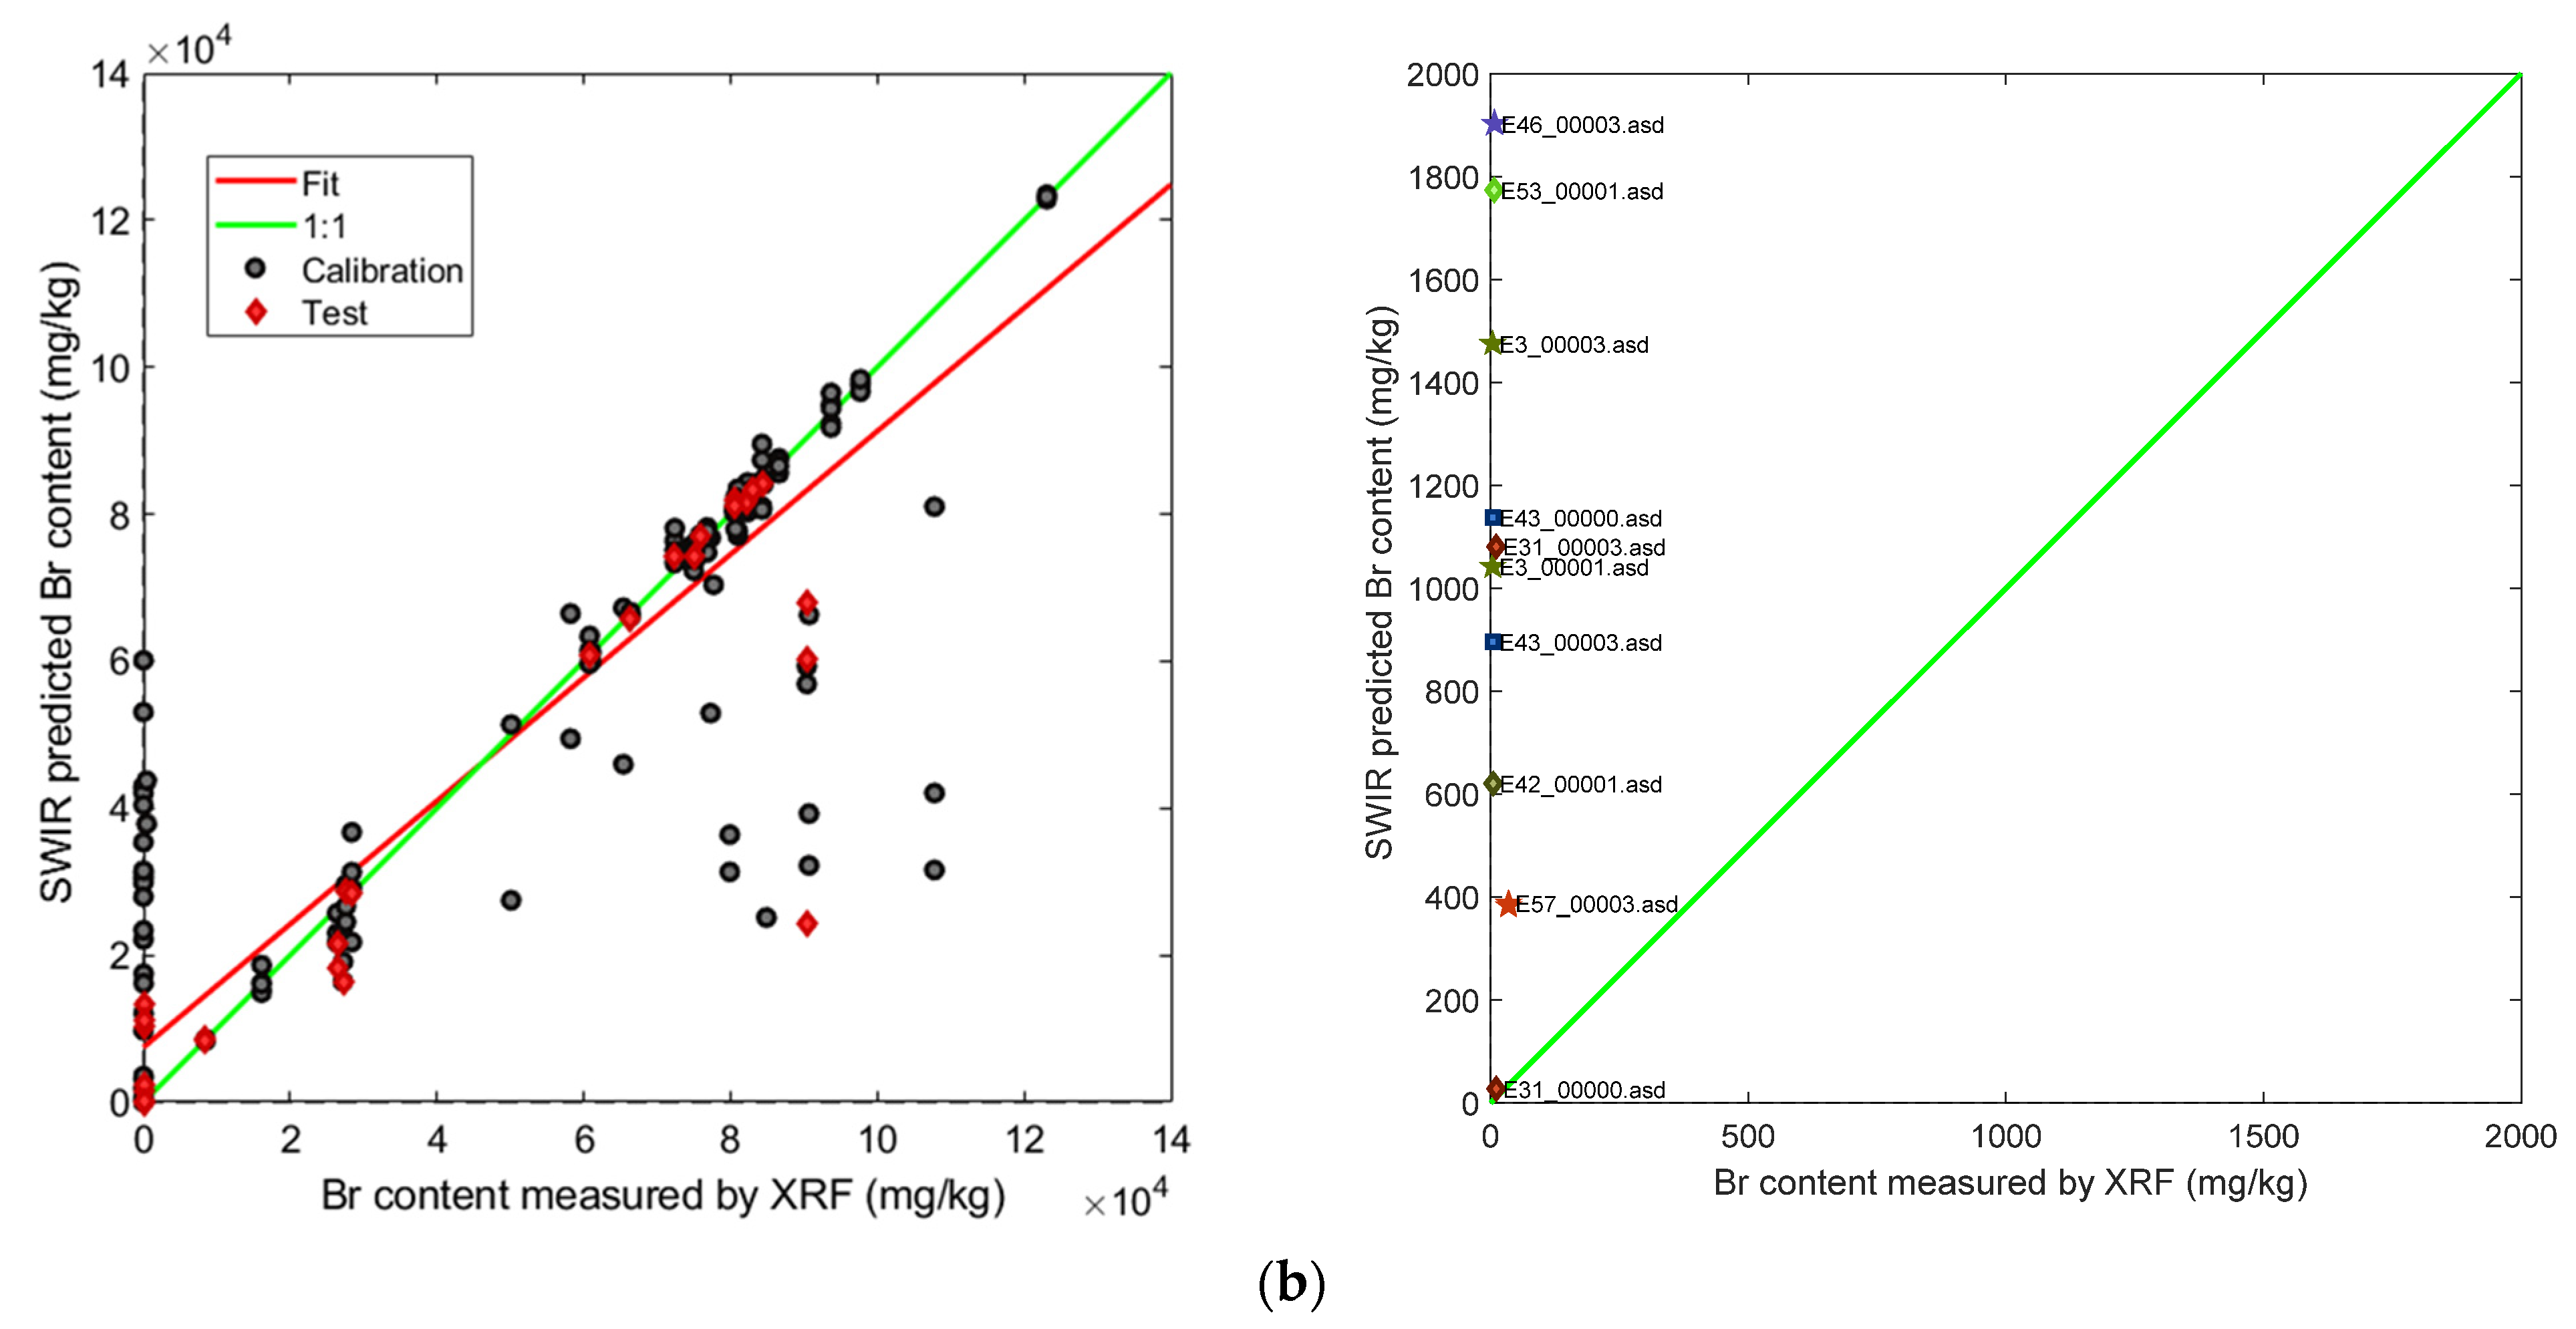
3.1.3. Regression Analysis

The PLSR method reached a coefficient of determination (Rp2) of about 0.5 and a RMSEP equal to 27,025 ppm of Br, while a better Rp2 of about 0.9 is achieved using the LWPLSR, with a smaller root mean square error of prediction (RMSEP) of about 13,399 ppm of Br. The regression plots referred to Br content from SWIR reflectance spectra are shown in Figure 5, while the regression results are reported in Table 1.

4. Conclusions

A new sustainable approach based on SWIR spectroscopy coupled with chemometric methods was investigated in order to detect Br content inside plastic scraps. SWIR spectroscopy is a non-destructive, non-invasive, and sustainable technology, which allows a fast and accurate analysis of the spectral characteristics of the analyzed samples. This technique is sustainable as it does not emit radiation dangerous to humans and does not require a preparation phase of the samples. In addition, SWIR devices are much less expensive than portable XRF spectrometers. This portable instrumentation, if properly calibrated for the quantification of bromine in plastics, can be adopted directly in treatment plants. This methodology can be seen as a tool to maximize the polymer recyclable fractions, removing those containing toxic substances (i.e., Br), thus reducing pollution, toxic emissions, landfill, and contributing to the mitigation of climate change effects, specifically addressing such Sustainable Development Goals (SDGs) as SDG 9 (Industry, Innovation and Infrastructure), SDG 12 (Responsible Consumption and Production, SDG 13 (Climate Action), SDG 14 (Life Below Water), and SDG 15 (Life on Land). The application of SWIR (shortwave infrared) spectroscopy on brominated plastic scraps, if systematically and fully implemented, could provide interesting scenarios to develop detection architectures, working both off- and on-line, finalized to recognize plastic waste elements, fed and/or resulting from the recycling process, according to their Br content. Such architectures could represent the analytical core to perform quality control on products and byproducts, thus allowing the robust and reliable production of quality secondary raw materials.

Author Contributions

Conceptualization, G.B., S.S. and P.H.; methodology, L.F. and R.G.; software, L.F. and R.G.; validation, G.B., L.F., R.G., P.H. and S.S.; formal analysis, L.F., R.G. and P.H.; investigation, G.B., L.F., R.G., P.H. and S.S.; resources, G.B., S.S. and P.H.; data curation, L.F., R.G. and P.H.; writing—original draft preparation, L.F. and R.G.; writing—review and editing, G.B., P.H. and S.S.; visualization, G.B. and S.S.; supervision, G.B. and S.S. All authors have read and agreed to the published version of the manuscript.

Funding

This research received no external funding.

Data Availability Statement

The data presented in this study are available on request from the corresponding authors.

Acknowledgments

The authors wish to thank Galloo Plastics SA (Halluin, France) to have provided all the samples utilized in this study and for the profitable discussions.

Conflicts of Interest

The authors declare no conflict of interest.

References

  1. Plastics Europe, 2019. Plastics—THE FACTS 2019. An Analysis of European Plastics Production, Demand and Waste Data. 2019. Available online: https://plasticseurope.org/wp-content/uploads/2021/10/2019-Plastics-the-facts.pdf (accessed on 16 December 2020).
  2. Otsuki, A.; de La Mensbruge, L.; King, A.; Serranti, S.; Fiore, L.; Bonifazi, G. Non-destructive characterization of mechanically processed waste printed circuit boards-particle liberation analysis. Waste Manag. 2020, 102, 510–519. [Google Scholar] [CrossRef] [PubMed]
  3. Grigorescu, R.M.; Grigore, M.E.; Iancu, L.; Ghioca, P.; Ion, R.-M. Waste electrical and electronic equipment: A review on the identification methods for polymeric materials. Recycling 2019, 4, 32. [Google Scholar] [CrossRef] [Green Version]
  4. Cui, J.; Forssberg, E. Mechanical recycling of waste electric and electronic equipment: A review. J. Hazard. Mater. 2003, 99, 243–263. [Google Scholar] [CrossRef] [PubMed]
  5. Kukharchyk, T.; Přibylová, P.; Chernyuk, V. Polybrominated diphenyl ethers in plastic waste of electrical and electronic equipment: A case study in Belarus. Environ. Sci. Pollut. Res. 2020, 27, 32116–32123. [Google Scholar] [CrossRef]
  6. EC. Directive (EU) 2017/2102 of the European Parliament and of the Council of 15 November 2017 amending Directive 2011/65/EU on the restriction of the use of certain hazardous substances in electrical and electronic equipment. Off. J. Eur. Union 2017, 305, 8–11. Available online: http://data.europa.eu/eli/dir/2017/2102/oj (accessed on 11 December 2020).
  7. Alaee, M.; Arias, P.; Sjödin, A.; Bergman, Å. An overview of commercially used brominated flame retardants, their applications, their use patterns in different countries/regions and possible modes of release. Environ. Int. 2003, 29, 683–689. [Google Scholar] [CrossRef]
  8. Malliari, E.; Kalantzi, O.-I. Children’s exposure to brominated flame retardants in indoor environments-a review. Environ. Int. 2017, 108, 146–169. [Google Scholar] [CrossRef]
  9. Ma, C.; Yu, J.; Wang, B.; Song, Z.; Xiang, J.; Hu, S.; Su, S.; Sun, L. Chemical recycling of brominated flame retarded plastics from e-waste for clean fuels production: A review. Renew. Sustain. Energy Rev. 2016, 61, 433–450. [Google Scholar] [CrossRef]
  10. Delva, L.; Hubo, S.; Cardon, L.; Ragaert, K. On the role of flame retardants in mechanical recycling of solid plastic waste. Waste Manag. 2018, 82, 198–206. [Google Scholar] [CrossRef]
  11. CENELEC CLC/TS 50625-3-1; In Requirements for Collection, Logistics and Processing for Waste Electrical and Electronic Equipment (WEEE)—Part 3–1: Specifications for Depollution. CENELEC: Brussels, Belgium, 2015.
  12. UNEP. Guidance on Best Available Techniques and Best Environmental Practices for the Recycling and Waste Disposal of Articles Containing Polybrominated Diphenyl Ethers (PBDEs) Listed under the Stockholm Convention; UNEP: Nairobi, Kenya, 2017. [Google Scholar]
  13. Hennebert, P.; Filella, M. WEEE plastic sorting for bromine essential to enforce EU regulation. Waste Manag. 2018, 71, 390–399. [Google Scholar] [CrossRef]
  14. Fh–ICT. High Quality Plastic Materials from Electronic Wastes by use of Combined Identification Methods and New Handling Technologies. In COMBIDENT Final Technical Report, EU Contract No BRPR–CT98–0778; Fraunhofer–Institut für Chemische Technologie: Pfinztal, Germany, 2001. [Google Scholar]
  15. Masoumi, H.; Safavi, S.M.; Khani, Z. Identification and classification of plastic resins using near infrared reflectance. Int. J. Mech. Ind. Eng 2012, 6, 213–220. [Google Scholar]
  16. Eisenreich, N.; Rohe, T. Infrared spectroscopy in analysis of plastics recycling. In Encyclopedia of Analytical Chemistry: Applications, Theory and Instrumentation; John Wiley & Sons, Ltd.: Hoboken, NJ, USA, 2006. [Google Scholar]
  17. Angelin, E.M.; de Sá, S.F.; Soares, I.; Callapez, M.E.; Ferreira, J.L.; Melo, M.J.; Bacci, M.; Picollo, M. Application of Infrared Reflectance Spectroscopy on Plastics in Cultural Heritage Collections: A Comparative Assessment of Two Portable Mid-Fourier Transform Infrared Reflection Devices. Appl. Spectrosc. 2021, 75, 818–833. [Google Scholar] [CrossRef]
  18. Catelli, E.; Sciutto, G.; Prati, S.; Chavez Lozano, M.V.; Gatti, L.; Lugli, F.; Silvestrini, S.; Benazzi, S.; Genorini, E.; Mazzeo, R. A new miniaturised short-wave infrared (SWIR) spectrometer for on-site cultural heritage investigations. Talanta 2020, 218, 121112. [Google Scholar] [CrossRef]
  19. Kumaravelu, C.; Gopal, A. A review on the applications of Near-Infrared spectrometer and Chemometrics for the agro-food processing industries. In Proceedings of the 2015 IEEE Technological Innovation in ICT for Agriculture and Rural Development (TIAR), Chennai, India, 10–12 July 2015; pp. 8–12. [Google Scholar]
  20. Bonifazi, G.; Capobianco, G.; Gasbarrone, R.; Serranti, S. Cold Chain Maintenance Evaluation of Pre-Cooked Pasta by Visible and Short Wave InfraRed Spectroscopy. In Proceedings of the 2021 International Conference on Electrical, Communication, and Computer Engineering (ICECCE), Kuala Lumpur, Malaysia, 12–13 June 2021; pp. 1–6. [Google Scholar]
  21. Cortés, V.; Blasco, J.; Aleixos, N.; Cubero, S.; Talens, P. Monitoring strategies for quality control of agricultural products using visible and near-infrared spectroscopy: A review. Trends Food Sci. Technol. 2019, 85, 138–148. [Google Scholar] [CrossRef]
  22. Bonifazi, G.; Gasbarrone, R.; Serranti, S. Detection of Olive Fruits Attacked by Olive Fruit Flies Using Visible-Short Wave Infrared Spectroscopy; SPIE: Bellingham, WA, USA, 2021; Volume 11693. [Google Scholar]
  23. Ozaki, Y. Near-infrared spectroscopy—Its versatility in analytical chemistry. Anal. Sci. 2012, 28, 545–563. [Google Scholar] [CrossRef] [Green Version]
  24. Currà, A.; Gasbarrone, R.; Bonifazi, G.; Serranti, S.; Fattapposta, F.; Trompetto, C.; Marinelli, L.; Missori, P.; Lendaro, E. Near-Infrared Transflectance Spectroscopy Discriminates Solutions Containing Two Commercial Formulations of Botulinum Toxin Type A Diluted at Recommended Volumes for Clinical Reconstitution. Biosensors 2022, 12, 216. [Google Scholar] [CrossRef] [PubMed]
  25. Luypaert, J.; Massart, D.; Vander Heyden, Y. Near-infrared spectroscopy applications in pharmaceutical analysis. Talanta 2007, 72, 865–883. [Google Scholar] [CrossRef] [PubMed]
  26. Currà, A.; Gasbarrone, R.; Cardillo, A.; Fattapposta, F.; Missori, P.; Marinelli, L.; Bonifazi, G.; Serranti, S.; Trompetto, C. In vivo non-invasive near-infrared spectroscopy distinguishes normal, post-stroke, and botulinum toxin treated human muscles. Sci. Rep. 2021, 11, 17631. [Google Scholar] [CrossRef]
  27. Heise, H.M. Medical applications of NIR spectroscopy. In Near-Infrared Spectroscopy; Springer: Berlin/Heidelberg, Germany, 2021; pp. 437–473. [Google Scholar]
  28. Pasquini, C. Near infrared spectroscopy: Fundamentals, practical aspects and analytical applications. J. Braz. Chem. Soc. 2003, 14, 198–219. [Google Scholar] [CrossRef] [Green Version]
  29. Bonifazi, G.; Gasbarrone, R.; Palmieri, R.; Serranti, S. End-of-Life Textile Recognition in a Circular Economy Perspective: A Methodological Approach Based on Near Infrared Spectroscopy. Sustainability 2022, 14, 10249. [Google Scholar] [CrossRef]
  30. Caballero, D.; Bevilacqua, M.; Amigo, J.M. Application of hyperspectral imaging and chemometrics for classifying plastics with brominated flame retardants. J. Spectr. Imaging 2019, 8, a1. [Google Scholar] [CrossRef] [Green Version]
  31. Bonifazi, G.; Fiore, L.; Hennebert, P.; Serranti, S. An efficient strategy based on hyperspectral imaging for brominated plastic waste sorting in a circular economy perspective. In Advances in Polymer Processing 2020; Springer: Berlin/Heidelberg, Germany, 2020; pp. 14–27. [Google Scholar]
  32. Bonifazi, G.; Fiore, L.; Gasbarrone, R.; Hennebert, P.; Serranti, S. Detection of Brominated Plastics from E-Waste by Short-Wave Infrared Spectroscopy. Recycling 2021, 6, 54. [Google Scholar] [CrossRef]
  33. Bonifazi, G.; Fiore, L.; Hennebert, P.; Serranti, S. Development of a selection system based on hyperspectral imaging for plastic waste with brominated flame retardants. Environ. Eng. Manag. J. (EEMJ) 2020, 19, 1755–1763. [Google Scholar]
  34. ASD Inc. FieldSpec® 4 User Manual; ASD Document 600979; ASD Inc.: Boulder, CO, USA, 2015. [Google Scholar]
  35. ASD Inc. RS3™ User Manual; ASD Document 600545. Rev. E; ASD Inc.: Boulder, CO, USA, 2008. [Google Scholar]
  36. Danner, M.; Locherer, M.; Hank, T.; Richter, K. Spectral Sampling with the ASD FieldSpec 4—Theory, Measurement, Problems, Interpretation. EnMAP Field Guide’s Technical Report, GFZ Data Services 2015. Available online: https://gfzpublic.gfz-potsdam.de/rest/items/item_1388298/component/file_1388299/content (accessed on 1 December 2022).
  37. Sjöblom, J.; Svensson, O.; Josefson, M.; Kullberg, H.; Wold, S. An evaluation of orthogonal signal correction applied to calibration transfer of near infrared spectra. Chemom. Intell. Lab. Syst. 1998, 44, 229–244. [Google Scholar] [CrossRef]
  38. Rinnan, Å.; Van Den Berg, F.; Engelsen, S.B. Review of the most common pre-processing techniques for near-infrared spectra. TrAC Trends Anal. Chem. 2009, 28, 1201–1222. [Google Scholar] [CrossRef]
  39. Wold, S.; Esbensen, K.; Geladi, P. Principal component analysis. Chemom. Intell. Lab. Syst. 1987, 2, 37–52. [Google Scholar] [CrossRef]
  40. Wold, S.; Sjöström, M.; Eriksson, L. PLS-regression: A basic tool of chemometrics. Chemom. Intell. Lab. Syst. 2001, 58, 109–130. [Google Scholar] [CrossRef]
  41. Abdi, H. Partial least square regression (PLS regression). Encycl. Res. Methods Soc. Sci. 2003, 6, 792–795. [Google Scholar]
  42. Hazama, K.; Kano, M. Covariance-based locally weighted partial least squares for high-performance adaptive modeling. Chemom. Intell. Lab. Syst. 2015, 146, 55–62. [Google Scholar] [CrossRef] [Green Version]
  43. Lesnoff, M.; Metz, M.; Roger, J.M. Comparison of locally weighted PLS strategies for regression and discrimination on agronomic NIR data. J. Chemom. 2020, 34, e3209. [Google Scholar] [CrossRef]
  44. Stuart, B.H. Infrared Spectroscopy: Fundamentals and Applications; John Wiley & Sons: Hoboken, NJ, USA, 2004. [Google Scholar]
Figure 1. Analyzed e-waste plastic scraps. Labelling was assigned to identify each scrap preliminary characterized by XRF and then tested by SWIR spectroscopy.
Environments 09 00152 g001
Figure 2. Bromine content measured by XRF of each analyzed sample. (*) Br concentration limit according to CENELEC CLC/TS 50625-3-1 [11].
Environments 09 00152 g002
Figure 3. Mean raw (a) and pre-processed (b) reflectance spectra according to Br content classes.
Environments 09 00152 g003
Figure 4. PCA score plot of the first two principal components (a), according to bromine content and loadings plot of the first principal component (b).
Environments 09 00152 g004
Figure 5. The partial least squares regression (PLSR) (a) and the locally weighted partial least squared regression (LWPLSR) (b) for bromine content from SWIR reflectance spectra. Plots on the left represents the results in prediction of the regression models in the range of Br content from 0 to 14 × 104 mg/kg. Plots on the right are a graphical representation of the calibrated regression scores in the range of Br content from 0 to 2000 mg/kg, the latter value corresponds to the Br concentration limit defined in the technical specification CENELEC CLC/TS 50625-3-1 [11].
Environments 09 00152 g005aEnvironments 09 00152 g005b
Table 1. The partial least squares regression (PLSR) and the locally weighted partial least squared regression (LWPLSR) results for bromine content from SWIR reflectance spectra.
Statistical ParametersRegression
PLSRLWPLSR
RMSEC
Root Mean Square Error of Calibration
19,65316,239
RMSECV
Root Mean Square Error of Cross-Validation
22,64246,337
RMSEP
Root Mean Square Error of Prediction
27,02513,399
Calibration Bias1.455 × 10−11213
Cross-validation Bias219−2492
Prediction Bias−953−3302
R C 2 0.7360.828
R CV 2 0.6500.343
R P 2 0.4840.877
Publisher’s Note: MDPI stays neutral with regard to jurisdictional claims in published maps and institutional affiliations.

