1. Introduction
Benchmarks are set by many educational sectors to report energy consumption to communicate their performances. For example, typical energy consumption benchmarks for 320 educational buildings in Europe were reported to be 87 kWh/m
2 in Greece, 197 kWh/m
2 in Flanders, and 119 kWh/m
2 in Northern Ireland [
1]. In the UK and Wales, educational buildings were found to be the most homogenous among all the non-domestic buildings, with a median of 46 kWh/m
2 for schools and 74 kWh/m
2 for HEIs [
2]. Hernandez et al. (2008) benchmarked 88 non-domestic educational buildings in Ireland and ranked their performance in seven classes from (A–G) based on their energy performances [
1]. Water benchmarks in educational buildings are less common than energy. The US educational buildings consume around 6% of the public sector’s water usage, e.g., water consumption in nine large educational buildings is about 133 million m
3 per year which is equivalent to 0.595 m
3/m
2 [
3]. Water is less monitored as it has been reported that university buildings do not report water consumption per building for most of their buildings [
4]. Alghamdi et al. (2020) benchmarked water consumption in 71 academic buildings and reported that water usage intensity (water used per area) for 50th and 75th percentile are 0.85 m
3/m
2 and 1.26 m
3/m
2 [
5] in Canadian HEIs. Water may be involved directly and indirectly in generating electricity and consequently a factor in emitting GHG emissions. For example, water is directly involved in hydroelectric power plants and indirectly involved in thermal power plants, where steam is used in rotating turbines and water is used in cooling the steam [
6]. Furthermore, due to the thermo-physical properties, water may be used as a thermally bonding agent to transfer energy in geothermal plants. Energy usage directly produces GHG emissions because of the combustion of fuels (e.g., natural gas) and upstream processes (e.g., reservoirs and transportation) in hydroelectricity. Therefore, when benchmarking GHG emissions, it is necessary to specify the types of energy use to determine the actual impact of an HEI on its environment.
Sustainability assessment is a challenging task, due to its inter-disciplinary nature [
7]. Many of the reporting systems and theories carry inherent uncertainties. Gasparatoes et al. (2008) carried out a critical review of sustainability assessment tools and methodologies and concluded that none of the metrics reviewed seem to assess progress towards sustainability in a holistic manner [
8]. The tools reviewed include the biophysical models and indicator-based reporting systems, such as the exergy (maximum potential work attainable), energy (total direct and indirect energy available required to make a service or a product), and sustainability indicators (SI) have underlying uncertainties [
8]. These indicators are aggregated to deliver a judgment rank of sustainability heavily influenced by the weights of indicators [
9].
Building rating tools, such as the Leadership in Energy and Environmental Design (LEED) certifications, are among the tools that carry significant uncertainties. Agdas et al. (2015) assessed the energy performance of 10 LEED certified academic buildings and 14 non-LEED buildings at the University of Florida. They concluded that no statistically significant differences between the two types of buildings. In fact, the energy usage intensity (EUI) is slightly higher in LEED classified buildings than those not certified [
10]. Reporting is needed to communicate sustainability, and to do this, the uncertainties associated with the ranks, judgment, and data limitations, need to be addressed for more accurate assessment outcomes [
11]. It was also reported that some HEIs, such as the University of Alberta, received a gold rating in the Sustainability Tracking, Assessment, and Reporting System (STARS), even though it has reported a substantial increase in GHG emissions over the years [
5].
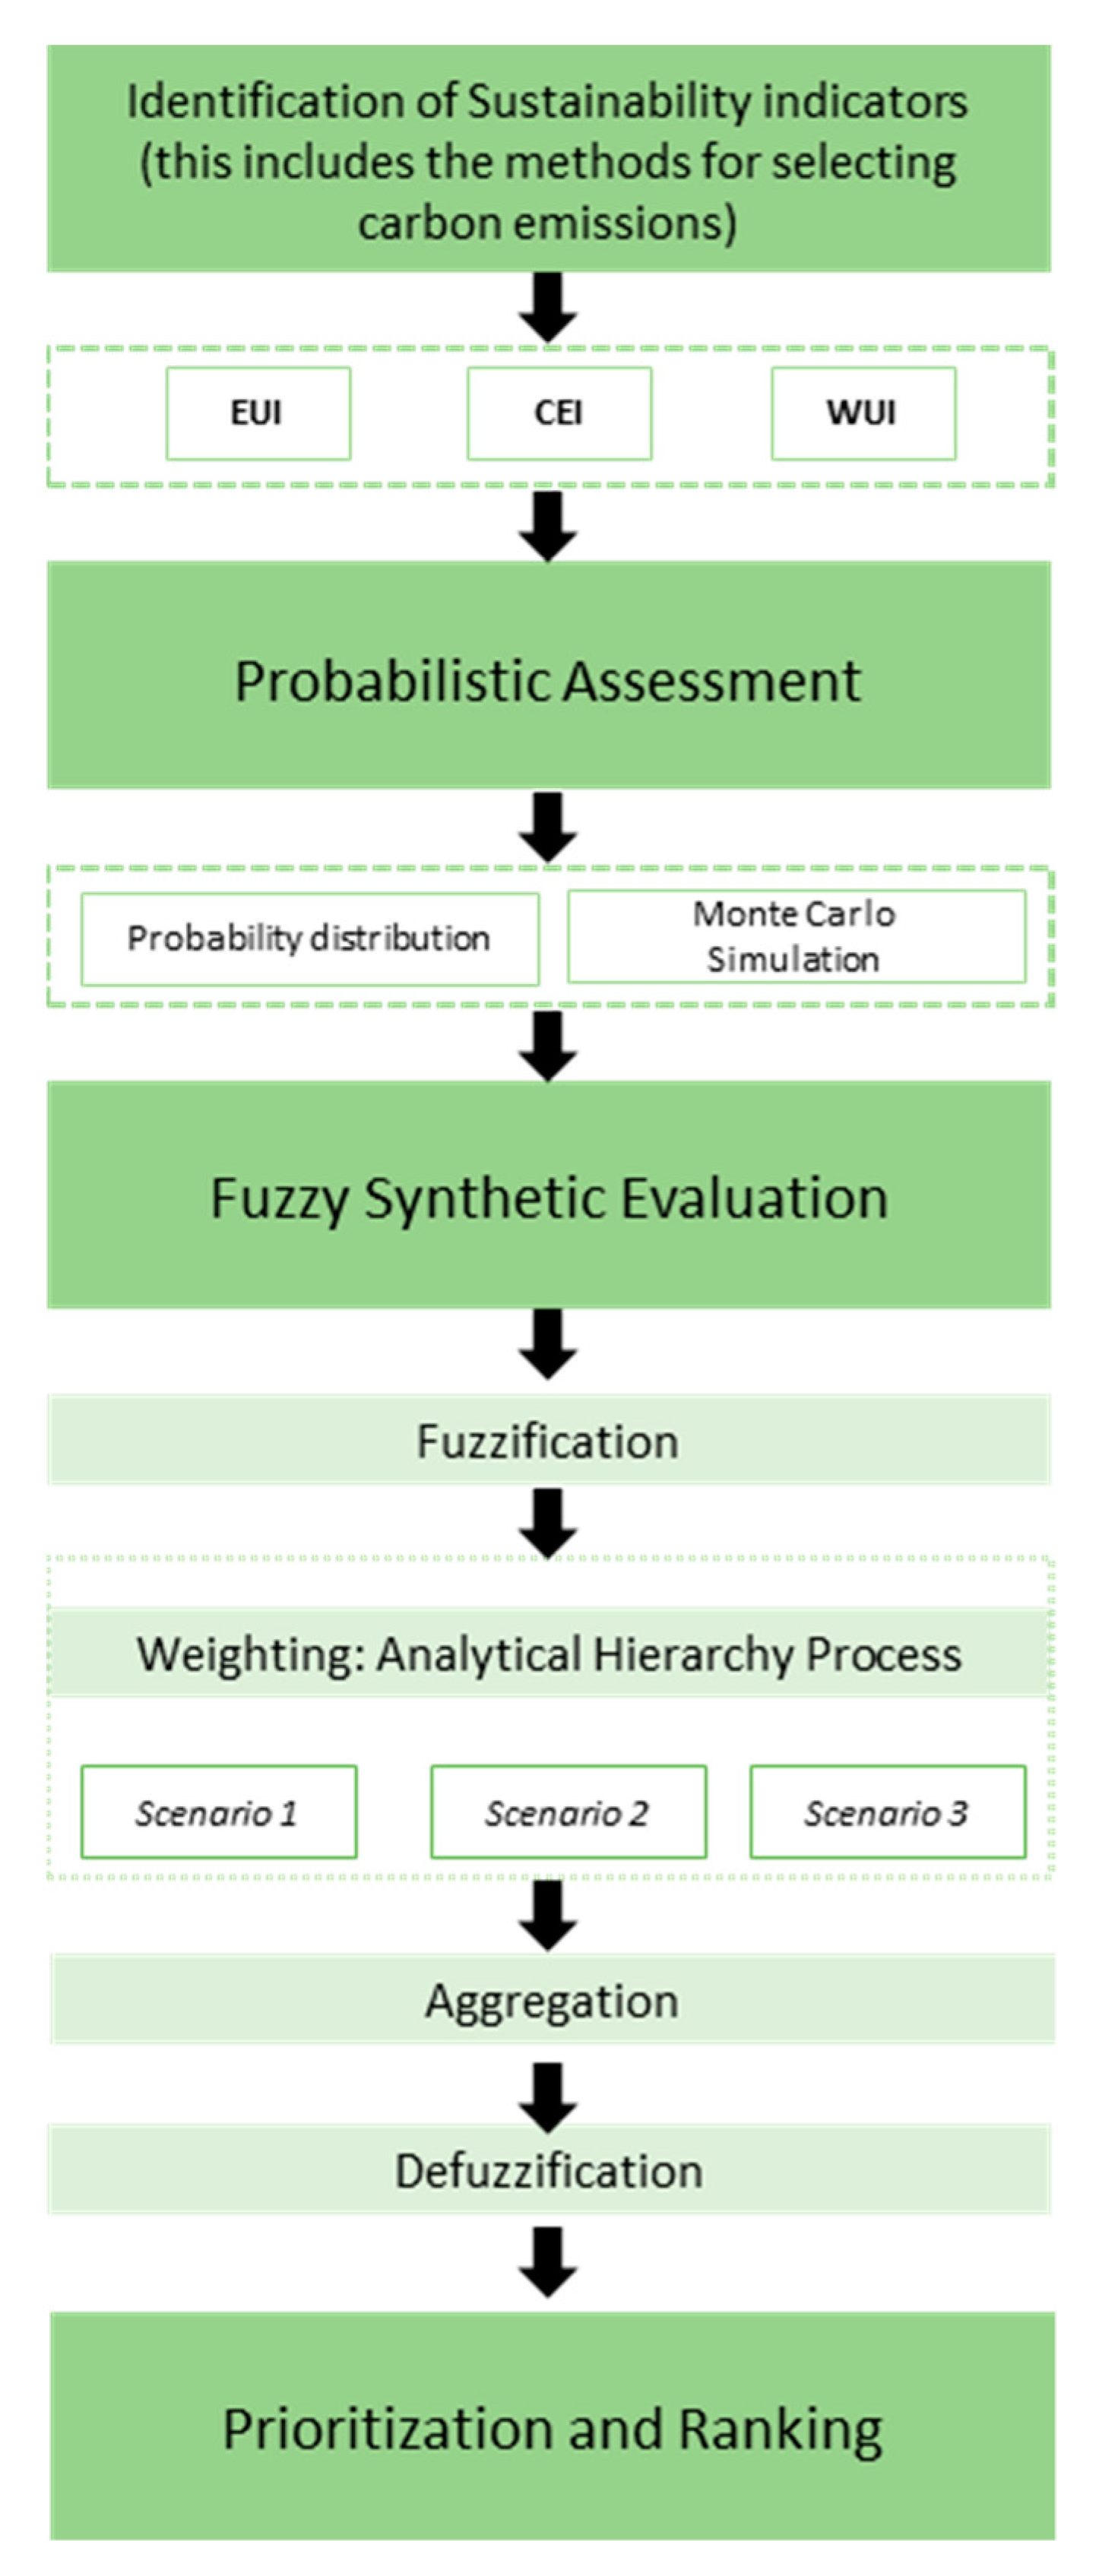
There are two types of uncertainties in reporting sustainability assessment results: Aleatory and epistemic uncertainties [
12]. The aleatory uncertainties are generated from the random variation of data and are addressed using probabilistic techniques, such as Monte Carlo simulations, and the epistemic uncertainties are due to the lack of the knowledge vagueness that is a result of using linguistic scoring systems, such as rankings like Gold, Silver, or LEED-certified, and so on [
13]. The vagueness of linguistic variables can be addressed using fuzzy set-based techniques [
14]. These reporting systems aggregate the scores of indices and provide an overall rating—for instance, the STARS reporting system awards a HEIs a Bronze if the minimum score is 25, silver is below 45, and so on. Credits in the reporting systems cover the full spectrum of sustainability, and the reporting system has bonus scores for some criteria. Some of the credits assessed did not apply to all HEIs [
15]. In addition to these uncertainties, the uncertainties associated with occupants’ energy use behaviors in educational buildings are another type of challenge in emission reduction [
16].
Despite the significant environmental impacts posed by HEIs, this sector has the least amount of data available for performance assessment [
17]. The data gap becomes a significant obstacle in communicating, planning, monitoring, verifying, and even managing the WEC flows. This may be due to the limited technical and financial resources HEIs possess, specifically in small to medium-sized universities [
18]. The data gap will lead to uncertainty in the results. Fuzzy techniques have been applied in assessing the sustainability of academic buildings. Alghamdi et al. (2020) assessed singe yearly averages performances of 71 academic buildings in two campuses in two different climatic regions of British Columbia, Canada using fuzzy clustering analysis [
5]. Santamouris (2007) used fuzzy clustering techniques to address the uncertainty related to classification in energy benchmarks in schools in Greece [
19]. Chung (2006) used fuzzy linear regression to classify and benchmark commercial buildings [
20]. Haider et al. (2018) used fuzzy synthetic evaluation to assess sustainability in a small neighborhood [
14]. A combination of probabilistic and fuzzy synthetic evaluation has been reported in other risk assessment studies [
12,
21,
22]. These studies assessed the performance of HEIs building using averages of singular years without addressing random uncertainties. A rigorous data collection effort is needed to assess the performance of HEIs over several years. The past studies provided a point-based evaluation in a single year and did not include variability of climatic or occupant trends. Furthermore, these studies did not address the volatility, uncertainty, complexity, and ambiguity (VUCA) in current benchmarking techniques [
23].
2. Background
The United Nations Paris Agreement set an ambitious goal to keep global temperature rise within 1.5 °C by 2030 to restrict signatory parties from increasing the release of (GHG) [
24]. Today, the curb on emissions is facing daunting challenges [
25]. The agreement called upon nations to reduce their GHG emissions by committing to an intended nationally determined contributions (INDC), which are unilateral pledges made by the countries, collectively and individually, to reduce their overall GHG emissions [
26]. These INDC targets that once seem attainable are now pushed further to 2040, 2050, and beyond. The agreement has not been a successful model for implementing measurable changes to reduce anthropogenic GHG emissions [
27]. To overcome the challenges associated with the agreement, reporting mechanisms have been put under review. Some researchers proposed methods to overcome certain socio-economic challenges imposed by the agreement; for instance, Liu et al. (2017) proposed a metabolic capitalized assessment of emissions through a sectorial full-supply chain [
28]. Although similar proposals may be viewed as a reductionist approach (i.e., to view sustainability from a single dimension) to sustainability, they underlay a set of considerations in people’s opinions and judgment. They are also an important attempt to improve the current mechanisms of decision making in the process [
8].
Buildings consume large amounts of primary and secondary sources of energy. Electricity and heat generation are the largest contributors to GHG emissions and are the most challenging to address. As of 2018, this sector was responsible for nearly 43% of the global GHG emissions, followed by the use of transportation, industry, residential, commercial, public service sectors [
29]. The building sector in the united states accounts for 76% of the electricity usage and nearly 40% of the primary energy and associated GHG emissions [
30]. In Greece, the building sector consumes 36% of the country’s energy consumption [
31]. Energy consumption of non-domestic buildings accounts for nearly 24% of the total energy consumption in China [
32]. In addition to the significant usage of energy, the growth in energy consumption in the building sector is estimated to rise by 50% in the next three decades [
17]. As a result of high energy usage, buildings are responsible for more than a third of the total GHG emissions globally [
33]. In the UK, building energy generation accounts for 19% of the UK’s emissions [
34]. The Canadian building sector is the third-largest GHG emitting source, responsible for 12% of the nation’s total emissions [
35]. Buildings emit most of the emissions during the operational phase of their life cycle [
36]. Furthermore, the growth in GHG emissions from the building sector resulting from the increased energy consumption is alarming. For instance, Greece’s GHG emissions growth is at 4% per annum [
31].
In Canada, educational buildings are grouped under the nation’s largest category, the commercial and institutional sector (C&I). This sector consumes 12% of the nation’s entire energy and is responsible for 11% of the nation’s emissions [
37]. Educational buildings are significant emission contributors, due to their high energy consumption [
38]. The operational buildings in HEIs consume a vast amount of energy to generate flows that are crucial to meet the requirements of the livable indoor environment. As a result, these buildings produce a significant amount of GHG emissions onsite. They are also responsible for harmful impacts on the environment, such as water resource depletion. Brown and Southworth (2008) reported that buildings are responsible for 43% of the GHG emissions in the US [
39]. Faulconbridge (2013) reported a 70% increase in anthropogenic gases in urban areas like London than rural areas resulting from building operations [
40]. The extent of the impact of this sector is the least understood to date [
41]. A 2004 study on 351 HEIs in Canada, reported that (i) academic buildings consume 50 GJ of energy and emit nearly 2.7 MtCO
2e, (ii) universities on average consume 2.04 GJ/m
2, (iii) colleges consumed 1.48 GJ/m
2 [
42]. Furthermore, this sector heavily depends on fossil fuels for its primary and secondary energy sources, with 65% of energy is supplied by natural gas and other fuels [
42]. This is consistent with reports that indicate that HEIs in china consume 30 million tons of standard coal to meet their energy demands [
43]. Academic buildings were found to consume more energy, water, and release carbon compared to other types of buildings on campus [
5]. The educational sector in the US spends
$7.5 billion on energy in a year; this cost is among the highest expenses the educational sector bears. Due to the limited resources, HEIs face challenges in implementing operational needs, preventative maintenance, and adapt efficient interventions, which often leads to deteriorating equipment and results in high energy costs and environmental impacts [
44]. A global increase in energy costs is another challenge faced by HEIs [
17].
Water undergoes several processes depending on the nature of the water source. In BC, the typical processes are extraction, treatment, distribution, use, and disposal [
45]. Different steps involved in these processes use energy and simultaneously emit emissions into the environment. Calculating the entire emissions on the campus needs to take all these steps (all over the water lifecycle) into considerations. This interconnection between water, energy, and carbon (WEC), specifically for the irrigation water used for green areas of a university, will be referred to as the water–energy–carbon (WEC) nexus.
Have complex infrastructure that includes buildings, pumping stations, green spaces, recreational facilities, residential buildings, and operation buildings, HEIs operate like small cities [
46]. With 40% consumption of the energy devoted to the public sector, the Chinese HEIs are considered the largest emitter in the entire public sector [
47]. The HEIs in British Columbia (Canada) consume 60% of the educational sector energy [
42] of the entire province and produce 19% of the total public sector GHG emissions [
48]. Water consumption per student in China is found to double that of the average citizen in the country [
43]. In the US, educational buildings use 6% of the total public sector water usage [
49]. Several studies highlighted water, energy, and carbon challenges of HEIs: In Canada [
5], Australia [
16], UK [
50], China [
51], Spain [
52], Nigeria [
17] Saudi Arabia [
53], Poland [
54] USA [
55], Malaysia [
56], Portugal [
57], and Norway [
58].
HEIs buildings have unique characteristics compared to other types of buildings. First, the growth rates in these institutions are fairly visible. In China, the total floor area of campus buildings grew five times between 1998 and 2011 [
43]. In the UK, enrollment is found to increased 33% over a ten-year period between 1996–2005 [
59]. Second, energy assessment of HEIs is challenging, due to the uncertainties associated with the occupants’ energy use behavior [
16]. For instance, it is reported that the number of users entering and exiting a university building in an hour is equal to the maximum occupancy of those buildings [
60]. Another study reported that 92% of the occupants in a university building are visitors [
34]. Furthermore, floor area is among many prediction variables used to estimate energy consumption in HEI buildings [
61]. Due to these uncertainties, it is believed that energy demand in these buildings is the least understood among all non-domestic buildings [
62]. Finally, the energy consumption performance deteriorates with time, due to several building envelopes and HVAC units operating in HEIs [
63]. Furthermore, many HEIs buildings were constructed before energy codes were applicable [
41]. It is reported that 55% of commercial building (including HEI buildings) projects prior to the construction did not model energy in their design process, and do not adhere to any code compliance or green certification [
30]. Therefore, monitoring, reporting, and continuous improvements are needed in HEIs.
Managing the adverse impacts associated with HEIs operations is necessary, due to the intrinsic role of HEIs in leading research, fostering talent, and creating safe and livable neighborhoods [
64]. Emission estimation for educational buildings is challenging because energy demands in educational buildings are the least understood among the non-residential buildings, due to their highly variable demand behaviors [
10]. Some researchers highlighted the impact of occupancy behavior on energy consumption in buildings [
65], while others have reported that the occupancy patterns do not significantly impact energy demand [
34]. To promote energy conservation and sustainable use of energy, the European energy performance of building directive proposed reporting as means to effectively assess the institutions’ performances. For example, the UK introduced laws to increase awareness in improving a buildings’ energy performance, which require buildings to report and benchmark their energy consumption performances [
66].
Reporting carbon emissions is a legal requirement for many HEIs, due to its role in calculating the carbon taxation imposition. However, HEIs do not consider carbon sequestration as means to mitigate the carbon released from their operations. Carbon sequestration includes both biological (in the form of plantation) and mechanical (in the form of carbon capture technologies) mechanisms and calculates the amount of carbon absorbed by the trees, shrubs, turfs, and soil in a campus. It is believed that carbon sequestration to have a significant impact at the community level [
67]. A detailed carbon sequestration calculation involves both the type and area of vegetation.
Sustainability Reporting (SR) can be defined as the formal act of communicating the social, environmental, and financial performances of an organization [
68]. The primary aim of the SR is to meet the demands of industrial growth, causing minimum impacts on the environment. This definition embodies the generalized theme of sustainable development (SD) stated by the Word Commission on Environment and Development as one that “meets the needs of the present without compromising the ability of future generations to meet their own needs [
69]”. The SR has become a normative practice among HEIs to meet sustainable development goals. Many reporting systems use indicators as the primary tool to make cross-institutional comparations (i.e., benchmarking) [
53]. For instance, Martin (2005) stressed the need for developing techniques that can help in advancing SD in universities by using indicators and suggested that ecological footprint could be a useful approach for universities to report their performance [
70].
The objective of this study is to propose a framework to assess the spatiotemporal variability in the sustainability of HEIs in terms of water use, energy use, and carbon emissions, incorporating probabilistic and linguistic uncertainties. This paper also proposes a method to estimate and include carbon sequestration by HEIs’ greenery in a campus sustainability rating system for the first time.
5. Conclusions
Currently, HEIs do not have a technical benchmarking tool that can undressing the two common types of uncertainties associated with benchmarking tools. This may be a result of two factors—firstly, it can be a result of assigning impartial weights to other attributes of sustainability, namely, social and economic aspects [
5]. This is achieved through weight judgment uncertainties—as in the case by assigning a higher weight to other indicators in their reporting system, which is conveyed in a linguistic score associated with uncertainties. Secondly, this could be due to the nature of holistic systems’ inability to address specific areas in their reporting systems [
11]. This is not to undermine the importance of holistic systems in assessing multi-dimensional tasks, such as sustainability, on the contrary. Instead, this is to give attention to the set of considerations set in these options and to shed light on the need for examining the uncertainty inherent in these reporting systems. In addition, to a need to highlight more attention towards a reductionist approach to sustainability [
8].
The proposed benchmarking method with both aspects, the spatial and temporal benchmarking approaches, are shown to illustrate how these two types of benchmarking systems can address the uncertainties and their ability to underpin underlying causes that affect HEIs performance. To improve on benchmarking and communicating performance. Twenty-one temporal scenarios are proposed to cover a wide range of judgments in human perception. Which can give a better understanding of the individual underperformer and the set of themes (i.e., climatic factors) that highly affect the university performance.
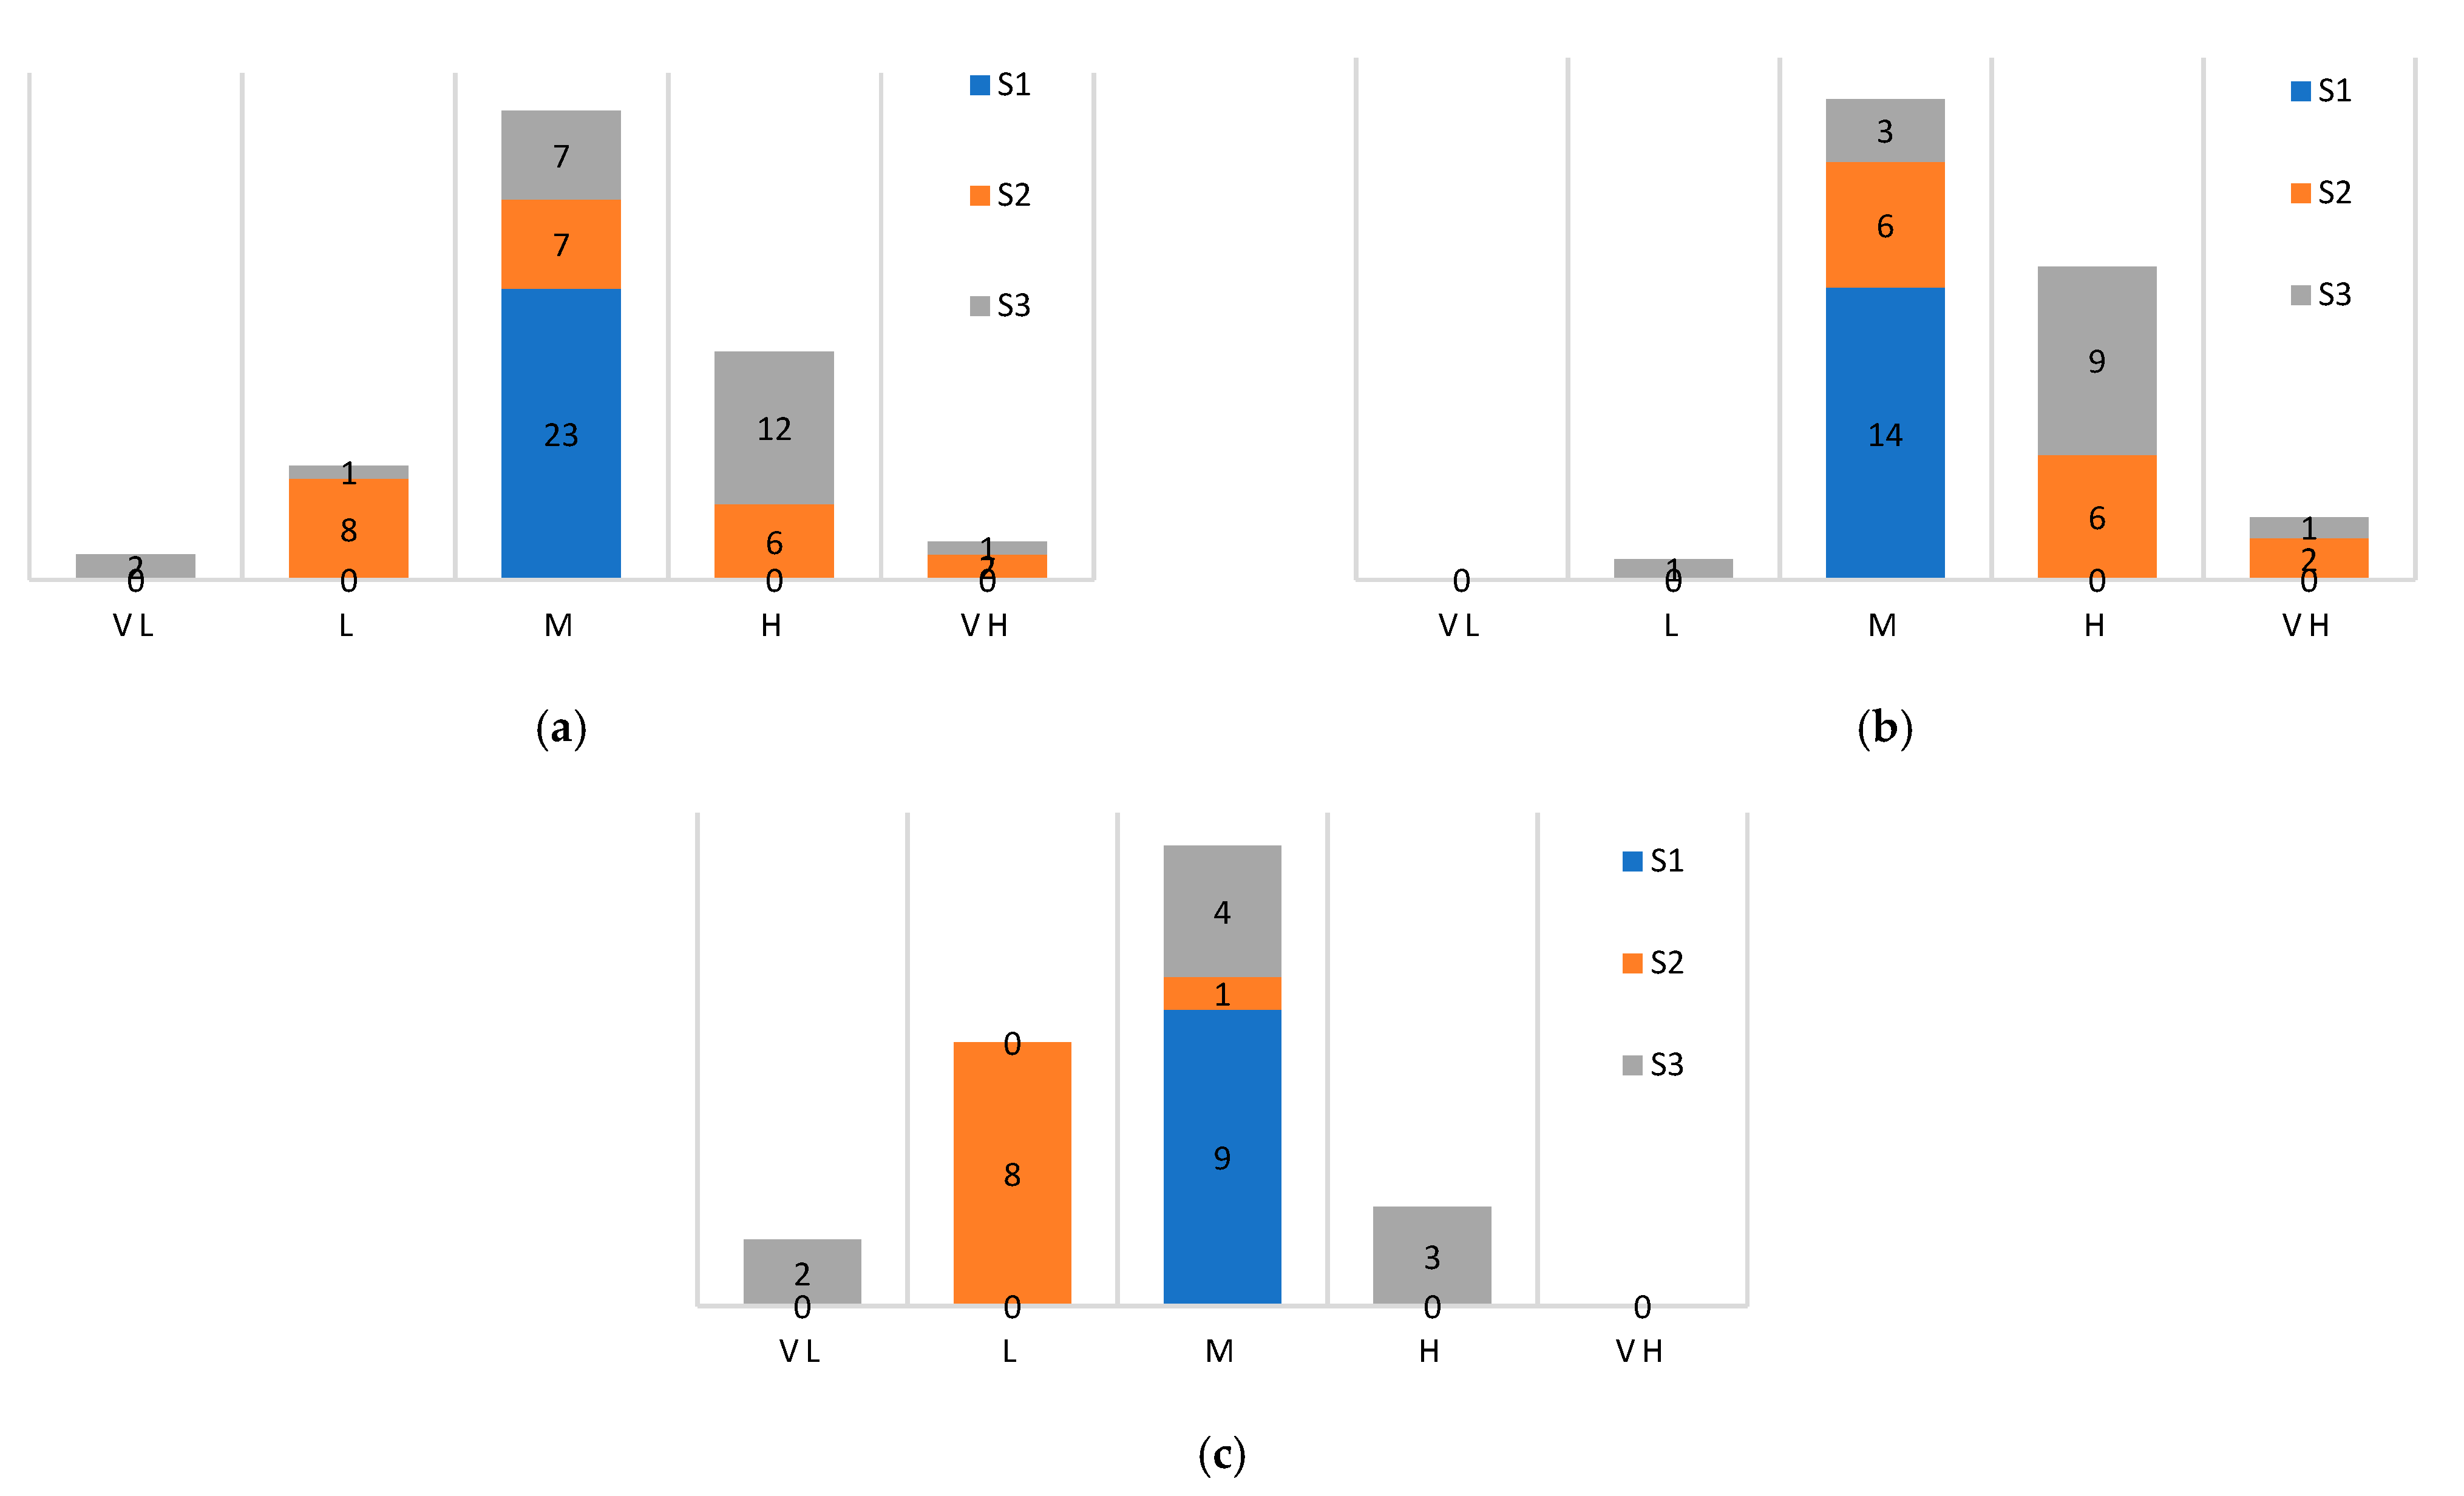
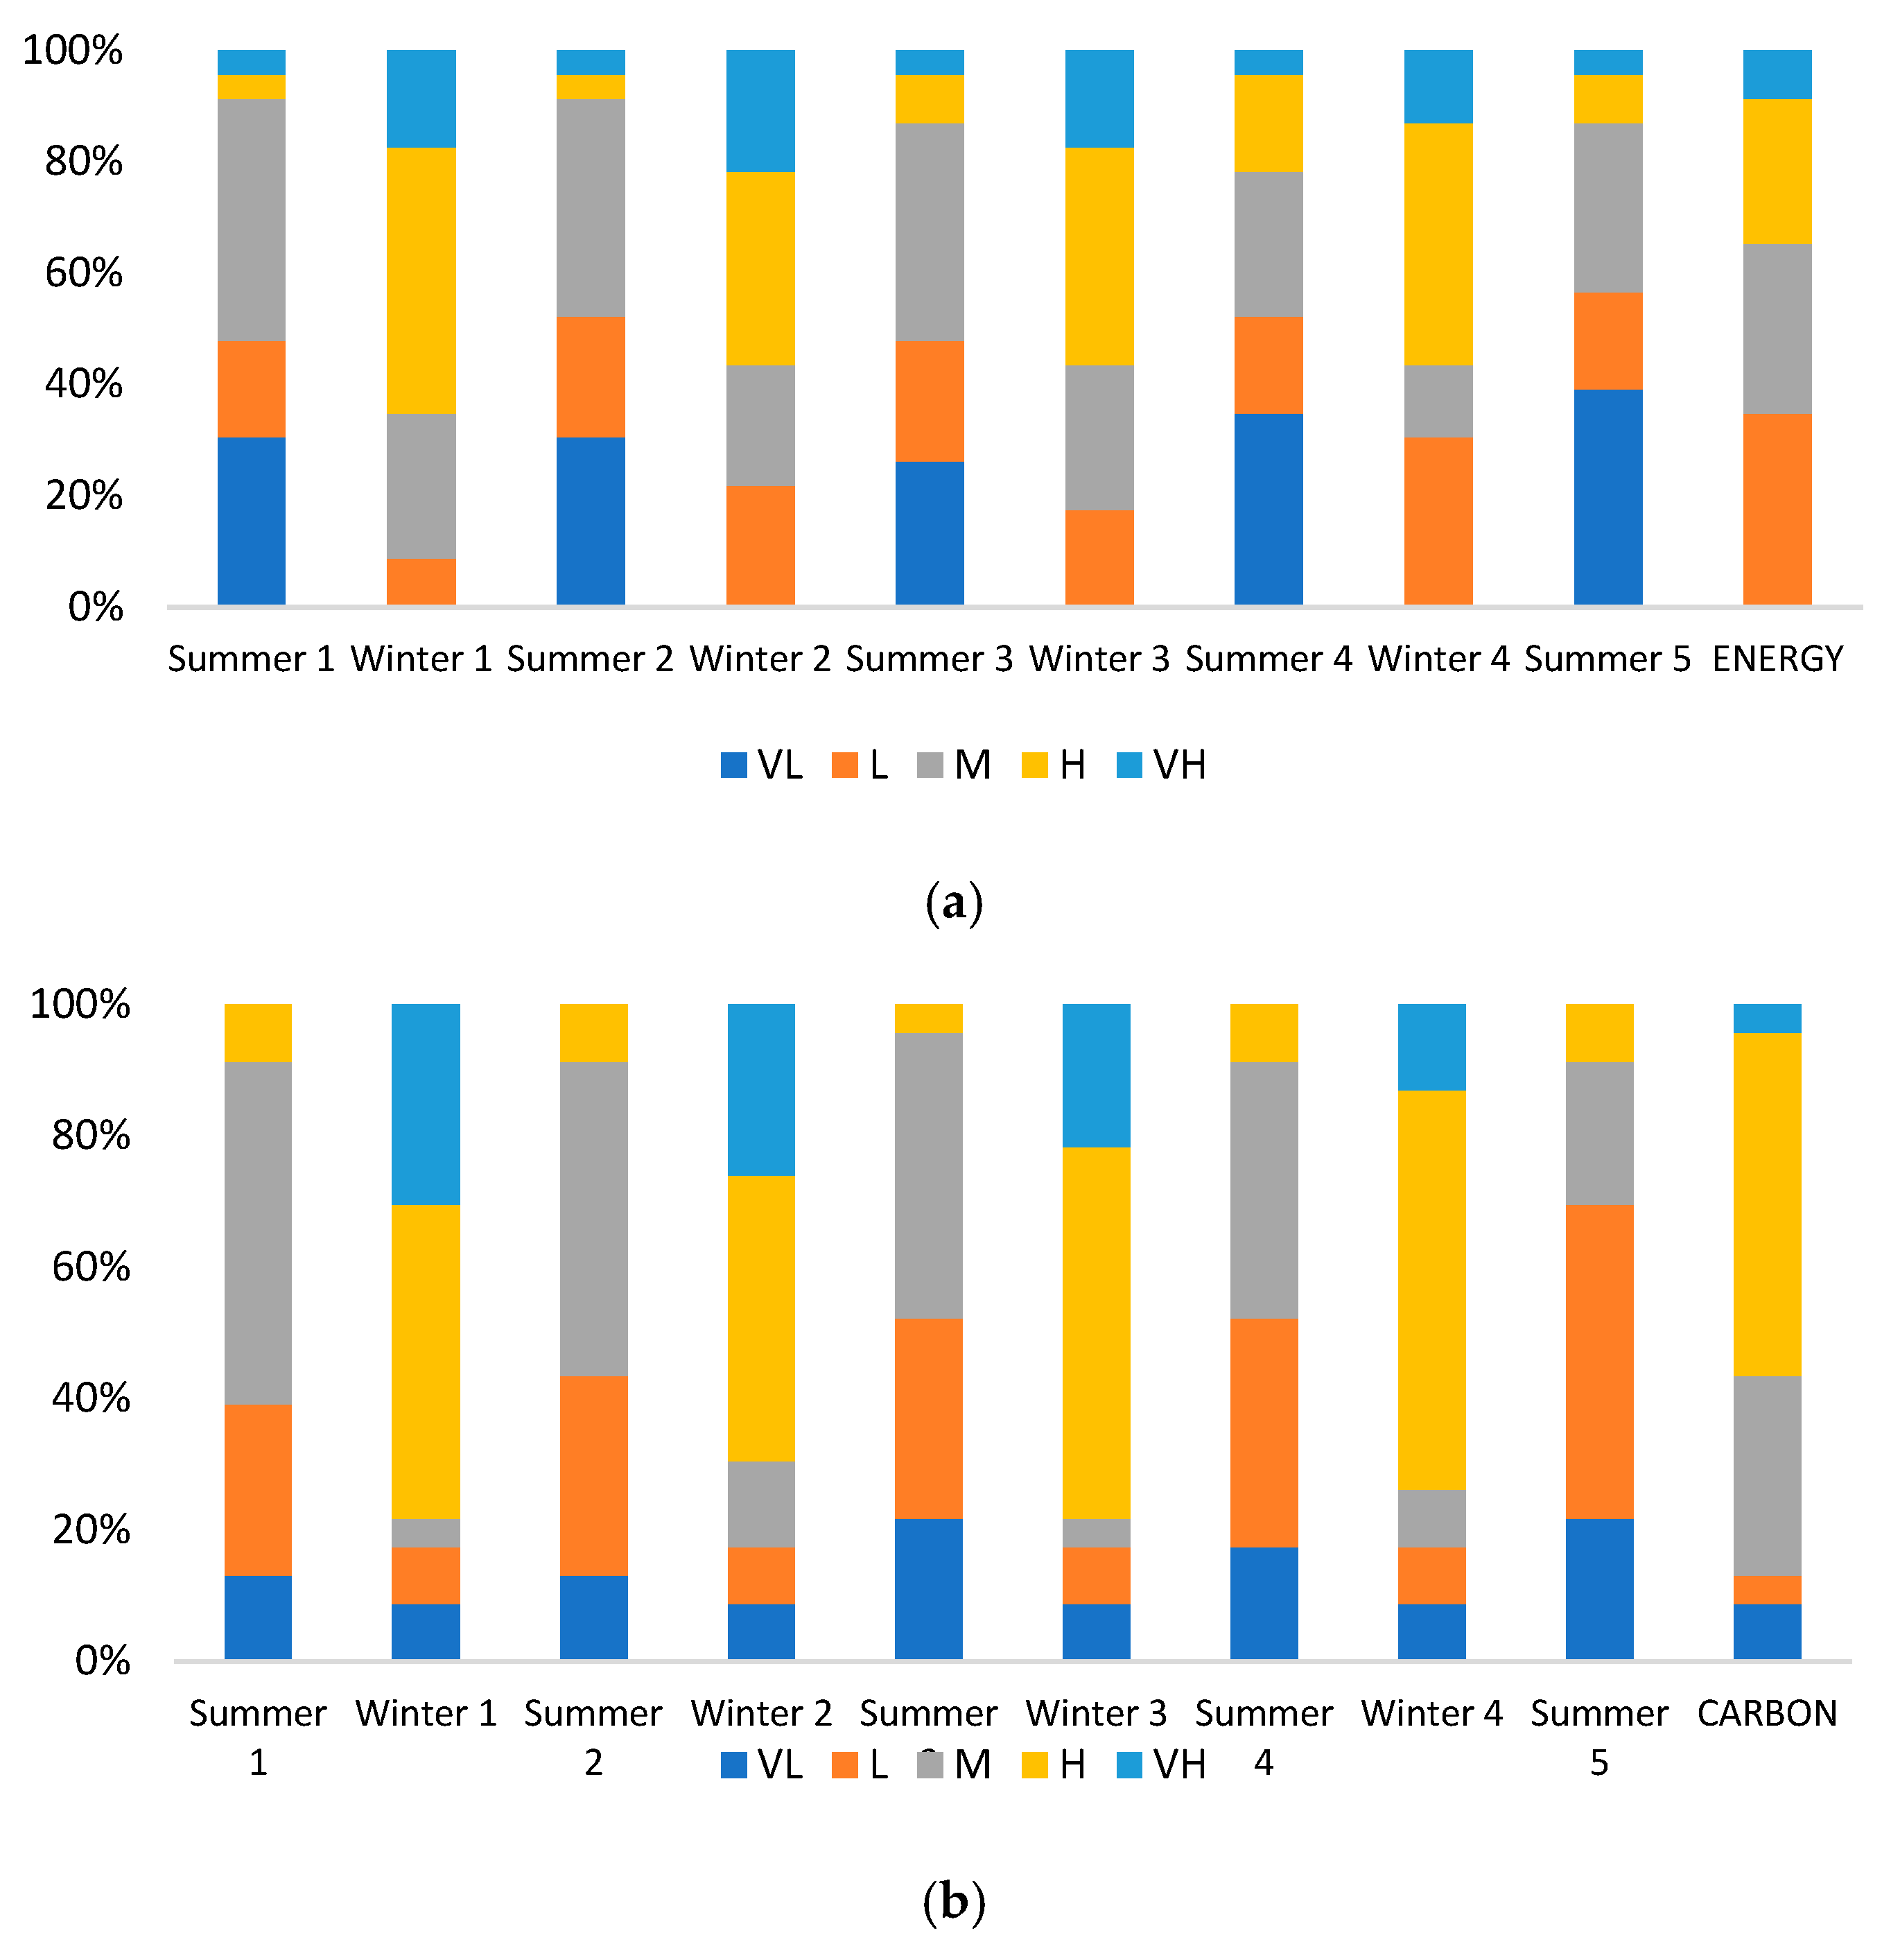
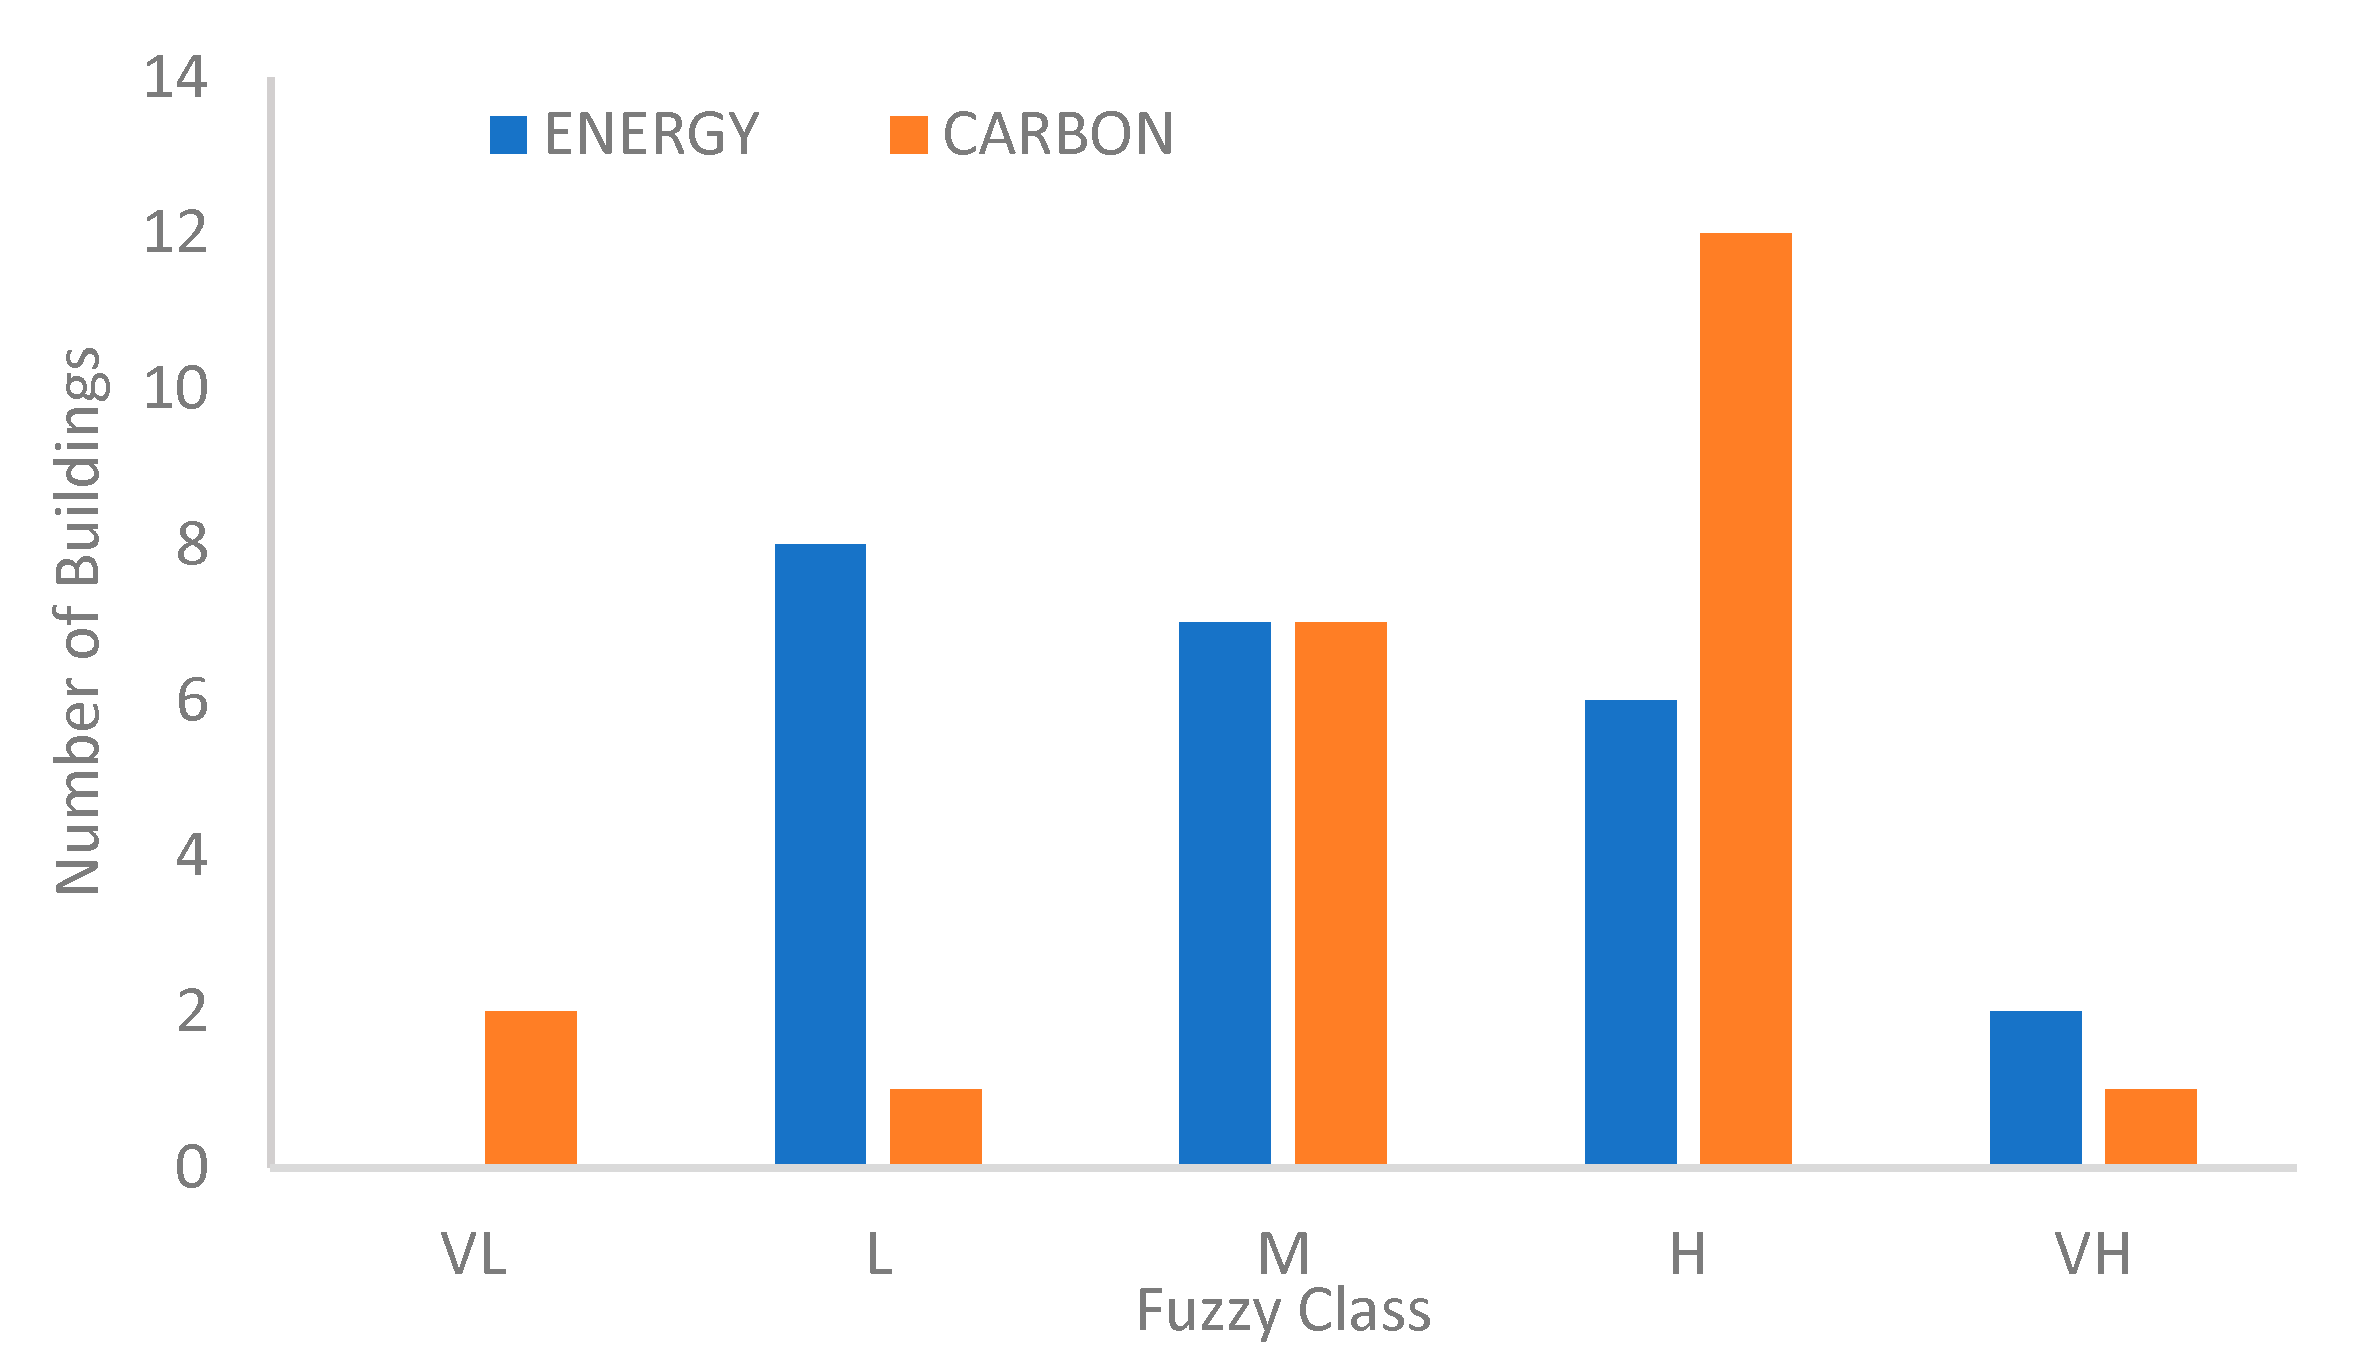
Figure 12a–c shows the classification of each building by type in terms of the five classes. It can be noted that academic buildings hold a larger effect on the overall performance within the university compared to residential buildings.
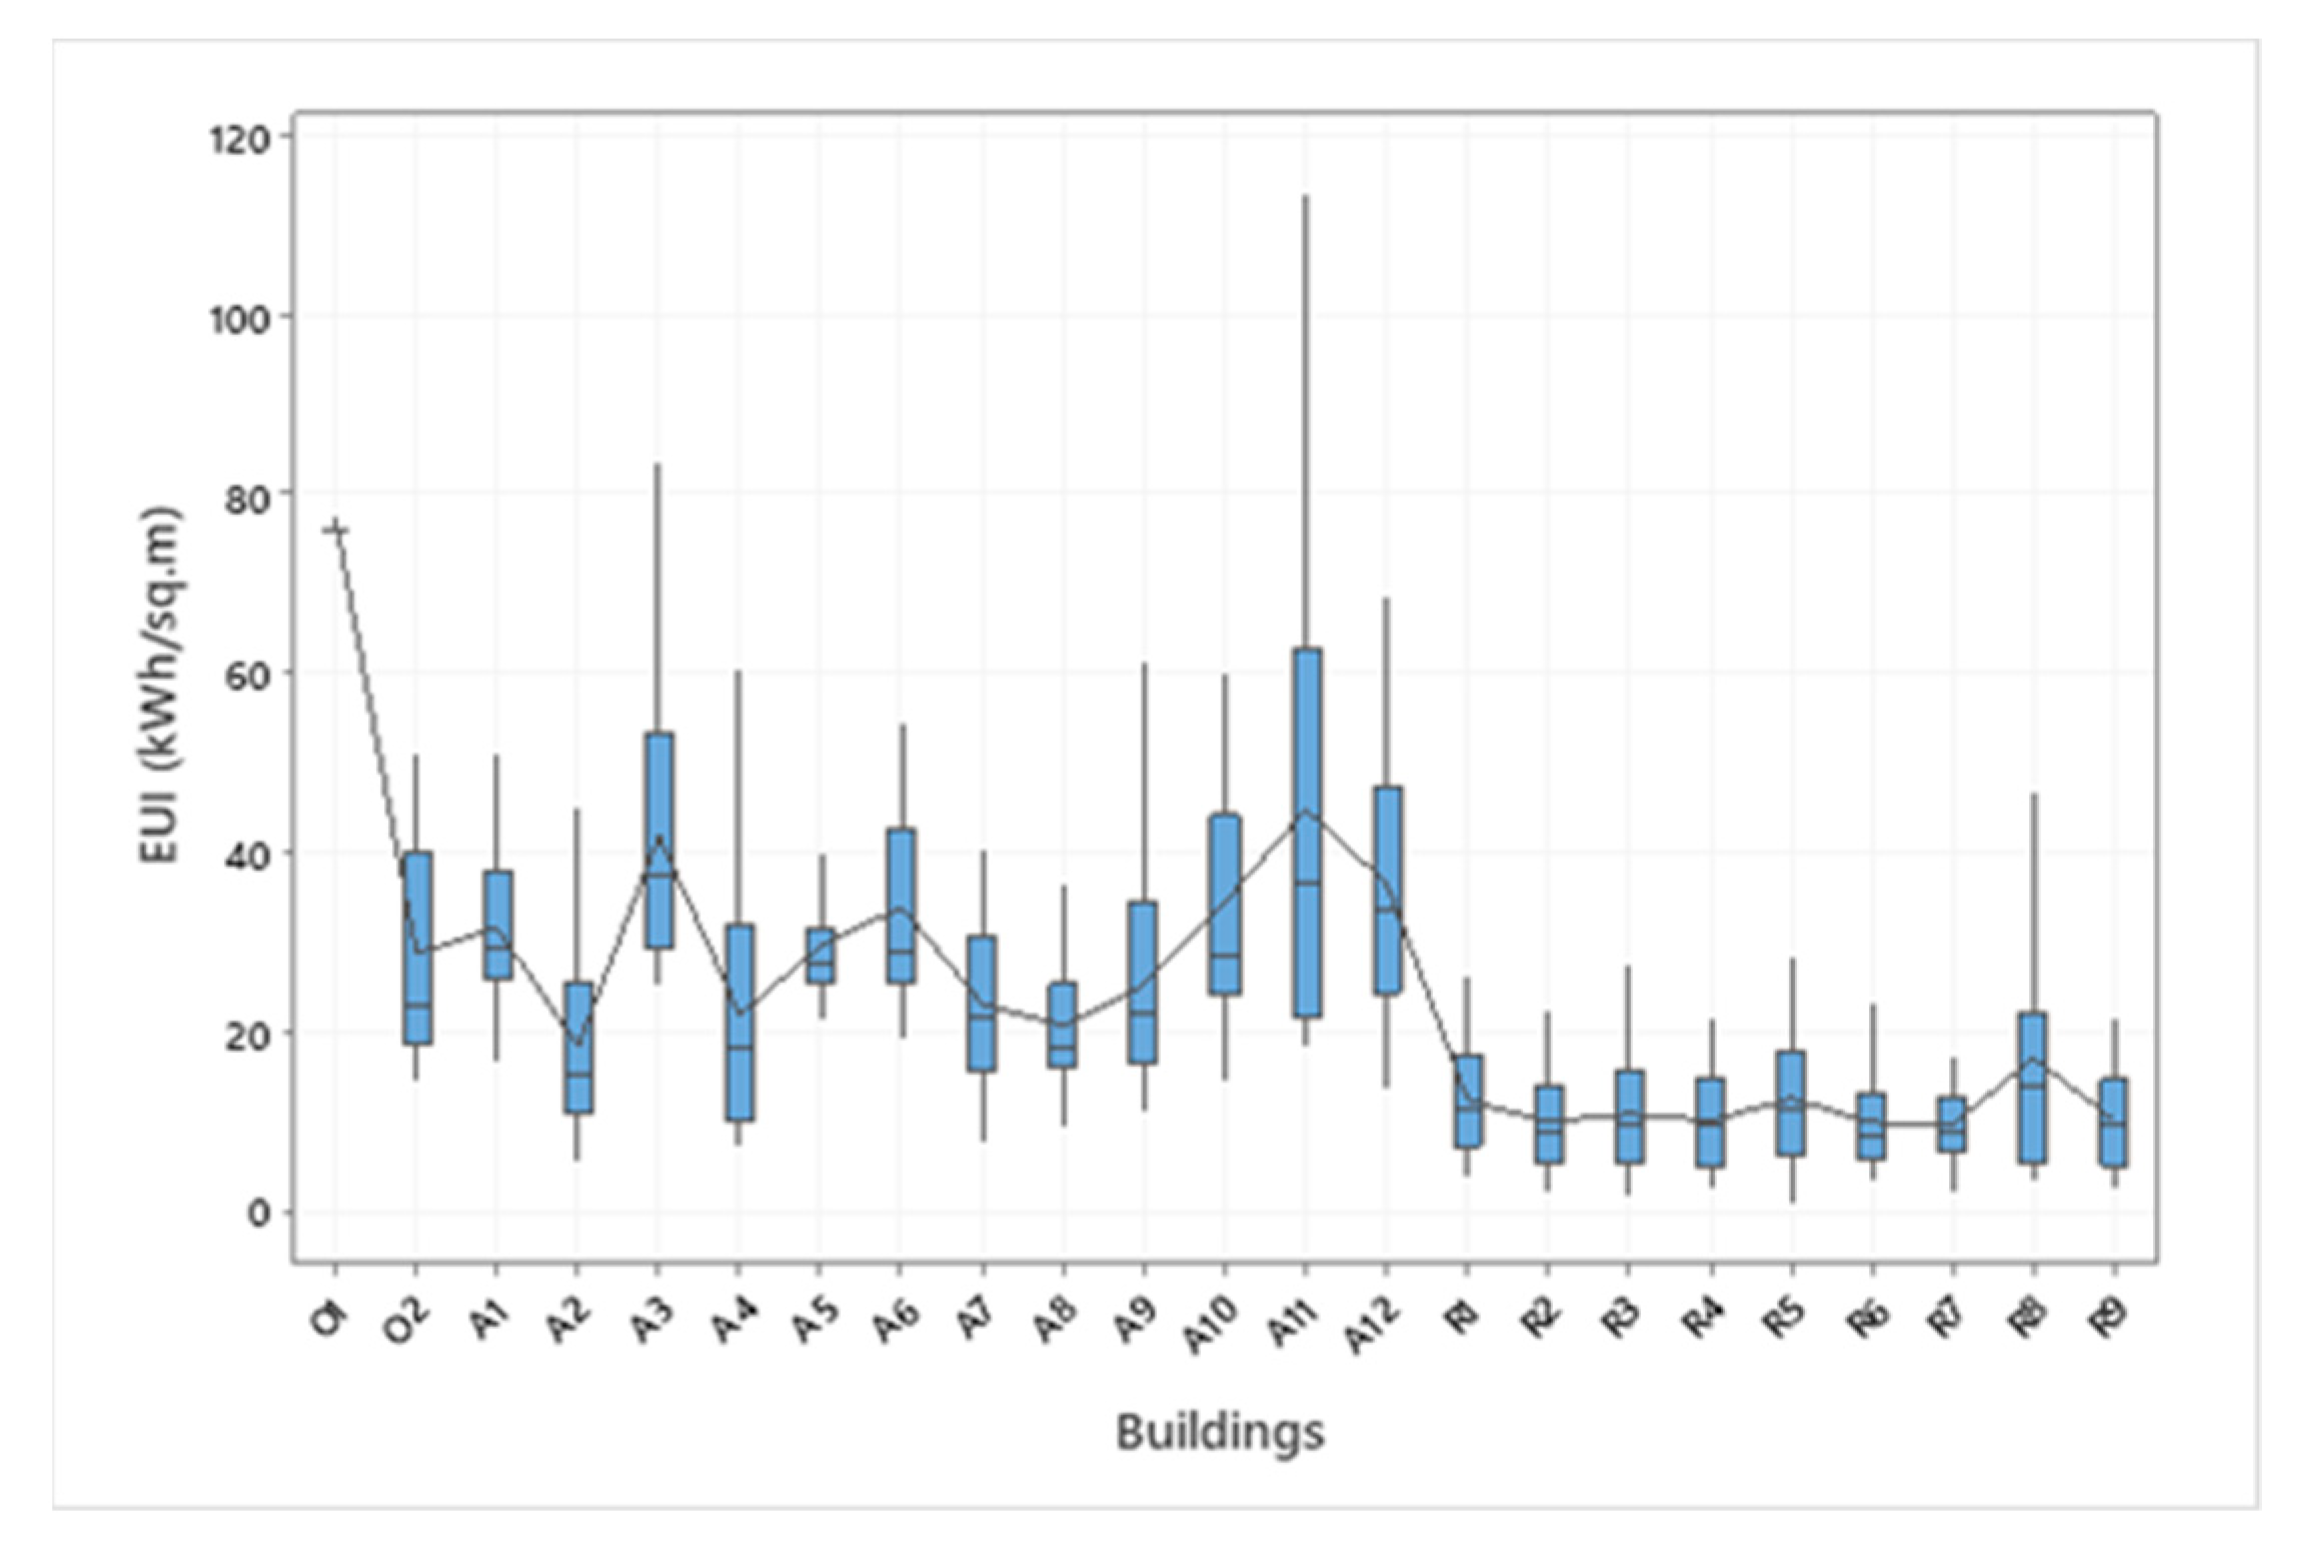
By classifying the buildings in terms of the type of buildings (i.e., academic or residential), academic (which include operational buildings), and residential buildings as a separate class. It is noted that in academic buildings in Scenario 2, 43% of the buildings fall in the (VL, L, M) class, and 57% fall in the (H, VH) class. Similarly, for Scenario 3, 29% of the academic buildings are in the (VL, L, M) class, and 71% are falling behind in the carbon scenario. Residential buildings are less impactful, since all the residential buildings fall in the (VL, L, M) class with 0 buildings in the VL class, eight buildings in the L class, and one building in the M class. In the third scenario, 67% of residential buildings are better performers, and 33% have a considerable impact on the carbon scenario. In the energy preference scenario, two buildings are noted to have VH, which are an operational building and an academic building. These two buildings have high EUI, where O1 monthly average EUI is 77.17 kWh/m2 and A11 reports 44.85 kWh/m2. Building A11 is reporting a VH class in both scenarios, which means this building is among the least performers in terms of energy and carbon scenarios.
This paper shows that heating requirements may be the main contributor to the energy and carbon impacts. Addressing these high-intensity areas in the buildings is a challenge for universities seeking to minimize their impact on the environment. Finally, this paper illustrated a proposal to the calculation method, based on system dynamic modeling of water–energy–carbon nexus and the carbon sequestration in HEIs. It also showed that, due to the intensive nature of academic buildings, biological sequestration may not be a viable option for universities to pursue—especially in regions where water resources are heavily dependent on fossil fuels.


 ,
, 


