Communication

Microplastics Contamination versus Inorganic Particles: Effects on the Dynamics of Marine Dissolved Organic Matter

by
Amedeo Boldrini
1,
Luisa Galgani
1,2,*,
Marco Consumi
1,3 and
Steven Arthur Loiselle
1,2
1
Environmental Spectroscopy Group, Department of Biotechnology, Chemistry and Pharmacy, University of Siena, 53100 Siena, Italy
2
CSGI, Center for Colloids and Surface Science, 50019 Sesto Fiorentino, Italy
3
INSTM, Consorzio Interuniversitario Nazionale per la Scienza e Tecnologia dei Materiali, 50121 Firenze, Italy
*
Author to whom correspondence should be addressed.
Environments 2021, 8(3), 21; https://doi.org/10.3390/environments8030021
Submission received: 7 February 2021 / Revised: 2 March 2021 / Accepted: 3 March 2021 / Published: 6 March 2021
(This article belongs to the Special Issue Plastic Contamination: Challenges and Solutions)

Abstract

:
Microplastic contamination has been linked to a range of impacts on aquatic environments. One important area that is only beginning to be addressed is the effect of microplastics on marine carbon cycling and how these compare to the effects related to inorganic particles typically present in ocean waters. The present study explores these impacts on dissolved organic matter dynamics by comparing three scenarios: a particle-free environment, a particle-enriched system with polystyrene microplastics, and a particle-enriched system with inorganic particles (water insoluble SiO2). Natural marine organic matter was obtained by culturing a non-axenic strain of Chaetoceros socialis in 2 L flasks under each of three scenarios. Following the diatom growth phase, filtered samples from the three flasks containing dissolved organic matter and bacteria were incubated separately in the dark for 5 days to monitor changes in dissolved organic matter. Chromophoric dissolved organic matter (CDOM), a bulk optical property, was monitored daily to examine changes in its quality and quantity and to compare degradation dynamics in the three systems. CDOM absorbance (quantity) remained higher in the control with respect to particle-enriched systems, suggesting that the presence of particles led to different rates of CDOM production and degradation. Using indicators for CDOM that could be related to microbial activity, results showed a higher CDOM alteration in the particle-enriched systems. These results indicate that microplastics have a potential role in modifying marine organic matter dynamics, on a similar magnitude to that of biogenic inorganic particles. Given their increasing concentrations of marine ecosystems, their role in marine microbial processing of organic matter needs to be better understood.

1. Introduction

From the synthesis of the first polymers, the production and use of plastics has grown constantly, largely due to their expanding range of application. The global plastic production in 2019 reached 368 million tons [1]. The amount of plastic that reaches the ocean, as of 2010, was estimated between 4.7 and 12.7 million tons per year [2]. Most of this plastic comes from land-based sources through river discharge [3], evidenced by the high concentrations found in freshwater environments [4]. As plastic is resistant to biological degradation, it accumulates in the environment and can be considered a persistent organic pollutant (POP) like many other compounds of anthropogenic origin [5,6]. When present as microplastics, these allochthonous particles have been shown to have multiple effects on marine macro- and micro-organisms: from their ingestion to the release of toxic contaminants and additives present within and on their surfaces, with repercussions on the marine food web [7,8,9]. At present, there are likely to be over 5 trillion (1012) plastic debris pieces present in marine surface waters [10]. However, estimating real concentrations is challenging given the difficulty in measuring the partitioning and sinks of microplastic debris across different marine compartments [11,12].
Microplastics, usually defined as particles below 5 mm in diameter [12], have the capacity to interact with a range of organisms [8]. Microplastics impacts on microbial communities has raised particular interest, since the first observations in the 1970s [13]. Many microorganisms live on plastic debris, in particular diatoms and bacteria [14,15,16]. Certain microbes are so specialized in this environmental niche that they have been named the “plastisphere” community [16]. The adhesion of a microbial community on a plastic particle is favored by weathering and photo-oxidative processes at sea that change particle properties over time [17,18]. Plastic’s hydrophobic surface attracts microbial colonization [16].
Microbial colonization is rapid and starts with the excretion of exudates [19] and the formation of a biofilm around the microplastic particle [18,19]. The coating of plastic particles by organic exudates increases the natural particle aggregation rate and particle export [20,21], removing microplastics from the upper layers of the ocean [22,23,24]. Besides enhancing the downward flux of particulate organics [8,21], the presence of microplastics can alter the microbial processing (production and transformation) of dissolved organic matter (DOM) compounds [25,26]. Changes in processing have a direct influence on the “quality” and lability of DOM in surface waters and their eventual descent to greater depths [27].
DOM is a complex mixture of organic molecules that rapidly changes in composition due to microbial alterations and photochemical processes [28]. Every year between 15 and 25 Pg of DOM enters the ocean from the surrounding environment, representing the main source of nutrients for marine organisms [29]. A vast amount of terrigenous DOM reaches the oceans through riverine inputs, being photochemically and microbially transformed during the transport [30]. When exposed to sunlight, DOM may form highly reactive intermediate species; the extent of its photochemical reactivity strongly depends on individual DOM components, on the degree of DOM processing or microbial alteration [31,32], and on the catchment soil characteristics when proceeding from terrestrial sources [30]. Microbially processed DOM has been shown to be highly photo-reactive [31]. The fraction of DOM that has an interaction with solar radiation is referred to as chromophoric dissolved organic matter (CDOM), and it may represent up to 70% of all dissolved organic carbon (DOC) in the ocean [33,34]. CDOM optical properties are related to the presence of chromophores absorbing at specific wavelengths [34,35].
CDOM can be produced both by autotrophic and heterotrophic marine microbes [35,36]. Fresh phytoplankton-derived DOM is commonly recognized as being more bio-labile and prone to bacterial remineralization; however, photo-transformation processes may reduce the initial DOM bio-lability of this material [37]. At the same time, photochemical breakdown of high-molecular-weight compounds may make more biologically refractory DOM available as plankton substrates [38]. Being photochemically active, CDOM can act as a reactant or intermediary during a photochemical reaction [31], but it is also responsible for natural attenuation or extinction of UV–Visible radiation in aquatic environments [35,39]. In surface waters, high CDOM concentration may limit primary production because of an overlap of its absorption spectrum with the absorption peaks of chlorophyll and other pigments [40,41,42]. On the other hand, as CDOM has its strongest absorption in the UV region, its presence protects microorganisms from cellular damage in high irradiance environments [43,44,45].
It has been recently shown that polystyrene microplastics may increase the production and release of CDOM by bacteria [25], and especially in the marine surface layer [26], where high accumulation of this chromophoric DOM fraction is often observed [43,46,47,48,49]. Several studies have focused on plastic and microplastics toxicity related to material type, size and shape and interaction with marine microbes [50,51,52] or in the ability of materials different than plastics to attract a biofilm-forming microbial community [53,54,55]. However, there is little known of the comparative behavior of inorganic (mineral) versus plastic particles in the marine environment. In particular, it is unclear whether these materials interact with microbial processes to alter DOM cycling and lability in a similar manner. Inorganic particles are natural constituents of seawater (biogenic silica, calcite, and aluminosilicates), acting as a microbial substrate in aquatic environments [56].
To understand the impacts of microplastics versus inorganic particles on marine carbon cycles, we examined differences in CDOM dynamics in controlled laboratory conditions and by focusing on the following two hypotheses:
  • The presence of particles (inorganic or organic) versus a particle-free environment (control) promotes microbial activity and processing (production and transformation) of CDOM.
  • Microbial activity differs upon substrates: inorganic substrates and microplastics have different impacts on the production and processing of CDOM.
We compared three conditions: a control without any particles addition; and two particle-enriched systems, one added with polystyrene microplastics and the other with inorganic silica (silica gel particles) in similar sizes and concentrations.

2. Materials and Methods

To address the hypotheses of the study, we designed a simple experiment with a limited number of parameters and non-invasive analytical approaches. These limitations were dictated by the aim to examine temporal dynamics of closed systems with minimal disturbance. The experiment was carried out in two sequential phases described in detail below. In part 1 (day 0 to day 7), a diatom culture of Chaetoceros socialis was grown in three different treatments (control, microplastics and SiO2 particles) to obtain the dissolved organic matter to allow for microbial dark incubations in the second part of the experiment. In part 2 (day 7 to day 11), dissolved organic matter produced by Chaetoceros socialis was incubated in the dark in replicate microcosms containing the culture-associated heterotrophic bacteria. The specific culture strain was chosen to build on the results of previous microplastics studies [25,26]. Knowing this particular species’ behavior in similar experimental settings allowed for the validation of changes under different treatments. Prior to the experimental work, all laboratory equipment and glassware were acid washed (HCl, 1% and 10%) and sterilized by autoclave cycles of 15 or 30 min at 1 bar and 120 °C.
Part 1: Cell Growth
A non-axenic culture of the diatom Chaetoceros socialis was obtained from the Scottish Association of Marine Sciences (CCAP nr. 1010/19) and grown in three different 2 L flasks for 14 days on a 12:12 light/dark cycle at 20 °C ± 2 °C. Each flask was filled with pre-filtered (0.2 µm) and autoclaved Guillard’s f/2 + Si medium prepared from artificial seawater (density = 1.022 g/cm3, pH = 7.6 ± 0.3, salinity = 30 PSU) according to recipe nr. 1 of the Woods Hole Marine Biological Laboratory [57]. As a reference, the final molar concentrations of the nutrients in the f/2 + Si medium are: NaNO3, 8.82 × 10⁻⁴ M; NaH2PO4 H2O, 3.62 × 10⁻⁵ M; and Na2SiO3 9H2O, 1.06 × 10⁻⁴ M.
Flask 1-C (control) contained phytoplankton, heterotrophic bacteria and the growing medium. The other two flasks were particle-enriched: flask 2-PS contained ~200 particles/L of 30 µm polystyrene microspheres (density: 1.05 g/cm3, Sigma Aldrich, Saint Louis, MO, USA), flask 3-S contained ~200 particles/L SiO2 particles (Silica gel 60 for flash chromatography, Carlo Erba reagents, density: 0.7 g/cm3, water insoluble, molar mass 60.09 g/mol) of a similar dimension (>87% of the particles had a size of ~32 µm). The SiO2 in the 3-S flask was added through subsequent dilutions of silica gel powder to a final concentration of 2.4 µg L−1. Compared to real environmental conditions, particle concentrations in our experiment were high in order to discern the effects. However, microplastic concentrations found in polluted marine waters are quite elevated (103–104 particles per m3) [27]. Moreover, the increase in marine plastic pollution suggests that this concentration may characterize much of the ocean in the coming years [58]. The standard polystyrene particles chosen had homogeneous size and a density close to the artificial seawater used in the experiments. Given the different density of particles in both flasks, an air diffusion system was used to avoid particle deposition to the bottom of the flask. The three flasks were continuously aerated to allow a constant and homogeneous mixing (24 h a day). A 0.2 µm air-filter prevented airborne particulates from entering the culture flasks. The flasks were kept covered with sterile gauze, aluminum foil and closed with parafilm to avoid exchange with the ambient air.
Cell growth was monitored daily through optical density measurements (OD) at 420 nm, following recent studies using this specific diatom [25,26]. Measurements were performed with a Lambda 25 ultraviolet–visible light (UV–Vis) spectrophotometer (Perkin Elmer, Waltham, MA, USA) in 1 cm path length quartz cuvettes at room temperature and corrected for baseline and Milli-Q water. Before each spectrophotometric measurement, the levels of the solutions were checked to avoid biases due to water evaporation or condensation. Part 1 of the experiment (cell growth) lasted 7 days. However, the remaining cell culture of each flask was monitored until the end of the dark experiment (part 2).
Part 2: Microbial CDOM Dynamics
On day 7, a 5-day experiment in dark conditions was performed to compare modifications of CDOM substrates produced in the three systems. Firstly, diatom cells, particles (polystyrene and SiO2) and particulate organic matter were removed by filtering 250 mL of each flask through a 47 mm Whatman GF/F filter (0.7 µm pore size), leaving a filtrate containing DOM and bacteria. To avoid cross-contamination of the samples with different particles, separate filtration devices were used. In one system, first 1-C and then 2-PS samples were filtered. In the other, only the 3-S treatment was filtered.
Twelve 28 mL capacity quartz cuvettes (10 cm path length, Hellma 120-QS, Quartz SUPRASIL, Helma Analytics) were filled with the filtrate and closed with an air-tight seal. Each treatment had four replicate cuvettes which were kept in the dark at a temperature of 20 °C ± 2 °C to exclude any photosynthetic process or any photodegradative processes which could alter the organic matter. All modifications in CDOM were then related to the heterotrophic bacterial activity. CDOM degradation was monitored daily for 5 days. To quickly assess CDOM alterations without opening the 12 cuvettes, we measured bulk optical properties using UV–Visible absorbance. This method allows for an estimate of CDOM composition and reactivity while minimizing sample disturbance, loss of sample volume and the risk of contamination. It should be noted that other analytical methods provide a more detailed analysis of CDOM [32].
CDOM absorbance of the closed cuvettes was measured at room temperature with a Lambda 25 ultraviolet–visible light (UV–Vis) Spectrophotometer (Perkin Elmer) from 200 to 750 nm at 960 nm/min, with a lamp change at 326 nm. All data were manually corrected for baseline, Milli-Q absorbance, and scattering at 700 nm. CDOM raw absorbance data were transformed to absorption coefficients ( a , m−1) as follows:
a = A   ×   2.303 l
where A is the absorbance and l is the path length (m) [59]. In the study of CDOM absorption spectra, a useful indicator of CDOM dynamics is the spectral slope coefficient (S, nm−1), to describe changes in CDOM composition and possible origin. S is calculated as:
a λ = a λ 0 × e S λ λ 0
where a λ (m−1) is the absorption coefficient at wavelength λ (nm), a λ 0 is the absorption coefficient at a reference wavelength, and S is the spectral slope parameter (nm−1). Spectral slope values were calculated for all CDOM absorbance from 200 to 750 nm with a 20 nm and 50 nm wavelength intervals by a nonlinear regression fitting method implemented in Scilab code, an open source software provided by ESI group (www.scilab.org, v. 6.1.0, accessed on 7 February 2021) [60]. A spectral slope between 302 and 322 nm (S302–322) was used to explore qualitative changes in CDOM composition produced by this specific diatom [25,26].
An indicator of CDOM changes associated to microbial processing is the slope ratio (SR), defined as the ratio between spectral slope calculated in the interval 275–295 nm and spectral slope for the interval 350–400 nm [61]:
S R = S 275 295 S 350 400
Dissolved oxygen concentration was used as a proxy for bacterial activity. The oxygen content was measured in the 12 quartz cuvettes with a FireSting Oxygen needle-type optical probe and temperature sensor, PyroScience® (Aachen, Germany), at the beginning of part 2 (day 7). The two sensors were previously calibrated and then immersed into each cuvette; measurements (n = 50 measurements) were taken for 1 min and corrected for temperature and salinity. Oxygen measurements were repeated at the end of experimental part 2 (day 11) but exposure with ambient air during opening made the final oxygen data not reliable.

Statistical Analysis
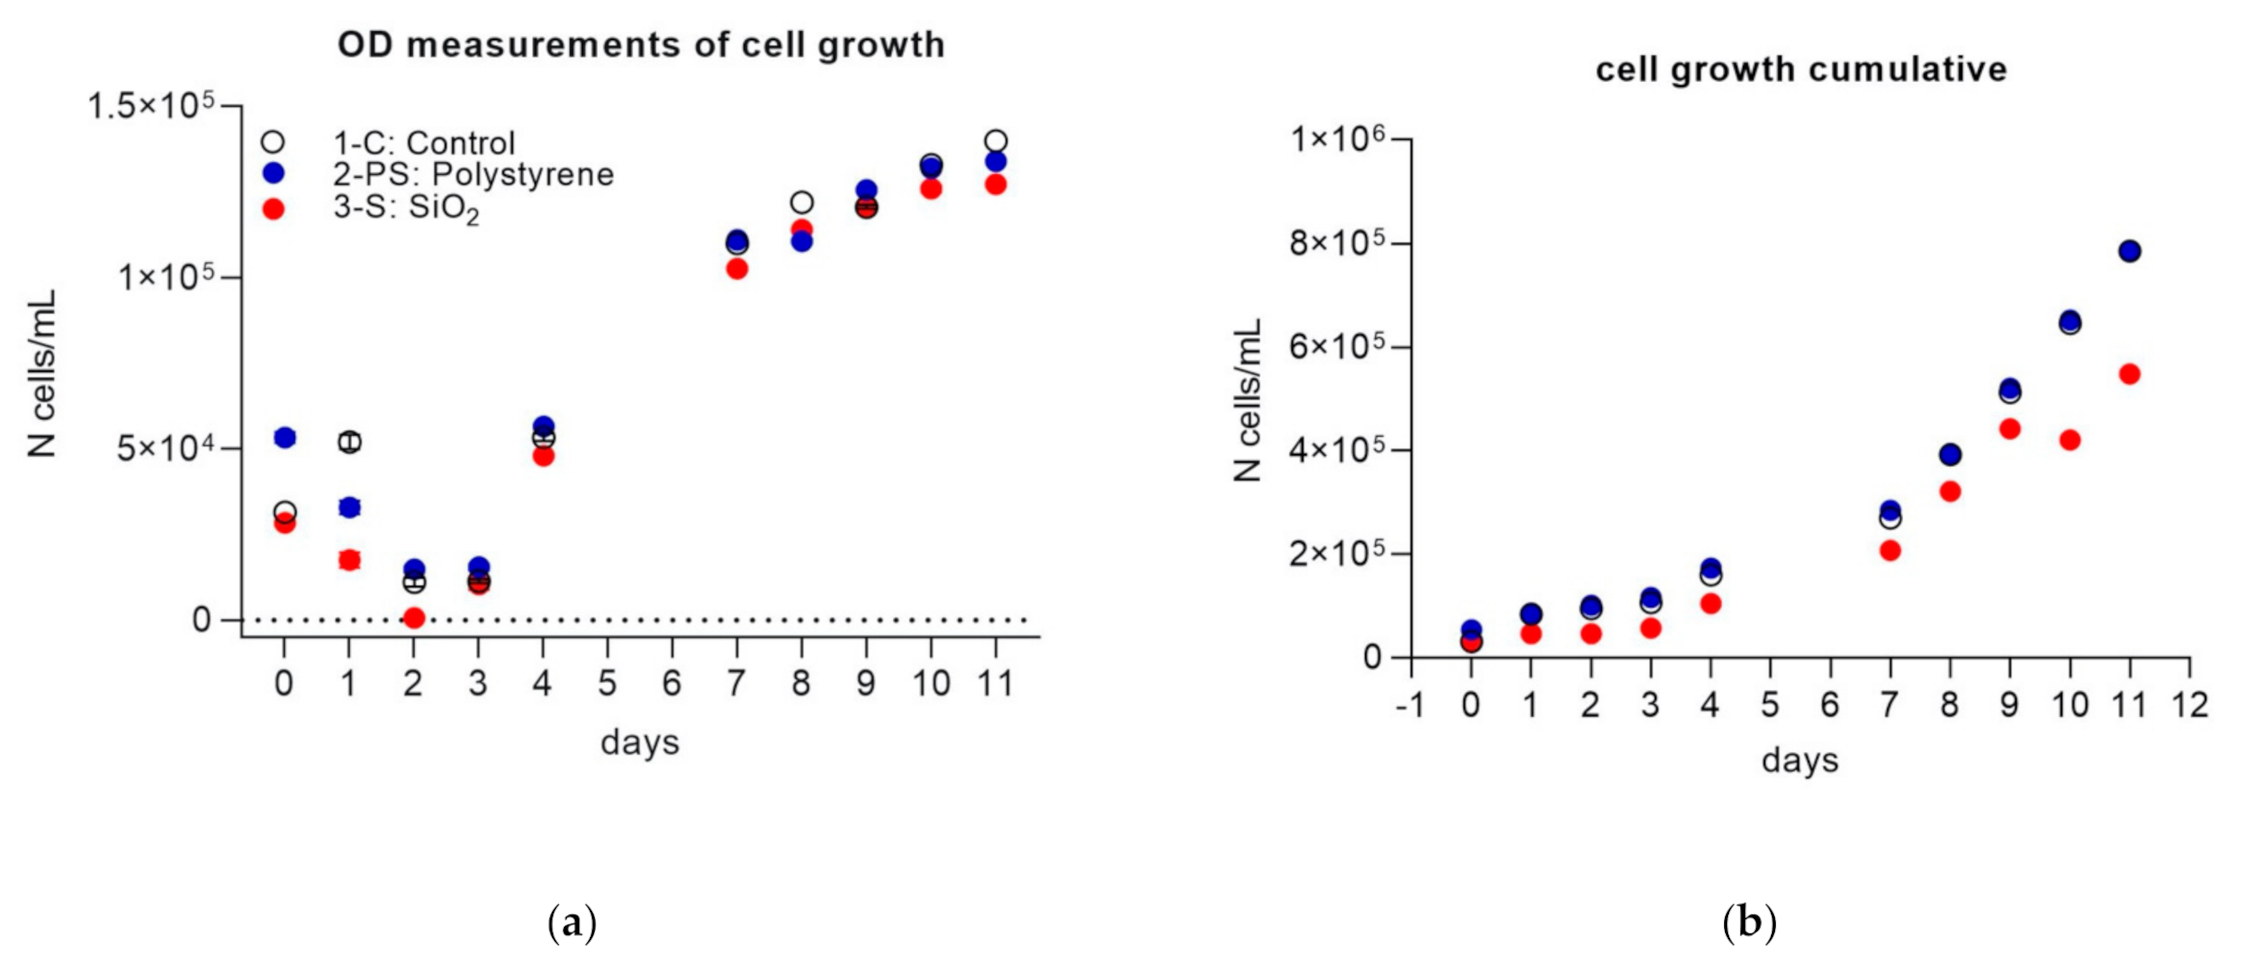
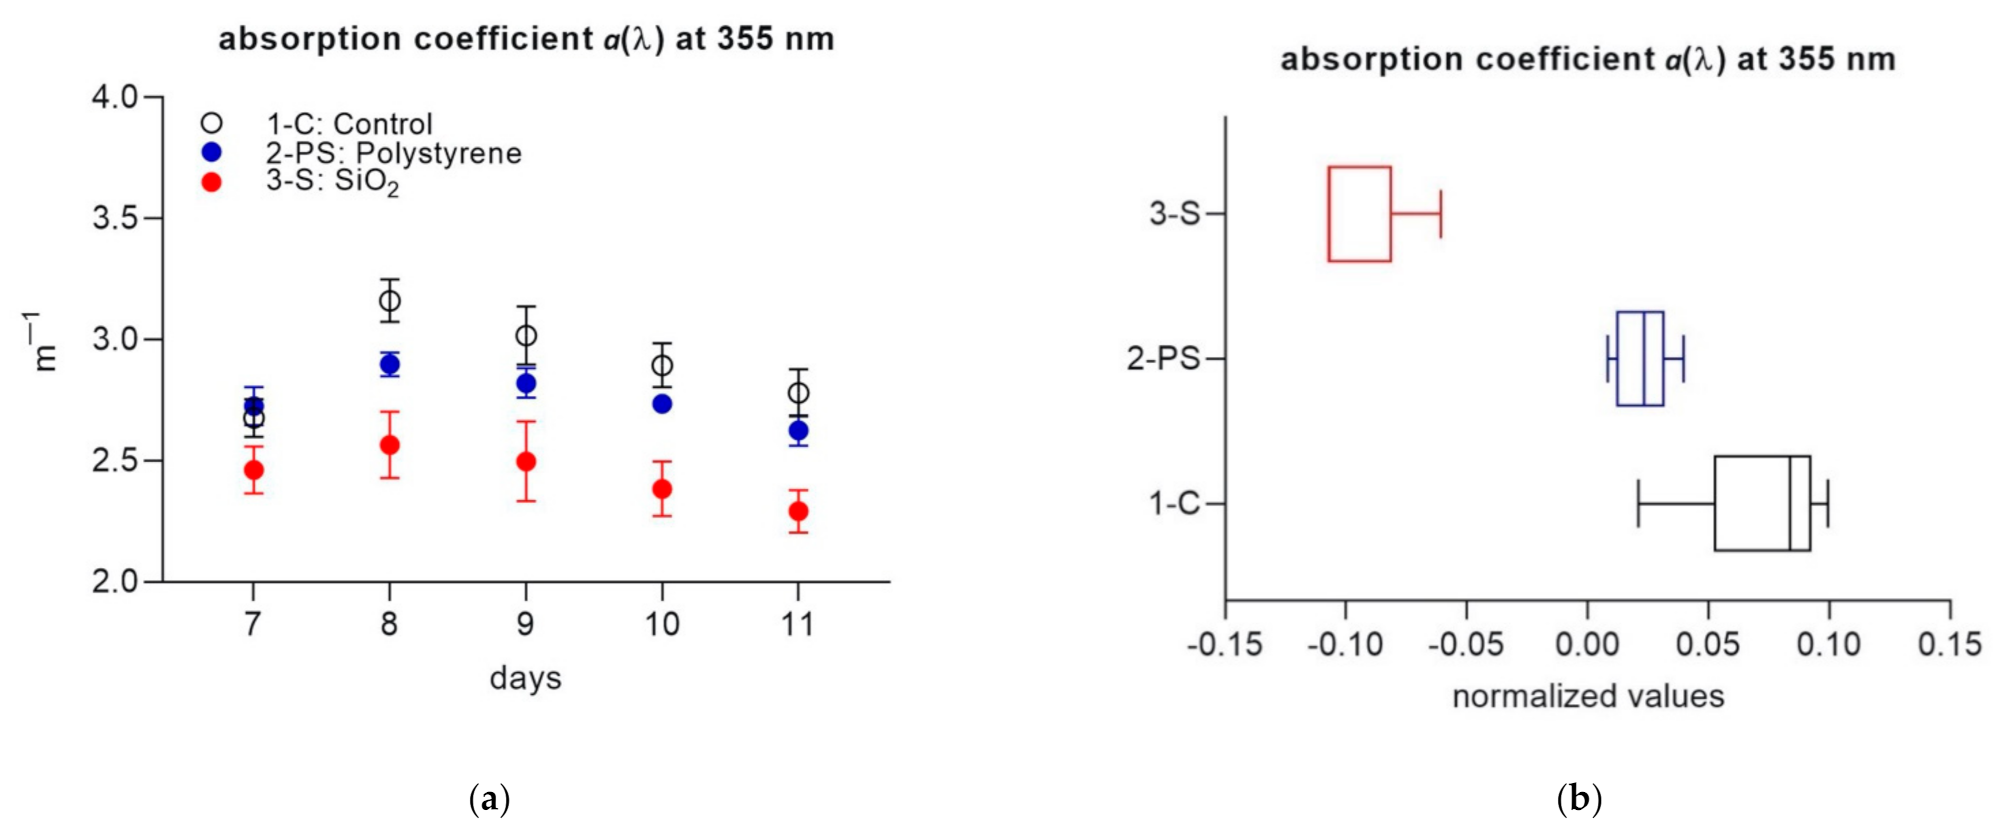
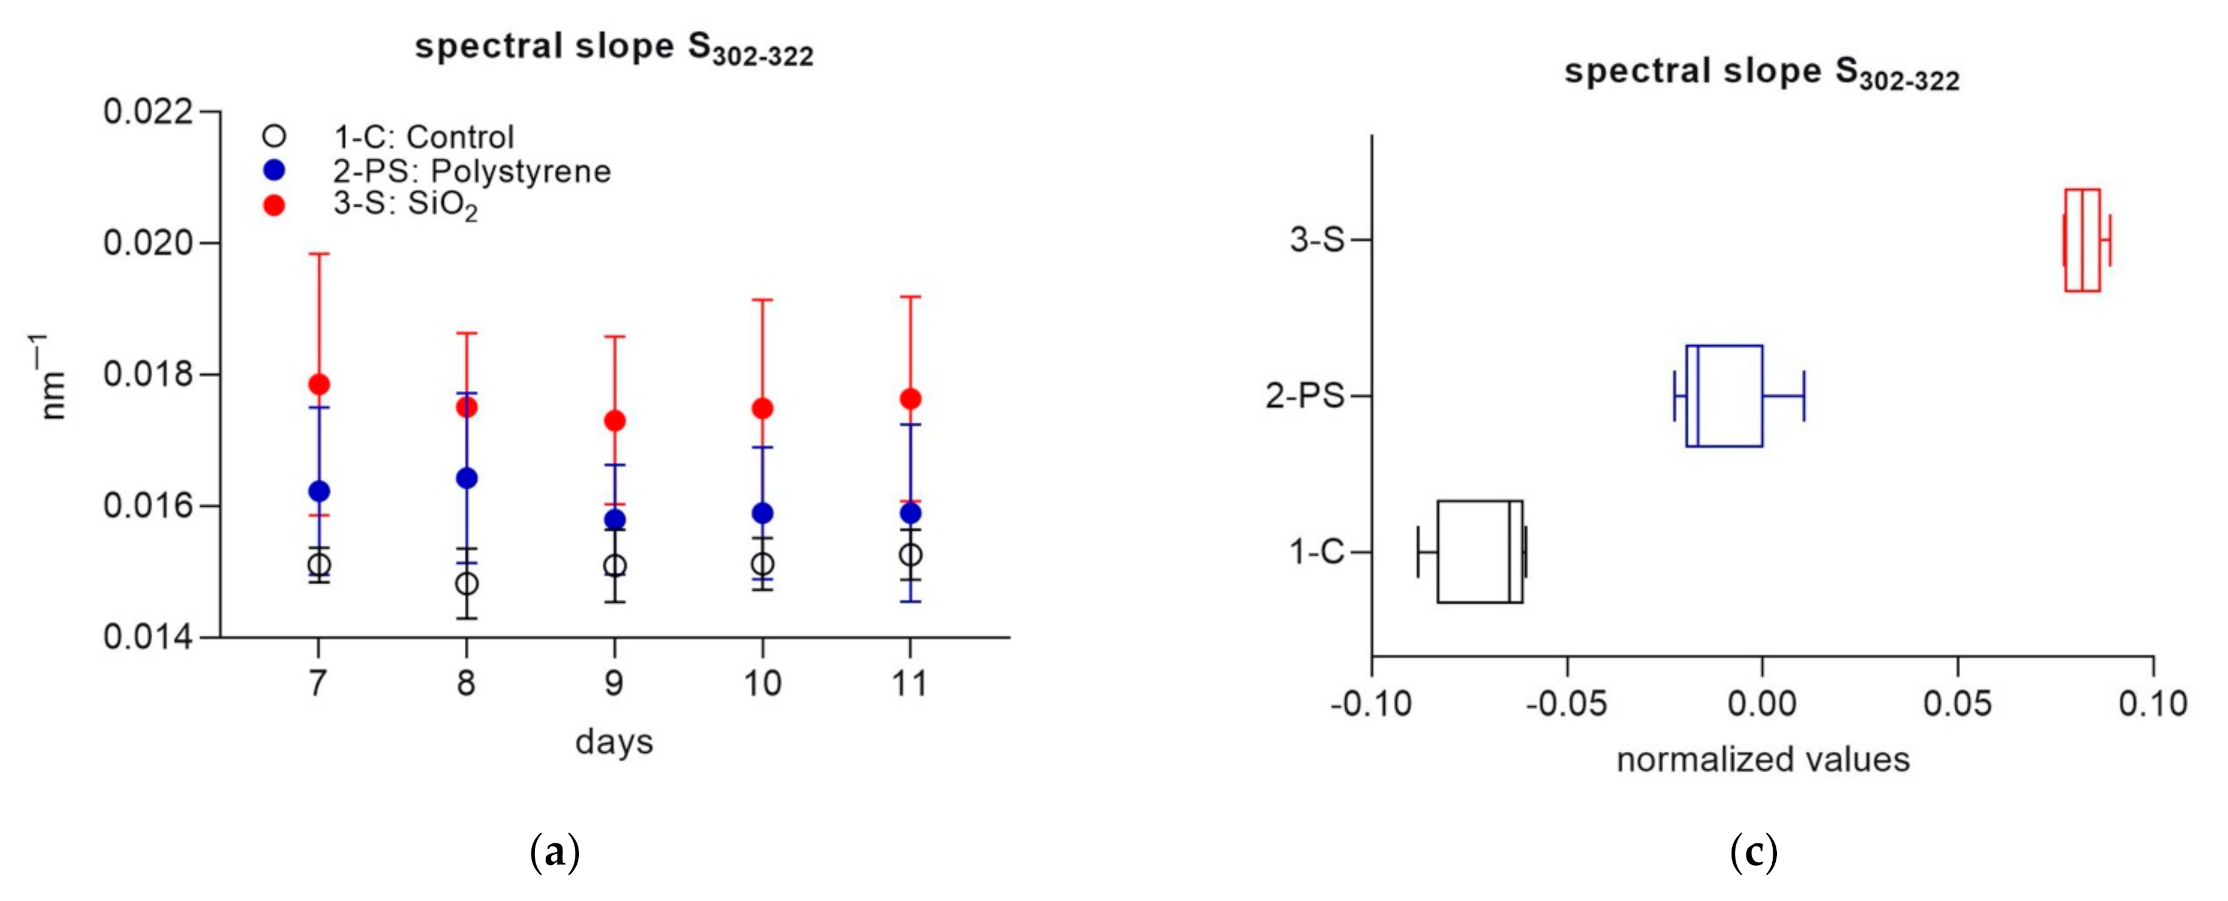
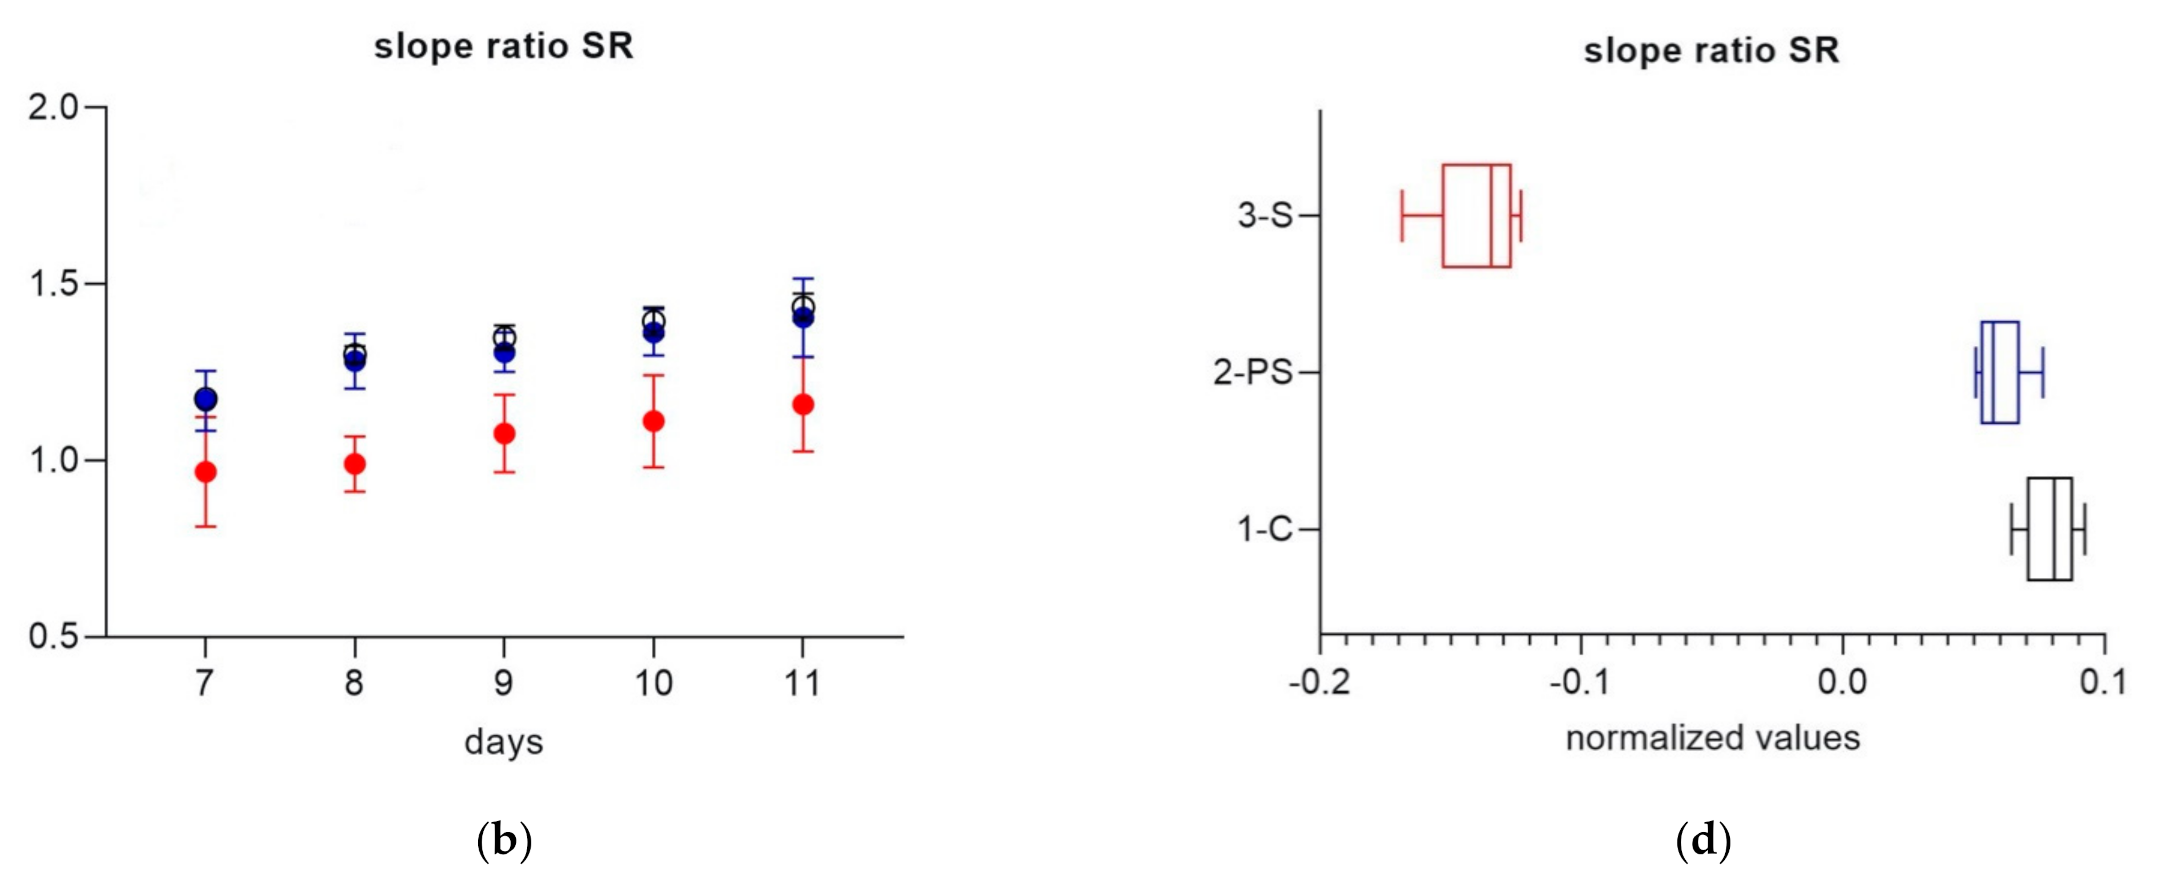
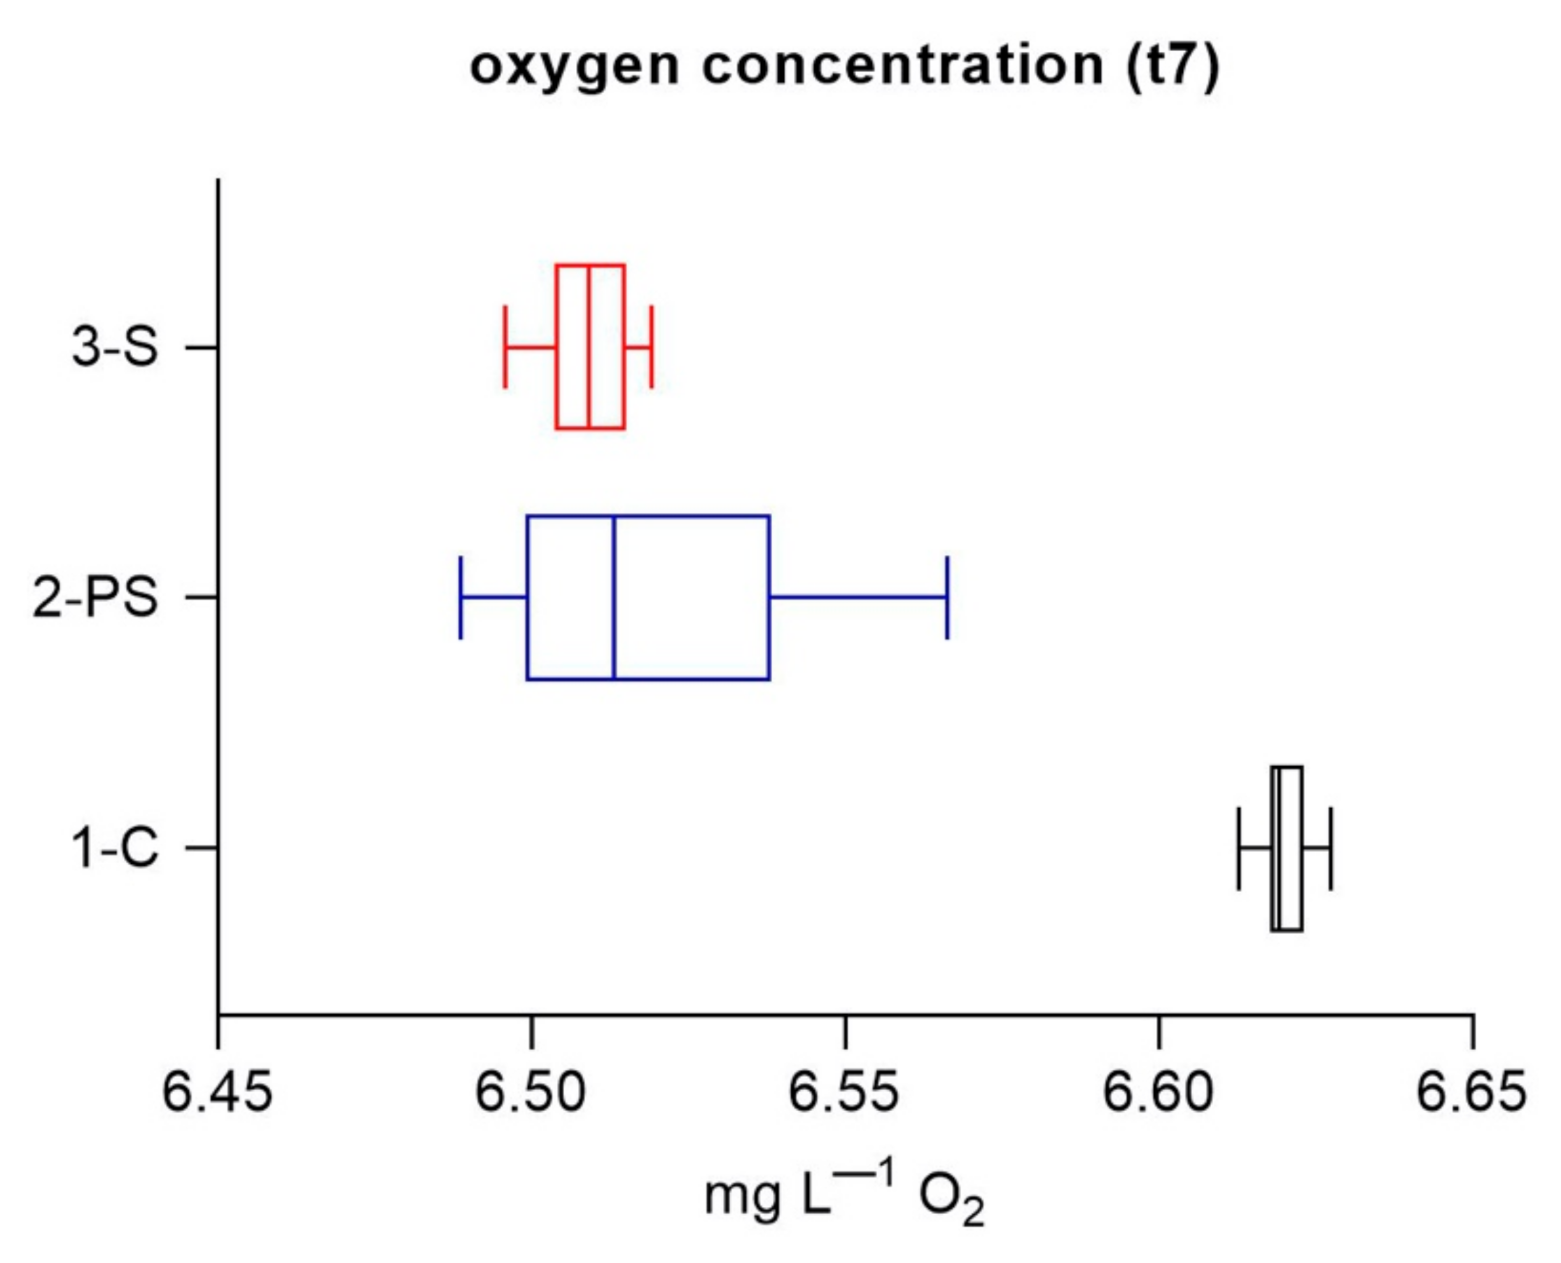
Temporal data were compared with two-way ANOVA tests (mixed-effects model analysis). To separate the effect of the treatment (particles/no particles and type) from the temporal variability of the 12 microcosms systems (cuvettes), data were normalized [20]. Daily anomalies y i j were calculated from each system (j) for any day (i = day 7–day 11) as
y i j = x i j y ¯ i / y ¯ i
where x i j is the daily value of a certain parameter in each system/cuvette and y ¯ i is the daily mean of each treatment:
y ¯ i = 1 12 j 12 ( x j ) i
Differences between control and treated mesocosms were determined with Mann–Whitney tests on normalized daily anomalies. Statistical analysis was performed with GraphPad® Prism 9.0.

3. Results

3.1. Part 1

Figure 1 shows the comparison of the diatom growth curve for the three treatments, while day 0, day 7 and day 11 represent starting, middle and final cell abundance respectively, and are summarized in Table 1. In Part 1, optical density measurements of cell numbers monitored in the culture flasks showed that after a slight decrease in the first days of the experiment (day 0–day 2), an exponential diatom growth occurred in all treatments. Cell abundances during the growth phases significantly differed between the treatments (mixed-effects model analysis, F = 152.0, p < 0.0001), with more evident differences between the 3-S system compared to the other two (Figure 1a,b, Table 1). The cumulative analysis (Figure 1b) further highlighted this trend. By comparing the slopes of the regression of the growth curve in time, we observed significant differences between 3-S and the other two (p = 0.016 between 3-S and 1-C, p = 0.02 between 3-S and 2-PS), while the slopes were similar between 1-C and 2-PS.
Samples for part 2 were collected on day 7 when cell concentration reached about 105 cells/mL, typical for the Gulf of Naples, where this culture was isolated [62], and all systems were in the exponential growth phase. It is expected that at this stage the fresh organic material produced by the culture dominated over any degraded organic matter present. Cell concentrations (N° cells/mL) of three systems were similar on day 7, with slightly lower values in 3-S (Table 1).

3.2. Part 2

CDOM absorption coefficient at 355 nm (a(355)), chosen to compare with similar recent studies [25,26] showed significant differences in the absorption dynamics in the three systems over time (mixed-effects model analysis, F = 4.799, p = 0.0005), with the highest absorption values observed in 1-C, followed by 2-PS and 3-S. Average values of a(355) were 2.91 ± 10.19 m−1 (1-C), 2.76 ± 0.11 m−1 (2-PS) and 2.44 ± 0.15 m−1 (3-S). The difference among treatments excluding the temporal effect was tested using normalized daily anomalies (Figure 2b) (Mann–Whitney 3-S versus 1-C and 2-PS, p < 0.05).
CDOM spectral slope S302–322 and slope ratio (SR) were used to track microbial CDOM alteration in the three treatments. A lower spectral slope generally indicates a less degraded CDOM with a higher average molecular weight, while higher spectral slope values indicate CDOM with a relatively lower molecular weight and a higher degree of degradation [61]. In natural systems, SR has been used to distinguish between different water masses and combined with spectral slope to improve the understanding of DOM processes, as a lower SR has been linked to microbially altered CDOM [43,61]. In this experiment, while S302-322 did not show a clear temporal trend, SR increased over time (Figure 3a,b). This suggests a progressive degradation of the available organic matter. Differences between treatments were significant for both S302–322 and SR (Mann–Whitney tests on normalized anomalies, p = 0.008 for all comparisons 1-C versus 2-PS and 3-S, and 2-PS versus 3-S). While S302–322 was highest in 3-S, followed by 2-PS and 1-C, SR had the complete opposite behavior with lowest values observed in 3-S (Figure 3c,d). Lower SR showed a higher microbial alteration in the SiO2 enriched system.
As a reference, we estimated the concentration of DOC in each cuvette from CDOM absorbance by applying the approach developed by Fichot and Benner [63] using culture-specific parameters previously calibrated [25]. The estimated DOC concentrations in the 12 cuvettes (4 replicates per each treatment 1-C, 2-PS and 3-S) (part 2) ranged from initial (day 7) 157 ± 30 µM L−1 to final (day 11) 410 ± 82.2 µM L−1. In part 2, DOC was highest in 1-C, followed by 2-PS with lowest values in 3-S, and averaged 420 ± 132 µM L−1 (1-C), 370 ± 100 µM L−1 (2-PS) and 269 ± 82 µM L−1 (2-S). These values were significantly different between treatments in time (mixed-effects model analysis, F = 15.94, p < 0.0001, and Mann–Whitney tests on normalized daily anomalies, p < 0.05, data not shown). DOC concentration dynamics are typical of experimental diatoms studies, where DOC accumulates towards the decline of the bloom [64].
Oxygen concentrations at the beginning of part 2 measured in the cuvettes right after filtration were similar for both particle-enriched systems. Dissolved oxygen concentrations were significantly higher in the control system (1-C) (Mann–Whitney test, p < 0.001 in both cases, 1-C versus 2-PS and versus 3-S).

4. Discussion

In part one of the experiment, algal growth in the culture flasks was higher in the control (1-C) and microplastic (2-PS) systems compared to SiO2 (3-S) system (Figure 1). We note that this observation may be biased by the measurement approach. OD measurements only account for free-floating cells and thus may lead to an underestimation of the total cell number. Recent observations show that algal cell abundance on the surfaces of polystyrene and glass (comparable to SiO2 particles) are similar in short term (a week) cultures [53].
Like other substrates for microbial attachment, plastics facilitate the growth of microbial organisms [15,16]. Studies show the attachment of different plankton species on plastic debris, with diatoms in particular being the most abundant species and first colonizers [14,15,53].
C. socialis was cultured in all the three flasks in a f/2 + Si medium. Particles of silica gel in the 3-S flask have a limited potential to contribute to the concentration of dissolved SiO2 even though silica gel for chromatography is generally considered insoluble. The amount of silicon in the SiO2 (silica gel) compared to the silicon as Na2SiO3 as nutrient in the f/2 + Si medium was about 1:1000. However, it should be noted that some forms of amorphous silica gel have a higher dissolution rate in seawater compared to distilled water [65] and that bacteria can promote silica dissolution [66].
It was not possible to determine if SiO2 particles attracted a higher concentration of diatoms compared to microplastics, but their sedimentation is likely the explanation for a net removal of phytoplankton cells from the suspension. Under certain nutrient conditions, C. socialis has been seen to favor chain and aggregate formation [67,68]. Despite the aeration system to promote a gentle mixing of the cultures, silica gel particles, with a high hygroscopicity, may have had an increased sinking rate as some deposition was evident at the bottom of the 3-S culture flask.
At the end of part 1 and the beginning of part 2 (day 7), cell abundance was measured from the culturing flasks. Subsequently part of the culture was filtered and transferred to the 12 quartz cuvettes. Oxygen was measured from each cuvette, the cuvettes were air-tight closed, and CDOM was measured right after. Our results suggest that on this day CDOM concentration (a(355)) was largely determined by cell abundance and growth, with CDOM production dominating over microbial alteration of the CDOM present. In the silica-enriched system 3-S on day 7 we observed the lowest number of cells (Figure 1a,b) and the lowest CDOM absorption (Figure 2a). This may indicate an increased production of particulate organic matter (POM) compared to the dissolved fraction as exudates helping the aggregation and sinking of diatom cells. POM was not measured in the systems; however, the higher values of CDOM in the control system 1-C and the higher DOC concentrations observed in part 2 may support this hypothesis, and we may think that the presence and type of particles influence the partitioning of organic matter into DOM or POM, with the highest amounts of DOM occurring in the absence of particles like microplastics or silica (Figure 2a,b). In a mesocosm experiment a higher concentration (400 particles/L) of the same polystyrene spheres in fact promoted the production of POM [20].
Part two of the experiment was performed in dark conditions; all the alterations of CDOM were related to microbial activity (no photodegradation). Operating at a constant temperature of 20–25 °C, thermal degradation of the organic material was also minimized. Previous leaching tests on the same type of polystyrene beads indicated that no release of CDOM occurred over short periods (weeks) [25].
In the dark incubations (part 2), CDOM spectral slopes and slope ratio indicated changes in the CDOM pool. Changes in spectral slope (S302–322) had an opposite trend to that of SR (Figure 3c,d). Spectral slopes values and SR have been shown to increase with photodegradation and photobleaching and associated with a reduction in molecular weight [61]. Photodegradation and photobleaching were absent in the dark conditions of this part of the experiment. SR has been shown to be sensitive to microbial processes, with a decrease in SR indicating an increase in microbial alteration of CDOM [43,61]. S302–322 and SR may thus be considered complementary indexes and their opposite behavior observed in this study is not contradictory. In general, this trend suggests a reduced microbial alteration of the CDOM pool in the control compared to the other two systems. This hypothesis is supported by the higher dissolved oxygen values in the control flask (part 1, day 7) (Figure 4). DOM freshly produced by phytoplankton may be more biologically available for bacterial reworking when it has not been subject to any prior photo-transformation [37]. Autotrophic and heterotrophic microbial activity (DOM production and processing) is enhanced in the presence of particulate substrates, including plastics [20,25,56].
Our results suggest that CDOM derived from the same phytoplankton species in different conditions (treatments) may have a different biological lability in relation to the substrate on which it is produced. The fact that CDOM (a(355)) was lowest in the 3-S treatment and spectral slope was the highest possibly indicates that CDOM produced in the presence of silica particles (part 1) underwent the highest amount of microbial reworking in the subsequent dark incubation (part 2). We recommend that future studies should address these DOM dynamics and changes in bulk optical parameters by using high-resolution techniques that have recently proven successful to assess DOM components [30,31,32,37].
These first results indicate that SiO2 particles had possibly the strongest effects on microbial CDOM processing. Water insoluble SiO2 particles were used as a proxy for natural inorganic particles in marine environments. However limited, there is the possibility that these particles may interact with diatoms. Nevertheless, the results show that not only the presence, but also the type of suspended particles can influence microbial processing of organic matter in the marine environment.
Carbon export through the formation of diatom aggregates is a well-known pathway [69]. Aggregates also present a high concentration of nutrients and a large number of microorganisms, attracted by these favorable conditions [70]. Since the culture used in the present study was non-axenic, it was possible that the aggregates attracted both autotrophic and heterotrophic organisms, stimulating a competition for inorganic nutrients [70].
What differentiates plastic particles from silica particles (and inorganic substrates in general), is that plastic is an allochthonous material, highly persistent and new to the marine environment. Plastic has been recently and massively (~last 50 years) introduced in our oceans, and the effects on the microbial cycling of carbon and organic matter are shown in the present study to be significant and similar to those of naturally occurring particles. Given that several anthropogenic forcing factors are at work on our oceans, this amplification of DOM processing may be further affected and is in need of further research [27]. Plastic particles can leach several compounds: besides DOC that increases marine bacterial activity [71,72], plastic may contain additives like halogen atoms (e.g., PVC, polyvinyl chloride containing chlorine) that are released during photo-oxidative processes [73]. Many plastics found at sea are positively buoyant and accumulate in the upper ocean layers, where weathering and photo-degradative processes promote the breakdown of larger items into debris of smaller size, along with the leaching of plastic additives and components. Surface waters of productive upwelling systems may be characterized by elevated concentrations of biologically derived halocarbons that contribute to atmospheric halogen concentrations, often associated with diatom blooms [74]. In coastal areas of upwelling systems, the concentration of microplastics might be significant [75], and the smaller the particles, the stronger the interaction of plastic and its leachates with microbial metabolism and microbial organic matter production, processing and release. In these areas, the effects of microplastics might be further amplified by the high biological activity.
With respect to our starting hypotheses, the present study indicates that (1) the presence of particles promotes a higher microbial processing of CDOM; and (2) particles of different materials (inorganic versus plastic) lead to differences in microbial processing of CDOM and potentially, of marine organic matter.
Plastic concentration in the oceans is increasing exponentially, yet there are still many uncertainties as to its effects on marine biogeochemistry. This work was intended to identify important knowledge gaps where further research is needed. The present study, although limited in its extent, shows different effects of inorganic versus plastic substrates on CDOM processes. In light of these considerations, we think that a better understanding of DOM dynamics in the presence of particulate substrates (either biogenic or anthropogenic) is required. Further research that includes the study of other phytoplankton species, different types of plastics, as well as high-resolution methods for DOM characterization (NMR, FT-ICR-MS) is necessary. There is an urgent need for a better understanding of the multiple effects of microplastics on aquatic systems, to inform adequate mitigation and prevention strategies for this global threat. Indeed, it would be very useful to have a commonly agreed standard of marine plastic debris that may be compared to other substrates, as once it is subjected to weathering, plastic will also behave differently in the environment.
We suggest that these dynamics and comparisons are further considered when addressing plastic and microplastics contamination in aquatic systems.

Author Contributions

All authors contributed to the conceptualization, methodology, investigation, data analysis and manuscript writing. All authors have read and agreed to the published version of the manuscript.

Funding

The publication of this paper has been possible with the support of the Marie Curie Alumni Association, through a grant to L. Galgani. This research received no additional external funding.

Institutional Review Board Statement

Not applicable.

Informed Consent Statement

Not applicable.

Data Availability Statement

The data presented in this study will be openly available after publication in the Pangaea Database https://www.pangaea.de.

Acknowledgments

The authors greatly acknowledge the help of S. Lamponi and N. Gaggelli for laboratory equipment and technical assistance, as well as the two anonymous reviewers who provided important suggestions to improve this manuscript.

Conflicts of Interest

The authors declare no conflict of interest.

References

  1. PlasticsEurope. Plastics—The Facts 2020. An Analysis of European Plastics Production, Demand and Waste Data Manufacturers. Available online: https://www.plasticseurope.org/en/resources/publications/4312-plastics-facts-2020 (accessed on 29 January 2021).
  2. Jambeck, J.R.; Andrady, A.; Geyer, R.; Narayan, R.; Perryman, M.; Siegler, T.; Wilcox, C.; Lavender Law, K. Plastic waste inputs from land into the ocean. Science 2015, 347, 768–771. [Google Scholar] [CrossRef]
  3. Schmidt, C.; Krauth, T.; Wagner, S. Export of plastic debris by rivers into the sea. Environ. Sci. Technol. 2017, 51, 12246–12253. [Google Scholar] [CrossRef]
  4. Bellasi, A.; Binda, G.; Pozzi, A.; Galafassi, S.; Volta, P.; Bettinetti, R. Microplastic contamination in freshwater environments: A review, focusing on interactions with sediments and benthic organisms. Environments 2020, 7, 30. [Google Scholar] [CrossRef] [Green Version]
  5. Rochman, C.M.; Brookson, C.; Bikker, J.; Djuric, N.; Earn, A.; Bucci, K.; Athey, S.; Huntington, A.; McIlwraith, H.; Munno, K.; et al. Rethinking microplastics as a diverse contaminant suite. Environ Toxicol Chem. 2019, 38, 703–711. [Google Scholar] [CrossRef] [PubMed] [Green Version]
  6. Worm, B.; Lotze, H.K.; Jubinville, I.; Wilcox, C.; Jambeck, J. Plastic as a persistent marine pollutant. Annu. Rev. Environ. Resour. 2017, 42, 1–26. [Google Scholar] [CrossRef]
  7. Rochman, C.M.; Browne, M.A.; Underwood, A.J.; van Franeker, J.A.; Thompson, R.C.; Amaral-Zettler, L.A. The ecological impacts of marine debris: Unraveling the demonstrated evidence from what is perceived. Ecology 2016, 97, 302–312. [Google Scholar] [CrossRef] [Green Version]
  8. Galloway, T.S.; Cole, M.; Lewis, C. Interactions of microplastic debris throughout the marine ecosystem. Nat. Ecol. Evol. 2017, 1. [Google Scholar] [CrossRef]
  9. Rochman, C.M. The complex mixture, fate and toxicity of chemicals associated with plastic debris in the marine environment. In Marine Anthropogenic Litter; Bergmann, M., Gutow, L., Klages, M., Eds.; Springer: Cham, Switzerland, 2015. [Google Scholar] [CrossRef] [Green Version]
  10. Eriksen, M.; Lebreton, L.C.M.; Carson, H.S.; Thiel, M.; Moore, C.J.; Borerro, J.C.; Galgani, F.; Ryan, P.G.; Reisser, J. Plastic pollution in the world’s oceans: More than 5 trillion plastic pieces weighing over 250,000 tons afloat at sea. PLoS ONE 2014, 9. [Google Scholar] [CrossRef] [PubMed] [Green Version]
  11. van Sebille, E.; Wilcox, C.; Lebreton, L.; Maximenko, N.; Hardesty, B.D.; van Franeker, J.A.; Eriksen, M.; Siegel, D.; Galgani, F.; Law, K.L. A global inventory of small floating plastic debris. Environ. Res. Lett. 2015, 10. [Google Scholar] [CrossRef]
  12. GESAMP Joint Group of Experts on the Scientific Aspects of Marine Environmental Protection. Sources, Fate and Effects of Microplastics in the Marine Environment: Part Two of a Global Assessment; Kershaw, P.J., Rochman, C.M., Eds.; International Maritime Organization: London, UK, 2016; No. 93; 220p. [Google Scholar]
  13. Carpenter, E.J.; Smith, K.L., Jr. Plastics on the Sargasso Sea surface. Science 1972, 175, 1240–1241. [Google Scholar] [CrossRef] [PubMed]
  14. Amaral-Zettler, L.A.; Zettler, E.R.; Mincer, T.J. Ecology of the plastisphere. Nat. Rev. Microbiol. 2020, 18, 139–151. [Google Scholar] [CrossRef]
  15. Reisser, J.; Shaw, J.; Hallegraeff, G.; Proietti, M.; Barnes, D.K.A.; Thums, M.; Wilcox, C.; Hardesty, B.D.; Pattiaratchi, C. Millimeter-sized marine plastics: A new pelagic habitat for microorganisms and invertebrates. PLoS ONE 2014, 9. [Google Scholar] [CrossRef] [Green Version]
  16. Zettler, E.R.; Mincer, T.J.; Amaral-Zettler, L.A. Life in the “Plastisphere”: Microbial Communities on Plastic Marine Debris. Environ. Sci. Technol. 2013, 47, 7137–7146. [Google Scholar] [CrossRef] [PubMed]
  17. Barnes, D.K.A.; Galgani, F.; Thompson, R.C.; Barlaz, M. Accumulation and fragmentation of plastic debris in global environments. Philos. Trans. R. Soc. B Biol. Sci. 2009, 364, 1985–1998. [Google Scholar] [CrossRef] [Green Version]
  18. Rummel, C.D.; Jahnke, A.; Gorokhova, E.; Kühnel, D.; Schmitt-Jansen, M. Impacts of biofilm formation on the fate and potential effects of microplastic in the aquatic environment. Environ. Sci. Technol. Lett. 2017, 4, 258–267. [Google Scholar] [CrossRef] [Green Version]
  19. Dang, H.; Lovell, C.R. Microbial surface colonization and biofilm development in marine environments. Microbiol. Mol. Biol. Rev. 2016, 80, 91–138. [Google Scholar] [CrossRef] [Green Version]
  20. Galgani, L.; Tsapakis, M.; Pitta, P.; Tsiola, A.; Tzempelikou, E.; Kalantzi, I.; Esposito, C.; Loiselle, A.; Tsotskou, A.; Zivanovic, S.; et al. Microplastics increase the marine production of particulate forms of organic matter. Environ. Res. Lett. 2019, 14, 124085. [Google Scholar] [CrossRef] [Green Version]
  21. Michels, J.; Stippkugel, A.; Lenz, M.; Wirtz, K.; Engel, A. Rapid aggregation of biofilm-covered microplastics with marine biogenic particles. Proc. R. Soc. B Boil. Sci. 2018, 285, 20181203. [Google Scholar] [CrossRef] [Green Version]
  22. van Sebille, E.; Aliani, S.; Law, K.L.; Maximenko, N.; Alsina, J.M.; Bagaev, A.; Bergmann, M.; Chapron, B.; Chubarenko, I.; Cózar, A.; et al. The physical oceanography of the transport of floating marine debris. Environ. Res. Lett. 2020, 15. [Google Scholar] [CrossRef] [Green Version]
  23. Kowalski, N.; Reichardt, A.M.; Waniek, J.J. Sinking rates of microplastics and potential implications of their alteration by physical, biological, and chemical factors. Mar. Pollut. Bull. 2016, 109, 310–319. [Google Scholar] [CrossRef]
  24. Kvale, K.; Prowe, A.E.F.; Chien, C.T.; Landolfi, A.; Oschlies, A. The global biological microplastic particle sink. Sci. Rep. 2020, 10, 16670. [Google Scholar] [CrossRef]
  25. Galgani, L.; Engel, A.; Rossi, C.; Donati, A.; Loiselle, S.A. Polystyrene microplastics increase microbial release of marine Chromophoric Dissolved Organic Matter in microcosm experiments. Sci. Rep. 2018, 8. [Google Scholar] [CrossRef] [PubMed]
  26. Galgani, L.; Loiselle, S.A. Plastic accumulation in the sea surface microlayer: An experiment-based perspective for future studies. Geoscience 2019, 9, 66. [Google Scholar] [CrossRef] [Green Version]
  27. Galgani, L.; Loiselle, S.A. Plastic pollution impacts on marine carbon biogeochemistry. Environ. Pollut. 2021, 268. [Google Scholar] [CrossRef]
  28. Moran, M.A.; Kujawinski, E.B.; Stubbins, A.; Fatland, R.; Aluwihare, L.I.; Buchan, A.; Crump, B.C.; Dorrestein, P.C.; Dyhrman, S.T.; Hess, N.J.; et al. Deciphering ocean carbon in a changing world. Proc. Natl. Acad. Sci. USA 2016, 113, 3143–3151. [Google Scholar] [CrossRef] [Green Version]
  29. Repeta, D.J. Chemical characterization and cycling of dissolved organic matter. In Biogeochemistry of Marine Dissolved Organic Matter, 2nd ed.; Hansell, D.A., Carlson, C.A., Eds.; Academic Press: Boston, MA, USA, 2015; pp. 21–63. [Google Scholar] [CrossRef]
  30. Riedel, T.; Zark, M.; Vähätalo, A.V.; Niggemann, J.; Spencer, R.G.M.; Hernes, P.J.; Dittmar, T. Molecular Signatures of Biogeochemical Transformations in Dissolved Organic Matter from Ten World Rivers. Front. Earth Sci. 2016, 4, 4. [Google Scholar] [CrossRef] [Green Version]
  31. Berg, S.M.; Whiting, Q.T.; Herrli, J.A.; Winkels, R.; Wammer, K.H.; Remucal, C.K. The Role of Dissolved Organic Matter Composition in Determining Photochemical Reactivity at the Molecular Level. Environ. Sci. Technol. 2019, 53, 11725–11734. [Google Scholar] [CrossRef]
  32. Maizel, A.C.; Li, J.; Remucal, C.K. Relationships Between Dissolved Organic Matter Composition and Photochemistry in Lakes of Diverse Trophic Status. Environ. Sci. Technol. 2017, 51, 9624–9632. [Google Scholar] [CrossRef]
  33. Dittmar, T.; Stubbins, A. 12.6—Dissolved Organic Matter in aquatic systems. In Treatise on Geochemistry, 2nd ed.; Holland, H.D., Turekian, K.K., Eds.; Elsevier: Oxford, UK, 2014; pp. 125–156. [Google Scholar] [CrossRef]
  34. Coble, P.G. Marine optical biogeochemistry: The chemistry of ocean color. Chem. Rev. 2007, 107, 402–418. [Google Scholar] [CrossRef]
  35. Nelson, N.B.; Siegel, D.A. The global distribution and dynamics of Chromophoric Dissolved Organic Matter. Annu. Rev. Mar. Sci. 2013, 5, 447–476. [Google Scholar] [CrossRef] [PubMed] [Green Version]
  36. Kramer, G.D.; Herndl, G.J. Photo- and bioreactivity of chromophoric dissolved organic matter produced by marine bacterioplankton. Aquat. Microb. Ecol. 2004, 36, 239–246. [Google Scholar] [CrossRef]
  37. Bittar, T.B.; Vieira, A.A.H.; Stubbins, A.; Mopper, K. Competition between photochemical and biological degradation of dissolved organic matter from the cyanobacteria Microcystis aeruginosa. Limnol. Oceanogr. 2015, 60, 1172–1194. [Google Scholar] [CrossRef]
  38. Kieber, D.J.; McDaniel, J.; Mopper, K. Photochemical source of biological substrates in sea water: Implications for carbon cycling. Nature 1989, 341, 637–639. [Google Scholar] [CrossRef]
  39. Loiselle, S.; Vione, D.; Minero, C.; Maurino, V.; Tognazzi, A.; Dattilo, A.M.; Rossi, C.; Bracchini, L. Chemical and optical phototransformation of dissolved organic matter. Water Res. 2012, 46, 3197–3207. [Google Scholar] [CrossRef]
  40. Siegel, D.A.; Maritorena, S.; Nelson, N.B.; Hansell, D.A.; Lorenzi-Kayser, M. Global distribution and dynamics of colored dissolved and detrital organic materials. J. Geophys. Res. Space Phys. 2002, 107, 21. [Google Scholar] [CrossRef]
  41. Mopper, K.; Zhou, X.; Kieber, R.J.; Kieber, D.J.; Sikorski, R.J.; Jones, R.D. Photochemical degradation of dissolved organic carbon and its impact on the oceanic carbon cycle. Nat. Cell Biol. 1991, 353, 60–62. [Google Scholar] [CrossRef]
  42. Bracchini, L.; Dattilo, A.M.; Falcucci, M.; Hull, V.; Tognazzi, A.; Rossi, C.; Loiselle, S.A. Competition for spectral irradiance between epilimnetic optically active dissolved and suspended matter and phytoplankton in the metalimnion. Consequences for limnology and chemistry. Photochem. Photobiol. Sci. 2011, 10, 1000–1013. [Google Scholar] [CrossRef] [PubMed]
  43. Galgani, L.; Engel, A. Changes in optical characteristics of surface microlayers hint to photochemically and microbially mediated DOM turnover in the upwelling region off the coast of Peru. Biogeosciences 2016, 13, 2453–2473. [Google Scholar] [CrossRef] [Green Version]
  44. Ortega-Retuerta, E.; Passow, U.; Duarte, C.M.; Reche, I. Effects of ultraviolet B radiation on (not so) transparent exopolymer particles. Biogeosciences 2009, 6, 3071–3080. [Google Scholar] [CrossRef] [Green Version]
  45. Tilstone, G.H.; Airs, R.L.; Vicente, V.M.; Widdicombe, C.; Llewellyn, C. High concentrations of mycosporine-like amino acids and colored dissolved organic matter in the sea surface microlayer off the Iberian Peninsula. Limnol. Oceanogr. 2010, 55, 1835–1850. [Google Scholar] [CrossRef]
  46. Mustaffa, N.I.H.; Badewien, T.H.; Ribas-Ribas, M.; Wurl, O. High-resolution observations on enrichment processes in the sea-surface microlayer. Sci. Rep. 2018, 8. [Google Scholar] [CrossRef] [PubMed] [Green Version]
  47. Mustaffa, N.I.H.; Ribas-Ribas, M.; Wurl, O. High-resolution variability of the enrichment of fluorescence dissolved organic matter in the sea surface microlayer of an upwelling region. Elem. Sci. Anth. 2017, 5. [Google Scholar] [CrossRef] [Green Version]
  48. Stolle, C.; Ribas-Ribas, M.; Badewien, T.H.; Barnes, J.; Carpenter, L.J.; Chance, R.; Damgaard, L.R.; Quesada, A.M.D.; Engel, A.; Frka, S.; et al. The MILAN campaign: Studying diel light effects on the air–sea interface. Bull. Am. Meteorol. Soc. 2020, 101, E146–E166. [Google Scholar] [CrossRef] [Green Version]
  49. Miranda, M.L.; Mustaffa, N.I.H.; Robinson, T.B.; Stolle, C.; Ribas-Ribas, M.; Wurl, O.; Zielinski, O. Influence of solar radiation on biogeochemical parameters and fluorescent dissolved organic matter (FDOM) in the sea surface microlayer of the southern coastal North Sea. Elem. Sci. Ant. 2018, 6. [Google Scholar] [CrossRef] [Green Version]
  50. Wright, R.J.; Erni-Cassola, G.; Zadjelovic, V.; Latva, M.; Christie-Oleza, J. Marine plastic debris—A new surface for microbial colonization. Environ. Sci. Technol. 2020, 54, 11657–11672. [Google Scholar] [CrossRef]
  51. Pinto, M.; Langer, T.M.; Hüffer, T.; Hofmann, T.; Herndl, G.J. The composition of bacterial communities associated with plastic biofilms differs between different polymers and stages of biofilm succession. PLoS ONE 2019, 14, e0217165. [Google Scholar] [CrossRef] [Green Version]
  52. Harrison, J.P.; Sapp, M.; Schratzberger, M.; Osborn, A.M. Interactions Between Microorganisms and Marine Microplastics: A Call for Research. Mar. Technol. Soc. J. 2011, 45, 12–20. [Google Scholar] [CrossRef]
  53. Zhao, S.; Zettler, E.R.; Amaral-Zettler, L.A.; Mincer, T.J. Microbial carrying capacity and carbon biomass of plastic marine debris. ISME J. 2021, 15, 67–77. [Google Scholar] [CrossRef]
  54. Rogers, K.L.; Carreres-Calabuig, J.A.; Gorokhova, E.; Posth, N.R. Micro-by-micro interactions: How microorganisms influence the fate of marine microplastics. Limnol. Oceanogr. Lett. 2020, 5, 18–36. [Google Scholar] [CrossRef] [Green Version]
  55. Olapade, O.A.; Leff, L.G. Influence of dissolved organic matter and inorganic nutrients on the biofilm bacterial community on artificial substrates in a northeastern Ohio, USA, stream. Can. J. Microbiol. 2006, 52, 540–549. [Google Scholar] [CrossRef] [PubMed]
  56. Paerl, H.W. Microbial attachment to particles in marine and freshwater ecosystems. Microb. Ecol. 1975, 2, 73–83. [Google Scholar] [CrossRef]
  57. Marine Biological Laboratory (Woods Hole, Mass); Cavanaugh, G.M. Formulae and Methods VI: [i.e., 4th ed.] of the Marine Biological Laboratory Chemical Room; Woods Hole Oceanographic Institution: Woods Hole, MA, USA, 1956. [Google Scholar]
  58. Geyer, R.; Jambeck, J.R.; Law, K.L. Production, use, and fate of all plastics ever made. Sci. Adv. 2017, 3, e1700782. [Google Scholar] [CrossRef] [PubMed] [Green Version]
  59. Bricaud, A.; Morel, A.; Prieur, L. Absorption by dissolved organic matter of the sea (yellow substance) in the UV and visible domains1. Limnol. Oceanogr. 1981, 26, 43–53. [Google Scholar] [CrossRef]
  60. Loiselle, S.A.; Bracchini, L.; Dattilo, A.M.; Ricci, M.; Tognazzi, A.; Cózar, A.; Rossi, C. The optical characterization of chromophoric dissolved organic matter using wavelength distribution of absorption spectral slopes. Limnol. Oceanogr. 2009, 54, 590–597. [Google Scholar] [CrossRef]
  61. Helms, J.R.; Stubbins, A.; Ritchie, J.D.; Minor, E.C.; Kieber, D.J.; Mopper, K. Absorption spectral slopes and slope ratios as indicators of molecular weight, source, and photobleaching of chromophoric dissolved organic matter. Limnol. Oceanogr. 2008, 53, 955–969. [Google Scholar] [CrossRef] [Green Version]
  62. Ribera d’Alcalà, M.; Conversano, F.; Corato, F.; Licandro, P.; Mangoni, O.; Marino, D.; Mazzocchi, M.G.; Modigh, M.; Montresor, M.; Nardella, M.; et al. Seasonal patterns in plankton communities in a pluriannual time series at a coastal Mediterranean site (Gulf of Naples): An attempt to discern recurrences and trends. Sci. Mar. 2004, 68, 65–83. [Google Scholar] [CrossRef] [Green Version]
  63. Fichot, C.G.; Benner, R. A novel method to estimate DOC concentrations from CDOM absorption coefficients in coastal waters. Geophys. Res. Lett. 2011, 38. [Google Scholar] [CrossRef]
  64. Norrman, B.; Zwelfel, U.L.; Hopkinson, C.S.; Brian, F. Production and utilization of dissolved organic carbon during an experimental diatom bloom. Limnol. Oceanogr. 1995, 40, 898–907. [Google Scholar] [CrossRef] [Green Version]
  65. Kato, K.; Kitano, Y. Solubility and Dissolution Rate of Amorphous Silica in Distilled and Sea Water at 20 °C. J. Oceanogr. 1968, 24, 147–152. [Google Scholar] [CrossRef] [Green Version]
  66. Bidle, K.D.; Azam, F. Accelerated dissolution of diatom silica by marine bacterial assemblages. Nature 1999, 397, 508–512. [Google Scholar] [CrossRef]
  67. Harrison, P.J.; Thompson, P.A.; Calderwood, G.S. Effects of nutrient and light limitation on the biochemical composition of phytoplankton. Environ. Boil. Fishes 1990, 2, 45–56. [Google Scholar] [CrossRef]
  68. Wear, E.K.; Carlson, C.A.; Windecker, L.A.; Brzezinski, M.A. Roles of diatom nutrient stress and species identity in determining the short- and long-term bioavailability of diatom exudates to bacterioplankton. Mar. Chem. 2015, 177, 335–348. [Google Scholar] [CrossRef]
  69. Tréguer, P.; Bowler, C.; Moriceau, B.; Dutkiewicz, S.; Gehlen, M.; Aumont, O.; Bittner, L.; Dugdale, R.; Finkel, Z.; Iudicone, D.; et al. Influence of diatom diversity on the ocean biological carbon pump. Nat. Geosci. 2018, 11, 27–37. [Google Scholar] [CrossRef]
  70. Mincer, T.J.; Zettler, E.R.; Amaral-Zettler, L.A. Biofilms on plastic debris and their influence on marine nutrient cycling, productivity, and hazardous chemical mobility. In The Handbook of Environmental Chemistry; Takada, H., Karapanagioti, H., Eds.; Springer: Cham, Switzerland, 2016; Volume 78, pp. 221–233. [Google Scholar] [CrossRef]
  71. Romera-Castillo, C.; Pinto, M.; Langer, T.M.; Álvarez-Salgado, X.A.; Herndl, G.J. Dissolved organic carbon leaching from plastics stimulates microbial activity in the ocean. Nat. Commun. 2018, 9. [Google Scholar] [CrossRef]
  72. Zhu, L.; Zhao, S.; Bittar, T.B.; Stubbins, A.; Li, D. Photochemical dissolution of buoyant microplastics to dissolved organic carbon: Rates and microbial impacts. J. Hazard. Mater. 2020, 383, 121065. [Google Scholar] [CrossRef]
  73. Gewert, B.; Plassmann, M.M.; MacLeod, M. Pathways for degradation of plastic polymers floating in the marine environment. Environ. Sci. Process. Impacts 2015, 17, 1513–1521. [Google Scholar] [CrossRef] [Green Version]
  74. Hepach, H.; Quack, B.; Tegtmeier, S.; Engel, A.; Bracher, A.; Fuhlbrügge, S.; Galgani, L.; Atlas, E.L.; Lampel, J.; Frieß, U.; et al. Biogenic halocarbons from the Peruvian upwelling region as tropospheric halogen source. Atmos. Chem. Phys. Discuss. 2016, 16, 12219–12237. [Google Scholar] [CrossRef] [Green Version]
  75. Cornejo-D’Ottone, M.; Molina, V.; Pavez, J.; Silva, N. Greenhouse gas cycling by the plastisphere: The sleeper issue of plastic pollution. Chemosphere 2020, 246. [Google Scholar] [CrossRef] [PubMed]
Figure 1. (a) Daily cell numbers from optical density (OD) measurements, per treatment. Each data point is the average of three replicate measurements per culturing flask (±standard deviation); (b) cumulative cell numbers per treatment.
Environments 08 00021 g001
Figure 2. (a) Daily a(355) values per treatment during experimental part 2. Each data point is the average of four replicate cuvettes (± standard deviation); (b) normalized daily anomalies per each treatment during experimental part 2. Box plots have the following color code: 1-C (black line), 2-PS (blue line) and 3-S (red line).
Environments 08 00021 g002
Figure 3. Daily values of spectral slope S302–322 (a) and slope ratio (SR) (b) for each treatment during part 2 of the experiment. Each data point is the average of four replicate cuvettes (± standard deviation); Normalized daily anomalies per each treatment during experimental part 2 for spectral slope S302–322 (c) and slope ratio (SR) (d). Box plots have the following color code: 1-C (black line), 2-PS (blue line) and 3-S (red line).
Environments 08 00021 g003aEnvironments 08 00021 g003b
Figure 4. Initial oxygen concentrations per treatment (t7). Per each box plot, n = 200 (50 measurements per cuvette, for 4 replicate cuvettes each treatment). Box plots have the following color code: 1-C (black line), 2-PS (blue line) and 3-S (red line).
Environments 08 00021 g004
Table 1. Initial (day 0), middle (day 7) and final (day 11) cell numbers (number per mL) in the three treatments (1-C, 2-PS and 3-C) measured via optical density. Cell concentration on day 7 refers to the concentration measured prior filtration from each system, before experimental part 2.
TreatmentInitial Time (Day 0)Middle Time (Day 7)Final Time (Day 11)
1-C (control)3.14 × 10⁴ ± 7191.10 × 105 ± 351.40 × 10⁵ ± 198
2-PS (microplastics)5.33 × 10⁴ ± 12371.11 × 105 ± 2131.34 × 105 ± 137
3-S (SiO2)2.83 × 10⁴ ± 4221.03 × 105 ± 1791.27 × 105 ± 303
Publisher’s Note: MDPI stays neutral with regard to jurisdictional claims in published maps and institutional affiliations.

