Article

Assessing Energy-Based CO2 Emission and Workers’ Health Risks at the Shipbreaking Industries in Bangladesh

1
Department of Environment Science and Disaster Management, Noakhali Science and Technology University, Noakhali 3814, Bangladesh
2
Department of Chemistry, South Banasree Model High School and College, Dhaka 1219, Bangladesh
3
Faculty of Earth Science, University Malaysia Kelantan, Jeli 17600, Malaysia
4
College of Natural Resources, University of Wisconsin, Stevens Point, WI 54481, USA
5
Department of Environmental Science, School of Environmental Science and Management, Independent University Bangladesh, Dhaka 1219, Bangladesh
*
Author to whom correspondence should be addressed.
Environments 2020, 7(5), 35; https://doi.org/10.3390/environments7050035
Submission received: 2 March 2020 / Revised: 15 April 2020 / Accepted: 26 April 2020 / Published: 30 April 2020

Abstract

:
The study represents the estimation of energy-based CO2 emission and the health risks of workers involved in the shipbreaking industries in Sitakunda, Bangladesh. To calculate the carbon emission (CE) from three shipbreaking activities, i.e., metal gas cutting (GC), diesel fuel (FU) and electricity consumption (EC), we used the Intergovernmental Panel on Climate Change (IPCC) guidelines and Environmental Protection Agency (EPA)’s Emission and Generation Resource Integrated Database (eGRID) emission factors. Moreover, the geographic weighted regression (GWR) model was applied to assess the contribution of influencing factors of CE throughout the sampling points. To assess the workers’ health condition and their perceptions on environmental degradation, a semi-structured questionnaire survey among 118 respondents were performed. The results showed that total CO2 emissions from GC were 0.12 megatons (MT), 11.43 MT, and 41.39 MT for daily, monthly, and yearly respectively, and the values were significantly higher than the surrounding control area. Emissions from the FU were estimated as daily: 0.85 MT, monthly: 1.92 MT, and yearly: 17.91 MT, which were significantly higher than EC. The study also revealed that workers were very susceptible to accidental hazards especially death (91%), and pollution (79%). Environmental consequences and health risks of the workers in shipbreaking industry warrant more attention nationally and internationally at the industry-level.

1. Introduction

Shipbreaking is a growing industry globally with noted economic importance and concerns on environmental and social justice issues. The industry has grown over the past three decades all over the world, where South Asia, China, South Korea and Turkey have the greatest contribution. Specifically, South Asia accounts for about 70–80% of the international market [1]. Bangladesh, as a well-known maritime nation and one of the largest deltas in the world, with a 710 km long coastline [2,3,4,5], claims to be the second largest among the shipbreaking nations in the world after South Korea [6,7]. Currently, there are about 125 shipyards and workshops throughout the country, mostly located along the coastal belt [8]. Although it took a long time to declare shipbreaking activity as an industry in Bangladesh, the industry plays a significant role in the macro and micro economy of poverty-stricken Bangladesh [9]. The estimated annual turnover of the shipbreaking industry in Bangladesh is about 1.5 billion dollars, which contributes to 0.5% of the total gross domestic product (GDP). Currently, the country needs about 50,000 tons of metals and steels annually. With a great demand for a large amount of metal or steels, shipbreaking yards have become an emerging sector for manufacturing raw materials in Bangladesh. It provides about 60% of the country’s total demand for steel [4,6,8]. Besides the favorable geographic location and network of the coastal zone of the country, abundance of cheap labor and negligent environmental regulations are claimed to be influential factors for the expansion of shipbreaking industries [6].
Despite having great economic prospects, shipbreaking has many environmental concerns, including carbon emissions, discharge of high amounts of disposable materials and toxic substances into surrounding soils and water causing environmental degradation [6,10,11]. Previous studies have identified the adverse environmental impacts and the sustainability of ship-breaking activities [4,9,10,12,13,14,15,16,17,18]. Most of the articles focused on the law and policy, economic impact, impact on health and safety, environmental impact and waste management, life cycle assessment (LCA) and current training process in the yards [19]. Islam and Hossain found toxic ammonia pollution in soil and sea water around the ship scraping areas in Bangladesh. A comprehensive study on shipbreaking industries and their impact on coastal areas of Chittagong was conducted by Hossain and Islam [9]. Several researchers have identified the shipbreaking industry as a potential source of heavy metal pollution, i.e., iron (Fe), manganese (Mn), chromium (Cr), nickel (Ni), zinc (Zn), lead (Pb), cadmium (Cd) and mercury (Hg), which can risk the food chain, causing bioaccumulation and biomagnification [20,21,22,23,24,25]. Not only the heavy metal pollution but also the organic and potential toxic elements’ contamination, such as polycyclic aromatic hydrocarbons (PAHs), short-chain chlorinated paraffins (SCCPs), Dichloro Diphenyl Trichloroethanes (DDTs), hexachlorobenzene (HCB) and polychlorinated biphenyls (PCBs), during ship dismantling were focused in a few studies [26,27]. Besides, solid wastes including paint chips, plastics, glass wool, solid ozone-depleting substances (ODS), asbestos, polyvinyl chloride (PVC), etc., and liquid wastes including volatile organic compounds (VOCs), organic and inorganic liquids, oils (released from hydraulics, engines, lubrication processes and bilges), persistent organic pollutants (POPs), etc., can be released from this activity [28,29].
According to the Intergovernmental Panel on Climate Change (IPCC), CO2 is the largest contributor among the six kinds of greenhouse gas (GHG) and its share of greenhouse effect is about 56%. Investigation of how energy-related CO2 emissions change over time becomes, thus, a major issue in formulating both energy and environmental policies [30,31]. In terms of carbon emission, a recent study [32] revealed the assessment of CO2 emission during all the stages of a ship recycling process. It compared the environmental impacts produced from ship recycled iron scraps with the virgin iron ore and argued that, through the whole life cycle consisting of seven stages, a total of 280 kg CO2 equivalent (eq) can be emitted per ton of rebar used. Among the stages, the study prioritized stage 7, including electricity and natural gas use for further attention to reduce associated environmental impacts [32]. Besides, it showed the impacts on human health during the whole life cycle using the IMPACT 2002+ tool. During all the stages of ship recycling, fuels, i.e., diesel, heavy fuel oil, natural gas and liquefied petroleum gas (LPG), are used. The fuel-based CO2 emission was estimated in several studies using the method provided by the IPCC [33]. On the other hand, the authors of Reference [34] discussed the reduction of CO2 emission utilizing the role of material efficiency.
Apart from the environmental impacts, a large number of laborers working in the shipyards are highly vulnerable to the hazards caused by shipbreaking activities. Over the last 20 years, more than 400 workers were killed and 6000 were seriously injured in Bangladesh shipyards due to uncontrolled shipbreaking activities [35]. Recently, one of the shipbreaking yards of Sitolpur, Sitakunda, experienced two workers’ deaths caused by fire from a gas cylinder [36]. Workers, generally, use handheld blowtorches, cutters and other tools to dismantle decades-old vessels, and they frequently transport the jagged scrap metals with bare hands to recycling sites. Thus, the dismantling process exposes workers to toxic paints, asbestos and hazardous wastes, not to mention burns, cuts and broken bones caused by falls [35,37]. There are several studies which have worked on the workplace hazards and legal regulations in Bangladesh [4,6,23,27]. However, multiple studies have addressed some issues related to the subjectivity of the information provided by the workers [38,39]. They argued that the industry becomes the part of international politics where non-governmental organizations (NGOs) tend to establish unacceptability for unfavorable conditions and the owners focus on the reasons for acceptability.
From the perspectives mentioned above, this study aims to find out the condition of workers by receiving their own opinions on whether they are susceptible to the hazards or not. Besides, this study focuses on the estimation of the energy-based CO2 emission from shipyard activities such as gas cutting, fuel use and the electricity consumption in Sitakunda by following IPCC and Environmental Protection Agency (EPA) guidelines regarding shipbreaking activities in Sitakunda, Bangladesh. Finally, this study uses the geographic weighted regression (GWR) model to explore the heterogeneity of the influencing factors of CO2 emission in the shipyards.

2. Materials and Methods
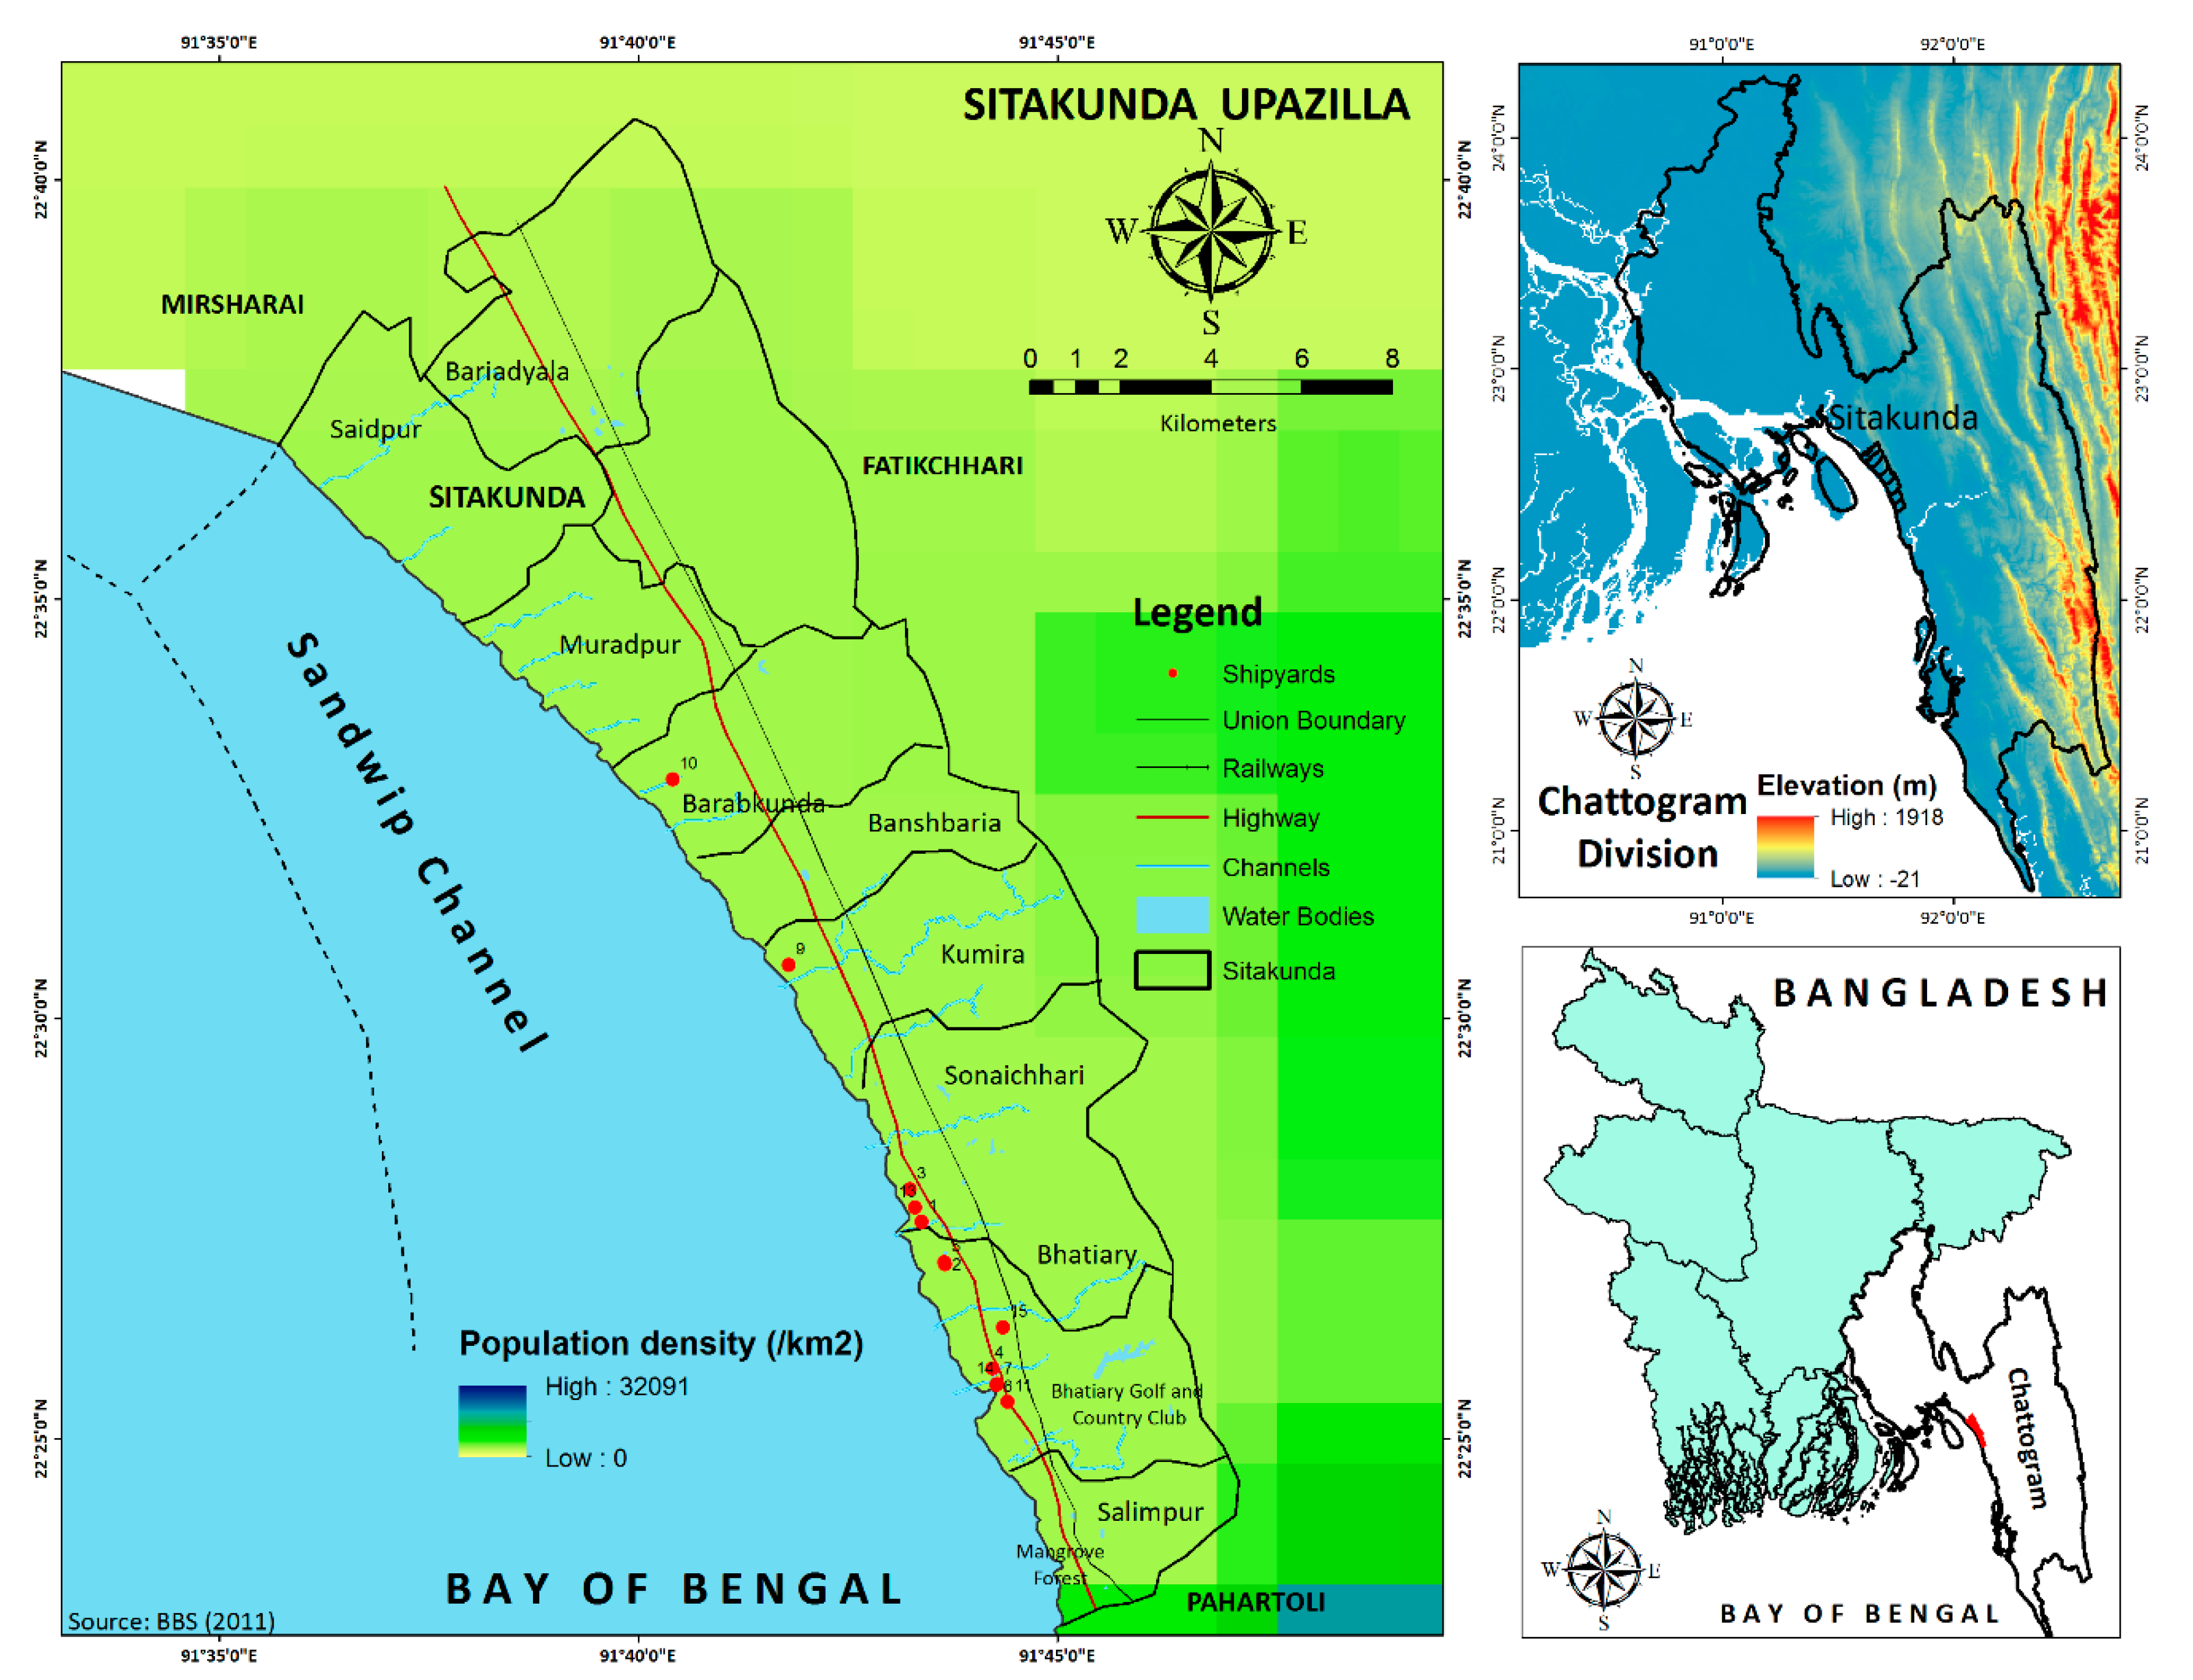
2.1. Study Area

In Bangladesh, about 20% of the shipbreaking yards are situated in the Chattogram Division [40]. Nearly all of those shipbreaking yards are located in Sitakunda, one of the most important upazila (administrative unit of a district) of the Chattogram district in Bangladesh, as the city grows toward this upazila.
Shipbreaking industries are mainly concentrated in this upazila because of its location near the Bay of Bengal. Sitakunda is located in between 22°22′ and 22°42′ north latitudes and in between 91°34′ and 91°48′ east longitudes, with an area of 483.97 km2. It is surrounded by Mirsharai and Fatikchhari upazilas on the north, Pahartali thana on the south, Fatikchhari and Hathazari upazilas and Panchlaish thana on the east and Sandwip upazila and Sandwip channel on the west [41]. The convenient geographical position and the oblique shape of the Bay of Bengal have facilitated the establishment and flourishing of shipbreaking activities in Sitakunda. Salimpur, Bhatiary, Kumira and Bar Aoulia Unions of Sitakunda upazila accompanied by 7 km of coastline mainly accounted for the shipbreaking industry. This area is now centered on shipbreaking scrap business as well as steel industries (Figure 1).

2.2. Estimation of Energy-Based CO2 Emission

The shipbreaking industry of Bangladesh mostly relies on LPG, oxygen, electricity and diesel to complete their overall metal cutting procedure. In this study, we conducted an extensive yard survey to find out and estimate energy usage of shipbreaking activities. The Bangladeshi LPG Companies, specially named Jamuna Gas/Jamuna Spacetech Joint Venture Limited (Dhaka, Bangladesh), Omera LPG/Omera Petroleum Ltd. (Dhaka, Bangladesh), primarily supply the LPG and oxygen cylinders for the industries. In shipbreaking sites, 12 kg LPG cylinders are preferably used as they are easy to handle for lifting on the ship decks and then into the superstructures. Diesel and electricity power are used for diesel-powered cranes and for illumination purposes, along with fluid removing operations, respectively. To estimate the energy-based CO2 emission from this sector, this study followed the guidelines given by IPCC and used the stoichiometric ratios as the calculation of emissions from LPG and diesel fuel [33,42].
C E i t = C E i j t = E i j t × E F j × ( 1 C S j t ) × O j × M
where, C E i t represents total CO2 emission in year t (in tons, t), C E i j t represents the total CO2 emission of the i sector in year t, E i j t represents total energy consumption of the i sector in year t (TJ), E F j represents the carbon emission factor of the j fuel (tC/TJ), C S j t represents the fraction of the jth fuel that is not oxidized as raw materials in year t, O j represents the fraction of carbon oxidized based on fuel type j and M represents the molecular weight ratio of carbon dioxide to carbon (44/12).
The carbon emission factors (EFs) and the fraction of carbon oxidized (FCO) are given in Table 1. As fuel is used as a raw material for the manufacturing of products, it was excluded from the total energy consumption in this paper. These values were assumed to be constant over the time period of the study. We used Equation (1) to calculate CO2 emission from gas cutter and diesel fuel only.
However, to calculate the carbon emission from electricity consumption, we used the US EPA’s GRID emission factors [43], where the standard for daily CO2 emission from 1 kw is 0.0005925 metric tons (MT). Fifteen shipyards had been visited to collect their activity information on the basis of permission from respective authorities to get the required data for CO2 emission calculation. To compare the CO2 emission results of the shipbreaking area, a non-shipbreaking yard area’s emission was considered as a control emission. For calculating the control value, 54 respondents were interviewed from the non-shipbreaking yard area and they were asked about their consumption of fuel, gas and electricity in their daily life. The average value of the 54 responses gave each of the single control values for gas, fuel and electricity.
For mapping the spatial distribution of carbon emission in study areas, point-based interpolation methods, namely the inverse distance weighted (IDW) technique and geographical information systems (GIS), were applied. The main formula followed in the IDW method is given as Equation (2):
B p = i = 1 N w i B i i = 1 N w i
where, Bp means the unknown number of carbon emission, Bi means the number of known points, N means the amount of data points and wi means the weighting of each point. Weights can be calculated as a function of the distance between the reference and interpolation points (Equations (3) and (4)):
w i = 1 d i k
d i = ( x 1 x 2 ) 2 + ( y 1 y 2 ) 2
where di is the horizontal distance between the interpolation point (x1, y1) and the reference points (x2, y2), k is the power of the distance and i = 1, 2, 3, …, n [44,45,46]. To run the spatial interpolation process, this study used ArcGIS 10.3 (ESRI, Boston, CA, USA).

2.3. Geographic Weighted Regression (GWR) Model

GWR uses the coordinates of the samples and utilizes the local weighted least square method to assess the parameters, which is an advanced version of the general linear regression model. This model can be expressed as in the following Equation (Equation (5)) given by Reference [47]:
y i = β 0 ( u i ,   v i ) + k β j ( u i , v i ) x i j + ϵ
where, y i = calculated CO2 emissions of shipyards, x i = explanatory factors which were gas cutter, fuel use and electricity consumption, β i = parameters to be estimated, k = effective number of independent variables, ϵ = random error and β j ( u i , v i ) = j regression parameter at the i sampling point, and is a function of the geographical coordinates which can be estimated by the following Equation:
β j ( u i , v i ) = [ X T W ( u i , v i ) X ] 1 X T W ( u i , v i ) Y
where, W ( u i , v i )   = weighting matrix, which can be determined by the Gaussian kernel function (GKF). The GKF can be written as follows:
w i j = e x p ( ( d i j b ) 2 )
where, dij = distance between observation i and j, and b = kernel bandwidth. To implement the GWR model, the study used the ‘spgwr’ package from R 3.6.3 working station (R core team) [48]. To run the model, it is compulsory to know about the spatial autocorrelation among the sample points. Therefore, before running this model, Moran’s I spatial autocorrelation was examined. In this study, this method was chosen to investigate the spatial correlation of CO2 emission among the sample points. The equation of Moran’s I is given below:
M o r a n s   I = i = 1 n j = 1 n W i j ( y i y ¯ ) ( y j y ¯ ) 1 n i = 1 n ( y i y ¯ ) 2 i = 1 n j = 1 n W i j
where, W i j = spatial weight matrix estimated by the Gaussian function, yi = observation of the i union, yj = observation of the j union and y ¯ = mean emission of all unions. To calculate the Moran’s I, the study used the ‘ape’ package from R3.6.3 working station [49].

2.4. Assessment of Workers’ Condition and Environmental Consequences

This study investigated the effects of shipyard activities on the workers along with environmental consequences. It drew ethnographic research carried out in the 15 shipyards of Sitakunda between 2 October 2018 and 30 November 2018. In-person questionnaire interviews with participants’ observations were the main methods used in this study. These techniques enabled the collection of quantitative and qualitative data eliciting responses from 118 workers and staff, including cutter mens’ (50%), loaders’ (17%) and managers’ (33%) views on shipbreaking activities. The respondents were asked to assess their perception of environmental consequences from shipyard activities and the perceived impacts of this on a range of their livelihood parameters. All the interviews were conducted using local language with older, middle-aged and young men and women covering all groups of laborers working in shipyards. Since there is an issue of biasness of the responses from the workers directly or indirectly forced by yard owners, it should be noted that the first author of this study was a local and a citizen of Bangladesh, which was the key to get secure access to the yards, and thus the author interviewed the workers undercover with the assistance of the Department of Environmental Science and Disaster Management of Noakhali Science and Technology University. The mixed quantitative and qualitative methods employed in the study enabled findings to be triangulated and robust results to be drawn. Moreover, these complementary methods allowed to explore the issues and problems related to shipping yard activities. Section 3.3 reports the findings of the analysis from the perception of the respondents.

3. Results

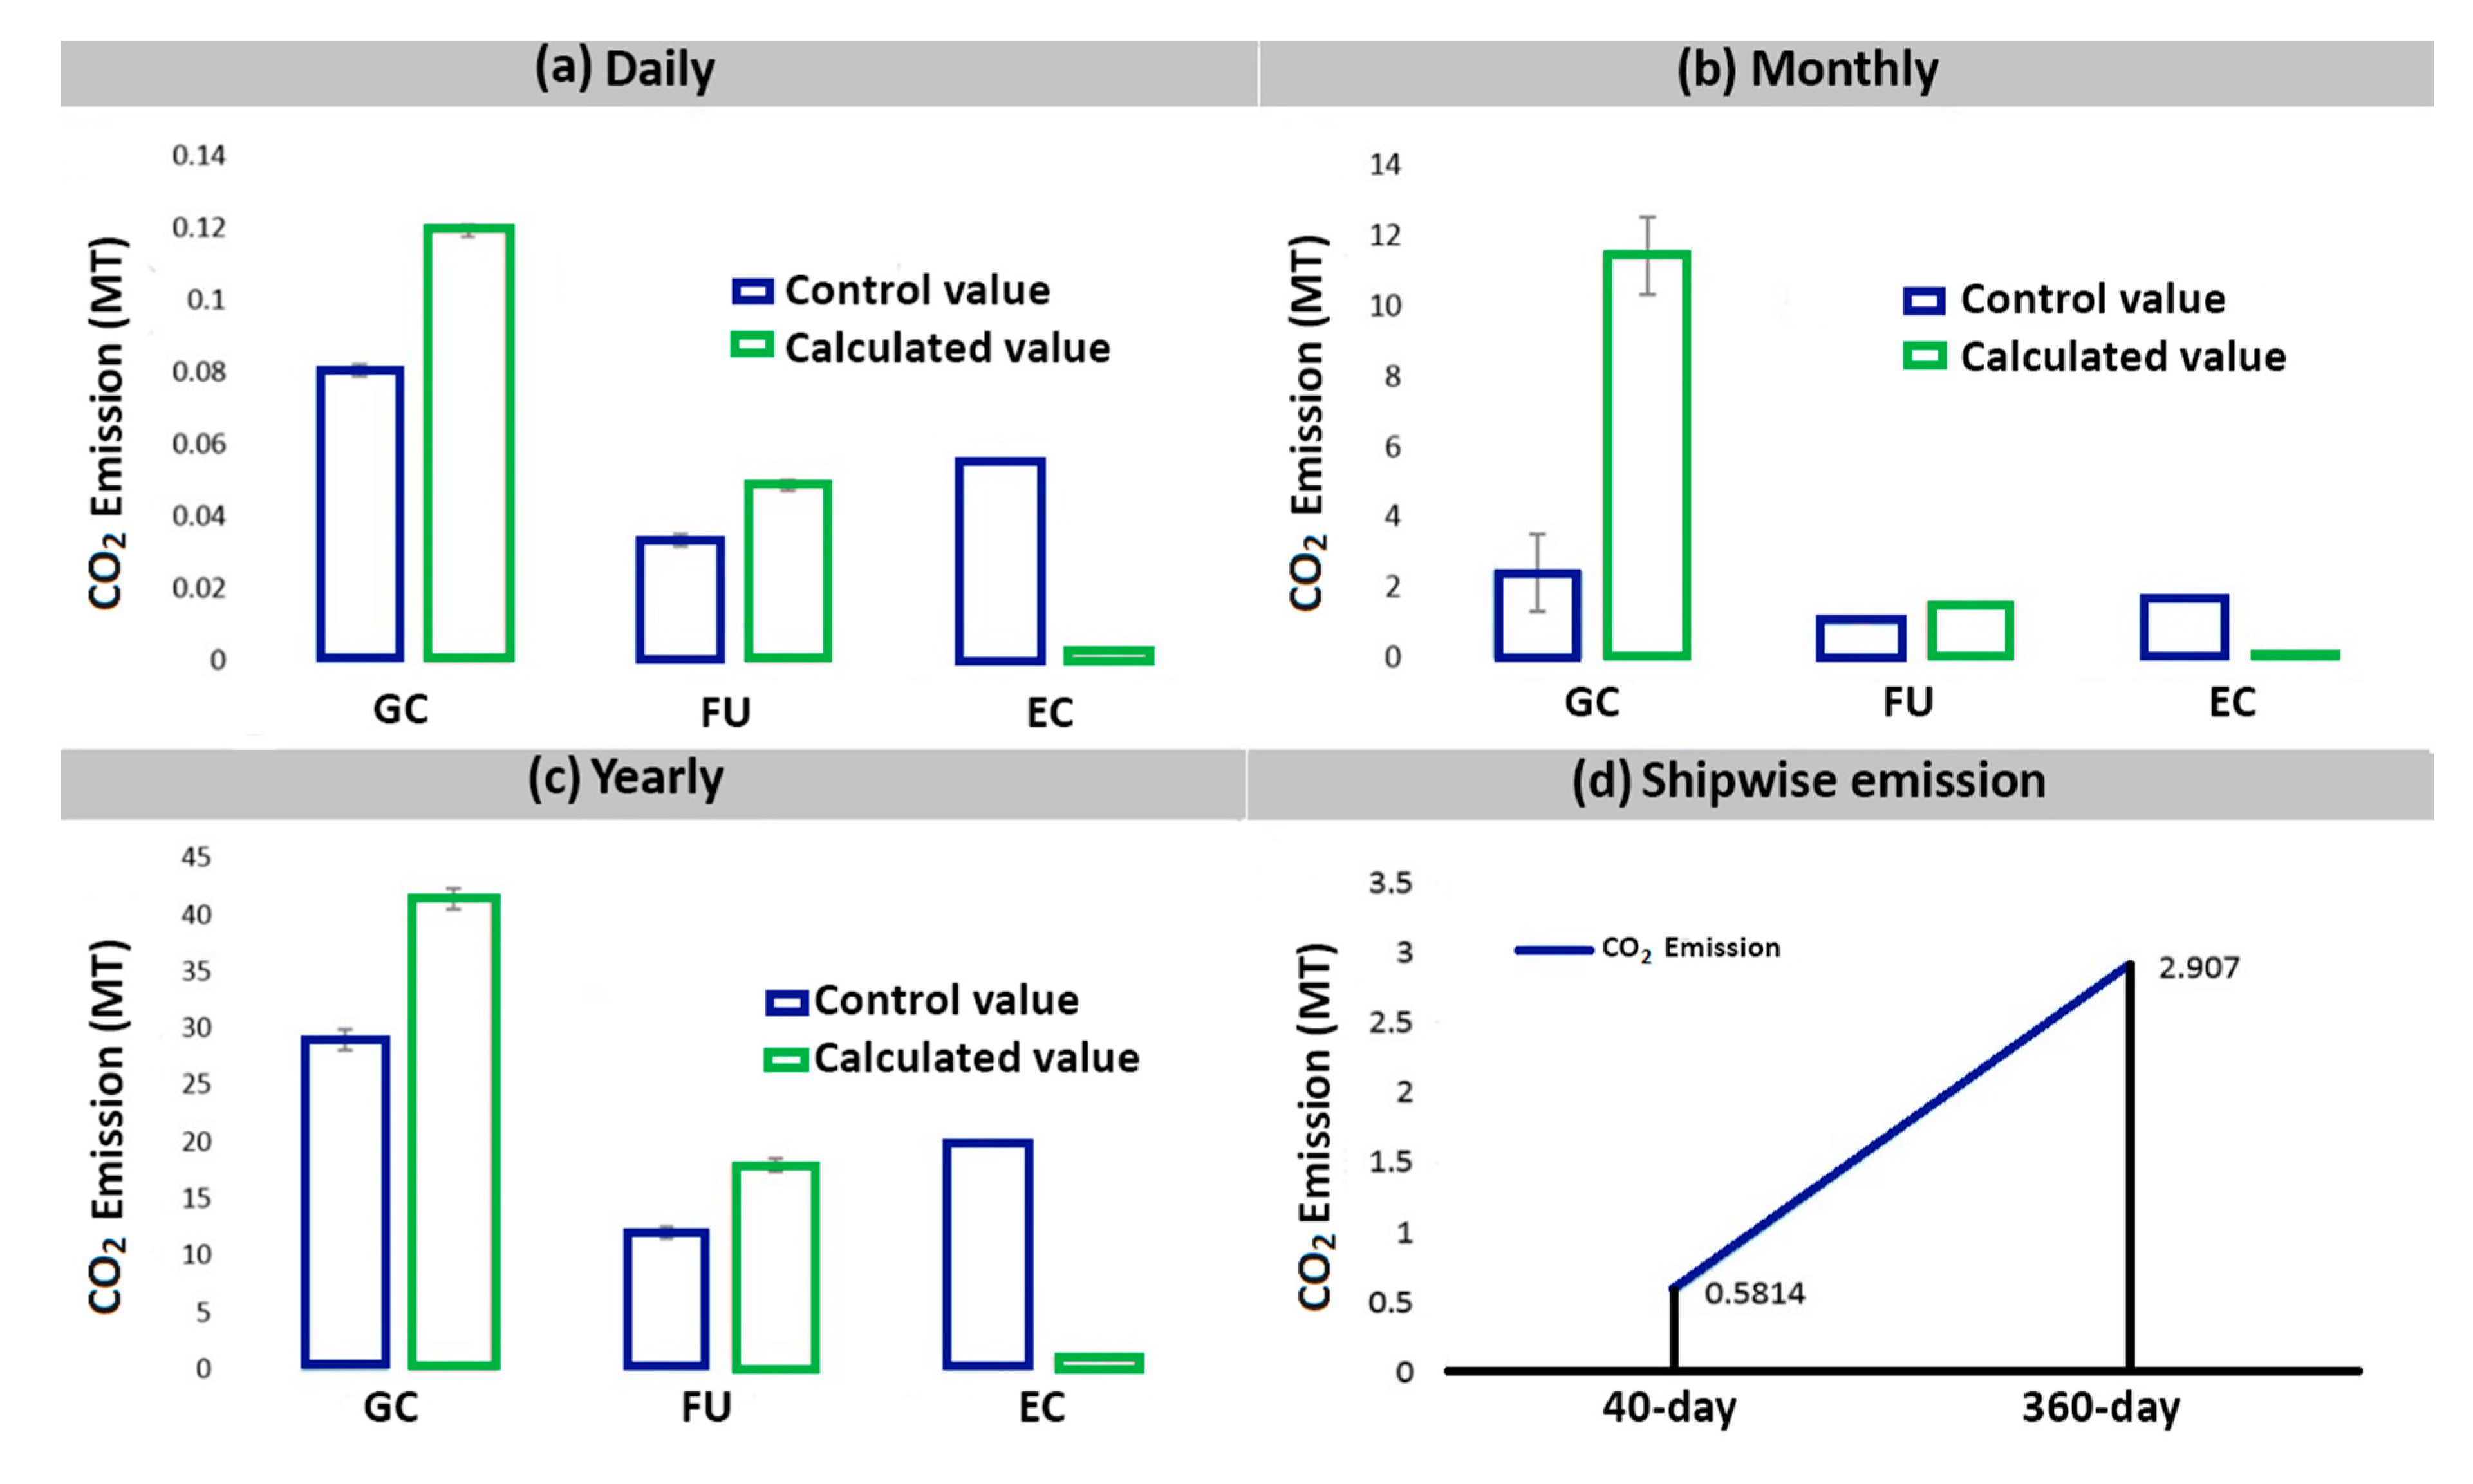
3.1. Calculation of Energy-Based CO2 Emission
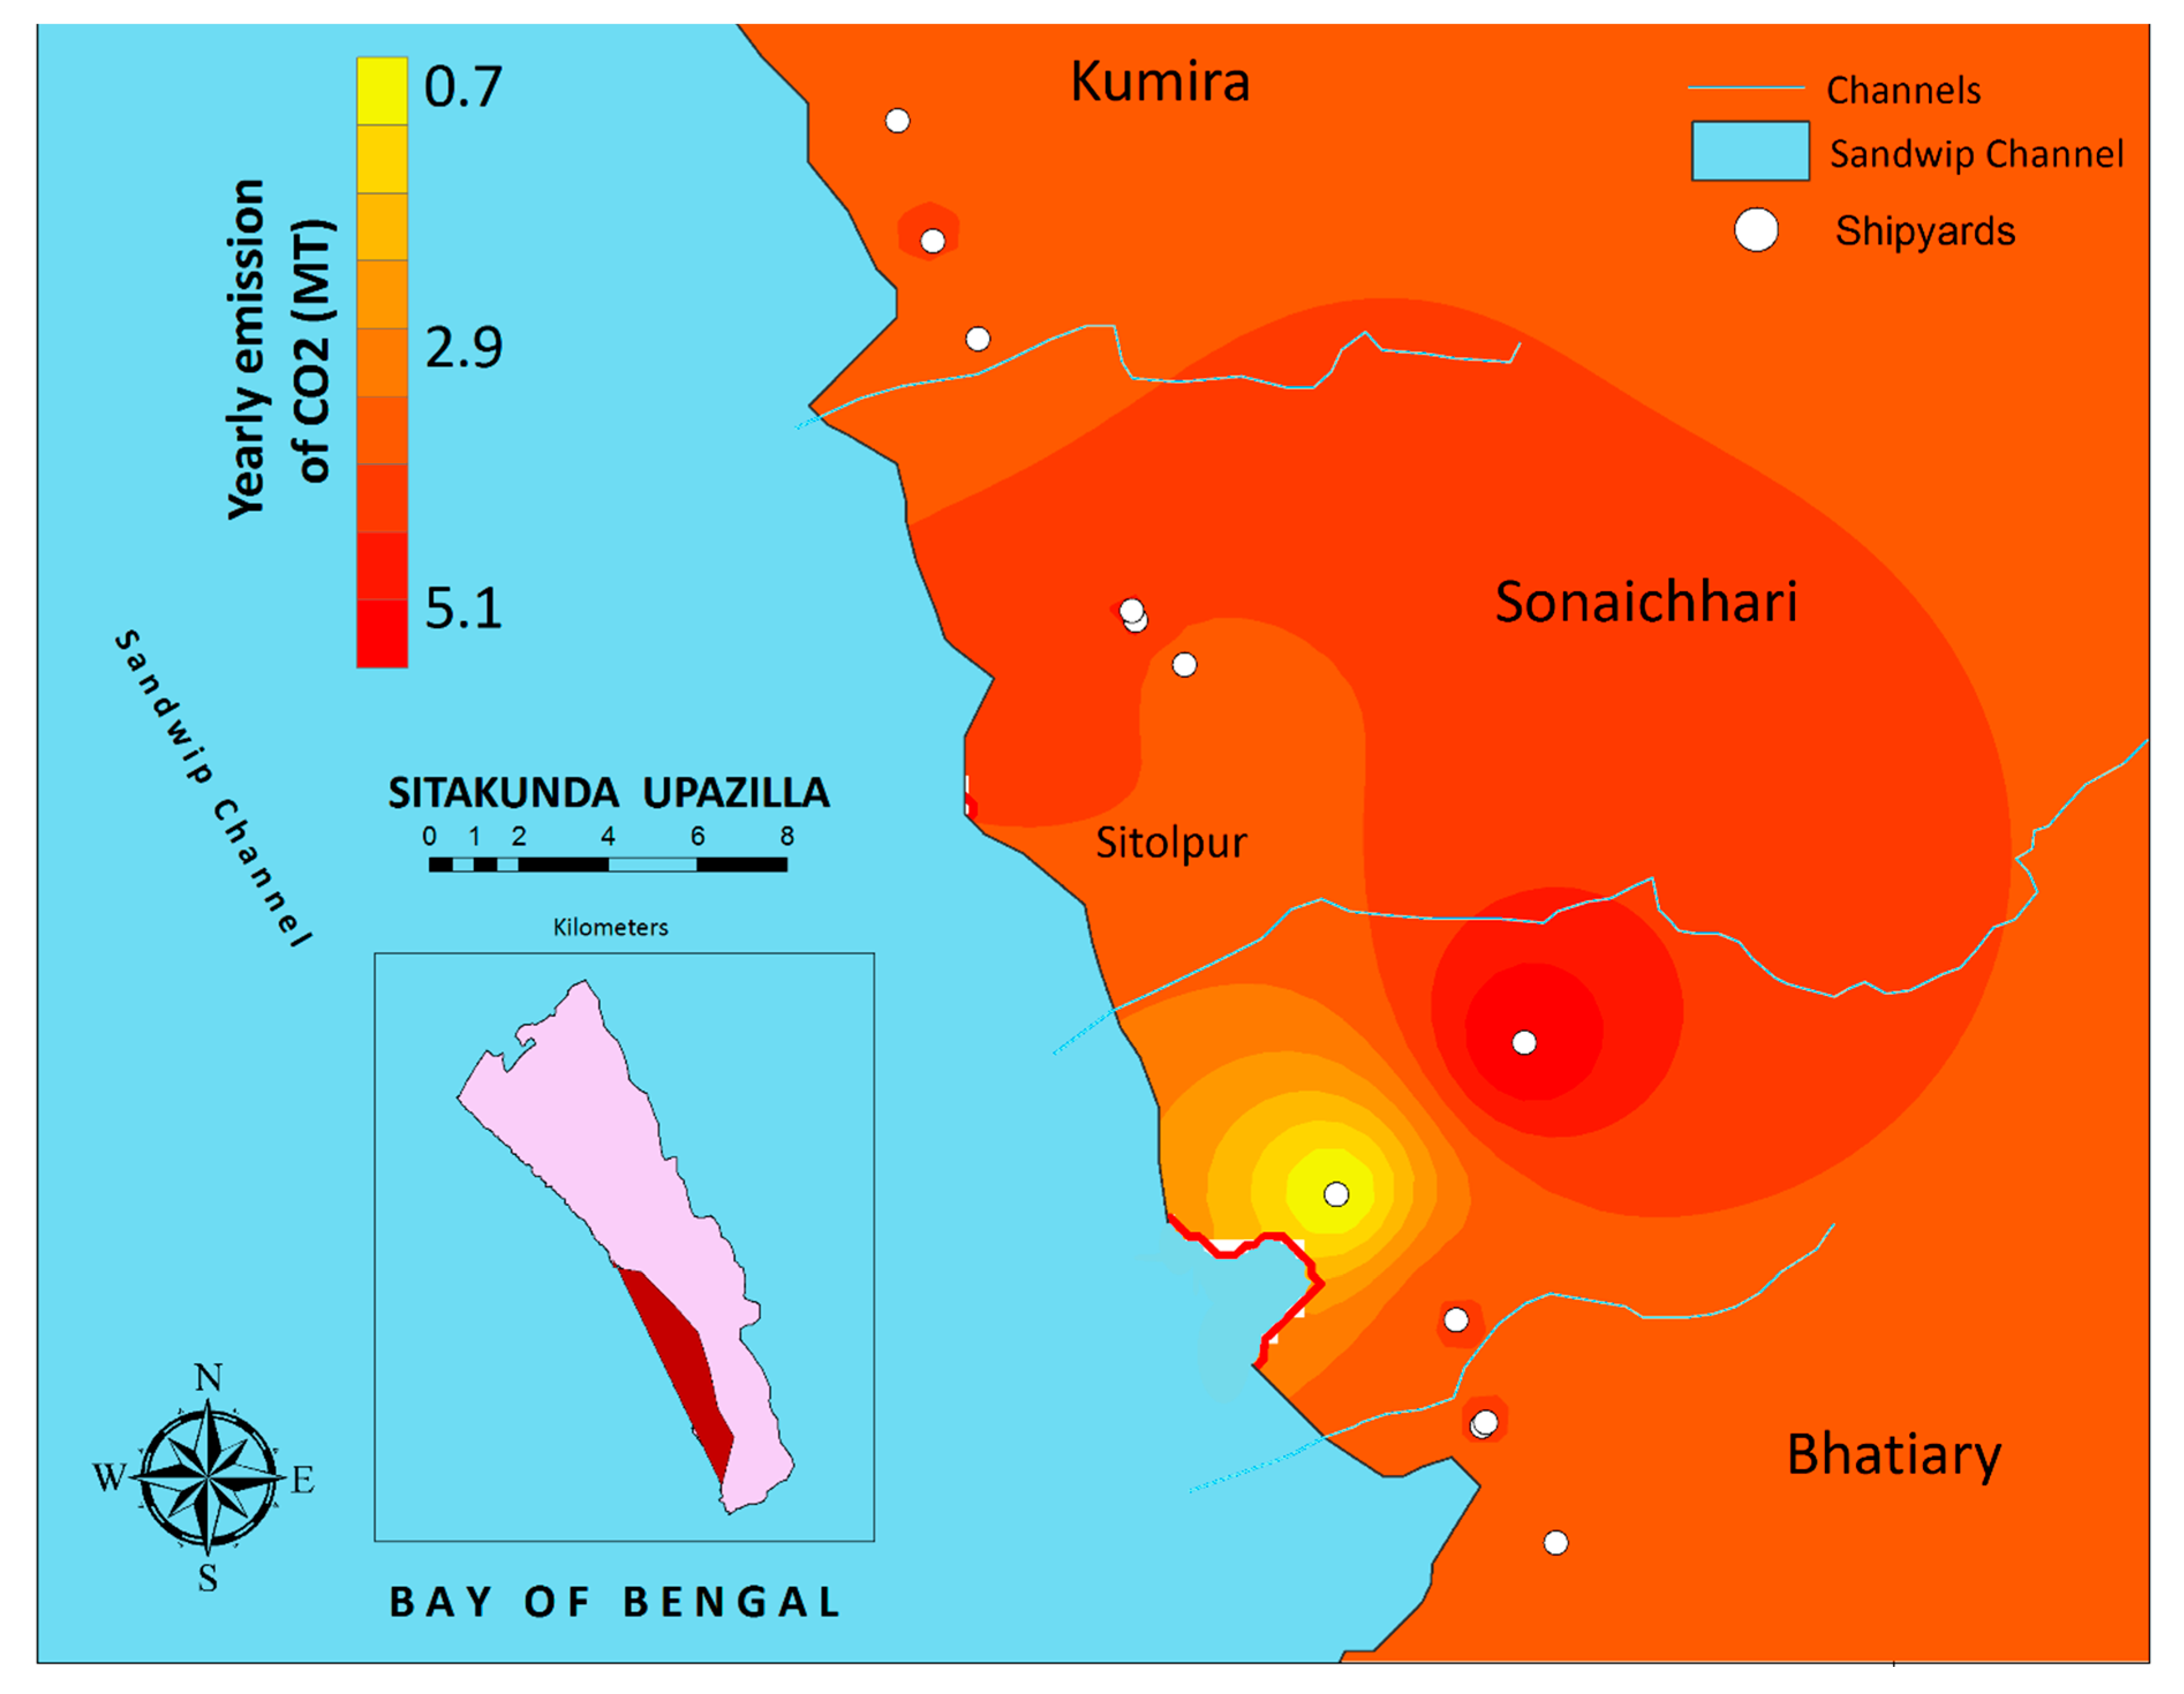
The CO2 emission from energy-related activities was estimated daily, monthly and yearly from the guidelines of IPCC 1995 and US EPA 2012 (Table 2). The study used IPCC guidelines for calculating the emission of CO2 from gas cutter and fuel use, whereas EPA guidelines were used for energy consumption. On average, shipyards used 20–30 gas cutters daily for metal cutting purposes. In general, use of gas cutters is dependent on the size and capacity of shipyards. Among the shipyards, Yard number (No.) 10 used the most gas cutters (35), whereas Yard No. 8 used the least (20). In terms of using gas cutters, the highest and lowest emitters of CO2 were Yard No. 10 (0.011305 MT) and Yard No. 8 (0.0048MT), respectively. In shipbreaking yards, in general, use of fuel oil is very limited as it is managed to arrange work in short distances. Though little diesel fuel is used in crane work purposes, an amount of 0.04867725 MT CO2 was emitted from fuel use daily. Unlike using gas cutters and fuel, emission of CO2 from energy consumption was lower (0.00236075 MT daily). Mainly, the electricity uses considered in this study were only for gas cutting procedures and fluid transportation (Table 2). CO2 emission from gas cutters, fuel use, electricity consumption and control value (0.00034 for gas cutter, 0.0001 for fuel use and 0.0055 for power consumption on a daily basis) were in the range 0.00796 ± 0.00166, 0.00324 ± 0.001623, 0.00015 ± 0.00012 and 0.05643 ± 0.02361 respectively, suggesting that CO2 emission from gas cutter and diesel was not desirable, whereas the emission from electricity consumption was lower. Emission from diesel was significantly different from the control value. Shipbreaking yards generally use lower amounts of diesel because their crane or other diesel-related transports do not cross long distances into the yard area. But, this study found a good rate of CO2 emission from diesel use.
As for shipbreaking purposes, electricity consumption was less, and this might be a major reason for showing no significance compared with the control value, where the control was considered as having multiple uses of electricity. CO2 emission from gas cutters was significantly different from the control value, and this might be due to the use of excess amounts of gas cutters in a day. Daily emissions from gas cutters and diesel were significant contributors to CO2 in the surrounding environment (Figure 2a).
Like daily emission, Yard No. 10 and 8 were the highest and lowest emitters of CO2 on a monthly and yearly basis. This study found that CO2 emissions from gas cutters, fuel use, electricity consumption and control value were in the range 0.07622 ± 0.11108, 0.09949 ± 0.04586, 0.00469 ± 0.00360 and 1.69 ± 0.700214 for monthly, and 2.75971 ± 0.89366, 1.19394 ± 0.55039, 0.055076 ± 0.01469 and 20.33333 ± 8.50490 for yearly, respectively. It should be noted that the control values of the gas cutter, diesel and energy consumption were 0.00067, 0.0003 and 0.67 for monthly and 0.00079, 0.0004 and 2 for yearly, respectively. From Table 2 and Figure 2, the study revealed that gas cutter and fuel use were the main contributors to CO2 emission from shipbreaking activities. In general, 40 days are needed for fully dismantling a ship. Therefore, according to the calculation, the study found that a ship yields, in total, CO2 of 0.5814 MT for the whole cutting procedure. To count the overall ship-wise emission of CO2, the study calculated 360 days and 25 gas cutters for finding out the yearly emission. The study found that 2.907 MT CO2 were emitted yearly for ship dismantling only (Figure 2d).
Figure 3 represents the spatial distribution of yearly CO2 emission (MT) throughout the shipyards. It showed the overall carbon emission scenario from different shipyards. ArcGIS ordinary inverse distance weighted interpolation was done to visualize the spatial distribution of yearly emission. It was observed that the eastern part of the region has more emission (>5.1 MT per year) from shipyards, especially in Sonaichari. However, some shipyards in Sitolpur showed lower emission (~1 MT per year). This area is adjacent to the Bay of Bengal. Shipyards from Bhatiyari and Kumira had average emissions compared to other areas in Sitakunda.

3.2. GWR Model

Before using the GWR model, spatial correlation should be investigated. Therefore, first, Moran’s I was examined among the unions of Sitakunda. The Moran’s I value for this study in 2019 was 0.0954, which indicates that the CO2 emissions from the shipyards in different unions have spatial correlation. The Moran’s I value is between −1 and 1. If this value > 0, it represents a positive correlation with similar characteristics in the geospatial distribution in one area [47]. The value of Moran’s I, therefore, provides the theoretical employment of the GWR model. The purpose of implementing the GWR model lay in exploring the heterogeneity of the independent variables or influencing factors of CO2 emission in the shipyards of Sitakunda. A summary of the GWR model with estimated coefficients is represented in Table 3. To compare the performance of the GWR model, the ordinary least square (OLS) method was examined. The GWR model outperformed the OLS method. The performance of the model was evaluated by the value of R2. The R2 value of GWR was 0.59, whereas, when we tested the OLS method for comparison, we found an R2 value of 0.51. The residual sum of squares of GWR was 0.004. From Table 3, it is clear that gas cutters have a significant contribution in carbon emission (p value < 0.05).

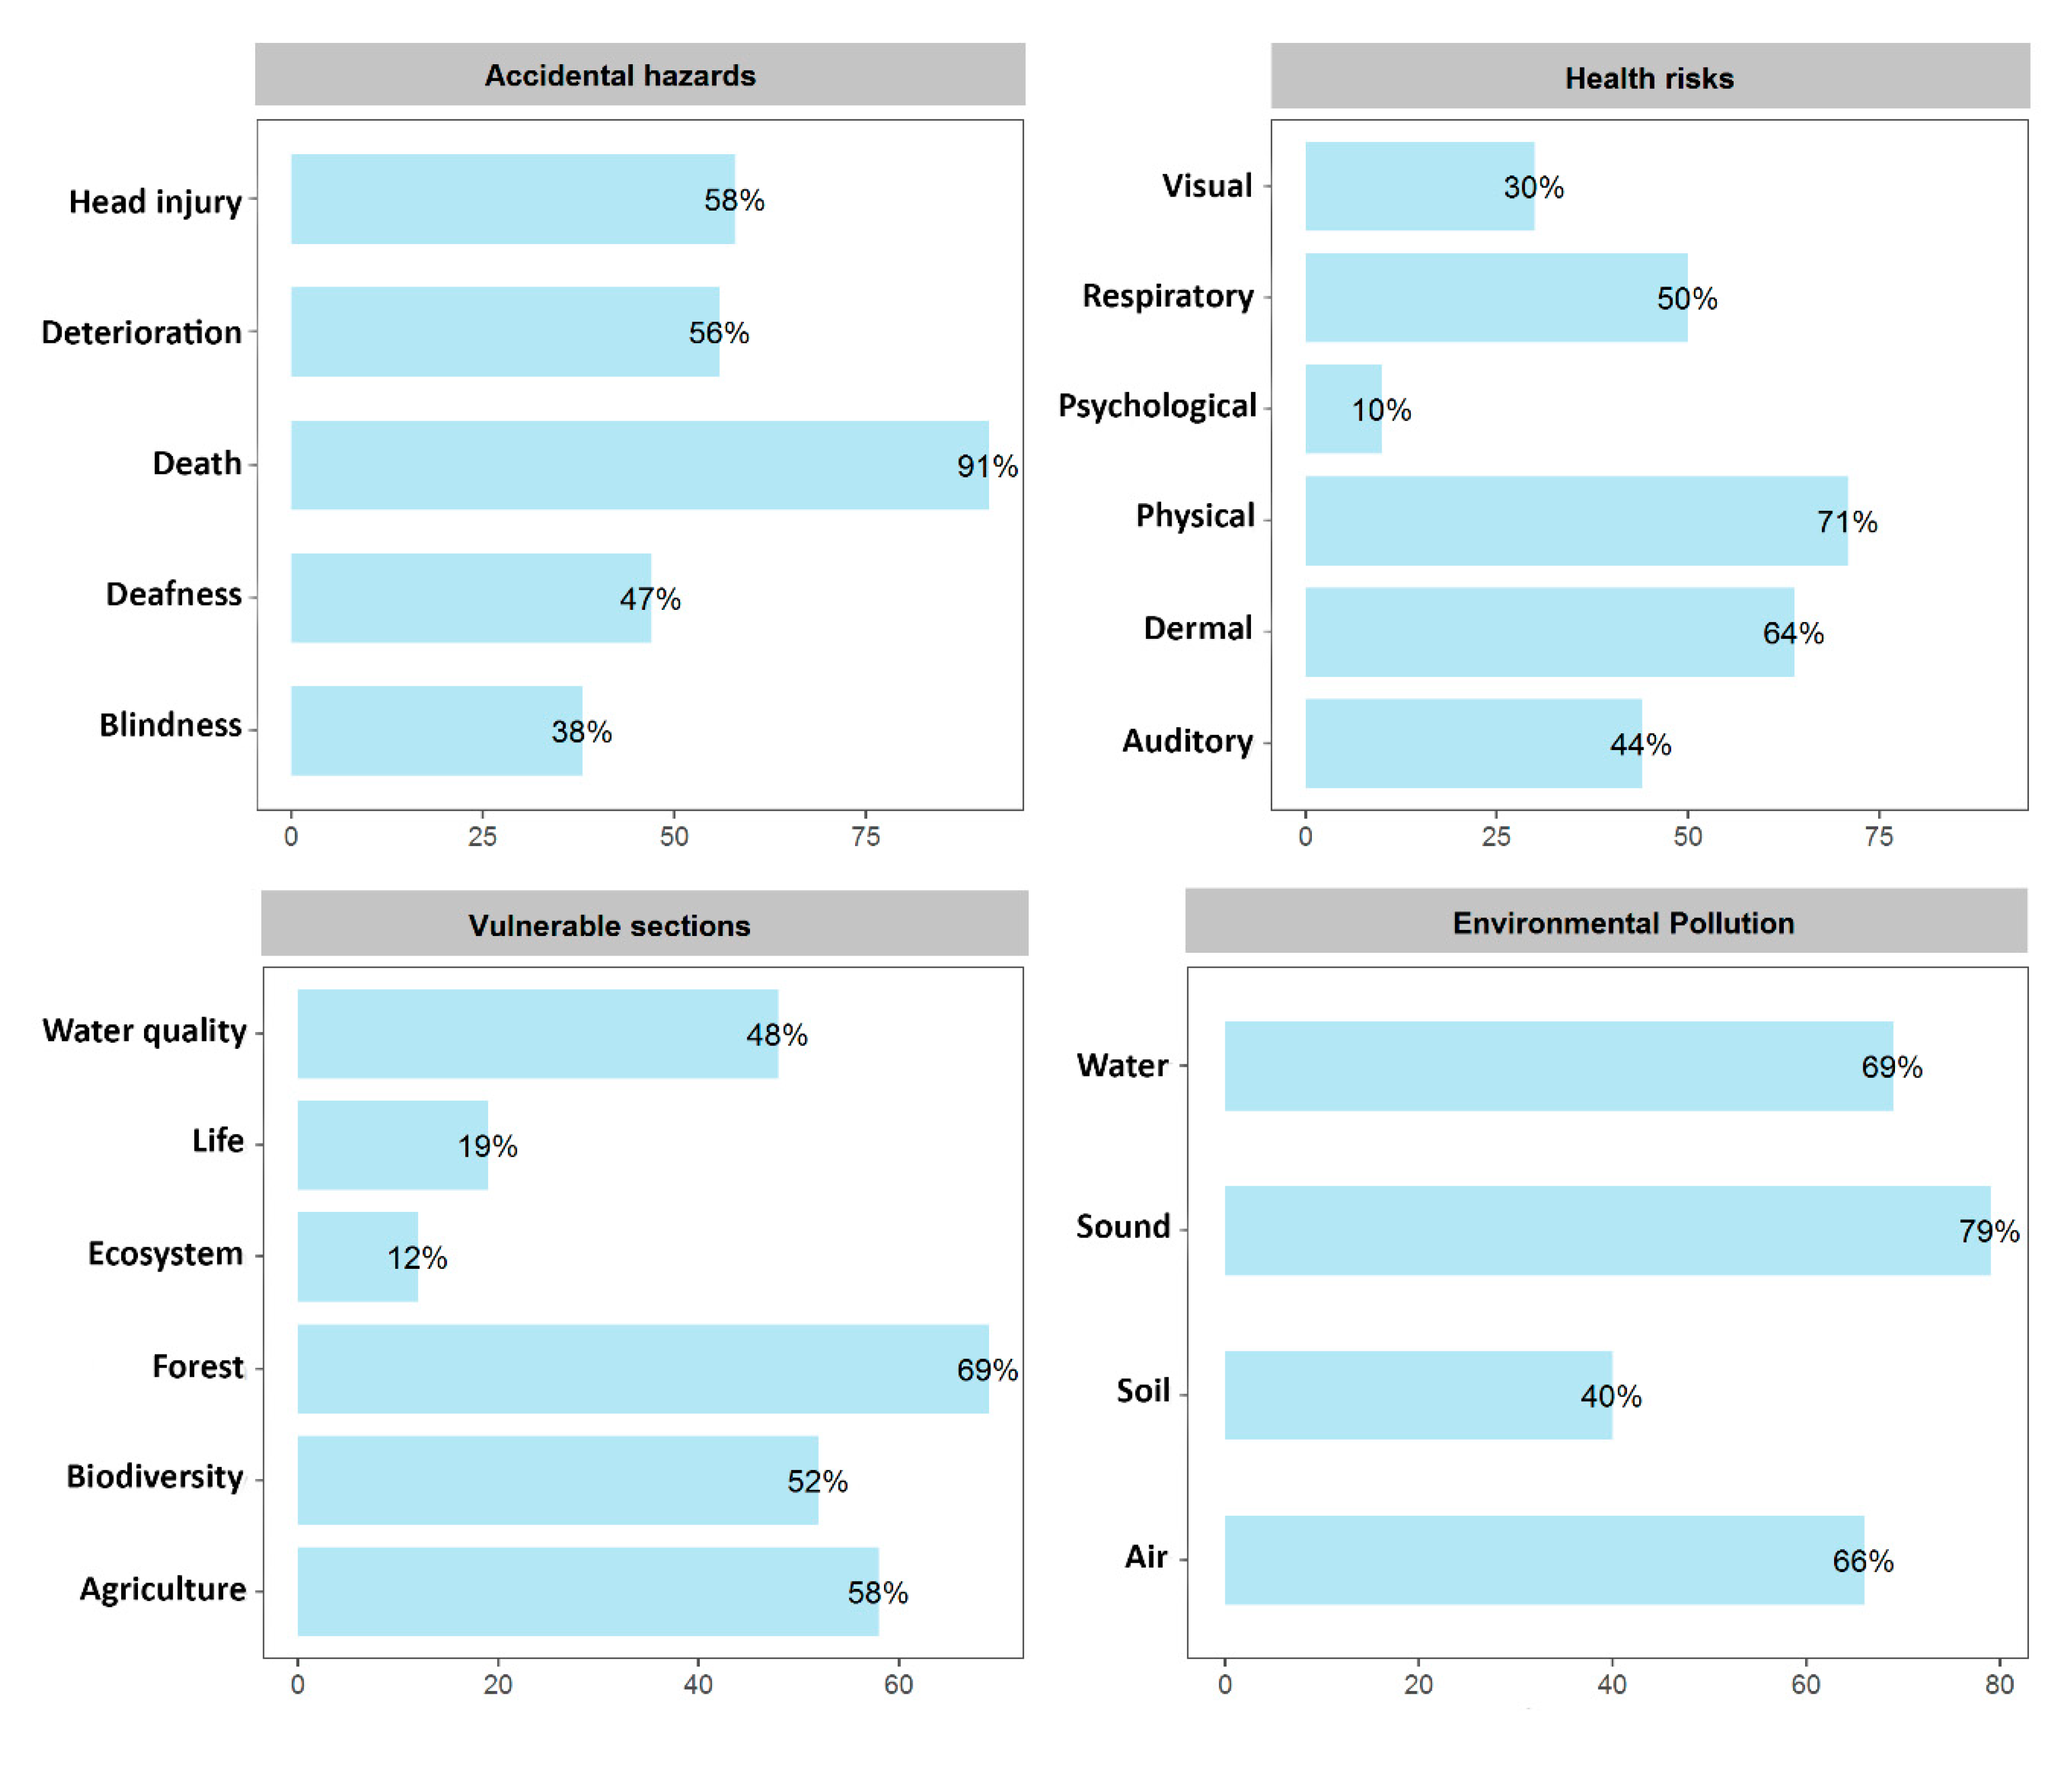
3.3. Assesment of Workers’ Condition

The open-ended survey interviews of shipbreaking yard workers and staff found that a large number of participants working in shipbreaking operations are unaware of the laws and policy interventions. To assess the overall condition of the workers, the study emphasized the opinions and the perceptions of the respondents on hazards and environmental consequences related to shipbreaking activities. The survey respondents represented a fairly young portion of the workers, with more than half (56%) of all those filling in the questionnaires between the ages of 12 and 30 years. The rest of them were between 31 and 50 years. The study finds that the young labor force was dominant in this sector and also indicated that a less experienced and untrained labor force was working on a large scale due to poverty. The sex ratio was not evenly split as one hundred percent of the respondents questioned throughout the study were male. Besides, no female workers were involved in shipbreaking activities during the study period. The following sections demonstrate the perceptions of workers on accidents and hazards, environmental pollution and consequences during shipbreaking activities. Shipbuilding and shipbreaking activities are extensively linked with numerous workplace risks and potential negative environmental consequences. This study categorized the hazards into three parts, i.e., accidental or workplace hazards, environmental hazards and health hazards. Figure 4 represents the perceptions of the workers working in shipyards on different hazards they were likely to face. The following sections will provide an overview based on their perceptions.

3.3.1. Accidental Hazards

According to the survey findings, consent about using protection materials was 100%, and proved that most of the workers use at least one type of protection material while working. The majority of workers (84%) used gumboots and 76% used helmets as protection materials. The shipbreaking industry is one of the riskier businesses and workers need maximum levels of protection. Helmets and gumboots were widely used as the protection materials, and they were often provided by the yard, which was largely the main reason for using them. Gloves and goggles were not widely used by workers and these were not provided in all of the yards. The ear pad is a much-needed equipment in this sector but surprisingly, the study did not find any use of this protection material. Despite using protection materials, workers were susceptible to accidental hazards. Almost all the respondents (91%) believed that they were susceptible to death during shipbreaking activities. The survey also showed that the workers were vulnerable to head injury, deterioration, deafness and permanent loss of vision (Figure 4). Depending on the opinion of the survey respondents, there were 1092 people who encountered accidents in 2018, which was down from 2669 people in 2017.

3.3.2. Environmental Hazards

The study categorized the environmental hazards into two parts, i.e., environmental pollution and negative consequences on the environment during shipbreaking activities. Figure 4 shows that the majority of respondents (79%) pointed out sound pollution as the main pollution they faced. A significant portion of respondents were concerned about water and air pollution. However, they were not very concerned about soil pollution, though a large portion of heavy metal was discharged into the soil near shipyards. Respondents also expressed their opinion about the environmental degradation due to the shipbreaking activities. The majority of the respondents (69%) perceived deforestation as the major environmental consequence. However, most of them were not concerned about ecosystem imbalance. On the other hand, almost equal portions of respondents expressed their opinion on agricultural disruption (58%) and biodiversity loss (52%) (Figure 4).

3.3.3. Health Hazards

This study surveyed the possible health problems associated with shipbreaking activities among the workers. Moreover, it focused on the medical facilities in shipyards, as handling of toxic substances during shipbreaking activities can cause serious health problems to the workers. The majority of the respondents (71%) marked back pain as their main health problem. Besides back pain, another major health issue the workers (64%) suffered from most was dermal problems. However, a small portion (10%) of respondents were concerned about psychological disorders (Figure 4). Almost all the respondents were provided medical facilities when any accidental hazards took place. The study found that about 91% of the respondents got free medicines and 83% were provided free diagnoses from the shipyard authorities. Though they were provided medical facilities from the shipyards, about 20% of them were not satisfied with it.

4. Discussion

The shipbreaking industry is recognized as the green industry and it is directly or indirectly related to the blue economy of Bangladesh [8]. Although there is a great economic prospect, the industry may have many negative consequences. This industry is a great source of heavy metal pollution, organic contaminants and toxic elements, that creates both sea and groundwater pollution [20,21,22,23,24,25,26,27,28,40,50]. Moreover, it plays a significant role in emitting CO2 to the environment. This study, therefore, tried to reveal an estimation of the energy-based CO2 emission due to the three activities, i.e., gas cutting, fuel use and the consumption of electricity in shipbreaking yards. We found from this study that gas cutter and fuel use had the most influential contributions to CO2 emission. They contribute about 2.907 MT CO2 yearly for ship dismantling only. Only three activities were considered to illustrate the fuel-based carbon emissions from the all the stages of the life cycle of ship recycling yards. The fuel-based carbon emissions were also discussed in Reference [33], which was conducted in China. In contrast, Rahman et al. addressed the LCA and associated global warming potential (CO2 eq) results from the secondary rebar production in the shipbreaking yards in Bangladesh [32]. Moreover, another study [51] mentioned that the harmful impact per light displacement ton (LDT) was 400 kg CO2eq during open beach breaking of ships. Comparing to studies like References [30] and [52] conducted in China, this study could be improved using a more comprehensive method to calculate the carbon emission from shipbreaking activities. Therefore, the study should be continued to analyze the trend of Bangladesh’s shipbreaking carbon emissions.
We further implemented the GWR model which showed heterogeneity of the independent variables of carbon emission in the shipyards of Sitakunda and performed better than the OLS model. However, the R2 value (0.59) we found from our study was relatively low compared to the other studies [53,54]. This was because of using only three influencing factors of C emission. In future, therefore, we recommend examining sensitivity analysis to develop this econometric model in other parts of the country where shipbreaking activities are performed. Moreover, another reason for the low R2 value was that we could not use the real data of emissions because the yard managers were not willing to share the real data of emissions and electricity consumption. Among all the unions in Sitakunda, the study revealed that Sonaichari was the most affected by shipbreaking activities, which was due to having a high number of shipbreaking yards in Sonaichari.
The third part of the study was the questionnaire survey among the 118 workers and officials of the shipbreaking yards to assess the workers’ condition and their perception on environmental pollution. Though the interview was done undercover, we found some limitations, i.e., some of the workers were forbidden to cooperate and feared losing their jobs. The limitations of conducting interviews were also elaborately demonstrated in References [38,39,55]. Since the start of the 21st century, about 28 studies were conducted on occupational health and safety [19]. Our study found that the workers are mostly vulnerable to death and head injury from accidental hazards. Besides, physical and dermal problems were the most frequent health hazard they likely faced during the shipbreaking activities. It should be noted that the study did not collect the data of controlled non-shipping activities for comparison, which was one of the drawbacks of this study. A study [37] argued that the plate cutting from cargo vessels causes serious fire hazards which could pose a high risk to the workers. Beside these minor and major risks, it was found in a recent study [56] that the workers who are exposed to asbestos are vulnerable to gastric and renal cancers. This indicates that the workers of shipbreaking industries are highly susceptible to these cancers. Moreover, the authors of Reference [57] reported that the key health hazards workers were likely to face were muscle pain (87%), impaired eyesight (72%), breathing difficulty (52%), gastric problems (81%), skin diseases (56%) and other infections (28%), which were quite similar to the findings of this study. Besides, risk of head injury and deterioration were also at a high rate, because workers have to work at certain levels of height on a ship and falling from that height could cause severe injuries. In these yards, a high level of noise pollution occurred that might lead to deafness. Another study [8] revealed that the reason behind these health hazards is workers not using personal protective equipment when they handle explosive substances. From the open interview with the workers, it was clear that most of the workers in shipyards lack adequate hazard awareness, training programs and safety equipment. This issue was also highlighted elaborately in a recent study [19].
Finally, the officials and workers expressed their opinions on environmental pollution which could occur due to shipbreaking activities. This study did not estimate the degree of pollution and negative consequences, but rather it highlighted the views of the respondents. Among the environmental pollution workers were likely to face, sound pollution was an alarming situation. Moreover, air and water pollution were also vulnerable. Oil spilling from the ships and discharge of heavy metals are also a matter of concern in shipbreaking activities and may cause serious contamination of soil. As the shipbreaking industry is one of the successful business sectors in Bangladesh, it does not prove itself as environmentally friendly. Consequences on the environment can be red-marked, as the industry significantly degrades the environment. Serious deforestation has taken place as the shipbreaking business has expanded with time, and forest areas are supposed to be cleared for expansion, which gives a high rate of deforestation.
Although environment-related studies, including this one, tend to highlight the negative environmental impacts, the shipbreaking activity is socio-environmentally desirable when global context is taken into account [58] and an embedded material flow at a national level is considered that supports the national economy [59]. This phenomenon presents a socio-economic dilemma (benefits as well as risks) and thus requires more robust policies so that local-level administrative capacity is increased and national-level cooperation with the shipbreaking association is ensured. Future studies on the rebuilding of local managers’ and owners’ mission and vision, and ways to collaborate with international expertise, may enable improving workers’ safety and financial sustainability.

5. Conclusions

The shipbreaking industry has achieved one of the top positions in the national economy over the passage of time. The advantages of breaking ships are immense in industries such as steel firms, shipbuilding firms, etc. While providing so many advantages, there are some problems caused by the shipbreaking activities, i.e., pollution, workers’ health, waste generation, etc. This paper aimed to find out the energy-based CO2 emissions in the shipbreaking yards that show how significantly it is emitted from this sector. Results showed that yearly emissions from different activities, i.e., gas cutting, electricity use and use of diesel, were 41.395 MT. Moreover, the GWR was applied to explore the contribution of the influencing factors throughout the sampling shipyards. The model suggests that more extensive study is needed considering all the life cycle stages of ship recycling. On the other hand, we conducted a questionnaire survey among all the workers and officials of the shipbreaking yards. Our study revealed that the workers are susceptible to different accidental, environmental and health hazards. In terms of accidental hazards, the workers are extremely vulnerable to death. Moreover, deafness, head injury and deterioration are also common. Health-related problems such as back pain and dermal problems are the two major concerns for workers. Workers of the yards are pushed to face more complex situations like accidents and economic problems, and sometimes, they lose their lives at a tender age. These problems can be kept to a minimum by following international regulations for dumping leftover ship materials. Safety issues and health factors of the workers can be ensured by following some strict rules. Safety gear like goggles, helmets, hand gloves, face masks and aprons should be provided to minimize the casualties. To hold the position in world shipbreaking, Bangladesh needs to upgrade the infrastructure for waste management and health issues of workers.

Author Contributions

Conceptualization, N.M. and M.A.S.; methodology, N.M.; software, S.A.S; validation, S.P.K., M.A.S. and M.S.K; formal analysis, I.K.; investigation, M.A.S.; resources, A.E.R.; data curation, M.F.M.A.; writing—original draft preparation, N.M. and S.A.S.; writing—review and editing, S.P.K., N.L., M.A.K. and I.K.; visualization, S.A.S.; supervision, M.A.S., M.S.K. and I.K.; project administration, M.A.S. All authors have read and agreed to the published version of the manuscript.

Funding

This research received no external funding.

Acknowledgments

The authors would like to highly acknowledge the reviewers who made the study more meaningful and want to thank them for their contribution, which was really valuable.

Conflicts of Interest

The authors declare that there is no conflict of interest regarding the publication of this manuscript. In addition, the ethical issues, including plagiarism, informed consent, misconduct, data fabrication and/or falsification, double publication and/or submission, and redundancies have been completely observed by the authors.

References

  1. Sarraf, M.; Stuer-Lauridsen, F.; Dyoulgerov, M.; Bloch, R.; Wingfield, S.; Watkinson, R. The Ship Breaking and Recycling Industry in Bangladesh and Pakistan; Report No. 58275-SAS; World Bank: Washington, DC, USA, 2010. [Google Scholar] [CrossRef]
  2. Azad, A.K.; Jensen, K.R.; Lin, C.K. Coastal aquaculture development in Bangladesh: Unsustainable and sustainable experiences. Environ. Manag. 2009, 44, 800–809. [Google Scholar] [CrossRef] [PubMed]
  3. Hossain, M.; Selvanathan, A. Population, poverty and CO2 emission in Asia: An overview. In Climate Change and Growth in Asia; Elgar, E., Ed.; Edward Elgar Publishing Limited: Cheltenham, UK, 2011; pp. 17–37. [Google Scholar]
  4. Abdullah, H.M.; Mahboob, M.G.; Banu, M.R.; Seker, D.Z. Monitoring the drastic growth of ship breaking yards in Sitakunda: A threat to the coastal environment of Bangladesh. Environ. Monit. Assess. 2012, 185, 3839–3851. [Google Scholar] [CrossRef] [PubMed]
  5. Hossain, K.A. Overview of ship recycling industry of Bangladesh. J. Environ. Anal. Toxicol. 2015, 5, 312. [Google Scholar] [CrossRef]
  6. Alam, S.; Faruque, A. Legal regulation of the shipbreaking industry in Bangladesh: The international regulatory framework and domestic implementation challenges. Mar. Policy 2014, 47, 46–56. [Google Scholar] [CrossRef]
  7. Iqbal, K.M.J.; Heidegger, P. Pakistan Shipbreaking Outlook: The Way Forward for A Green Ship Recycling Industry–Environmental, Health and Safety Conditions; Sustainable Development Policy Institute and NGO Shipbreaking Platform: Brussels, Belgium; Islamabad, Pakistan, 2013. [Google Scholar]
  8. Das, J.; Shahin, M.A. Ship Breaking and its Future in Bangladesh. J. Ocean Coast. Econ. 2019, 6, 9. [Google Scholar] [CrossRef] [Green Version]
  9. Hossain, M.M.M.; Islam, M.M. Ship Breaking Activities and Its Impact on the Coastal Zone of Chittagong, Bangladesh: Towards Sustainable Management; Advocacy & Publication Unit, Young Power in Social Action (YPSA): Chittagong, Bangladesh, 2006. [Google Scholar]
  10. Reddy, M.S.; Basha, S.; Kumar, V.S.; Joshi, H.V.; Ghosh, P.K. Quantification and classification of ship scraping waste at Alang–Sosiya, India. Mar. Pollut. Bull. 2003, 46, 1609–1614. [Google Scholar] [CrossRef]
  11. Zou, L.L.; Wei, Y.M. Driving factors for social vulnerability to coastal hazards in Southeast Asia: Results from the meta-analysis. Nat. Hazards 2010, 54, 901–929. [Google Scholar] [CrossRef]
  12. Islam, K.L.; Hossain, M.M. Effect of ship scrapping activities on the soil and sea environment in the coastal area of Chittagong, Bangladesh. Mar. Pollut. Bull. 1986, 17, 462–463. [Google Scholar] [CrossRef]
  13. Tewari, A.; Joshi, H.V.; Trivedi, R.H.; Sravankumar, V.G.; Raghunathan, C.; Khambhaty, Y.; Kotiwar, O.S.; Mandal, S.K. The effect of ship scrapping industry and its associated wastes on the biomass production and biodiversity of biota in in situ condition at Alang. Mar. Pollut. Bull. 2001, 42, 461–468. [Google Scholar] [CrossRef]
  14. Neşer, G.; Ünsalan, D.; Tekoğul, N.; Stuer-Lauridsen, F. The shipbreaking industry in Turkey: Environmental, safety and health issues. J. Clean. Prod. 2008, 16, 350–358. [Google Scholar] [CrossRef]
  15. Hossain, M.M.M.; Rahman, M.A. Ship breaking activities: Threats to coastal environment and fish biodiversity. In Ecosystem Health and Management of Pollution in the Bay of Bengal; Bangladesh Fisheries Research Institute: Mymensingh, Bangladesh, 2011; p. 23. [Google Scholar]
  16. Pasha, M.; Mahmood, A.H.; Rahman, I.; Hasnat, A. Assessment of Ship Breaking and Recycling Industries in Bangladesh - An Effective Step Towards The Achievement of Environmental Sustainability. In Proceedings of the International Conference on Agricultural, Environment and Biological Sciences (ICAEBS), Phuket, Thailand, 26–27 May 2012; pp. 43–47. [Google Scholar]
  17. Zakaria, N.G.; Ali, M.T.; Hossain, K.A. Underlying problems of ship recycling industries in Bangladesh and way forward. J. Nav. Arch. Mar. Eng. 2012, 9, 91–102. [Google Scholar] [CrossRef]
  18. Patwary, M.S.H.; Bartlett, D. Impacts of shipbreaking industry in Bangladesh: Search for a sustainable solution. Eur. J. Eng. Tech. 2019, 7, 64–79. [Google Scholar]
  19. Gunbeyaz, S.A.; Kurt, R.E.; Baumler, R. A study on evaluating the status of current occupational training in the ship recycling industry in Bangladesh. WMU J. Marit. Aff. 2019, 18, 41–59. [Google Scholar] [CrossRef] [Green Version]
  20. Siddiquee, N.A.; Parween, S.; Quddus, M.M.A.; Barua, P. Heavy metal pollution in sediments at ship breaking area of Bangladesh. In Coastal Environments: Focus on Asian Regions; Subramanian, V., Ed.; Springer: Dordrecht, The Netherlands, 2012; pp. 78–87. [Google Scholar]
  21. Hasan, A.B.; Kabir, S.; Reza, A.S.; Zaman, M.N.; Ahsan, A.; Rashid, M. Enrichment factor and geo-accumulation index of trace metals in sediments of the ship breaking area of Sitakund Upazilla (Bhatiary–Kumira), Chittagong, Bangladesh. J. Geochem. Explor. 2013, 125, 130–137. [Google Scholar] [CrossRef]
  22. Sujauddin, M.; Koide, R.; Komatsu, T.; Hossain, M.M.; Tokoro, C.; Murakami, S. Characterization of ship breaking industry in Bangladesh. J. Mater. Cycles Waste Manag. 2015, 17, 72–83. [Google Scholar] [CrossRef]
  23. Hossain, M.S.; Fakhruddin, A.N.M.; Chowdhury, M.A.Z.; Gan, S.H. Impact of ship-breaking activities on the coastal environment of Bangladesh and a management system for its sustainability. Environ. Sci. Policy 2016, 60, 84–94. [Google Scholar] [CrossRef]
  24. Khan, M.Z.H.; Hasan, M.R.; Khan, M.; Aktar, S.; Fatema, K. Distribution of heavy metals in surface sediments of the Bay of Bengal Coast. J. Toxicol. 2017, 2017, 1–7. [Google Scholar] [CrossRef]
  25. Rahman, M.S.; Hossain, M.B.; Babu, S.O.F.; Rahman, M.; Ahmed, A.S.; Jolly, Y.N.; Akter, S. Source of metal contamination in sediment, their ecological risk, and phytoremediation ability of the studied mangrove plants in ship breaking area, Bangladesh. Mar. Pollut. Bull. 2019, 141, 137–146. [Google Scholar] [CrossRef]
  26. Nøst, T.H.; Halse, A.K.; Randall, S.; Borgen, A.R.; Schlabach, M.; Paul, A.; Breivik, K. High concentrations of organic contaminants in air from ship breaking activities in Chittagong, Bangladesh. Environ. Sci. Technol. 2015, 49, 11372–11380. [Google Scholar] [CrossRef] [Green Version]
  27. Alam, I.; Barua, S.; Ishii, K.; Mizutani, S.; Hossain, M.M.; Rahman, I.M.; Hasegawa, H. Assessment of health risks associated with potentially toxic element contamination of soil by end-of-life ship dismantling in Bangladesh. Environ. Sci. Pollut. Res. 2019, 26, 24162. [Google Scholar] [CrossRef]
  28. Kibria, G.; Hossain, M.M.; Mallick, D.; Lau, T.C.; Wu, R. Trace/heavy metal pollution monitoring in estuary and coastal area of Bay of Bengal, Bangladesh and implicated impacts. Mar. Pollut. Bull. 2016, 105, 393–402. [Google Scholar] [CrossRef] [PubMed]
  29. Yılmaz, A.; Karacık, B.; Yakan, S.D.; Henkelmann, B.; Schramm, K.W.; Okay, O.S. Organic and heavy metal pollution in shipbreaking yards. Ocean Eng. 2016, 123, 452–457. [Google Scholar] [CrossRef]
  30. Liu, L.C.; Fan, Y.; Wu, G.; Wei, Y.M. Using LMDI method to analyze the change of China’s industrial CO2 emissions from final fuel use: An empirical analysis. Energy Policy 2007, 35, 5892–5900. [Google Scholar] [CrossRef]
  31. Deshpande, P.C.; Kalbar, P.P.; Tilwankar, A.K.; Asolekar, S.R. A novel approach to estimating resource consumption rates and emission factors for ship recycling yards in Alang, India. J. Clean. Prod. 2013, 59, 251–259. [Google Scholar] [CrossRef]
  32. Rahman, S.M.; Handler, R.M.; Mayer, A.L. Life cycle assessment of steel in the ship recycling industry in Bangladesh. J. Clean. Prod. 2016, 135, 963–971. [Google Scholar] [CrossRef]
  33. Zhang, W.; Jiang, L.; Cui, Y.; Xu, Y.; Wang, C.; Yu, J.; Streets, D.G.; Lin, B. Effects of urbanization on airport CO2 emissions: A geographically weighted approach using nighttime light data in China. Resour. Conserv. Recycl. 2019, 150, 104454. [Google Scholar] [CrossRef]
  34. Gilbert, P.; Wilson, P.; Walsh, C.; Hodgson, P. The role of material efficiency to reduce CO2 emissions during ship manufacture: A life cycle approach. Mar. Policy 2017, 75, 227–237. [Google Scholar] [CrossRef]
  35. Young Power in Social Action (YPSA). Workers in Ship Breaking Industries: A Base Line Survey of Chittagong (Bangladesh); Young Power in Social Action (YPSA): Chittagong, Bangladesh, 2005. [Google Scholar]
  36. The Daily New Age. Two Ship-breaking Yard Workers Burnt Dead in Sitakundu. Available online: http://www.newagebd.net/article/65300/two-ship-breaking-yard-workers-burnt-dead-in-sitakundu (accessed on 19 February 2019).
  37. Rabbi, H.R.; Rahman, A. Ship breaking and recycling industry of Bangladesh; issues and challenges. Procedia Eng. 2017, 194, 254–259. [Google Scholar] [CrossRef]
  38. Rahman, S.M.; Schelly, C.; Mayer, A.L.; Norman, E.S. Uncovering discursive framings of the Bangladesh shipbreaking industry. Soc. Sci. 2018, 7, 14. [Google Scholar] [CrossRef] [Green Version]
  39. Cairns, G. A critical scenario analysis of end-of-life ship disposal: The “bottom of the pyramid” as opportunity and graveyard. Crit. Persp. Int. Bus. 2014, 10, 172–189. [Google Scholar] [CrossRef]
  40. Iqbal, K.; Zakaria, N.M.; Hossain, K. Identifying and Analysing Underlying Problems of Shipbuilding Industries in Bangladesh. J. Mech. Eng. 2011, 41, 147–158. [Google Scholar] [CrossRef] [Green Version]
  41. Banglapedia. Available online: http://en.banglapedia.org/index.php?title=Sitakunda_Upazila (accessed on 13 November 2019).
  42. The Intergovernmental Panel on Climate Change (IPCC). Greenhouse Gas Inventory: IPCC Guidelines for National Greenhouse Gas Inventories; United Kingdom Meteorological Office: Bracknell, UK, 1995.
  43. United States Environmental Protection Agency (EPA). EGRID Summary Tables 2012. Available online: https://www.epa.gov/energy/egrid-summary-tables (accessed on 5 February 2019).
  44. Bartier, P.M.; Keller, C.P. Multivariate interpolation to incorporate thematic surface data using inverse distance weighting (IDW). Comput. Geosci. 1996, 22, 795–799. [Google Scholar] [CrossRef]
  45. Harman, B.I.; Koseoglu, H.; Yigit, C.O. Performance evaluation of IDW, Kriging and multiquadric interpolation methods in producing noise mapping: A case study at the city of Isparta, Turkey. Appl. Acoust. 2016, 112, 147–157. [Google Scholar] [CrossRef]
  46. Huang, F.; Liu, D.; Tan, X.; Wang, J.; Chen, Y.; He, B. Explorations of the implementation of a parallel IDW interpolation algorithm in a Linux cluster-based parallel GIS. Comput. Geosci. 2011, 37, 426–434. [Google Scholar] [CrossRef]
  47. Fotheringham, A.S.; Brunsdon, C.; Charlton, M. Geographically Weighted Regression: The Analysis of Spatially Varying Relationships; John Wiley & Sons: Hoboken, NJ, USA, 2003. [Google Scholar]
  48. Bivand, R.; Yu, D.; Nakaya, T.; Garcia-Lopez, M.A.; Bivand, M.R. Package ‘spgwr’. Available online: ftp://oss.ustc.edu.cn/CRAN/web/packages/spgwr/spgwr.pdf (accessed on 29 April 2020).
  49. Paradis, E.; Schliep, K. ape 50: An environment for modern phylogenetics and evolutionary analyses in R. Bioinformatics 2019, 35, 526–528. [Google Scholar] [CrossRef]
  50. Hasan, A.B.; Kabir, S.; Reza, A.S.; Zaman, M.N.; Ahsan, M.A.; Akbor, M.A.; Rashid, M.M. Trace metals pollution in seawater and groundwater in the ship breaking area of Sitakund Upazilla, Chittagong, Bangladesh. Mar. Pollut. Bull. 2013, 71, 317–324. [Google Scholar] [CrossRef] [PubMed]
  51. Barua, S.; Rahman, I.M.; Hossain, M.M.; Begum, Z.A.; Alam, I.; Sawai, H.; Maki, T.; Hasegawa, H. Environmental hazards associated with open-beach breaking of end-of-life ships: A review. Environ. Sci. Pollut. Res. 2018, 25, 30880–30893. [Google Scholar] [CrossRef]
  52. Wei, Y.M.; Liu, L.C.; Fan, Y.; Wu, G. The impact of lifestyle on energy use and CO2 emission: An empirical analysis of China’s residents. Energy Policy 2007, 35, 247–257. [Google Scholar] [CrossRef]
  53. Xu, B.; Lin, B. Factors affecting CO2 emissions in China’s agriculture sector: Evidence from geographically weighted regression model. Energy Policy 2017, 104, 404–414. [Google Scholar] [CrossRef]
  54. Wang, Y.; Li, X.; Kang, Y.; Chen, W.; Zhao, M.; Li, W. Analyzing the impact of urbanization quality on CO2 emissions: What can geographically weighted regression tell us? Renew. Sustain. Energy Rev. 2019, 104, 127–136. [Google Scholar] [CrossRef]
  55. Kutub, M.J.R.; Falgunee, N.; Nawfee, S.M.; Rabby, Y.W. Ship breaking industries and their impacts on the local people and environment of coastal areas of Bangladesh. Hum. Soc. Stud. 2017, 6, 35–58. [Google Scholar] [CrossRef] [Green Version]
  56. Choi, B.J.; Lee, S.; Lee, I.J.; Park, S.W.; Lee, S. Gastric and rectal cancers in workers exposed to asbestos: A case series. Ann. Occup. Environ. Med. 2020, 32, e4. [Google Scholar] [CrossRef]
  57. Rousmaniere, P.; Raj, N. Shipbreaking in the developing world: Problems and prospects. Int. J. Occup. Environ. Health 2007, 13, 359–368. [Google Scholar] [CrossRef] [PubMed]
  58. Rahman, S.M.; Kim, J. Circular economy, proximity, and shipbreaking: A material flow and environmental impact analysis. J. Clean. Prod. 2020, 259, 120681. [Google Scholar] [CrossRef]
  59. Sujauddin, M.; Koide, R.; Komatsu, T.; Hossain, M.M.; Tokoro, C.; Murakami, S. Ship breaking and the steel industry in Bangladesh: A material flow perspective. J. Ind. Ecol. 2017, 21, 191–203. [Google Scholar] [CrossRef]
Figure 1. Map of Sitakunda showing the shipyards’ locations and the population density of that area (the red dots represent the shipyards).
Environments 07 00035 g001
Figure 2. Variations of (a) daily, (b) monthly and (c) yearly CO2 emissions from gas cutters, diesel and electricity consumption in shipbreaking yards (n = 15) compared to the control value ( 10 2 ). Bars indicate standard deviation (SD). (d) Ship-wise (n = 9) CO2 emission in a particular time period. Here, GC = gas cutter, FU = fuel use and EC = electricity consumption.
Environments 07 00035 g002
Figure 3. Spatial distribution of yearly CO2 emission (metric tons (MT)) throughout the shipyards.
Environments 07 00035 g003
Figure 4. Perceptions of the workers working in shipyards on different hazards.
Environments 07 00035 g004
Table 1. Carbon emission factor (EF) and fraction of carbon oxidized (FCO) *a.
FuelEF (tC/TJ) *bFCOFuelEF (tC/TJ)FCO
Coal25.80.98Aviation turbine fuel19.50.99
Soft Coke25.80.98Diesel oil20.20.98
Natural Gas15.30.995Light-speed oil20.20.99
LPG17.20.995High-speed oil20.20.99
Naptha20.00.99Fuel oil20.20.99
Motor Gasoline 18.90.99Other petroleum20.20.99
*a Intergovernmental Panel on Climate Change (IPCC) [42]; *b tC/TJ = carbon emission in ton/terajoule.
Table 2. Calculation of CO2 emission from 15 shipbreaking yards, daily, monthly and yearly from three shipbreaking activities. i.e., gas cutting (GC), fuel use (FU) and electricity consumption (EC).
YNCalculated Energy-Based CO2 Emission in Shipyards (MT)
DailyMonthlyYearly
GCFUECGCFUECGCFUEC
10.00810.00120.00020.24230.04520.00712.9070.54270.0853
20.00970.00300.00020.29070.09050.00593.4881.08540.0711
30.00810.00300.00000.24230.09050.00002.9071.08540.0000
40.00810.00300.00030.24230.09050.00892.9071.08540.1000
50.00650.00600.00030.19380.18090.00892.3262.17080.1000
60.00970.00120.00000.29070.04520.00003.4880.54270.0000
70.00810.00300.00000.24230.09040.00002.9071.08540.0000
80.00480.00120.00020.14540.04520.00590.1160.54270.0711
90.00650.00600.00000.19380.18090.00002.3262.17080.0000
100.01130.00300.00020.33920.09050.00714.0691.08540.08532
110.00650.00300.00020.19380.09050.00592.3261.08540.0711
120.00650.00300.00030.19380.09050.00892.3261.08540.1000
130.00810.00300.00020.24230.09050.00592.9071.08540.0711
140.00810.00300.00020.24230.09050.00592.9071.08540.0711
150.00960.00600.00000.29070.18090.0003.4882.1700.0000
Table 3. Results of the geographic weighted regression (GWR) model by quartile.
VariableMinimumMaximumMedian1st Quartile3rd QuartileGlobalp-valueR2
Intercept−5.11−4.71−5.07−5.07−5.02−5.10 0.59
GC−0.010.030.020.020.030.030.01*
FU0.0010.040.0040.0020.040.0020.08
EC−0.010.002−0.004−0.0030.002−0.0030.78
* indicates the statistically significant p-value (p < 0.05)

