Towards Forest Landscape Restoration Programs in the Philippines: Evidence from Logged Forests and Mixed-Species Plantations

 ,
, 

Abstract
1. Introduction
2. Methodology
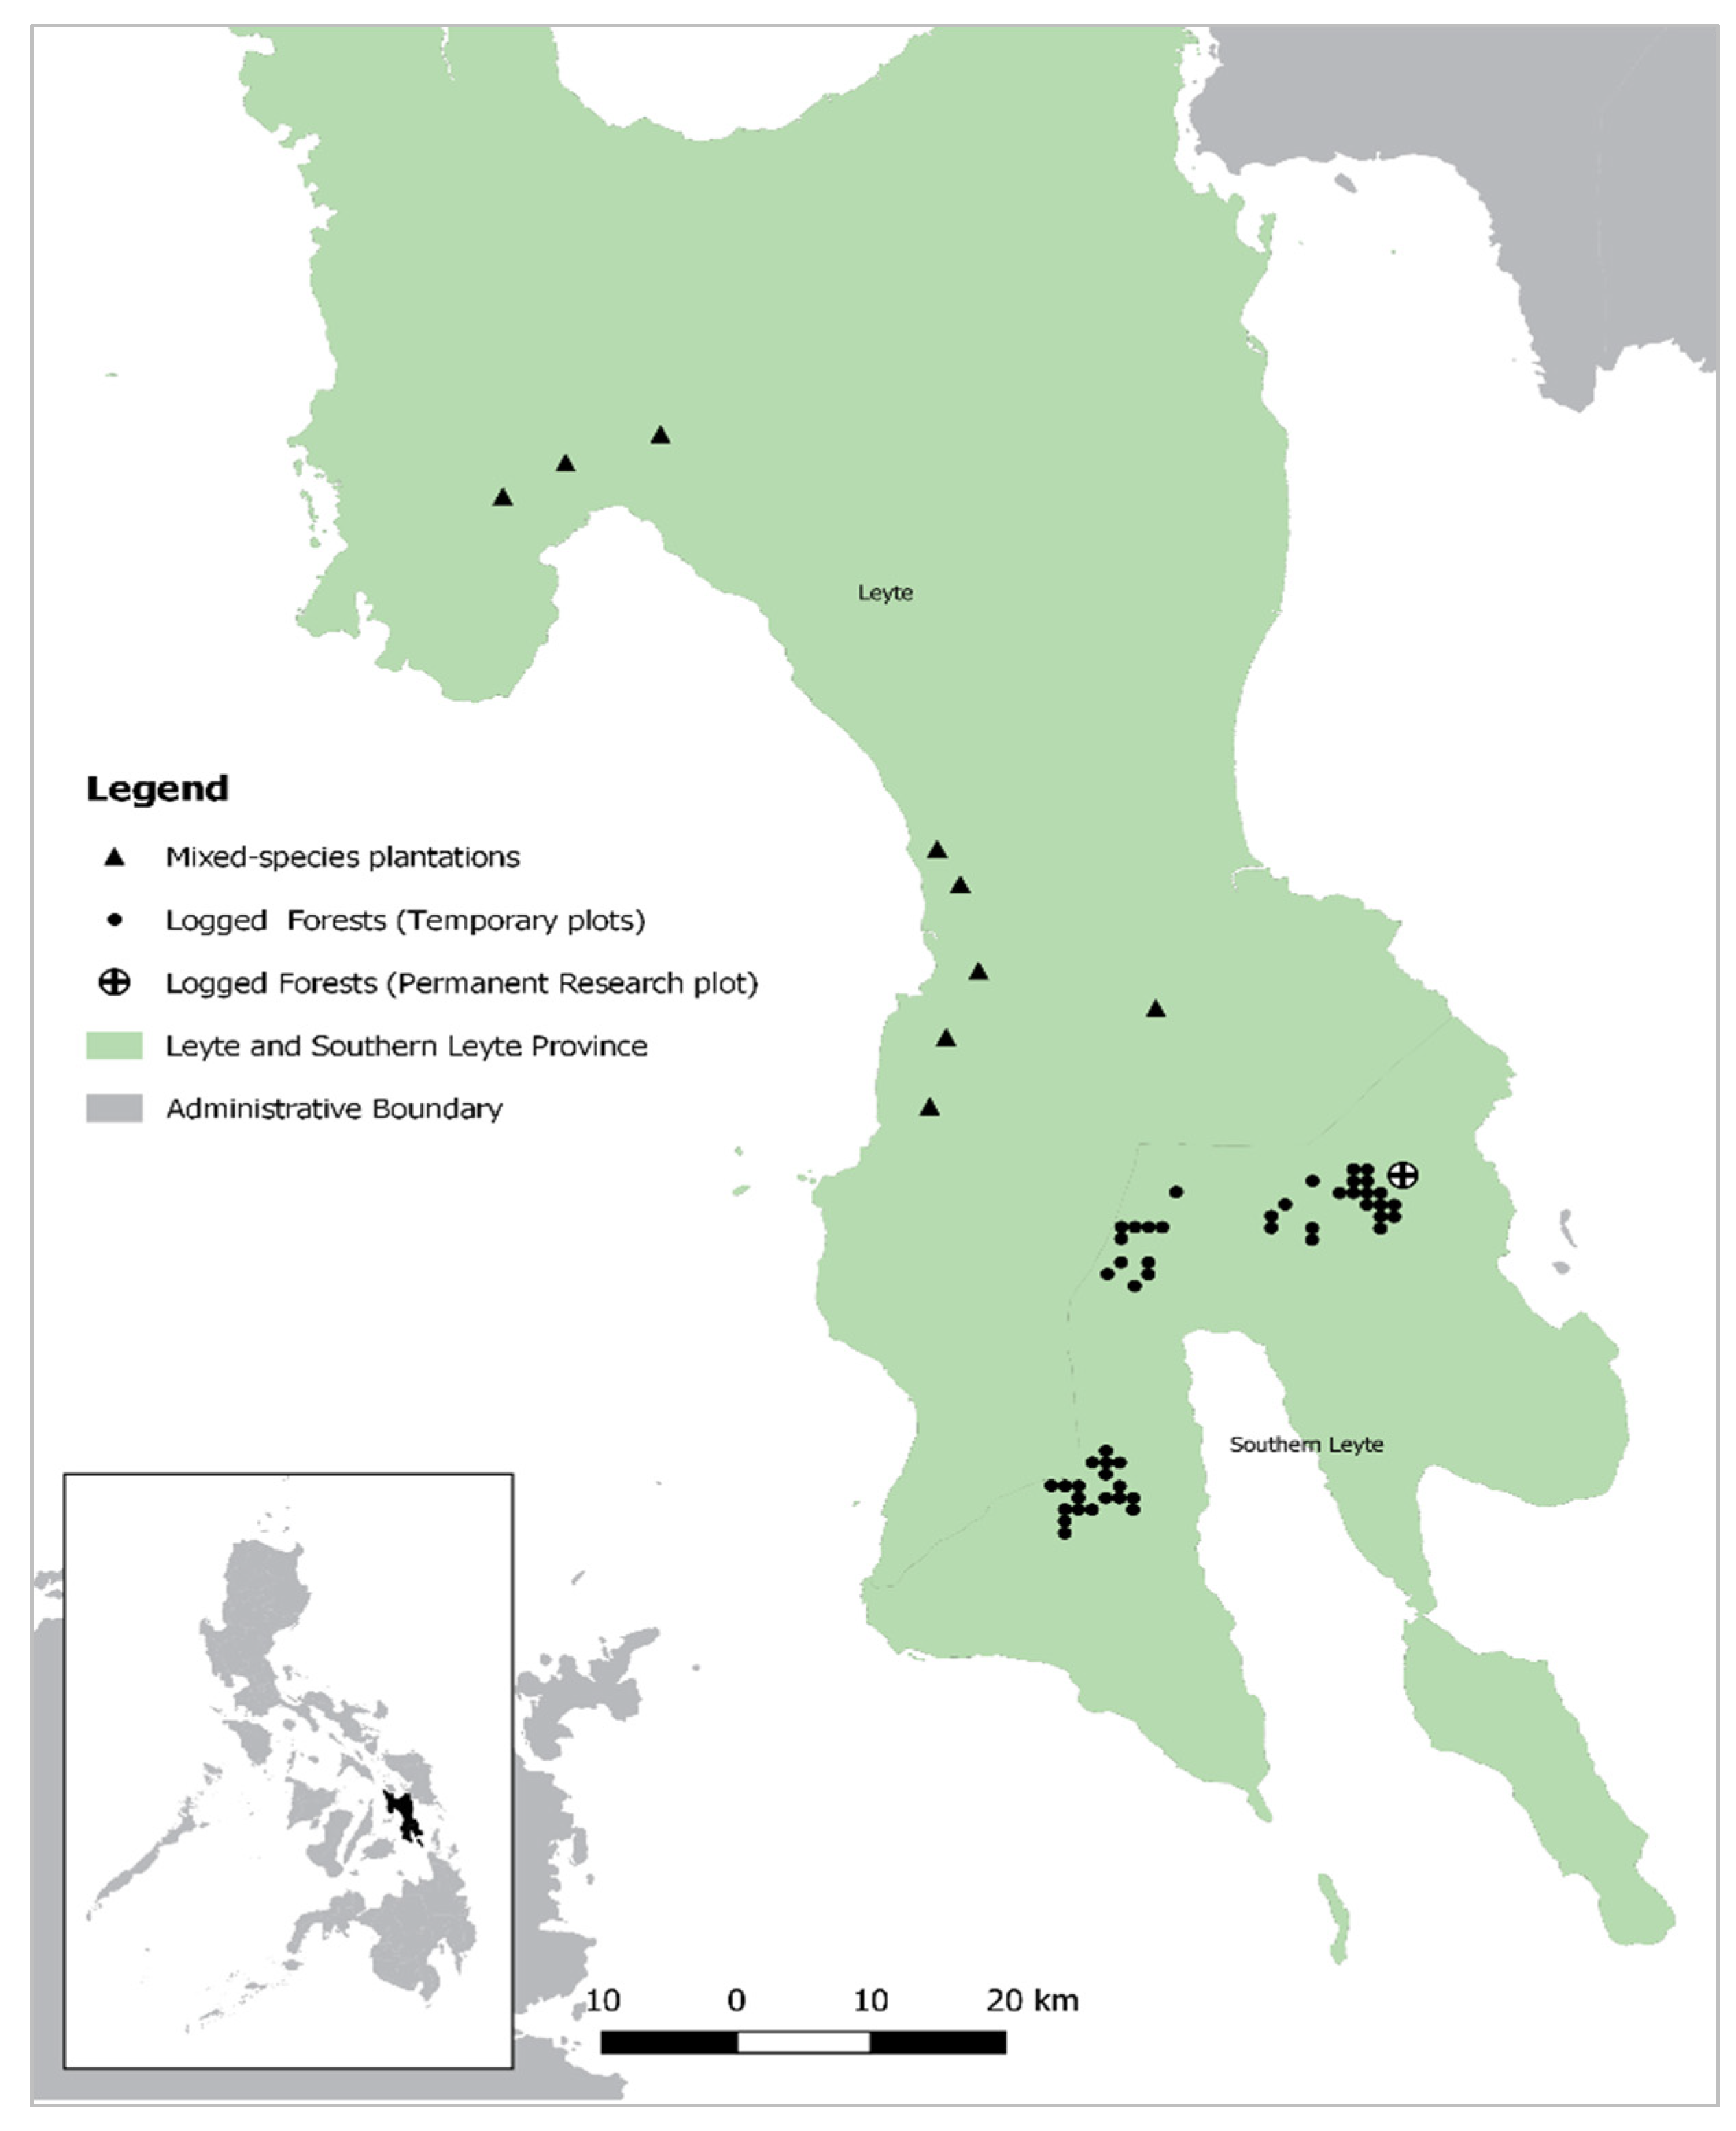
2.1. Study Sites
2.1.1. Study Sites: Logged Forests (Temporary Plots)
2.1.2. Study Sites: Logged Forests (Permanent Research Plot)
2.1.3. Study Sites: Mixed-Species Plantations (Rainforestation Plots)
2.2. Forest Data
2.3. Methods
2.4. Statistical Analyses
3. Results
3.1. Forest Site Factors
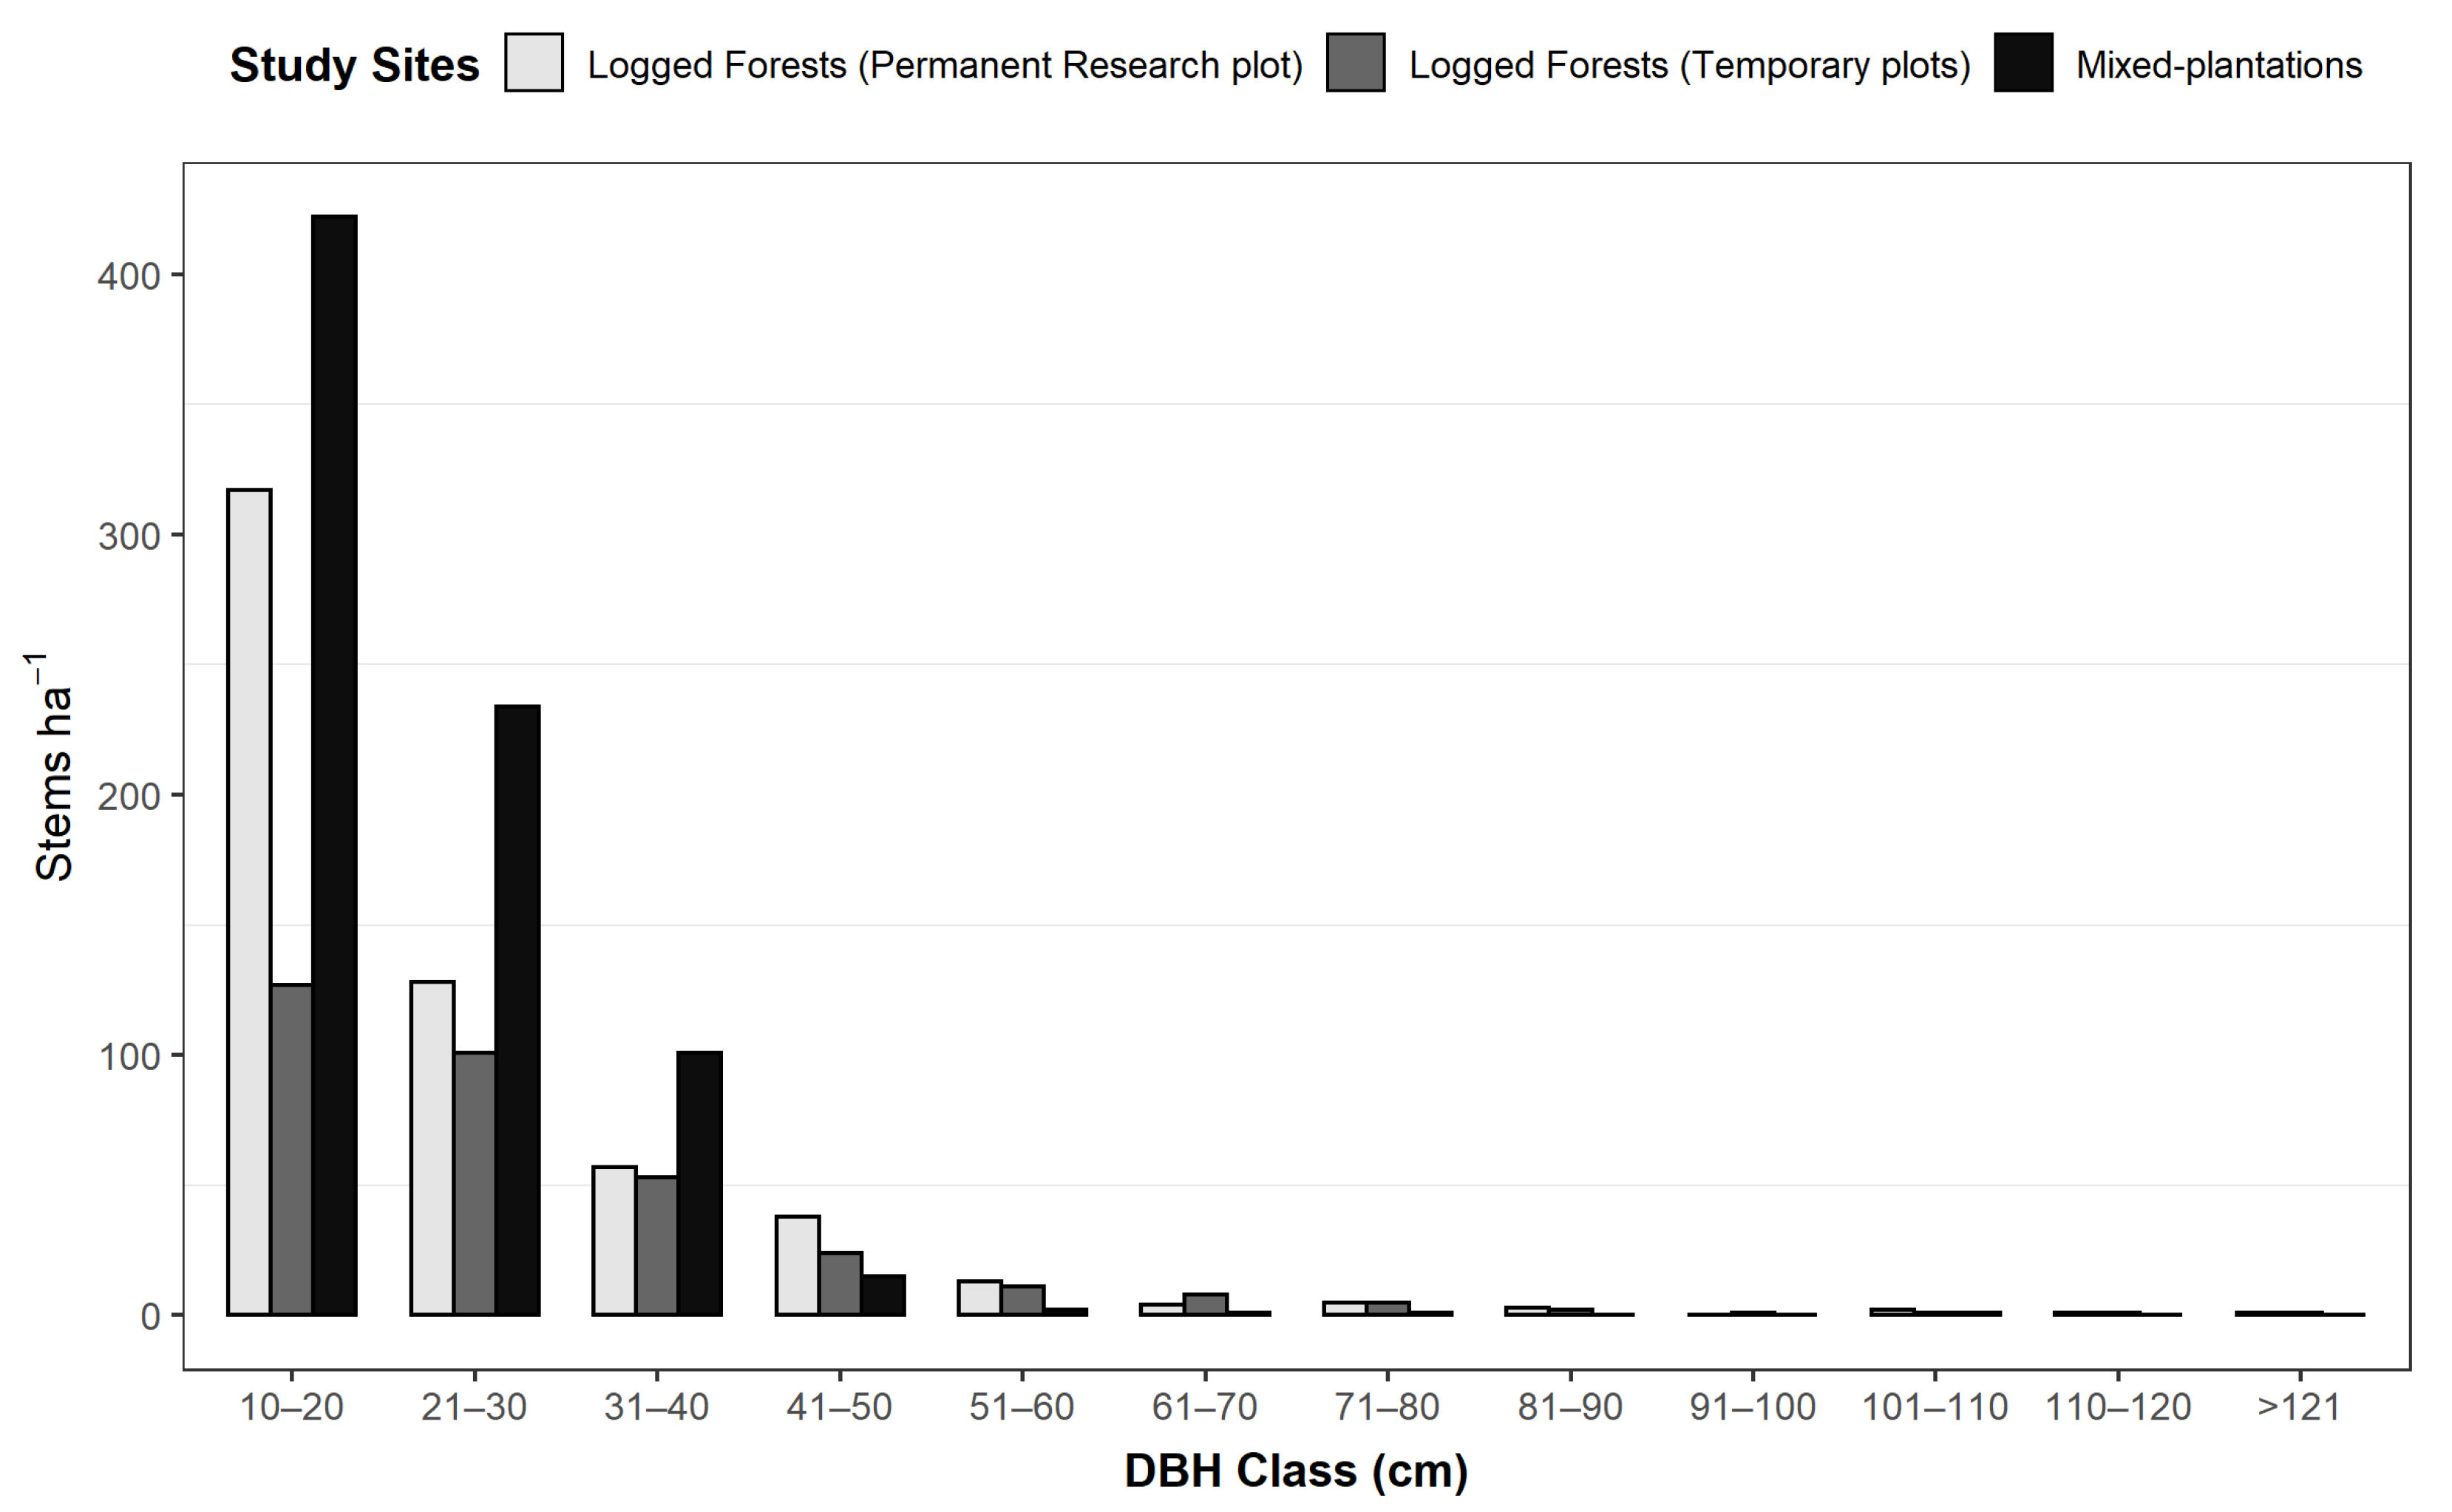
3.2. Diameter Class Distribution
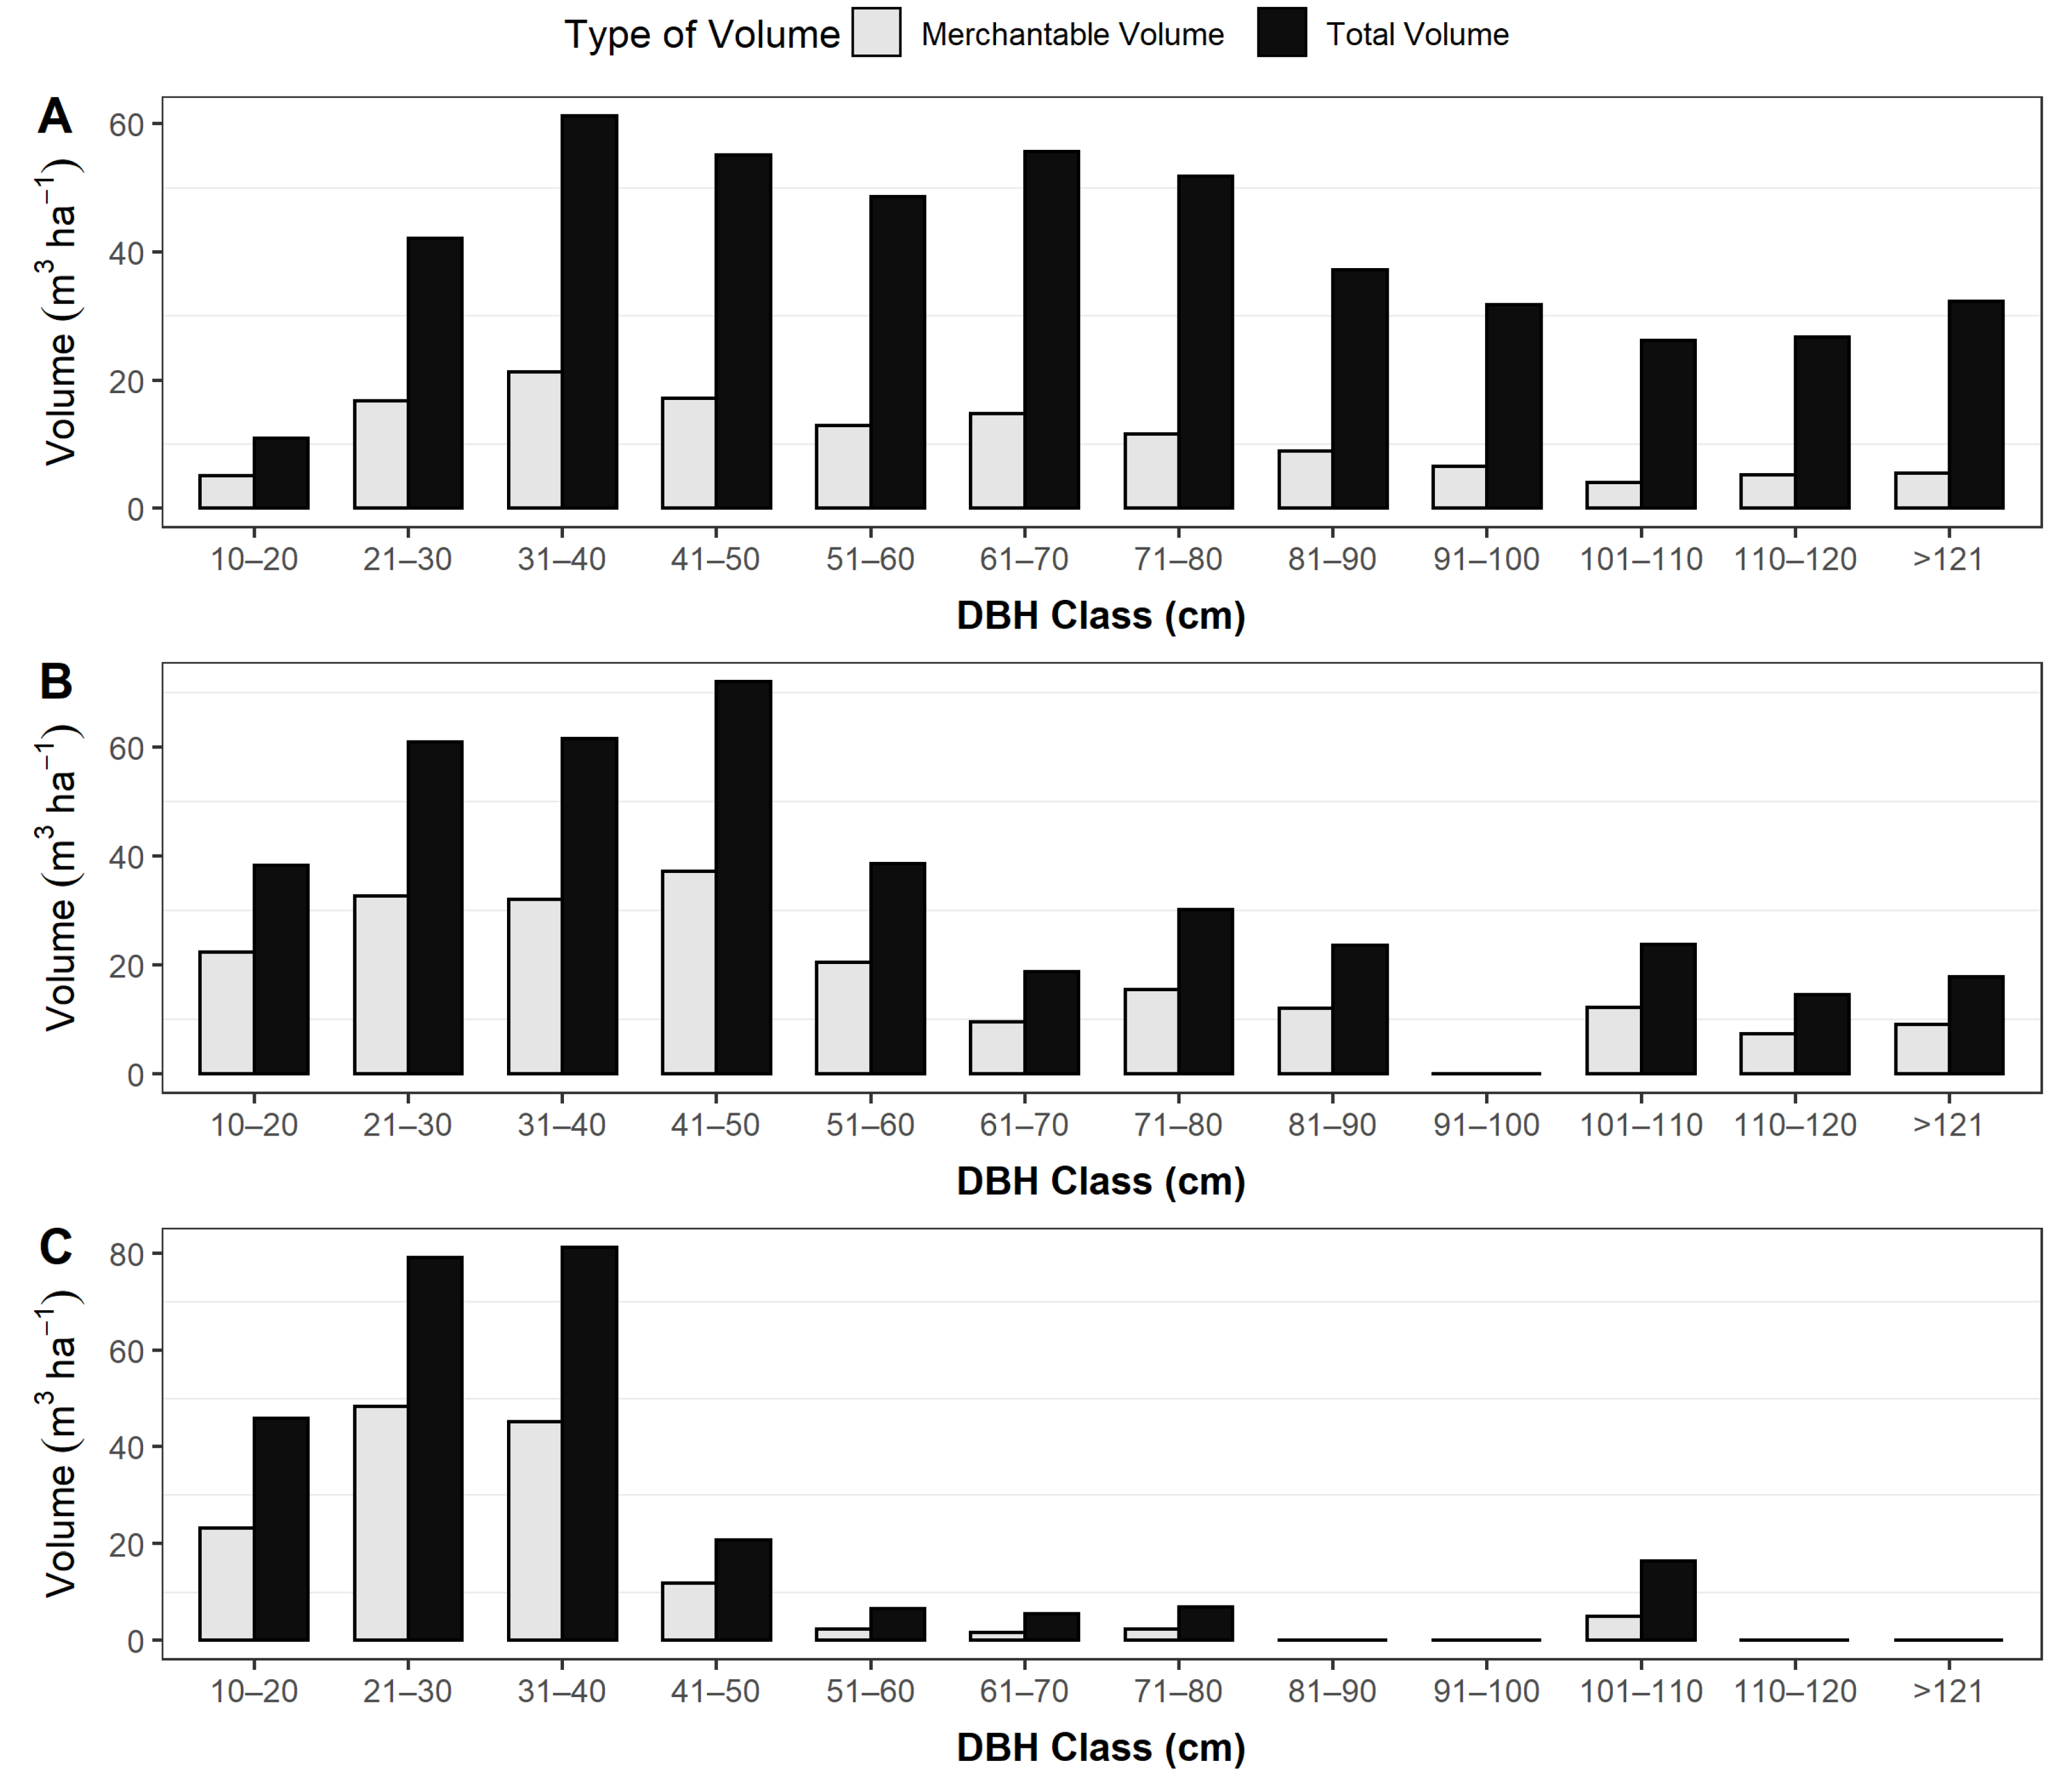
3.3. Basal Area, Carbon Stocks and Volume of the Trees (Static Data)
3.4. Growth of Basal Area, Carbon Stocks and Volume (Dynamic Data)
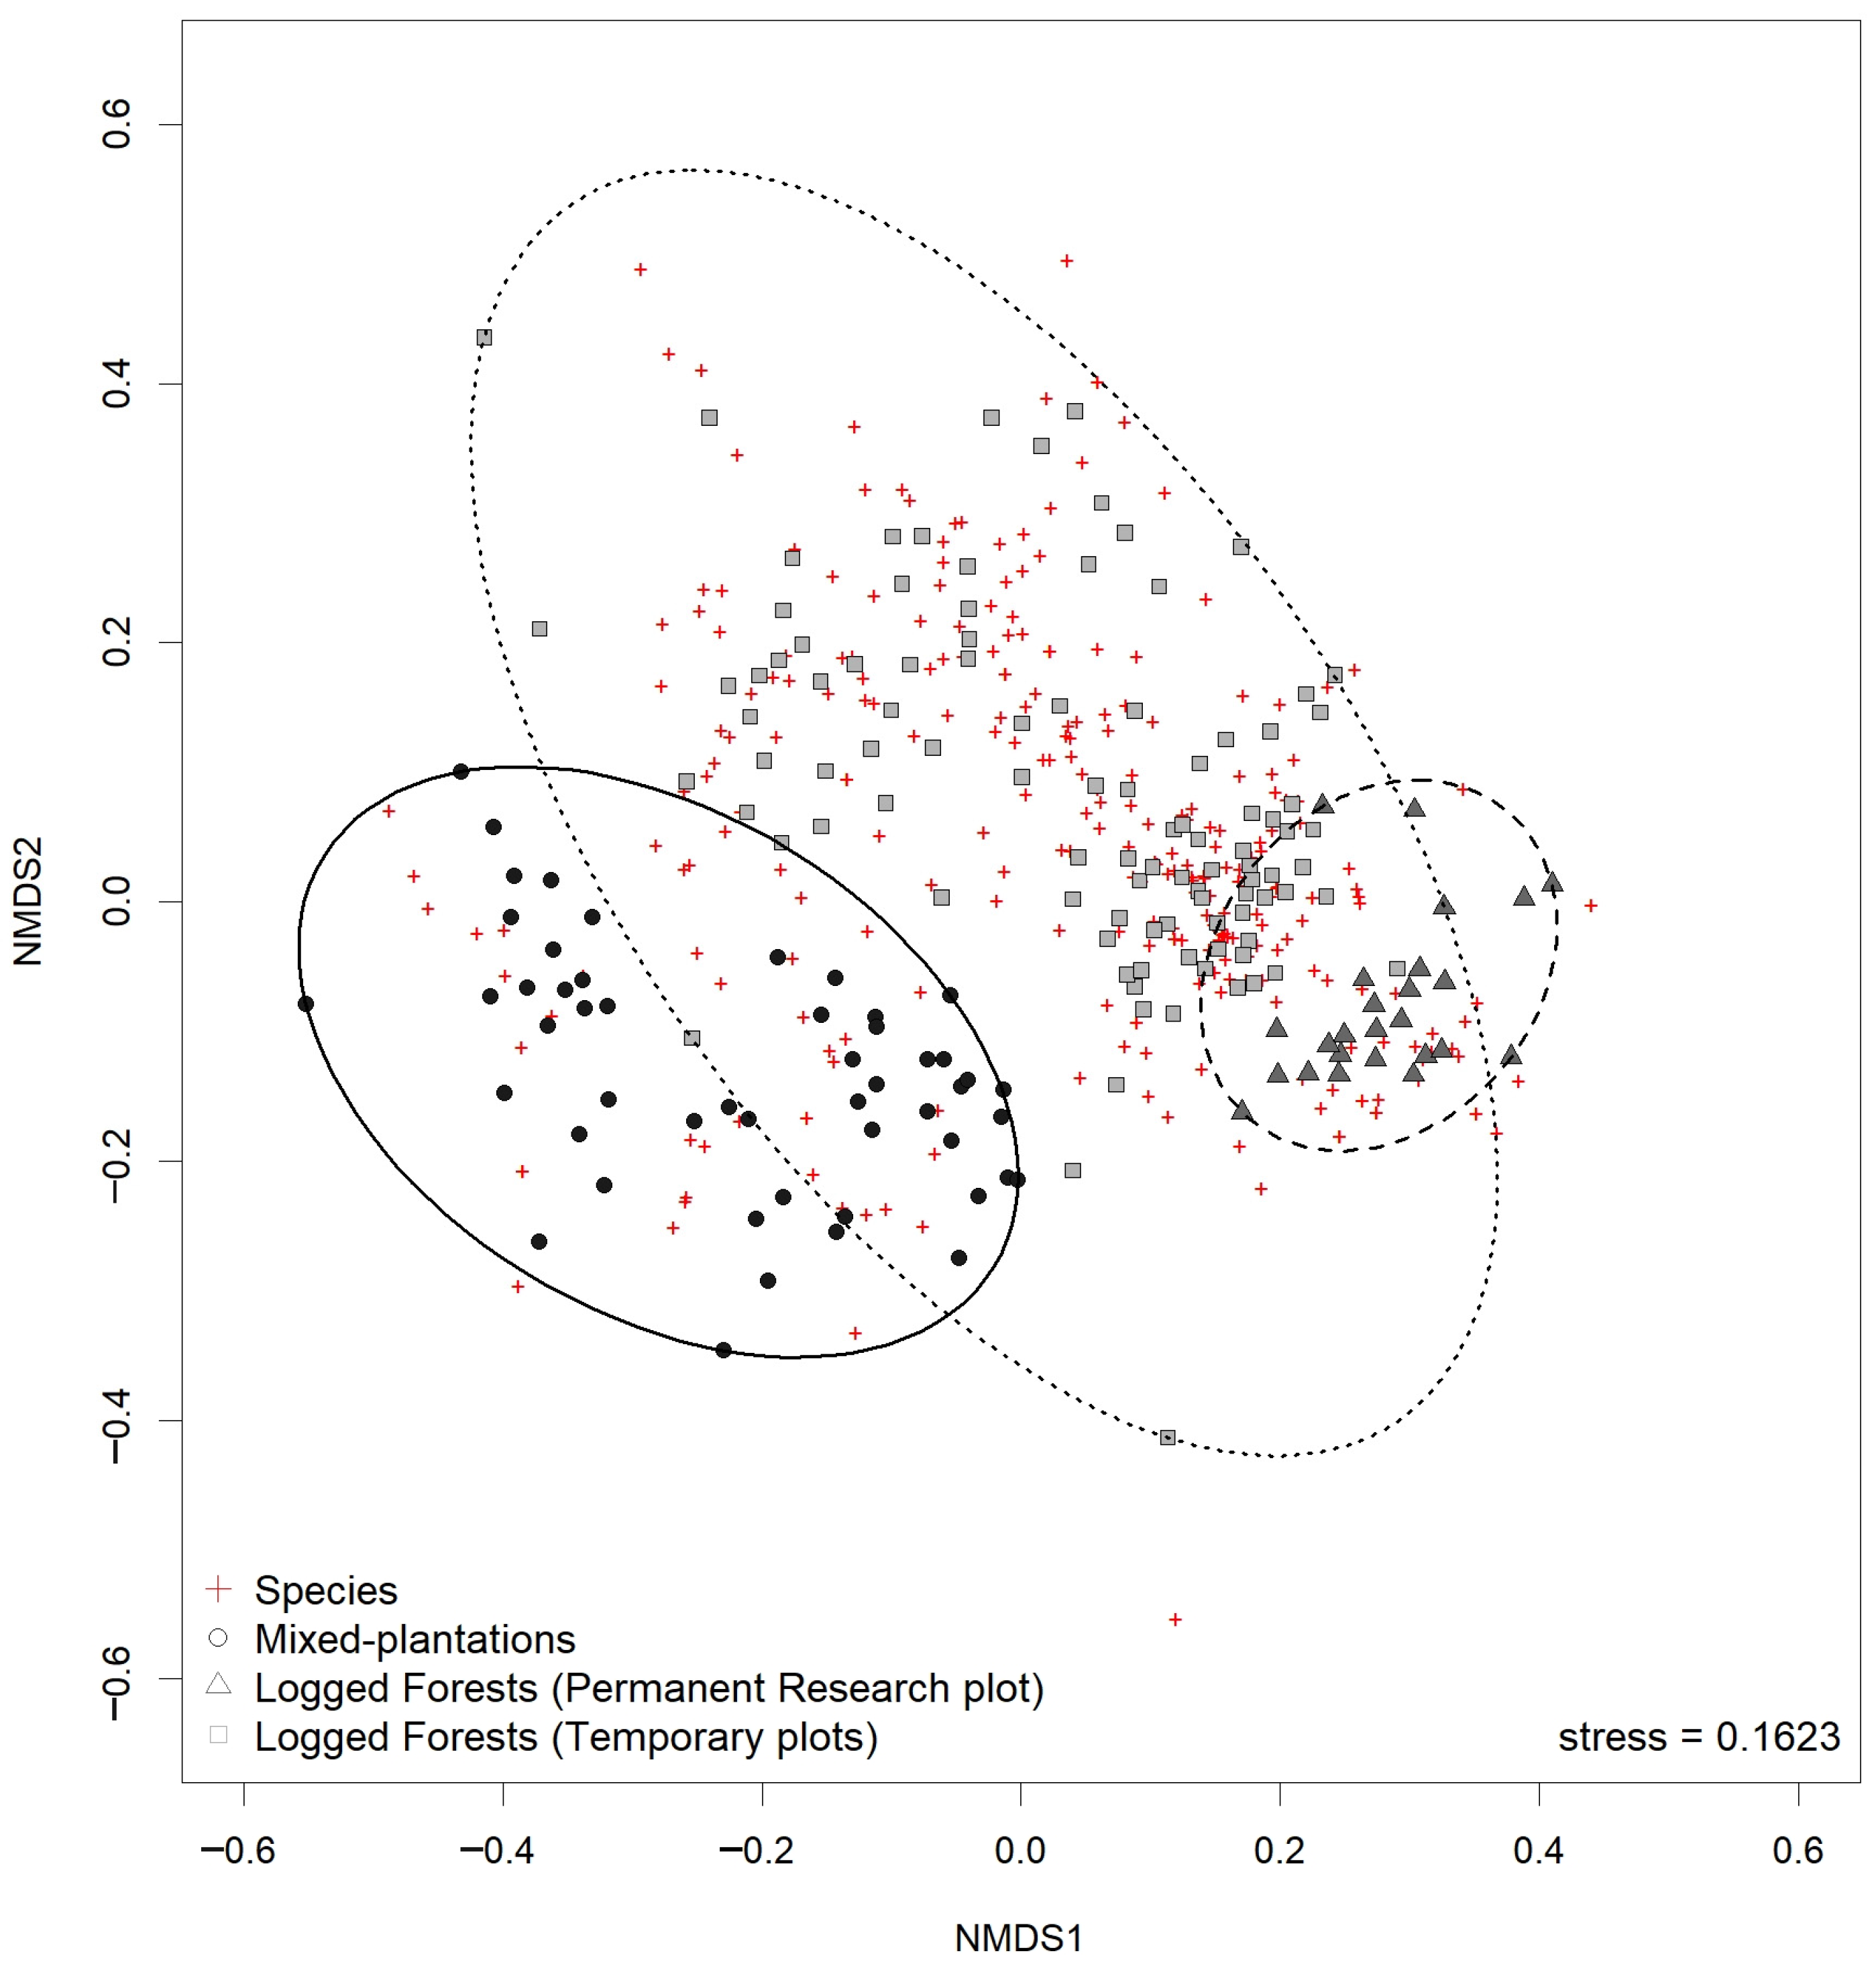
3.5. Floristic Similarity of Natural Secondary Forests and Mixed-Species Plantations
4. Discussion
4.1. Forest Structural Indicators for Use Potential
4.1.1. Carbon
4.1.2. Timber Volume
4.1.3. Biodiversity
4.2. Structural Indicators between Logged Natural Forests and Mixed-Species Plantations
4.3. Disturbance Agents Can Affect Structural Indicators
4.4. Implications for Regional and National Restoration Initiatives and Sustainable Forest Management
5. Conclusions
Author Contributions
Funding
Acknowledgments
Conflicts of Interest
References
- Barlow, J.; Gardner, T.A.; Araujo, I.S.; Avila-Pires, T.C.; Bonaldo, A.B.; Costa, J.E.; Esposito, M.C.; Ferreira, L.V.; Hawes, J.; Hernandez, M.I.M.; et al. Quantifying the biodiversity value of tropical primary, secondary, and plantation forests. Proc. Natl. Acad. Sci. USA 2007, 104, 18555–18560. [Google Scholar] [CrossRef]
- Gibson, L.; Lee, T.M.; Koh, L.P.; Brook, B.W.; Gardner, T.A.; Barlow, J.; Peres, C.A.; Bradshaw, C.J.A.; Laurance, W.F.; Lovejoy, T.E.; et al. Primary forests are irreplaceable for sustaining tropical biodiversity. Nature 2011, 478, 378–381. [Google Scholar] [CrossRef] [PubMed]
- Baccini, A.; Goetz, S.J.; Walker, W.S.; Laporte, N.T.; Sun, M.; Sulla-Menashe, D.; Hackler, J.; Beck, P.S.A.; Dubayah, R.; Friedl, M.A.; et al. Estimated carbon dioxide emissions from tropical deforestation improved by carbon-density maps. Nat. Clim. Chang. 2012, 2, 182. [Google Scholar] [CrossRef]
- Denman, K.L.; Brasseur, G.; Chidthaisong, A.; Ciasis, P.; Cox, P.M.; Dickinson, R.E.; Hauglustaine, D. Couplings between changes in the climate system and biochemistry. In Climate Change 2007: The Physical Science Basis. The Contribution of Working Group 1 to the Fourth Assessment Report of the Intergovernmental Panel on Climate Change; Solomon, S., Qin, D., Manning, M., Chen, Z., Marquis, M., Averyt, K.B., Tignor, M., Miller, H.L., Eds.; Cambridge University Press: Cambridge, UK, 2007; pp. 499–568. [Google Scholar]
- Griffiths, T. Seeing REDD? In Forests, Climate Change Mitigation and the Rights of Indigenous Peoples; Forest Peoples Programme: England, UK, 2008; pp. 1–63. [Google Scholar]
- Achard, F.; Eva, H.D.; Stibig, S.J.; Mayaux, P.; Gallego, J.; Richards, T.; Malingreau, J.P. Determination of deforestation rates of the world’s humid tropical forests. Science 2002, 297, 999–1002. [Google Scholar] [CrossRef] [PubMed]
- FAO. Global Forest Resources Assessment 2005-Main Report; Food and Agriculture Organization of the United Nations: Rome, Italy, 2006. [Google Scholar]
- Food and Agriculture Organization of the United Nations. Global Forest Resources Assessment 2015: How are the World’s Forests Changing; Food and Agriculture Organization of the United Nations: Rome, Italy, 2016; ISBN 978-92-5-109283-5. [Google Scholar]
- Mayaux, P.; Holmgren, P.; Achard, F.; Eva, H.; Stibig, H.-J.; Branthomme, A. Tropical forest cover change in the 1990s and options for future monitoring. Philos. Trans. R. Soc. B Biol. Sci. 2005, 360, 373–384. [Google Scholar] [CrossRef] [PubMed]
- Stibig, H.-J.; Achard, F.; Carboni, S.; Raši, R.; Miettinen, J. Change in tropical forest cover of Southeast Asia from 1990 to 2010. Biogeosciences 2014, 11, 247–258. [Google Scholar] [CrossRef]
- Chave, J.; Olivier, J.; Bongers, F.; Chatelet, P.; Forget, P.M.; Van der Meer, P.; Norden, N.; Reira, B.; Dominique, P.C. Above-ground biomass and productivity in a rain forest of eastern South America. J. Trop. Ecol. 2008, 24, 355–366. [Google Scholar] [CrossRef]
- Lewis, S.L.; Lopez-Gonzalez, G.; Sonke, B.; Affum-Baffoe, K.; Baker, T.R.; Ojo, L.O.; Phillips, O.L.; Reitsma, J.M.; White, L.; Comiskey, J.A.; et al. Increasing carbon storage in intact African tropical forests. Nature 2009, 457, 1003–1006. [Google Scholar] [CrossRef]
- Phillips, O.L. Changes in Amazonian forest biomass, dynamics and composition, 1980–2002. Amaz. Clim. Chang. Geophys. Monogr. Ser. 2009, 373–387. [Google Scholar] [CrossRef]
- Rudel, T.K.; Schneider, L.; Uriarte, M. Forest transitions: An introduction. Land Use Policy 2010, 27, 95–97. [Google Scholar] [CrossRef]
- Mather, A.S. Recent Asian forest transitions in relation to forest-transition theory. Int. Rev. 2007, 9. [Google Scholar]
- Meyfroidt, P.; Lambin, E.F. Global Forest Transition: Prospects for an End to Deforestation. Annu. Rev. Environ. Resour. 2011, 36, 343–371. [Google Scholar] [CrossRef]
- Rudel, T.K. Tree farms: Driving forces and regional patterns in the global expansion of forest plantations. Land Use Policy 2009, 26, 545–550. [Google Scholar] [CrossRef]
- Rudel, T.K.; Coomes, O.T.; Moran, E.; Achard, F.; Angelsen, A.; Xu, J.; Lambin, E. Forest transitions: Towards a global understanding of land use change. Glob. Environ. Chang. 2005, 15, 23–31. [Google Scholar] [CrossRef]
- Chokkalingam, U.; Carandang, A.P.; Pulhin, J.M.; Lasco, R.D.; Peras, R.J.; Toma, T. One Century of Forest Rehabilitation in the Philippines: Approaches, Outcomes and Lessons; Center for International Forestry Research: Bogor, Indonesia, 2006. [Google Scholar]
- Lasco, R. Forest carbon budgets in Southeast Asia following harvesting and land cover change. Sci. China 2002, 45, 55–64. [Google Scholar]
- Moya, T.B.; Malayang, B.S. Climate variability and deforestation-reforestation dynamics in the Philippines. Environ. Dev. Sustain. 2004, 6, 261–277. [Google Scholar] [CrossRef]
- Amponin, J.A.; Evans, J.W. Assessing the Intended Nationally Determined Contributions of ADB Developing Members; Asian Development Bank: Mandaluyong City, Metro Manila, Philippines, 2016; p. 128. [Google Scholar]
- PNRPS. Philippine National REDD+ Strategy; Department of Environment and Natural Resources: Manila, Philippines, 2010; pp. 1–110.
- Biodiversity Management Bureau. Fifth National Report to the Convention of Biological Diversity; Department of Environment and Natural Resources: Manila, Philippines, 2014.
- Liu, D.S.; Iverson, L.I.; Brown, S. Rates and pattern of deforestation in the Philippines: Application of geographic information system analysis. Ecol. Manag. 1993, 57, 1–16. [Google Scholar] [CrossRef]
- Bautista, G.M. The forestry crisis in the Philippines: Nature, causes, and issues. Dev. Econ. 1990, 28, 67–94. [Google Scholar] [CrossRef]
- Forest Management Bureau. 2017 Philippine Forestry Statistics; Forest Management Bureau, Department of Environment and Natural Resources: Manila, Philippines, 2017.
- Nograles, C. An Act Imposing A Logging Ban in the Province of Southern Leyte; Congress of the Philippines: Manila, Philippines, 2009.
- Carandang, A.; Bugayong, L.; Dolom, P.; Garcia, L.; Villanueva, M.; Espiritu, N. Analysis of Key Drivers of Deforestation and Forest Degradation in the Philippines; Deutsche Gesellschaft für Internationale Zusammenarbeit (GIZ) GmbH: Manila, Philippines, 2013. [Google Scholar]
- Lasco, R.D.; Veridiano, R.K.A.; Habito, M.; Pulhin, F.B. Reducing emissions from deforestation and forest degradation plus (REDD+) in the Philippines: Will it make a difference in financing forest development? Mitig. Adapt. Strat. Glob. Chang. 2013, 18, 1109–1124. [Google Scholar] [CrossRef]
- FMB; DENR. Department of Environment and Natural Resource Administrative Order No. 2016-20; Forest Management Bureau: Manila, Philippines, 2016. [Google Scholar]
- Milan, P.; Margraf, J. Rainforestation farming: An alternative to conventional concepts. Ann. Trop. Res. 1994, 16, 17–27. [Google Scholar]
- Göltenboth, F. “Rainforestation Farming”-an Appropriate and Applied Ecological Approach for Landscape Rehabilitation and Impact Mitigation of Climate Change in the Humid Tropics. Ann. Trop. Res. 2011, 33, 85–106. [Google Scholar] [CrossRef]
- Velarde, G.L.M.; Gravoso, R.S.; Cagasan, E.G.; Gabrillo, C.A. Most significant changes experienced by farmers from adopting rainforestation farming. Ann. Trop. Res. Spec. Issue Smallhold. 2007, 29, 109–122. [Google Scholar] [CrossRef]
- Nguyen, H.; Herbohn, J.; Firn, J.; Lamb, D. Biodiversity–productivity relationships in small-scale mixed-species plantations using native species in Leyte province, Philippines. Ecol. Manag. 2012, 274, 81–90. [Google Scholar] [CrossRef]
- Nguyen, H.; Lamb, D.; Herbohn, J.; Firn, J. Designing Mixed Species Tree Plantations for the Tropics: Balancing Ecological Attributes of Species with Landholder Preferences in the Philippines. PLoS ONE 2014, 9, e95267. [Google Scholar] [CrossRef]
- Ahrens, O.; Henders, S.; Langkau, M.; Lindemann, S.; Müller, T.; Petri, M. Cost-Benefit Analysis. Comparison of Different Land-Uses in Leyte, Philippines; Faculty of Sciences and Wood Ecology: Göttingen, Germany, 2004. [Google Scholar]
- Le, H.D.; Smith, C.; Herbohn, J. What drives the success of reforestation projects in tropical developing countries? The case of the Philippines. Glob. Environ. Chang. 2014, 24, 334–348. [Google Scholar] [CrossRef]
- Göltenboth, F.; Hutter, C.-P.; Blessing, K.; Quayle, J.; Suryono, A.; Indarsiani, F.; Isaac, B.; Milan, P. Rainforestation Farming: A Farmer’s Guide to Sustainable Organic Farming and Agroforest Biodiversity Management; Visayas State University: Leyte, Philippines, 2015. [Google Scholar]
- Göltenboth, F.; Hutter, C.-P. New options for land rehabilitation and landscape ecology in Southeast Asia by “rainforestation farming”. J. Nat. Conserv. 2004, 12, 181–189. [Google Scholar] [CrossRef]
- Barrera, A.; Aristorenas, I.; Tingzon, J. Soil survey of Leyte Province, Philippines; Bureau of Print: Manila, Philippines, 1954. [Google Scholar]
- JICA. Report on the Mineral Exploration of Mineral Deposits and Tectonics of Two Contrasting Geologic Environment in the Republic of the Philippines; Japan International Cooperation Agency: Manila, Philippines, 1990.
- Panagos, P.; Jones, A.; Bosco, C.; Kumar, P.S.S. European digital archive on soil maps (EuDASM): Preserving important soil data for public free access. Int. J. Digit. Earth 2011, 4, 434–443. [Google Scholar] [CrossRef]
- Coronas, J. Census of the Philippine Islands the Climate and Weather of the Philippines, 1903-1918; Bureau of Printing: Manila, Philippines, 1920. [Google Scholar]
- Kintanar, R.L. Climate of the Philippines; Philippine Atmospheric, Geophysical and Astronomical Services Administration: Quezon City, Philippines, 1984.
- Jarvis, A.; Reuter, H.I.; Nelson, A.; Guevarra, E. Hole-Filled SRTM for the Globe Version 4. Available online: https://cgiarcsi.community/data/srtm-90m-digital-elevation-database-v4-1/ (accessed on 8 July 2019).
- Fernando, E.; Suh, M.H.; Lee, J.; Lee, D.K. Forest Formations of the Philippines; ASEAN-Korea Environmental Cooperation Unit (AKECU): Laguna, Philippines, 2008. [Google Scholar]
- Langenberger, G. Forest Vegetation Studies on the Foothills of Mt. Pangasugan, Leyte, The Philippines; Deutsch gesselschäft für Technische Zusammenarbeit (GTZ) GmbH: Manila, Philippines, 2000. [Google Scholar]
- Schade, J.; Ludwig, R. Climate Relevant Forest Policy and Piloting of REDD; Deutsche Gesellschaft für Internationale Zusammenarbeit: Manila, Philippines, 2013. [Google Scholar]
- Magurran, A. Measuring Biological Diversity; Blackwell Publishing: Oxford, UK, 2004; pp. 1–132. [Google Scholar]
- Magurran, A.; McGill, B. Biological Diversity: Frontiers in Measurement and Assessment; Oxford University Press: Oxford, UK, 2011; pp. 1–159. ISBN 978-0-19-958067-5. [Google Scholar]
- Newton, A. Forest Ecology and Conservation: A Handbook of Techniques; Oxford University Press: Oxford, UK, 2007; pp. 1–471. ISBN 978-0-19-856745-5. [Google Scholar]
- Condit, R. Tropical Census Plots; Springer-Verlag: Berlin, Germany, 1998. [Google Scholar]
- IUCN. IUCN Red List Categories and Criteria: Version 3.1.; IUCN: Gland, Switzerland; Cambridge, UK, 2012; ISBN 978-2-8317-1435-6. [Google Scholar]
- FPRDI; ITTO. Manual on the Properties and Uses of Lesser-Used Species of Philippine Timbers; Forest Products Research and Development Institute and International Tropical Timber Organization: Los Banos, Laguna, Philippines, 1997. [Google Scholar]
- Forest Management Bureau. National List of Threatened Philippine Plants and Their Categories and the List of Other Species; Department of Environment and Natural Resources: Manila, Philippines, 2007.
- Hogan, J.A.; Zimmerman, J.K.; Thompson, J.; Uriarte, M.; Swenson, N.G.; Condit, R.; Hubbell, S.; Johnson, D.J.; Sun, I.F.; Chang-Yang, C.-H.; et al. The Frequency of Cyclonic Wind Storms Shapes Tropical Forest Dynamism and Functional Trait Dispersion. Forests 2018, 9, 404. [Google Scholar] [CrossRef]
- Chave, J.; Réjou-Méchain, M.; Búrquez, A.; Chidumayo, E.; Colgan, M.S.; Delitti, W.B.C.; Duque, A.; Eid, T.; Fearnside, P.M.; Goodman, R.C.; et al. Improved allometric models to estimate the aboveground biomass of tropical trees. Glob. Chang. Biol. 2014, 20, 3177–3190. [Google Scholar] [CrossRef]
- Lasco, R.D.; Pulhin, F.B. Carbon budgets of forest ecosystems in the Philippines. J. Environ. Sci. Manag. 2009, 12, 1–13. [Google Scholar]
- Sullivan, M.J.P.; Talbot, J.; Lewis, S.L.; Phillips, O.L.; Qie, L.; Begne, S.K.; Chave, J.; Cuni-Sanchez, A.; Hubau, W.; Lopez-Gonzalez, G.; et al. Diversity and carbon storage across the tropical forest biome. Sci. Rep. 2017, 7. [Google Scholar] [CrossRef] [PubMed]
- Achard, F.; Boschetti, L.; Brown, S.; Brady, M.; DeFries, R.; Grassi, G.; Herold, M.; Mollicone, D.; Mora, B.; Pandey, D. A Sourcebook of Methods and Procedures for Monitoring and Reporting Anthropogenic Greenhouse Gas Emissions and Removals Associated with Deforestation, Gains and Losses of Carbon Stocks in Forests Remaining Forests, and Forestation; GOFC-GOLD: Wageningen, The Netherlands, 2014. [Google Scholar]
- Magnussen, S.; Reed, D. Knowledge reference for national forest assessments—modeling for estimation and monitoring. In Modeling for Estimation and Monitoring; Food and Agriculture Organization of the United Nations: Rome, Italy, 2004. [Google Scholar]
- Newbould, P.J. Methods for Estimating the Primary Production of Forests; Blackwell Scientific Publications: Oxford, UK, 1967. [Google Scholar]
- Principal coordinate analysis and non-metric multidimensional scaling. In Analysing Ecological Data; Zuur, A.F., Ieno, E.N., Smith, G.M., Eds.; Statistics for Biology and Health; Springer: New York, NY, USA, 2007; pp. 259–264. ISBN 978-0-387-45972-1. [Google Scholar]
- Greenacre, M.; Primicerio, R. Multivariate Analysis of Ecological Data; Fundación BBVA: Bilbao, Spain, 2014; ISBN 978-84-92937-50-9. [Google Scholar]
- R Core Team. R: A Language and Environment for Statistical Computing; R Foundation for Statistical Computing: Vienna, Austria, 2019. [Google Scholar]
- RStudio Team. RStudio: Integrated Development for R.; RStudio, Inc.: Boston, CA, USA, 2019. [Google Scholar]
- Öztuna, D.; Elhan, A.H.; Tüccar, E. Investigation of four different normality tests in terms of type 1 error rate and power under different distributions. Turk. J. Med. Sci. 2006, 36, 171–176. [Google Scholar]
- European Environment Agency. Common International Classification of Ecosystem Services; EEA (Program on Natural Systems and Vulnerability): Copenhagen, Denmark, 2018. [Google Scholar]
- Haines-Young, R.; Potschin, M. Guidance on the Application of the Revised Structure; Fabis Consulting Ltd.: Nottingham, UK, 2017. [Google Scholar]
- Haines-Young, R.; Potschin, M. The links between biodiversity, ecosystem services and human well-being. In Ecosystem Ecology; Raffaelli, D.G., Frid, C.L.J., Eds.; Cambridge University Press: Cambridge, UK, 2010; pp. 110–139. ISBN 978-0-511-75045-8. [Google Scholar]
- Maes, J.; Teller, A.; Erhard, M.; Grizzetti, B.; Barredo, J.; Paracchini, M.; Conde, S.; Somma, F.; Orgiazzi, A.; Jones, A.; et al. Mapping and Assessment of Ecosystems and Their Services: An Analytical Framework for Ecosystem Condition.; Publications Office of the European Union: Luxembourg, 2018.
- Lasco, R.; Pulhin, F.; Cruz, R.V.; Pulhin, J.; Roy, S.S.N. Carbon Budgets of Terrestrial Ecosystems in the Pantabangan-Carranglan Watershed; Assessments of Impacts and Adaptations of Climate Change: Washington, DC, USA, 2005. [Google Scholar]
- Agus, C.; Putra, P.B.; Faridah, E.; Wulandari, D.; Napitupulu, R.R.P. Organic Carbon Stock and their Dynamics in Rehabilitation Ecosystem Areas of Post Open Coal Mining at Tropical Region. Procedia Eng. 2016, 159, 329–337. [Google Scholar] [CrossRef][Green Version]
- Eggleston, H.S.; Buendia, L.; Miwa, K.; Ngara, T.; Tanabe, K. 2006 IPCC Guidelines for National Greenhouse Gas Inventories; Institute for Global Environmental Strategies: Hayama, Japan, 2006. [Google Scholar]
- Mukul, S.A.; Herbohn, J.; Firn, J. Tropical secondary forests regenerating after shifting cultivation in the Philippines uplands are important carbon sinks. Sci. Rep. 2016, 6. [Google Scholar] [CrossRef] [PubMed]
- Cairns, M.A.; Brown, S.; Helmer, E.H.; Baumgardner, G.A. Root biomass allocation in the world’s upland forests. Oecologia 1997, 111, 1–11. [Google Scholar] [CrossRef] [PubMed]
- Boonpragob, K. Estimating greenhouse gas emission and sequestration from land-use change and forestry in Thailand. In Greenhouse Gas Emission, Aerosols, Land Use and Cover Changes in Southeast Asia; Southeast Asia Regional Committee for Start International Inc.: Bangkok, Thailand, 1998; pp. 18–25. [Google Scholar]
- Brown, S.; Lugo, A.E. Biomass of tropical forests: A new estimate based on forest volumes. Science 1984, 223. [Google Scholar] [CrossRef]
- Silver, W.L.; Ostertag, R.; Lugo, A.E. The Potential for Carbon Sequestration Through Reforestation of Abandoned Tropical Agricultural and Pasture Lands. Restor. Ecol. 2000, 8, 394–407. [Google Scholar] [CrossRef]
- Letcher, S.G.; Chazdon, R.L. Rapid Recovery of Biomass, Species Richness, and Species Composition in a Forest Chronosequence in Northeastern Costa Rica: Rapid Forest Recovery in Costa Rica. Biotropica 2009, 41, 608–617. [Google Scholar] [CrossRef]
- Martin, P.A.; Newton, A.C.; Bullock, J.M. Carbon pools recover more quickly than plant biodiversity in tropical secondary forests. Proc. R. Soc. B Biol. Sci. 2013, 280, 20132236. [Google Scholar] [CrossRef]
- Cifuentes-Jara, M. Aboveground Biomass and Ecosystem Carbon Pools in Tropical Secondary Forests Growing in Six Life Zones of Costa Rica; Oregon State University: Corvallis, OR, USA, 2009. [Google Scholar]
- Berry, N.J.; Phillips, O.L.; Lewis, S.L.; Hill, J.K.; Edwards, D.P.; Tawatao, N.B.; Ahmad, N.; Magintan, D.; Khen, C.V.; Maryati, M.; et al. The high value of logged tropical forests: Lessons from northern Borneo. Biodivers. Conserv. 2010, 19, 985–997. [Google Scholar] [CrossRef]
- Chazdon, R.L.; Letcher, S.G.; van Breugel, M.; Martinez-Ramos, M.; Bongers, F.; Finegan, B. Rates of change in tree communities of secondary Neotropical forests following major disturbances. Philos. Trans. R. Soc. B Biol. Sci. 2007, 362, 273–289. [Google Scholar] [CrossRef] [PubMed]
- Edwards, D.P.; Larsen, T.H.; Docherty, T.D.S.; Ansell, F.A.; Hsu, W.W.; Derhe, M.A.; Hamer, K.C.; Wilcove, D.S. Degraded lands worth protecting: The biological importance of Southeast Asia’s repeatedly logged forests. Proc. R. Soc. B Biol. Sci. 2011, 278, 82–90. [Google Scholar] [CrossRef] [PubMed]
- Hu, J.; Herbohn, J.; Chazdon, R.; Baynes, J.; Wills, J.; Meadows, J.; Sohel, S. Recovery of species composition over 46 years in a logged Australian tropical forest following different intensity silvicultural treatments. Ecol. Manag. 2018, 409, 660–666. [Google Scholar] [CrossRef]
- Chazdon, R.L. Beyond Deforestation: Restoring Forests and Ecosystem Services on Degraded Lands. Science 2008, 320, 1458–1460. [Google Scholar] [CrossRef]
- Phillips, J.; Duque, Á.; Scott, C.; Wayson, C.; Galindo, G.; Cabrera, E.; Chave, J.; Peña, M.; Álvarez, E.; Cárdenas, D.; et al. Live aboveground carbon stocks in natural forests of Colombia. Ecol. Manag. 2016, 374, 119–128. [Google Scholar] [CrossRef]
- Stas, S.M. Above-Ground Biomass and Carbon Stocks in A Secondary Forest in Comparison with Adjacent Primary Forest on Limestone in Seram, the Moluccas, Indonesia; Center for International Forestry Research (CIFOR): Bogor, Indonesia, 2014. [Google Scholar]
- Weidelt, H.J. The Effect of Silvicultural Treatment on Logged-Over Dipterocarp Forest; Japanese IUFRO Congress Council: Kyoto, Japan, 1981. [Google Scholar]
- Banaag, V.S. Aspects of Management and Silviculture of Philippine Dipterocarp Forests; Schriftenreihe der GTZ 132: Eschborn, Germany, 1982. [Google Scholar]
- Kawahara, T.; Kanazawa, Y.; Sakurai, S. Biomass and net production of man-made forests in the Philippines. Jpn. Soc. 1981, 63. [Google Scholar] [CrossRef]
- Cedergren, J.; Falck, J.; Garcia, A.; Goh, F.; Hagner, M. Structure, composition and commercial characteristics of a primary Dipterocarp forest in Sabah, Malaysia. J. Trop. Sci. 2002, 14, 304–321. [Google Scholar]
- Georg-August Universität, Göttingen, Germany; Visayas State University, Philippines. Sustainable Forest Management Plan of a Lowland Dipterocarp Forest and Plantations in Barangay Puntana, Southern Leyte, Philippines; Georg-August Universität: Göttingen, Germany; Visayas State University: Baybay City, Philippines.
- Goldberg, D.E. Components of Resource Competition in Plant Communities. In Perspectives on Plant Competition; Grace, J.B., Tilman, D., Eds.; Academic Press, Inc.: San Diego, CA, USA, 1990; pp. 27–49. [Google Scholar]
- Goldberg, D.E.; Landa, K. Competitive Effect and Response: Hierarchies and Correlated Traits in the Early Stages of Competition. J. Ecol. 1991, 79, 1013. [Google Scholar] [CrossRef]
- Chazdon, R.L. Tropical forest recovery: Legacies of human impact and natural disturbances. Perspect. Plant Ecol. Evol. Syst. 2003, 6, 51–71. [Google Scholar] [CrossRef]
- de Avila, A.L.; Schwartz, G.; Ruschel, A.R.; do Carmo Lopes, J.; Silva, J.N.M.; de Carvalho, J.O.P.; Dormann, C.F.; Mazzei, L.; Soares, M.H.M.; Bauhus, J. Recruitment, growth and recovery of commercial tree species over 30 years following logging and thinning in a tropical rain forest. Ecol. Manag. 2017, 385, 225–235. [Google Scholar] [CrossRef]
- Guariguata, M.R.; Ostertag, R. Neotropical secondary forest succession: Changes in structural and functional characteristics. Ecol. Manag. 2001, 148, 185–206. [Google Scholar] [CrossRef]
- Diaz, S.; Hodgson, J.G.; Thompson, K.; Cabido, M.; Cornelissen, J.H.C.; Jalili, A.; Montserrat-Martí, G.; Grime, J.P.; Zarrinkamar, F.; Asri, Y.; et al. The plant traits that drive ecosystems: Evidence from three continents. J. Veg. Sci. 2004, 15, 295–304. [Google Scholar] [CrossRef]
- Chazdon, R.L.; Peres, C.A.; Dent, D.; Sheil, D.; Lugo, A.E.; Lamb, D.; Stork, N.E.; Miller, S.E. The Potential for Species Conservation in Tropical Secondary Forests. Conserv. Biol. 2009, 23, 1406–1417. [Google Scholar] [CrossRef] [PubMed]
- Gregorio, N.; Herbohn, J.; Harrison, S.; Smith, C. A systems approach to improving the quality of tree seedlings for agroforestry, tree farming and reforestation in the Philippines. Land Use Policy 2015, 47, 29–41. [Google Scholar] [CrossRef]
- Hutter, C.-P.; Göltenboth, F.; Hanssler, M. Paths to Sustainable Development: New Experiences in the Philippines; Die Deutsch Bibliothek: Stuttgart, Germany, 2003; ISBN 3-7776-1225-1. [Google Scholar]
- Elliott, S.; Blakesley, D.; Hardwick, K. Restoring Tropical Forests: A Practical Guide; Royal Botanic Gardens: Kew, UK, 2013; ISBN 978-1-84246-442-7. [Google Scholar]
- Sales-Come, R.; Hölscher, D. Variability and grouping of leaf traits in multi-species reforestation (Leyte, Philippines). Ecol. Manag. 2010, 260, 846–855. [Google Scholar] [CrossRef]
- Schneider, T.; Ashton, M.; Montagnini, F.; Milan, P. Growth performance of sixty tree species in smallholder reforestation trials on Leyte, Philippines. New For. 2013, 45, 83–96. [Google Scholar] [CrossRef]
- Cole, L.E.S.; Bhagwat, S.A.; Willis, K.J. Recovery and resilience of tropical forests after disturbance. Nat. Commun. 2014, 5, 3906. [Google Scholar] [CrossRef]
- Toledo, M.; Poorter, L.; Peña-Claros, M.; Alarcón, A.; Balcázar, J.; Leaño, C.; Licona, J.C.; Llanque, O.; Vroomans, V.; Zuidema, P.; et al. Climate is a stronger driver of tree and forest growth rates than soil and disturbance. J. Ecol. 2011, 99, 254–264. [Google Scholar] [CrossRef]
- Bawa, K.S.; Seidler, R. Natural Forest Management and Conservation of Biodiversity in Tropical Forests. Conserv. Biol. 1998, 12, 10. [Google Scholar] [CrossRef]
- Rebugio, L.; Pulhin, J.; Carandang, A.; Peralta, E.; Camacho, L.; Bantayan, N. Forest Restoration and Rehabilitation in the Philippines. In Keep Asia Green Volume 1 “Southeast Asia”; Lee, D.K., Ed.; International Union of Forest Research Organizations (IUFRO): Vienna, Austria, 2007; Volume 1, pp. 125–169. [Google Scholar]
- BirdLife International Restoring the Philippines’ Forests. Available online: https://www.birdlife.org/asia/news/restoring-philippines-forests (accessed on 23 March 2019).
- Mansourian, S.; Vallauri, D.; Dudley, N.; World Wide Fund for Nature (Eds.) Forest Restoration in Landscapes: Beyond Planting Trees; Springer: New York, NY, USA, 2005; ISBN 978-0-387-25525-5. [Google Scholar]
- Montagnini, F.; Piotto, D.; Ugalde, L. Environmental Services and Productivity of Native Species Plantations in Central America; Food and Agriculture Organization of the United Nations: Rome, Italy, 2003. [Google Scholar]
- Keenan, R.J.; Lamb, D.; Parrotta, J.; Kikkawa, J. Ecosystem Management in Tropical Timber Plantations: Satisfying Economic, Conservation, and Social Objectives. J. Sustain. 1999, 9, 117–134. [Google Scholar] [CrossRef]
- Guariguata, M.R.; Rheingans, R.; Montagnini, F. Early Woody Invasion Under Tree Plantations in Costa Rica: Implications for Forest Restoration. Restor. Ecol. 1995, 3, 252–260. [Google Scholar] [CrossRef]
- Powers, J.S.; Haggar, J.P.; Fisher, R.F. The effect of overstory composition on understory woody regeneration and species richness in 7-year-old plantations in Costa Rica. Ecol. Manag. 1997, 99, 43–54. [Google Scholar] [CrossRef]
- Montagnini, F.; Porras, C. Evaluating the role of plantations as carbon sinks: An example of an integrative approach from the humid tropics. Environ. Manag. 1998, 22, 459–470. [Google Scholar] [CrossRef] [PubMed]
- Carnevale, N.J.; Montagnini, F. Facilitating regeneration of secondary forests with the use of mixed and pure plantations of indigenous tree species. Ecol. Manag. 2002, 163, 217–227. [Google Scholar] [CrossRef]
- Griess, V.C.; Knoke, T. Can native tree species plantations in Panama compete with Teak plantations? An economic estimation. New For. 2011, 41, 13–39. [Google Scholar] [CrossRef]
- Ball, J.B.; Wormald, T.J.; Russo, L. Experience with mixed and single species plantations. Commonw. Rev. 1995, 74, 301–305. [Google Scholar]
- Nichols, J.D.; Bristow, M.; Vanclay, J.K. Mixed-species plantations: Prospects and challenges. Ecol. Manag. 2006, 233, 383–390. [Google Scholar] [CrossRef]
- Kelty, M.J. The role of species mixtures in plantation forestry. Ecol. Manag. 2006, 233, 195–204. [Google Scholar] [CrossRef]
- Wormald, T.J. Mixed and Pure Plantations in the Tropics and Subtropics; Food and Agriculture Organization of the United Nations: Rome, Italy, 1992. [Google Scholar]
- Sorley, C. Using Plantations to Catalyze Tropical Forest Restoration. Restor. Reclam. Rev. 1999, 4, 9. [Google Scholar]
- Lima, R.B.D.; Bufalino, L.; Alves Junior, F.T.; Silva, J.A.A.D.; Ferreira, R.L.C. Diameter distribution in a Brazilian tropical dry forest domain: Predictions for the stand and species. Acad. Bras. Ciênc. 2017, 89, 1189–1203. [Google Scholar] [CrossRef]
- Podlaski, R. Suitability of the selected statistical distributions for fitting diameter data in distinguished development stages and phases of near-natural mixed forests in the Świętokrzyski National Park (Poland). Ecol. Manag. 2006, 236, 393–402. [Google Scholar] [CrossRef]
- Senate of the Philippines. Sustainable Forest Management (SFM) Act of 2009; Office of the Secretary (Senate of the Philippines): Pasay City, Philippines, 2009; Volume SBN-3425.


| Site Information | Study Sites | ||
|---|---|---|---|
| Logged Forests (Temporary Plots) | Logged Forests (Permanent Research Plot) | Mixed-Species Plantations | |
| Plot size | Nested 6 and 12 m circular plots | 20 × 20 m | 5 m circular plots |
| Total number of plots used for the study | 100 | 25 | 51 |
| Sampling design | Stratified systematic grid | Systematic grid | Random design |
| Date of data collection/inventory | 2011–2012 | 2012 and 2016 | 2016 |
| Soil type 1 | Ultisols and Inceptisols | Ultisols and Inceptisols | Entisols and Vertisols |
| Köppen climate classification 2 | Tropical rainforest climate (Af) | Tropical rainforest climate (Af) | Tropical rainforest climate (Af) |
| Elevation (m.a.s.l.) 3 | 206 to 817 | 577 to 582 | 29 to 384 |
| Ecosystem 4 | Tropical lowland forests | Tropical lowland forests | Tropical lowland forests |
| Date since last logging intervention 5 | 1989 | 1989 | 1989 |
| Category | Logged Forests (Temporary Plots) n = 100, A = 13.4 ha | Logged Forests (Permanent Research Plot) n = 25, A = 1 ha | Mixed-Species Plantations n = 51, A = 2.49 ha | |||
|---|---|---|---|---|---|---|
| Absolute Value | % | Absolute Value | % | Absolute Value | % | |
| Family | 48 | 29 | 27 | |||
| Species | 235 | 66 | 62 | |||
| Endemicity of Species | ||||||
| Endemic | 46 | 19.6 | 22 | 33.3 | 15 | 24.2 |
| Indigenous | 100 | 42.5 | 23 | 34.9 | 27 | 43.6 |
| Exotic | 24 | 10.2 | 1 | 1.5 | 17 | 27.4 |
| Not Known | 65 | 27.7 | 20 | 30.3 | 3 | 4.8 |
| Study Sites | Forest Structural Indicators | |||
|---|---|---|---|---|
| Basal Area (m2 ha−1) | Carbon (t ha−1) | Total Volume (m3 ha−1) | ||
| adj. p-Value | adj. p-Value | adj. p-Value | ||
| Logged Forests (Temporary plots) | Logged Forests (Permanent Research plot) | 0.452 | 0.889 | 0.744 |
| Logged Forests (Permanent Research plot) | Mixed-species plantations | 0.413 | 0.020 ** | 0.023 ** |
| Mixed-species plantations | Logged Forests (Temporary plots) | 0.114 | 0.310 | 0.465 |
| Variables | Logged Forests (Temporary Plots) | Logged Forests (Permanent Research Plot) | Mixed-Species Plantations | |||
|---|---|---|---|---|---|---|
| Mean | SEM | Mean | SEM | Mean | SEM | |
| Basal Area (m2 ha−1) | 29.05 a | 2.43 | 34.51 a | 3.58 | 24.70 a | 1.48 |
| Carbon (t ha−1) | 156.24 a,b | 18.90 | 141.15 a | 15.19 | 89.30 b | 7.06 |
| Total Volume (m3 ha−1) | 479.73 a,b | 62.81 | 400.63 a | 45.83 | 262.56 b | 20.62 |
| Variables | Logged Forests (Permanent Research Plot) | Mixed-Species Plantations | ||
|---|---|---|---|---|
| Mean | SEM | Mean | SEM | |
| Basal Area Increment (m2 ha−1 yr−1) | 1.08 a | 0.31 | 0.99 a | 0.25 |
| Carbon (t ha−1 yr−1) | 4.06 a | 1.21 | 3.67 a | 1.11 |
| Total Volume (m3 ha−1 yr−1) | 11.98 a | 3.85 | 10.47 a | 3.21 |
| Study Sites | Fisher’s Alpha | |
|---|---|---|
| Mean | SEM | |
| Logged Forests (Temporary plots) | 9.06 a | 1.80 |
| Logged Forests (Permanent Research plot) | 11.50 a | 1.70 |
| Mixed-species plantations | 4.20 b | 0.70 |
© 2020 by the authors. Licensee MDPI, Basel, Switzerland. This article is an open access article distributed under the terms and conditions of the Creative Commons Attribution (CC BY) license (http://creativecommons.org/licenses/by/4.0/).
Share and Cite
Veridiano, R.K.; Schröder, J.M.; Come, R.; Baldos, A.; Günter, S. Towards Forest Landscape Restoration Programs in the Philippines: Evidence from Logged Forests and Mixed-Species Plantations. Environments 2020, 7, 20. https://doi.org/10.3390/environments7030020
Veridiano RK, Schröder JM, Come R, Baldos A, Günter S. Towards Forest Landscape Restoration Programs in the Philippines: Evidence from Logged Forests and Mixed-Species Plantations. Environments. 2020; 7(3):20. https://doi.org/10.3390/environments7030020
Chicago/Turabian StyleVeridiano, Rizza Karen, Jobst Michael Schröder, Renezita Come, Angelica Baldos, and Sven Günter. 2020. "Towards Forest Landscape Restoration Programs in the Philippines: Evidence from Logged Forests and Mixed-Species Plantations" Environments 7, no. 3: 20. https://doi.org/10.3390/environments7030020
APA StyleVeridiano, R. K., Schröder, J. M., Come, R., Baldos, A., & Günter, S. (2020). Towards Forest Landscape Restoration Programs in the Philippines: Evidence from Logged Forests and Mixed-Species Plantations. Environments, 7(3), 20. https://doi.org/10.3390/environments7030020