Hydrogeological and Hydrochemical Regime Evaluation in Flamouria Basin in Edessa (Northern Greece)

 ,
,  ,
,  ,
,  , ,
, ,  and
and _S._Voudouris.png)
Abstract
1. Introduction
1.1. Groundwater Quality Evaluation
1.2. Aquifer Vulnerability Assessment
1.3. Study Aims
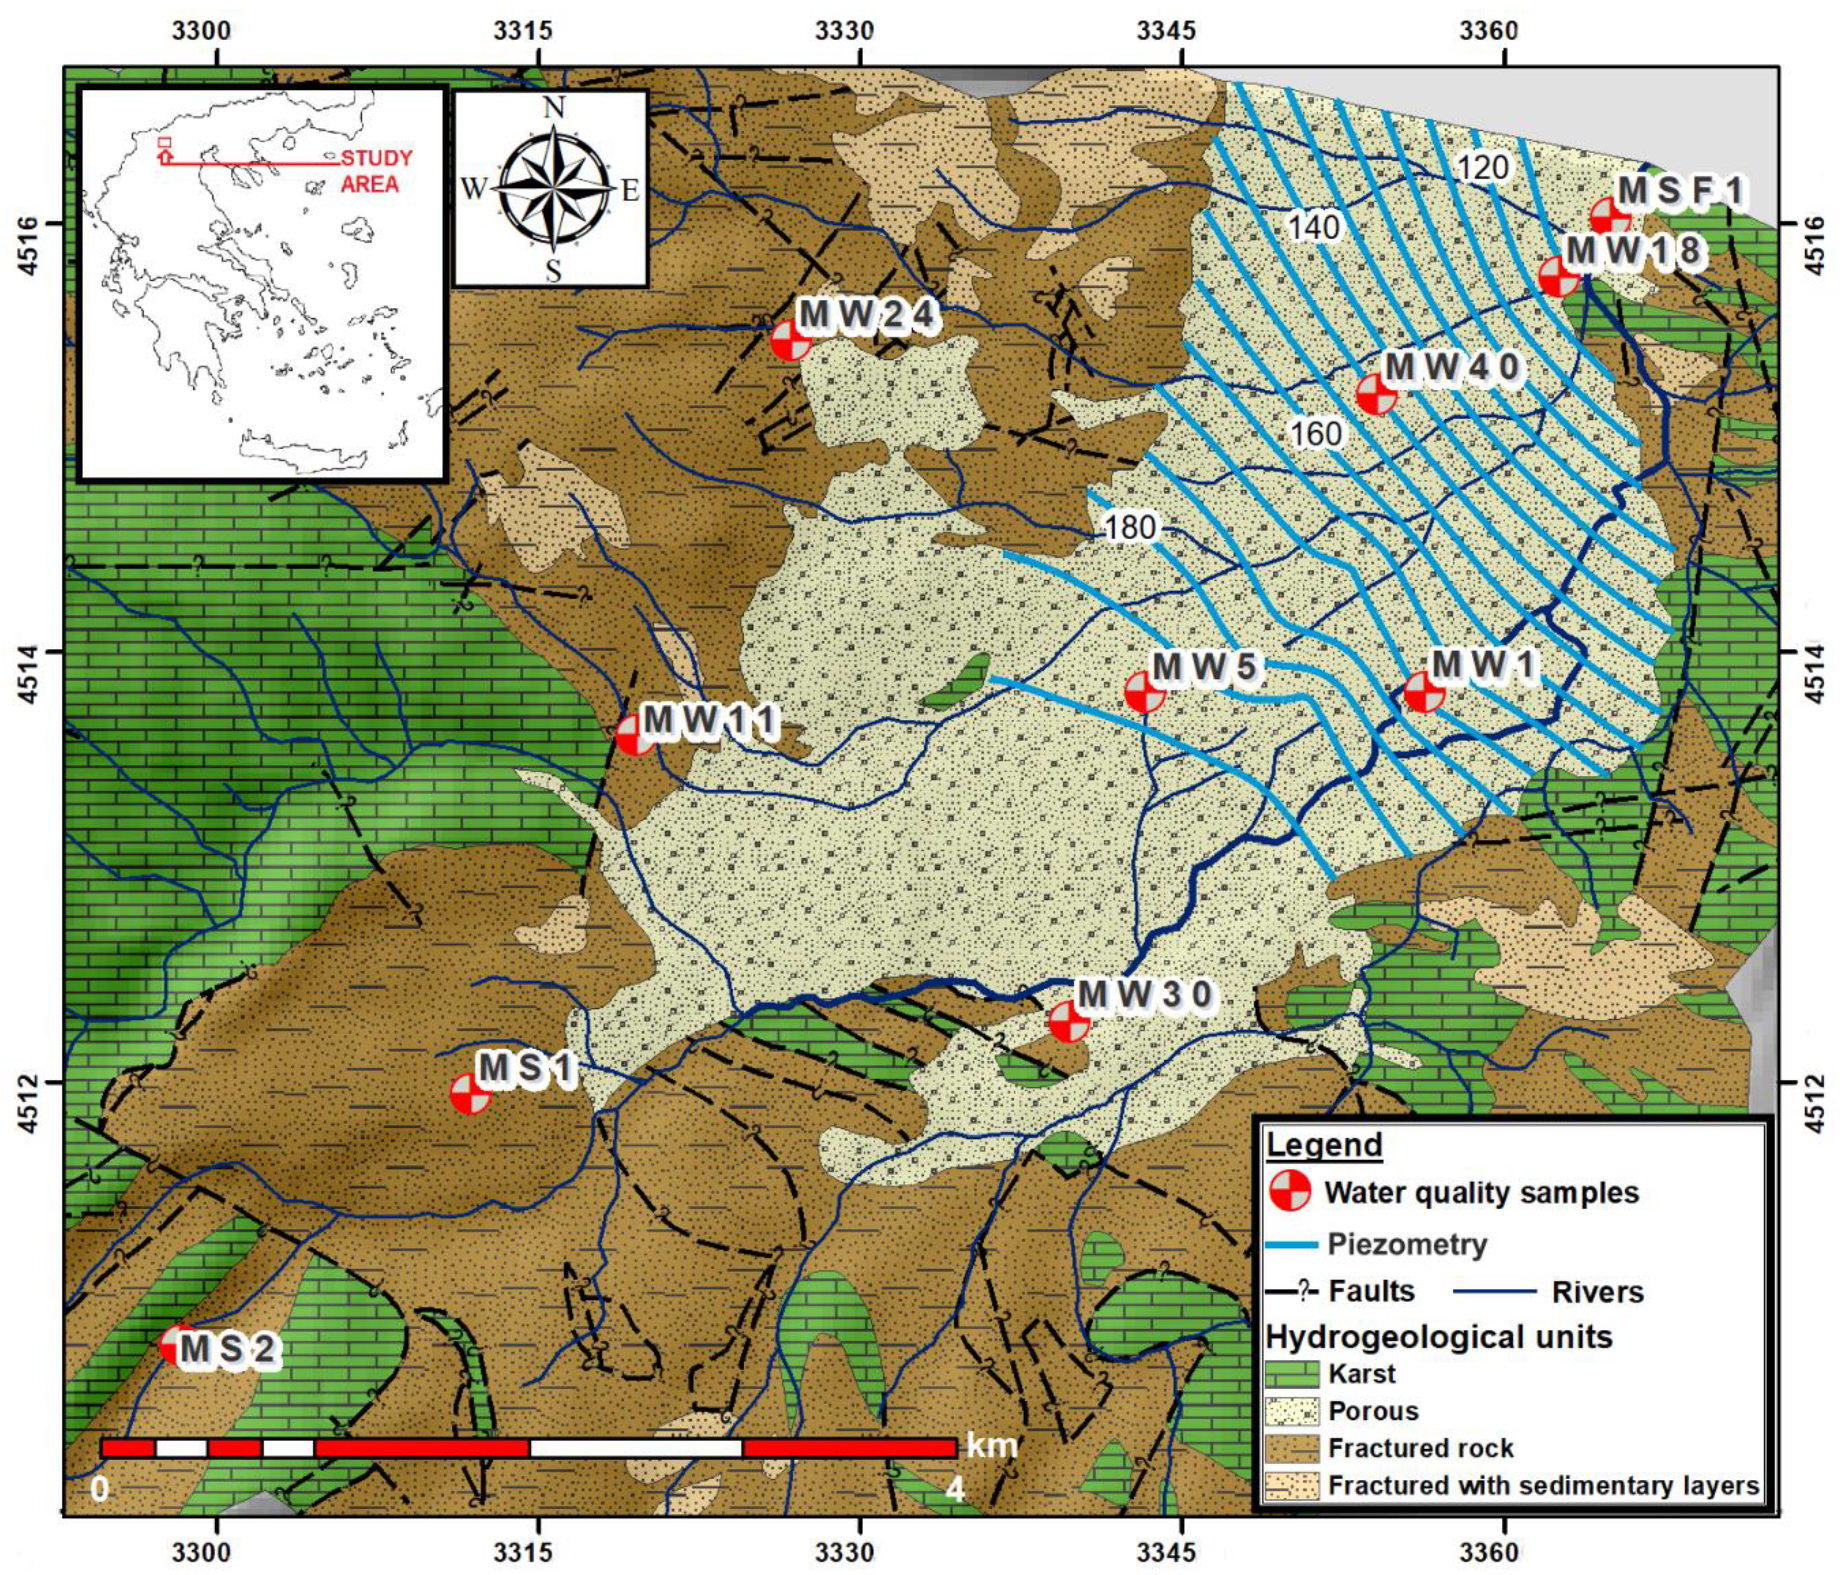
2. Study Area
3. Materials and Methods
3.1. Data Collection and Analysis
3.1.1. Groundwater Sampling, Analysis and Electrical Tomography
3.1.2. Climatic Characteristics
3.2. Protection from Natural and Anthropogenic Sources (PNA)
3.3. Groundwater Quality Index (GQI)
4. Results
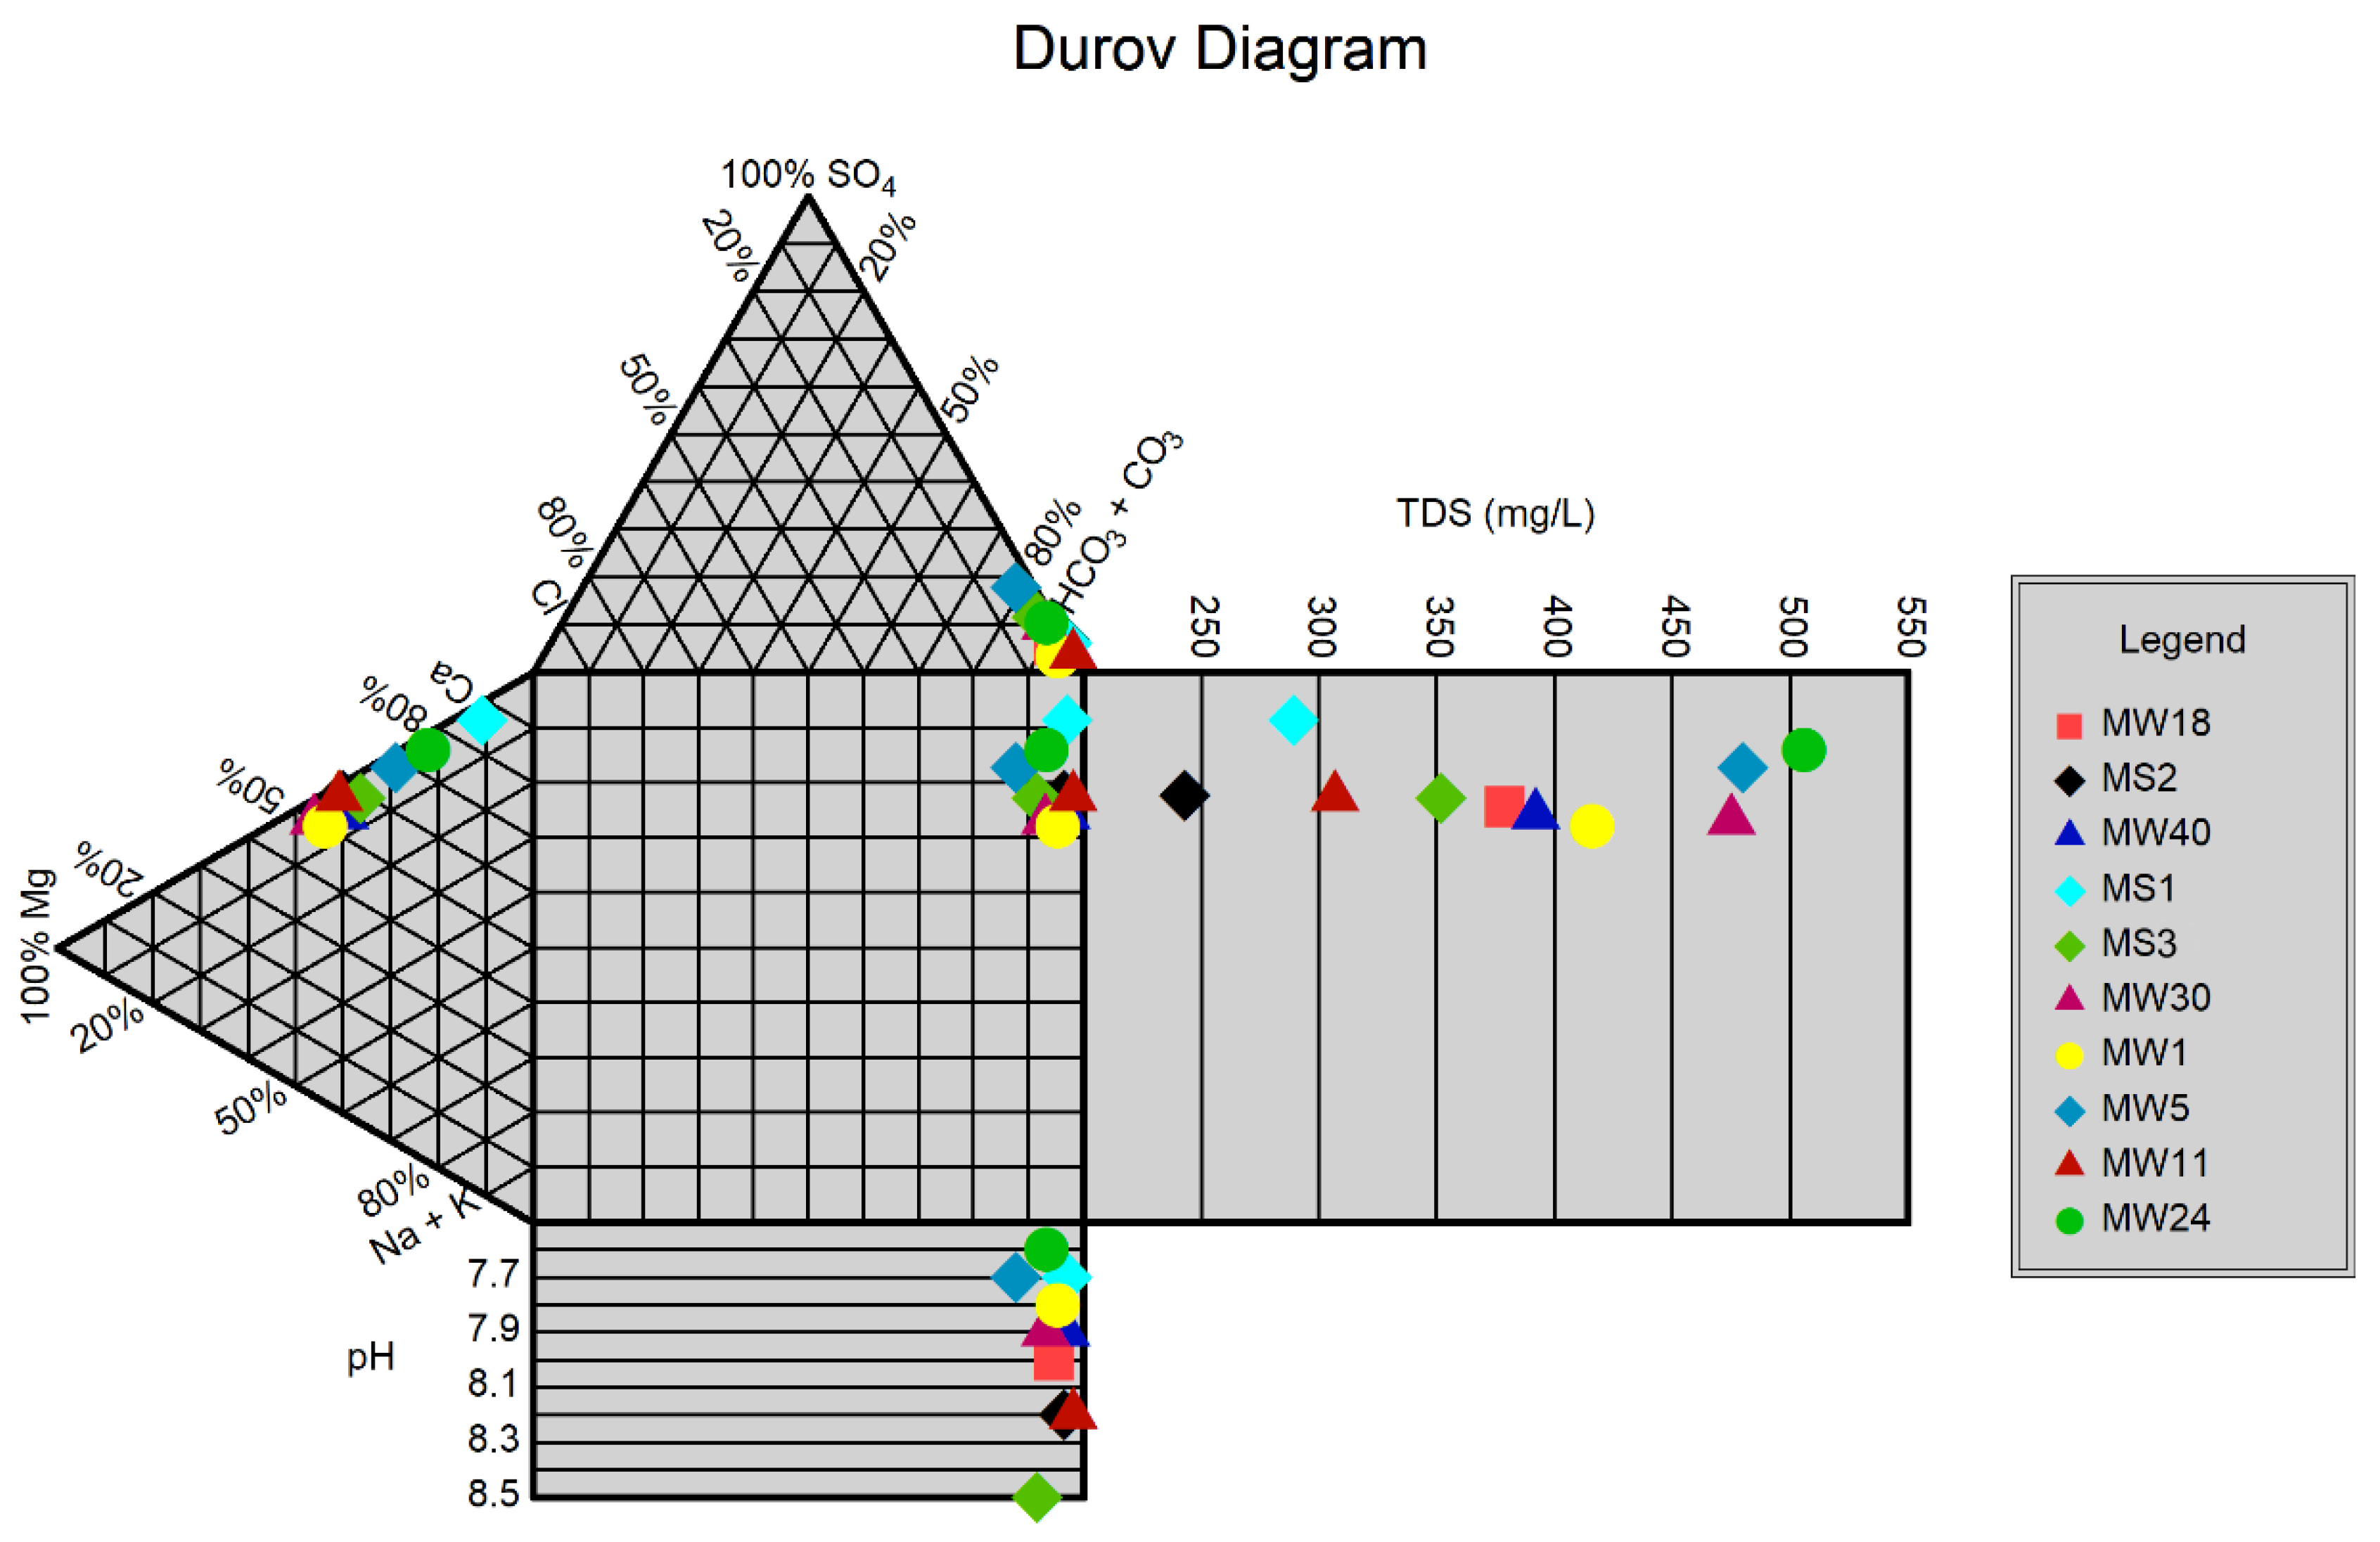
4.1. Hydrochemical Assessment
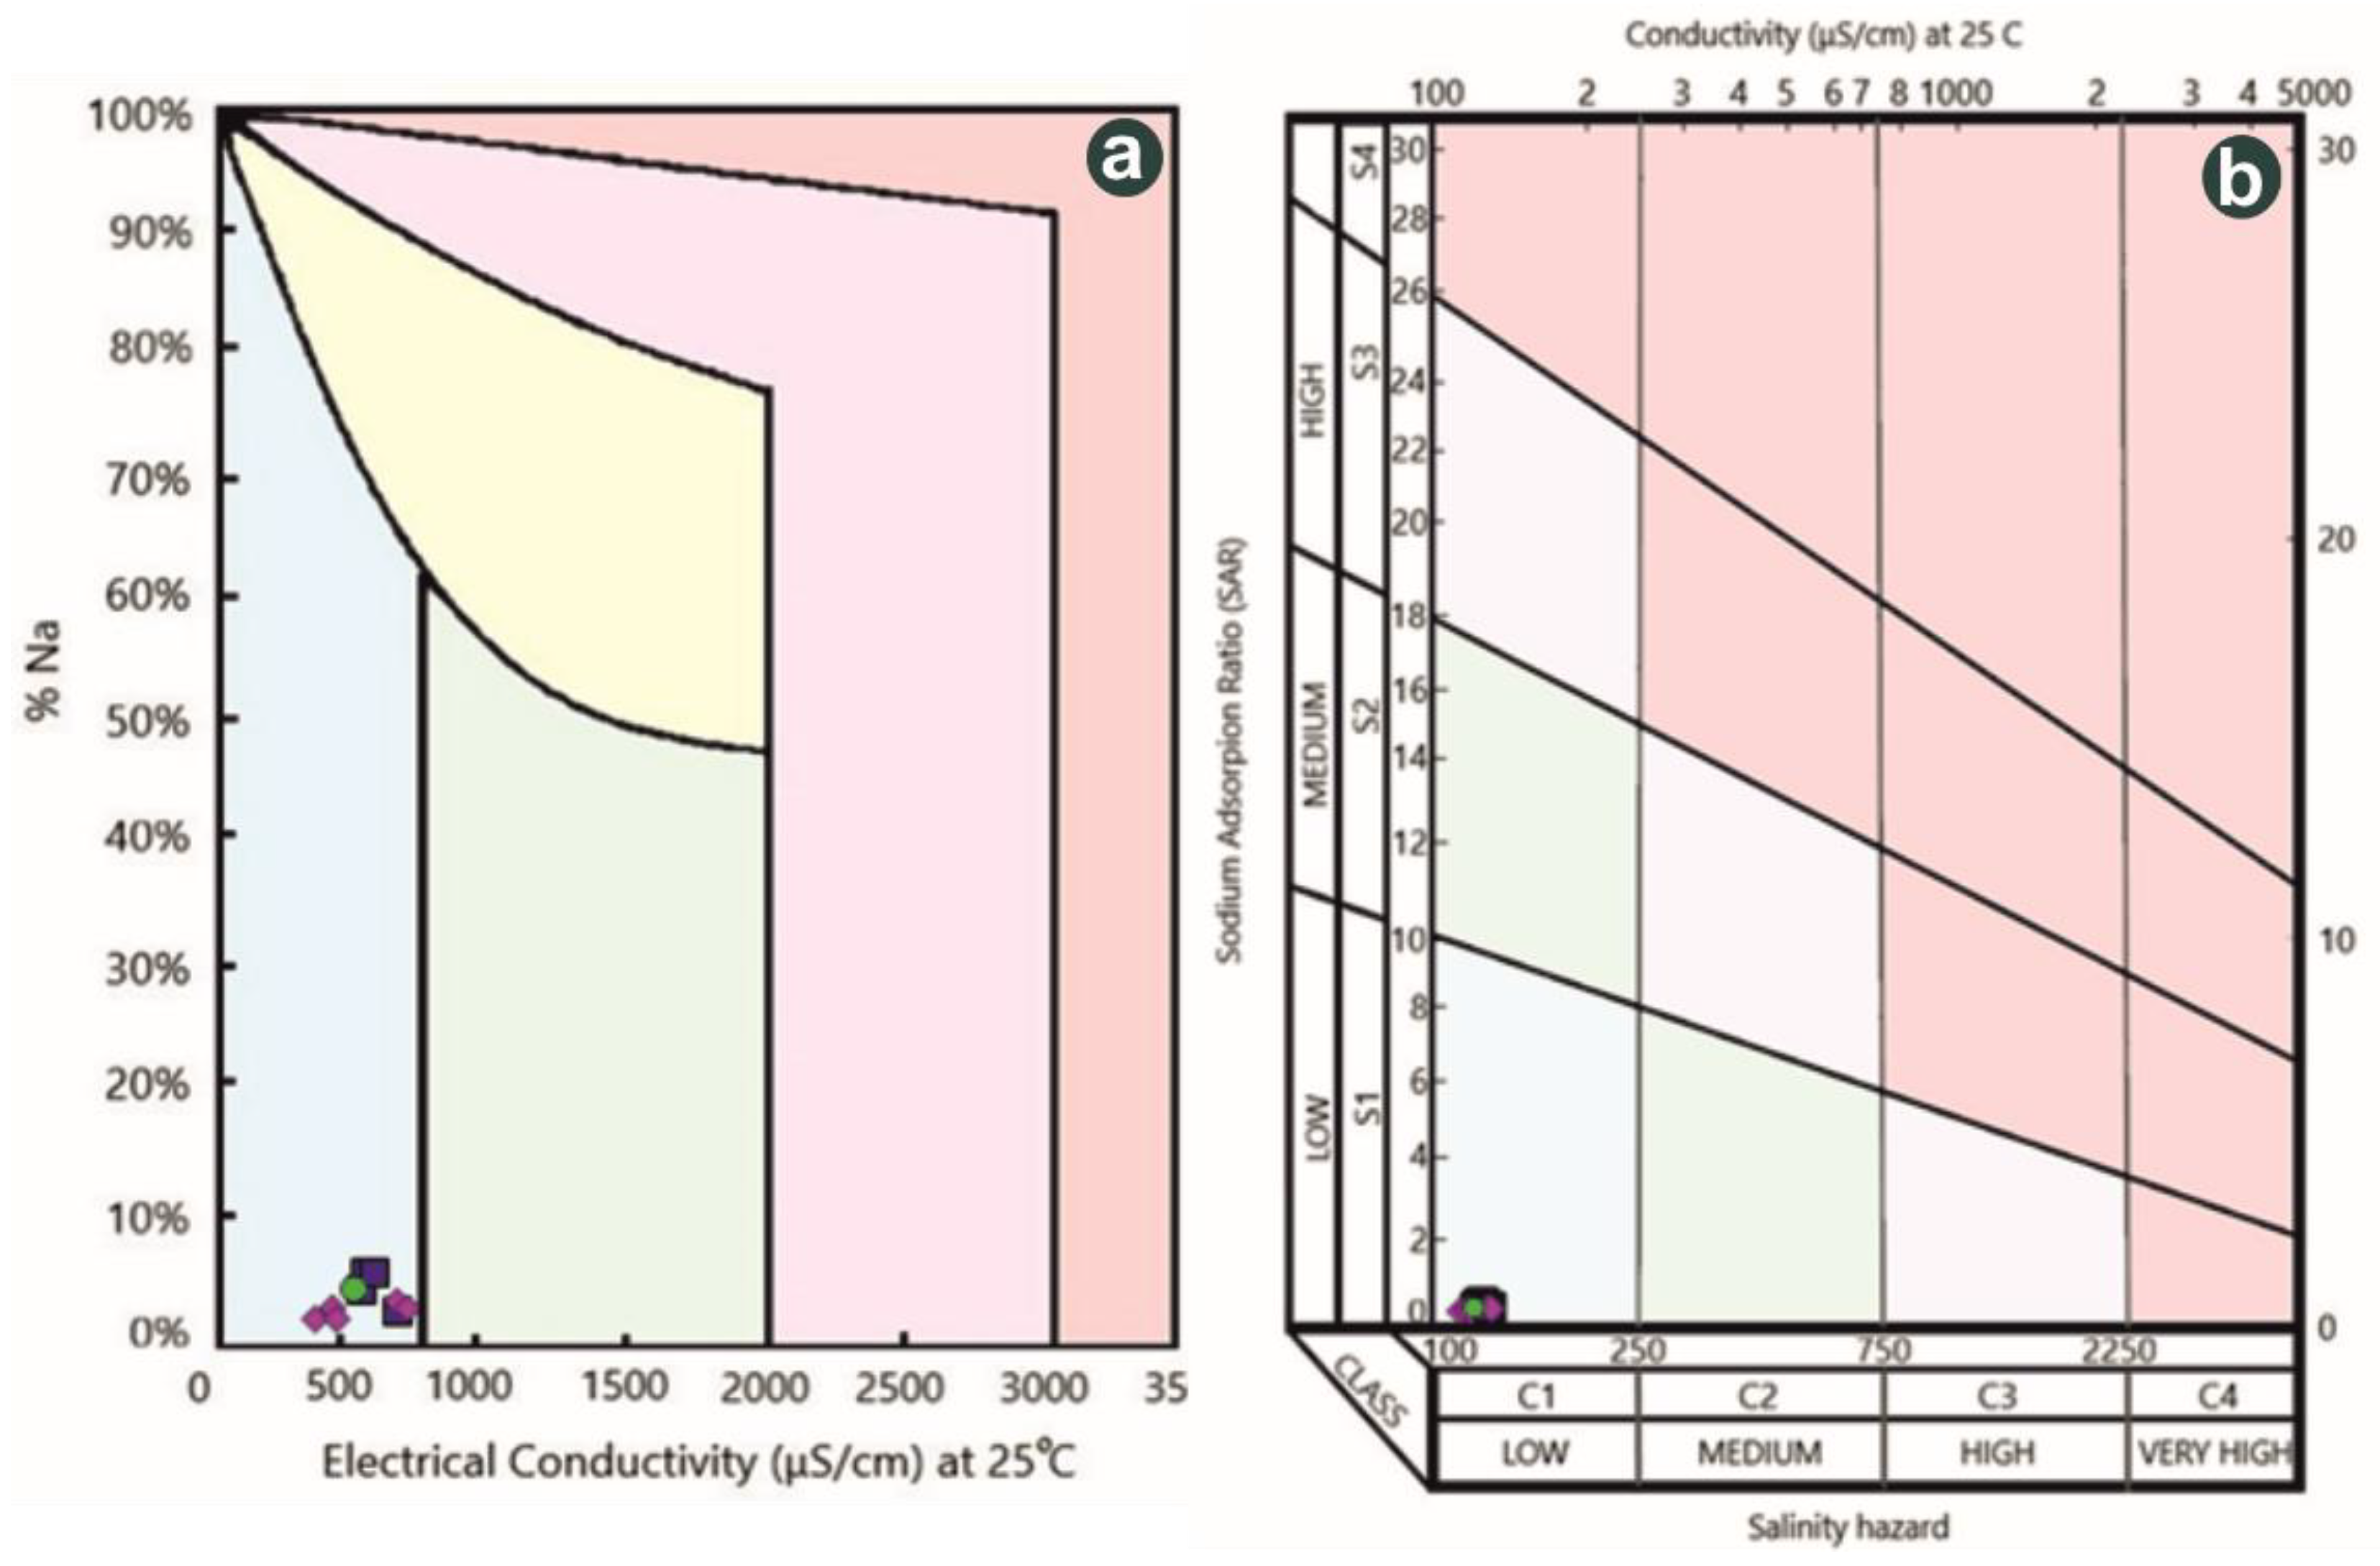
4.2. Groundwater Quality Evaluation
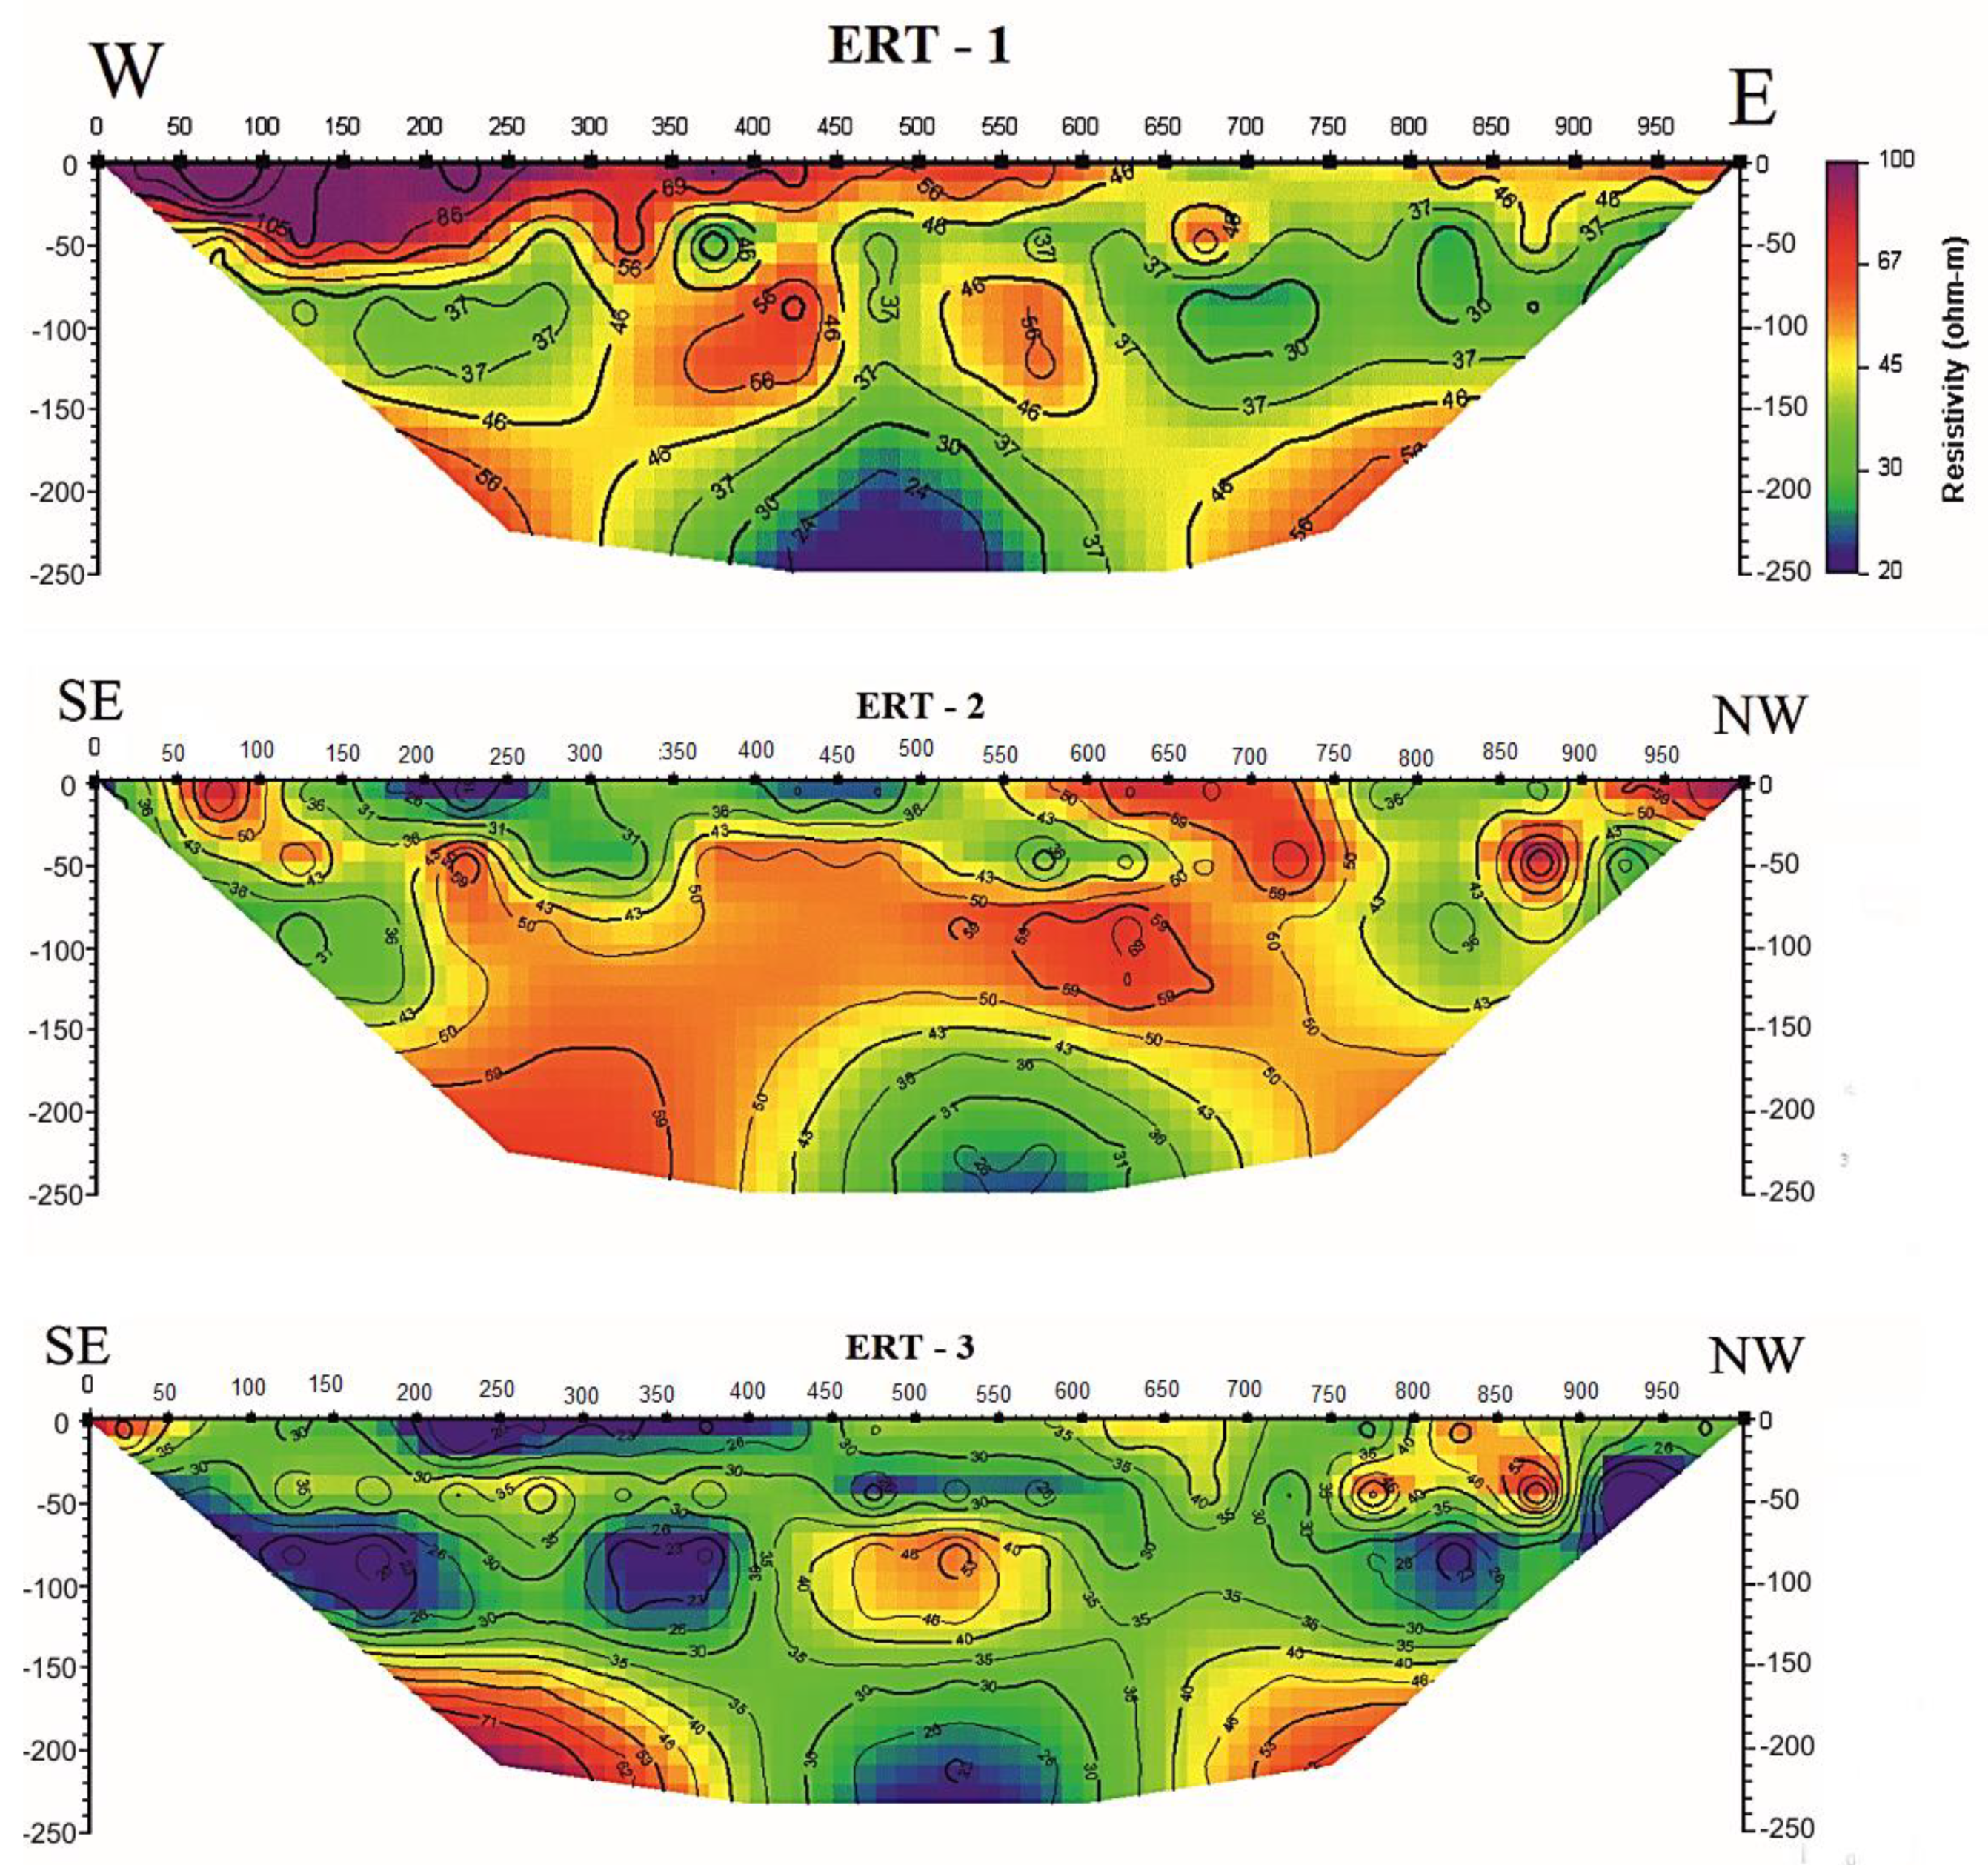
4.3. Geoelectrical Data Evaluation
4.4. “Nitrate Vulnerable Zone” Delineation
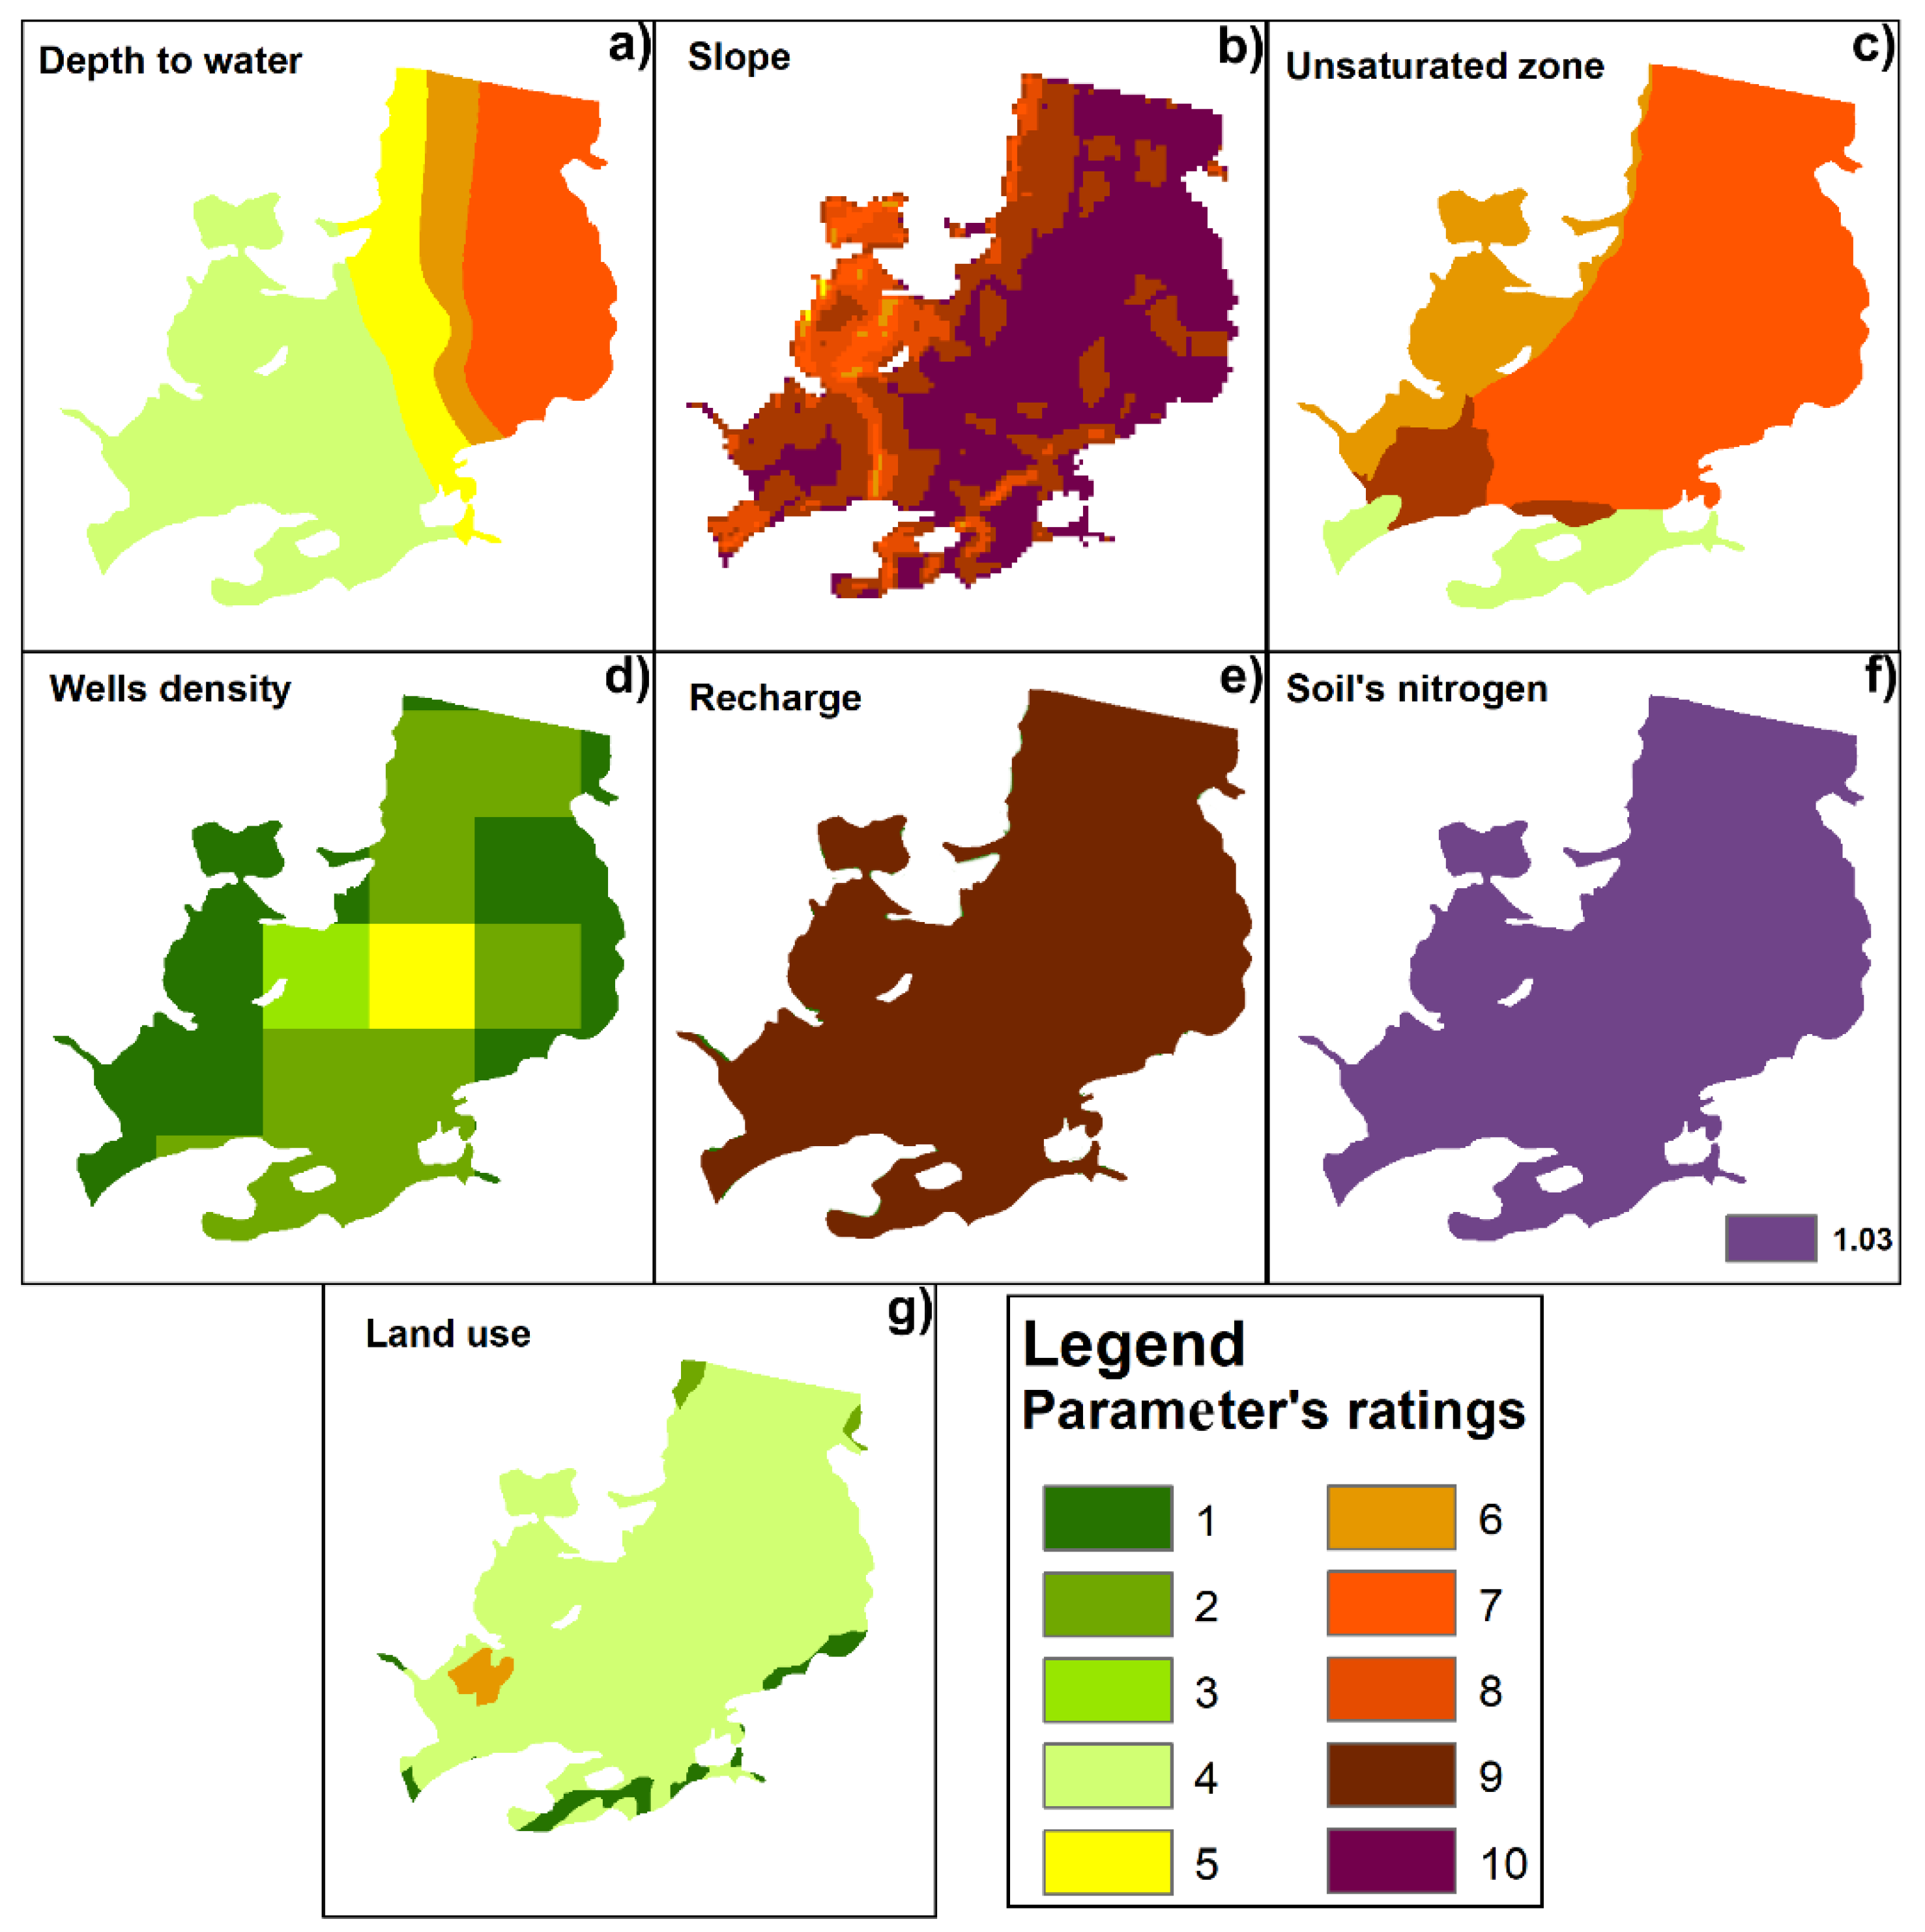
4.4.1. Depth to Water Table (D)
4.4.2. Slope Evaluation (S)
4.4.3. Vadose Zone Protection (U)
4.4.4. Wells Density
4.4.5. Recharge and Irrigation (R + I)
4.4.6. Nitrogen Soil Content (N)
4.4.7. Land Use (L)
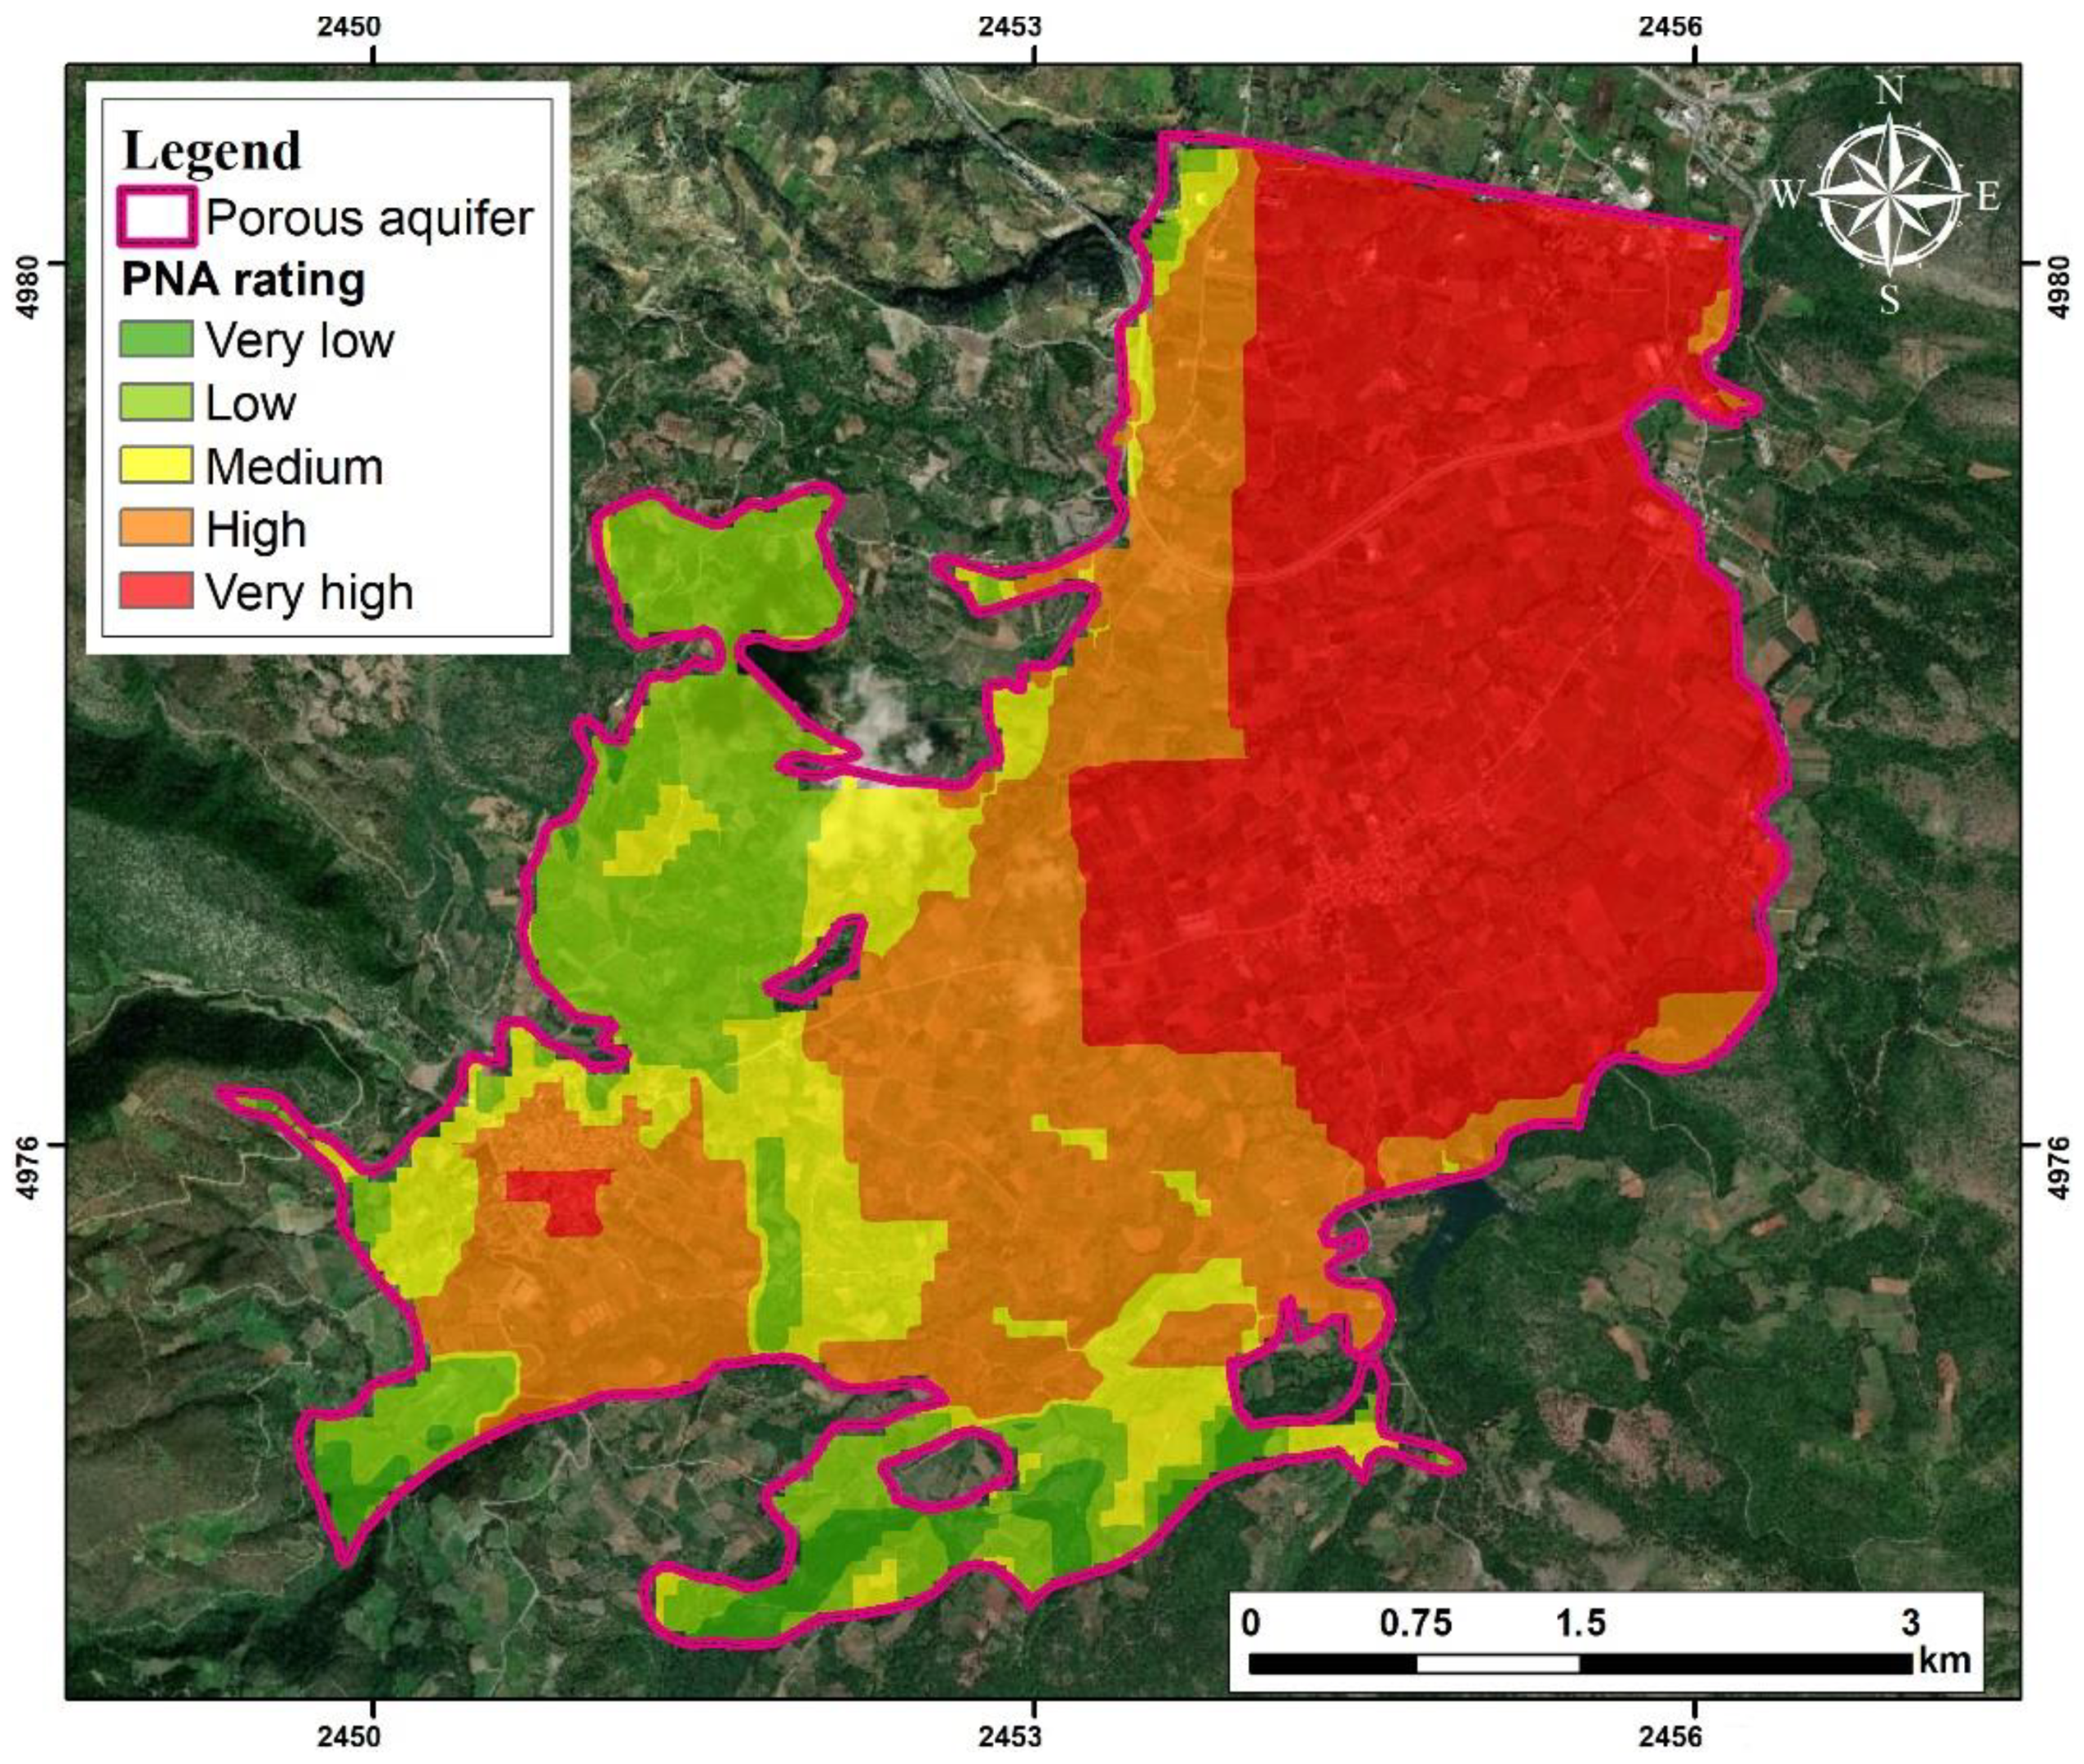
4.4.8. PNA Map Evaluation
5. Discussions
6. Conclusions
- The porous aquifer in granular rocks is being supplied laterally by the karst and fractured aquifers;
- The rational usage of fertilizers is essential, as the highest values of nitrates and sulfates were recorded inside the Flamouria plain, where intensive agricultural activities take place along with the presence of the boreholes for water supply;
- According to the PNA method results, the most vulnerable locations of the study area coincide with the main urban and agricultural zones of the Flamouria and Platani villages and the plain region between these two settlements;
- Based on the hydrochemical results and GQI application, the groundwater is deemed as of high quality for potable use and medium-high quality for irrigative purposes;
- The application of electrical tomographies and the processing of their data helped to locate underground aquifers as well as possible faults of the study area, which can explain the hydrological regime of the basin.
Supplementary Materials
Author Contributions
Funding
Conflicts of Interest
References
- Kroeze, C.; Mosier, A.; Bouwman, L. Closing the global N2O budget: A retrospective analysis 1500–1994. Glob. Biogeochem. Cycles. 1999, 13, 1–8. [Google Scholar] [CrossRef]
- Cerejeira, M.J.; Silva, E.; Batista, S.; Trancoso, A.; Centeno, M.S.L.; Silva--Fernandes, A. Simazine, metribuzine and nitrates in ground water of agricultural areas of Portugal. Toxicol. Environ. Chem. 2000, 75, 245–253. [Google Scholar] [CrossRef]
- Thorburn, P.J.; Biggs, J.S.; Weier, K.L.; Keating, B.A. Nitrate in groundwaters of intensive agricultural areas in coastal Northeastern Australia. Agric. Ecosyst. Environ. 2003, 94, 49–58. [Google Scholar] [CrossRef]
- Ascott, M.J.; Gooddy, D.C.; Wang, L.; Stuart, M.E.; Lewis, M.A.; Ward, R.S.; Binley, A.M. Global patterns of nitrate storage in the vadose zone. Nat. Commun. 2017, 8, 1416. [Google Scholar] [CrossRef]
- Bartzas, G.; Tinivella, F.; Medini, L.; Zaharaki, D.; Komnitsas, K. Assessment of groundwater contamination risk in an agricultural area in north Italy. Inf. Process. Agric. 2015, 2, 109–129. [Google Scholar] [CrossRef]
- Ward, M.H.; Jones, R.R.; Brender, J.D.; De Kok, T.M.; Weyer, P.J.; Nolan, B.T.; Villanueva, C.M.; Van Breda, S.G. Drinking water nitrate and human health: An updated review. Int. J. Environ. Res. Public Health 2018, 15, 1557. [Google Scholar] [CrossRef]
- Busico, G.; Cuoco, E.; Kazakis, N.; Colombani, N.; Mastrocicco, M.; Tedesco, D.; Voudouris, K. Multivariate statistical analysis to characterize/discriminate between anthropogenic and geogenic trace elements occurrence in the Campania plain, southern Italy. Environ. Pollut. 2018, 234, 260–269. [Google Scholar] [CrossRef]
- Esmaeili, A.; Moore, F.; Keshavarzi, B. Nitrate contamination in irrigation groundwater, Isfahan, Iran. Environ. Earth Sci. 2014, 72, 2511–2522. [Google Scholar] [CrossRef]
- Lawniczak, A.E.; Zbierska, J.; Nowak, B.; Achtenberg, K.; Grześkowiak, A.; Kanas, K. Impact of agriculture and land use on nitrate contamination in groundwater and running waters in central-west Poland. Environ. Monit. Assess. 2016, 188, 1–17. [Google Scholar] [CrossRef] [PubMed]
- Zhang, Q.; Sun, J.; Liu, J.; Huang, G.; Lu, C.; Zhang, Y. Driving mechanism and sources of groundwater nitrate contamination in the rapidly urbanized region of south China. J. Contam. Hydrol. 2015, 182, 221–230. [Google Scholar] [CrossRef]
- Singh, S.; Ghosh, N.C.; Gurjar, S.; Krishan, G.; Kumar, S.; Berwal, P. Index-based assessment of suitability of water quality for irrigation purpose under Indian conditions. Environ. Monit. Assess. 2018, 190, 29. [Google Scholar] [CrossRef] [PubMed]
- Rufino, F.; Busico, G.; Cuoco, E.; Darrah, T.H.; Tedesco, D. Evaluating the suitability of urban groundwater resources for drinking water and irrigation purposes: An integrated approach in the Agro-Aversano area of Southern Italy. Environ. Monit. Assess. 2019, 191. [Google Scholar] [CrossRef] [PubMed]
- El Fadel, M.; Tomaszkiewicz, M.; Adra, Y.; Sadek, S.; Najm, M.A. GIS-based assessment for the development of a groundwater quality index towards sustainable aquifer management. Water Resour. Manag. 2014, 28, 3471–3487. [Google Scholar] [CrossRef]
- Ketata, M.; Gueddari, M.; Bouhlila, R. Use of geographical information system and water quality index to assess groundwater quality in El Khairat deep aquifer (Enfidha, Central East Tunisia). Arab. J. Geosci. 2012, 5, 1379–1390. [Google Scholar] [CrossRef]
- Farmani, R.; Henriksen, H.J.; Savic, D. An evolutionary Bayesian belief network methodology for optimum management of groundwater contamination. Environ. Model. Softw. 2009, 24, 303–310. [Google Scholar] [CrossRef]
- Phan, T.D.; Smart, J.C.R.; Capon, S.J.; Hadwen, W.L.; Sahin, O. Applications of Bayesian belief networks in water resource management: A systematic review. Environ. Model. Softw. 2016, 85, 98–111. [Google Scholar] [CrossRef]
- Cicchella, D.; Giaccio, L.; Dinelli, E.; Albanese, S.; Lima, A.; Zuzolo, D.; De Vivo, B. GEMAS: Spatial distribution of chemical elements in agricultural and grazing land soil of Italy. J. Geochem. Explor. 2015, 154, 129–142. [Google Scholar] [CrossRef]
- Voudouris, K.; Panagopoulos, A.; Koumantakis, J. Multivariate statistical analysis in the assessment of hydrochemistry of the northern Korinthia prefecture aquifer system (Peloponnese, Greece). Nat. Resour. Res. 2000, 9, 135–146. [Google Scholar] [CrossRef]
- Kazakis, N.; Matiatos, I.; Ntona, M.M.; Bannenberg, M.; Kalaitzidou, K.; Kaprara, E.; Mitrakas, M.; Ioannidou, A.; Vargemezis, G.; Voudouris, K. Origin, implications and management strategies for nitrate pollution in surface and ground waters of Anthemountas basin based on a δ15N-NO3− and δ18O-NO3− isotope approach. Sci. Tot. Environ. 2020, 724, 724. [Google Scholar] [CrossRef]
- Matiatos, I. Nitrate source identification in groundwater of multiple land-use areas by combining isotopes and multivariate statistical analysis: A case study of Asopos basin (Central Greece). Sci. Total Environ. 2016, 541, 802–814. [Google Scholar] [CrossRef]
- Minet, E.P.; Goodhue, R.; Meier-Augenstein, W.; Kalin, R.M.; Fenton, O.; Richards, K.G.; Coxon, C.E. Combining stable isotopes with contamination indicators: A method for improved investigation of nitrate sources and dynamics in aquifers with mixed nitrogen inputs. Water Res. 2017, 124, 85–96. [Google Scholar] [CrossRef] [PubMed]
- Re, V.; Sacchi, E.; Kammoun, S.; Tringali, C.; Trabelsi, R.; Zouari, K.; Daniele, S. Integrated socio-hydrogeological approach to tackle nitrate contamination in groundwater resources. The case of Grombalia Basin (Tunisia). Sci. Total Environ. 2017, 593–594, 664–676. [Google Scholar] [CrossRef] [PubMed]
- Llopis-Albert, C.; Palacios-Marqués, D.; Merigó, J.M. A coupled stochastic inverse-management framework for dealing with nonpoint agriculture pollution under groundwater parameter uncertainty. J. Hydrol. 2014, 511, 10–16. [Google Scholar] [CrossRef]
- Peña-Haro, S.; Pulido-Velazquez, M.; Llopis-Albert, C. Stochastic hydro-economic modeling for optimal management of agricultural groundwater nitrate pollution under hydraulic conductivity uncertainty. Environ. Model. Softw. 2011, 26, 999–1008. [Google Scholar] [CrossRef]
- Busico, G.; Kazakis, N.; Cuoco, E.; Colombani, N.; Tedesco, D.; Voudouris, K.; Mastrocicco, M. A novel hybrid method of specific vulnerability to anthropogenic pollution using multivariate statistical and regression analyses. Water Res. 2020, 171. [Google Scholar] [CrossRef]
- Kazakis, N.; Voudouris, K.S. Groundwater vulnerability and pollution risk assessment of porous aquifers to nitrate: Modifying the DRASTIC method using quantitative parameters. J. Hydrol. 2015, 525, 13–25. [Google Scholar] [CrossRef]
- Neshat, A.; Pradhan, B.; Pirasteh, S.; Shafri, H.Z.M. Estimating groundwater vulnerability to pollution using a modified DRASTIC model in the Kerman agricultural area, Iran. Environ. Earth Sci. 2014, 71, 3119–3131. [Google Scholar] [CrossRef]
- Wang, J.; He, J.; Chen, H. Assessment of groundwater contamination risk using hazard quantification, a modified DRASTIC model and groundwater value, Beijing Plain, China. Sci. Total Environ. 2012, 432, 216–226. [Google Scholar] [CrossRef]
- Aller, L.; Bennet, T.; Lehr, J.H.; Petty, R.J. DRASTIC: A Standardized System for Evaluating Groundwater Pollution Potential Using Hydrologic Settings; U.S. Environmental Protection Agency Report (EPA) 600/2-87/035; Robert, S., Ed.; Kerr Environmental Research Laboratory: Ada, OK, USA, 1987. [Google Scholar]
- Civita, M.; De Maio, M. Assessing and mapping groundwater vulnerability to contamination: The Italian “combined” approach. Geofis. Int. 2004, 43, 513–532. [Google Scholar] [CrossRef]
- Machiwal, D.; Cloutier, V.; Güler, C.; Kazakis, N. A review of GIS-integrated statistical techniques for groundwater quality evaluation and protection. Environ. Earth Sci. 2018, 77. [Google Scholar] [CrossRef]
- Busico, G.; Mastrocicco, M.; Cuoco, E.; Sirna, M.; Tedesco, D. Protection from natural and anthropogenic sources: A new rating methodology to delineate “Nitrate Vulnerable Zones”. Environ. Earth Sci. 2019, 78. [Google Scholar] [CrossRef]
- Köppen, W.; Geiger, R. Die klimate der Erde. Wall-map 150 cm × 200 cm. 1998, Verlag Justus Perthes, Gotha. Available online: http://koeppen-geiger.vu-wien.ac.at/koeppen.htm. (accessed on 10 November 2019).
- Lenore, S.C.; Arnold, E.G.; Andrew, D.E. Standard Methods for Examination of Water and Wastewater, 20th ed.; American Public Health Association; American Water Works Association; World Environment Federation: Washington, DC, USA, 1998. [Google Scholar]
- Thornthwaite, C.W.; Mather, J.R. Instructions and Tables for Computing Potential Evapotranspiration and the Water Balance; Publications in Climatology, 10.3; Drexel Institute: Centerton, NJ, USA, 1957. [Google Scholar]
- Voudouris, K.; Diamantopoulou, P.; Giannatos, G.; Zannis, P. Groundwater recharge via deep boreholes in the Patras industrial area aquifer system (NW Peloponnesus, Greece). Bull. Eng. Geol. Environ. 2006, 65, 297–308. [Google Scholar] [CrossRef]
- Babiker, I.S.; Hohamed, M.A.A.; Hiyama, T. Assessing groundwater quality using GIS. Water Res. Manag. 2007, 21, 699–715. [Google Scholar] [CrossRef]
- Durov, S.A. Natural waters and graphic representation of their composition. Doklady Akademii Nauk SSSR 1948, 59, 87–90. [Google Scholar]
- Busico, G.; Kazakis, N.; Colombani, N.; Mastrocicco, M.; Voudouris, K.; Tedesco, D. A modified SINTACS method for groundwater vulnerability and pollution risk assessment in highly anthropized regions based on NO3− and SO42− concentrations. Sci. Tot. Environ. 2017, 609, 1512–1523. [Google Scholar] [CrossRef] [PubMed]
- Kazakis, N.; Pavlou, A.; Vargemezis, G.; Voudouris, K.S.; Soulios, G.; Pliakas, F.; Tsokas, G. Seawater intrusion mapping using electrical resistivity tomography and hydrochemical data. An application in the coastal area of eastern Thermaikos gulf, Greece. Sci. Tot. Environ. 2016, 543, 373–387. [Google Scholar] [CrossRef] [PubMed]
- Shahabi, A.; Malakouti, M.; Fallahi, E. Effects of bicarbonate content of irrigation water on nutritional disorders of some apple varieties. J. Plant. Nutr. 2005, 28, 1663–1678. [Google Scholar] [CrossRef]
- Wongsanit, J.; Teartisup, P.; Kerdsueb, P.; Tharnpoophasiam, P.; Worakhunpiset, S. Contamination of nitrate in groundwater and its potential human health: A case study of lower Mae Klong river basin, Thailand. Environ. Sci. Pollut. Res. 2015, 22, 11504–11512. [Google Scholar] [CrossRef]
- Klaas, K.S.Y.; Imteaz, M.A.; Arulrajah, A. Development of groundwater vulnerability zones in a data-scarce eogenetic karst area using Head-Guided Zonation and particle-tracking simulation methods. Water Res. 2017, 122, 17–26. [Google Scholar] [CrossRef]
- Vigliotti, M.; Busico, G.; Ruberti, D. Assessment of the Vulnerability to Agricultural Nitrate in Two Highly Diversified Environmental Settings. Environments 2020, 7, 80. [Google Scholar] [CrossRef]
- Kazemi, E.; Karyab, H.; Emamjome, M. Optimization of interpolation method for nitrate pollution in groundwater and assessing vulnerability with IPNOA and IPNOC method in Qazvin plain. J. Environ. Health Sci. Eng. 2017, 15, 23. [Google Scholar] [CrossRef] [PubMed]


| Water Samples | |||||||||||
|---|---|---|---|---|---|---|---|---|---|---|---|
| PARAMETERS | UNITS | ΜW18 | MS2 | MW40 | MS3 | MSF1 | MW30 | MW1 | MW5 | MW11 | MW24 |
| pH | 8.00 | 8.15 | 7.90 | 7.70 | 8.45 | 7.90 | 7.80 | 7.70 | 8.20 | 7.60 | |
| EC | μS/cm | 566 | 363 | 585 | 432 | 526 | 709 | 621 | 716 | 458 | 755 |
| HCO3 | mg/L | 329.40 | 225.0 | 372.10 | 268.0 | 286.70 | 433.10 | 387.35 | 329.40 | 280.60 | 451.40 |
| Cl | mg/L | 4.50 | ND | 3.10 | ND | 4.50 | 6.00 | 7.00 | 8.00 | ND | 4.00 |
| SO4 | mg/L | 16.00 | 13.00 | 11.00 | 13.00 | 31.00 | 36.00 | 11.00 | 56.00 | 8.00 | 40.00 |
| NO3 | mg/L | 32.00 | ND | 9.00 | ND | 10.30 | ND | 23.00 | 53.00 | 4.00 | ND |
| Na | mg/L | 5.80 | 2.00 | 8.10 | 2.90 | 5.20 | 7.00 | 9.00 | 4.40 | 2.20 | 4.10 |
| K | mg/L | 1.70 | 0.30 | 1.70 | 1.00 | 1.90 | 0.16 | 1.60 | 1.10 | 0.70 | 3.00 |
| Mg | mg/L | 70.00 | 45.00 | 70.00 | 78.40 | 67.00 | 79.00 | 70.00 | 105.00 | 55.00 | 123.50 |
| Ca | mg/L | 30.00 | 19.40 | 30.80 | 6.20 | 25.00 | 44.00 | 37.00 | 27.00 | 24.40 | 21.90 |
| Parameters | WHO Limit (mg/L) | FAO Standard (mg/L) | Potable Use Average R | Irrigation Use Average R |
|---|---|---|---|---|
| Ca2+ | 300 | - | 2.49 | - |
| Mg2+ | 300 | - | 1.58 | 1.58 |
| Na+ | 200 | 69 | 1.17 | 1.48 |
| Cl− | 200 | 107 | 1.14 | 1.25 |
| NO3− | 50 | 5 | 2.30 | 5.21 |
| SO42− | 250 | - | 1.60 | - |
| TDS | 600 | 450 | 4.00 | 4.60 |
| HCO3− | - | 91.50 | - | 7.68 |
Publisher’s Note: MDPI stays neutral with regard to jurisdictional claims in published maps and institutional affiliations. |
© 2020 by the authors. Licensee MDPI, Basel, Switzerland. This article is an open access article distributed under the terms and conditions of the Creative Commons Attribution (CC BY) license (http://creativecommons.org/licenses/by/4.0/).
Share and Cite
Bannenberg, M.; Ntona, M.M.; Busico, G.; Kalaitzidou, K.; Mitrakas, M.; Vargemezis, G.; Fikos, I.; Kazakis, N.; Voudouris, K. Hydrogeological and Hydrochemical Regime Evaluation in Flamouria Basin in Edessa (Northern Greece). Environments 2020, 7, 105. https://doi.org/10.3390/environments7120105
Bannenberg M, Ntona MM, Busico G, Kalaitzidou K, Mitrakas M, Vargemezis G, Fikos I, Kazakis N, Voudouris K. Hydrogeological and Hydrochemical Regime Evaluation in Flamouria Basin in Edessa (Northern Greece). Environments. 2020; 7(12):105. https://doi.org/10.3390/environments7120105
Chicago/Turabian StyleBannenberg, Matthias, Maria Margarita Ntona, Gianluigi Busico, Kyriaki Kalaitzidou, Manassis Mitrakas, George Vargemezis, Ilias Fikos, Nerantzis Kazakis, and Konstantinos Voudouris. 2020. "Hydrogeological and Hydrochemical Regime Evaluation in Flamouria Basin in Edessa (Northern Greece)" Environments 7, no. 12: 105. https://doi.org/10.3390/environments7120105
APA StyleBannenberg, M., Ntona, M. M., Busico, G., Kalaitzidou, K., Mitrakas, M., Vargemezis, G., Fikos, I., Kazakis, N., & Voudouris, K. (2020). Hydrogeological and Hydrochemical Regime Evaluation in Flamouria Basin in Edessa (Northern Greece). Environments, 7(12), 105. https://doi.org/10.3390/environments7120105