Abstract
Malodorous compounds arise at practically every stage of wastewater management, starting from the sewer network, via the technological sewage-treatment system, through to the sludge-management stage. The formation of hydrogen sulphide is a significant problem even while sewage remains in sewers, as anaerobic conditions prevalent in the network are conducive to wastewater putrefaction, and therefore contribute to increased malodorous emissions. The development of such anaerobic conditions is favoured by the oversizing of conduits or designs that feature inadequate gradients, causing wastewater in the network to stagnate. Where emissions to the air from wastewater occur, they are found to constitute a complex mixture of perhaps even 1000 different substances, produced under varying process conditions. Among those present are compounds of sulphur and nitrogen, chlorinated compounds, and other organics. In Poland, the issue of odour annoyance has not yet been subject to standardisation in either legal or methodological terms. Indeed, as only 11 EU Member States have regulations in place regarding air-quality standards, it is likely that such a law will soon be developed to try and resolve problems with odour annoyance, including those originating in the systems dealing with wastewater. This denotes a need to develop methods of counteracting the formation of odours, and those of a chemical nature are regarded as among the most effective, hence their growing popularity. They also abide by green-technology principles. Against that background, this article seeks to consider the process by which malodorous substances arise in sewer and wastewater-treatment systems, as well as to discuss methods of odour abatement. The work also presents the current legal regulations of relevance to the issue.
1. Introduction
Odour-related annoyance reflects a state of subjective discomfort experienced by a person physically and mentally, as a result of the smell of a substance introduced into the air. The annoyance thus arises from the interaction between sources of malodourous compounds and a human being’s sense of smell, as denoting recognition by receptors in the nose. Economic activity in general, and the development of individual branches of a country’s economy, are invariably connected with some negative on-air quality, including smells and their olfactory reception [1,2]. Virtually all branches of industry and the economy can give rise to compounds capable of generating odour-annoyances [1]. However, the most onerous sources, continuously or periodically, are facilities connected with livestock-breeding and raising, as well as the management of solid and aqueous wastes. Specifically, the greater part of odour emissions are seen to result from the breeding of livestock, the production of animal feed, the processing of fats, oil-refining, the chemicals industry and tanning, food production and papermaking, fish processing, gastronomy, the use of landfills, and—of course—wastewater treatment plants and sewerage [3].
Odours emitted from individual sources can generate psychological discomfort at the level of individuals, or of entire populations living in the vicinity [4]. Malodorous compounds generated provoke complaints and may even prove influential at a national level. Recent years have in fact brought more and more vehement (at times aggressive) protests against odour annoyance, arising at or in the vicinity of sewers, sewage pumping stations, expansion wells, and wastewater treatment plants [5].
Proper design, construction, and operation of the above installations can do much to reduce—and sometimes even eliminate—odour annoyance [6]. Where systems already exist, various methods of odour annoyance abatement are being looked into [7,8,9]. However, this area of research goes partly unrecognised and under-reported due to a lack of legal regulations as well as methodological difficulties with determining individual odour-generating substances. Where findings are available, analysis points to the efficacy of chemical methods of odour abatement.
2. Malodorous Gases in the Sewer System
Odour annoyance is very much associated with municipal water and wastewater management [10]. Component installations of relevance to this are networks of sewers (or “sewerage”), stations pumping wastewater, catchment points, wastewater treatment plants, and sludge-management facilities [11,12]. Such infrastructure supplying treatment plants with wastewater represents a stage that may cause major odour annoyance, depending on both the type of sewage and the conditions of sewerage [13]. Raw wastewater in most towns and cities is collected and transferred to a central treatment plant via a network of fully surcharged, pressurised rising mains, and/or through partially filled gravity sewers [14].
Sewer systems comprise elements by which both storm water and wastewater can be collected, transported (possibly with retention at some point), and discharged for either utilisation or collection [15]. From the point of view of the generation or accumulation of odours, the most vulnerable systems are sanitary sewerage and combined sewerage systems [16].
Each system [17] is characterised by zones sensitive to odour accumulation [18]. In sewerage, these comprise:
- Conduits characterised by limited gradients and hence low flow rates;
- Connection sewerage wells;
- Sewage pumping stations;
- Syphon transitions.
Places of accumulation in the system are as presented in the overview diagram, shown in Figure 1.
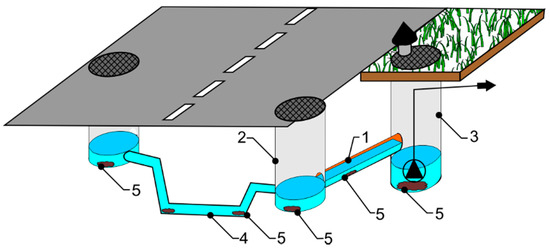
Figure 1.
Accumulation of sewage in or at: 1—conduits, 2—sewer manholes, 3—sewage pumping stations, 4—syphon transitions, 5—sewage contaminations).
A major zone of accumulation of sewage involves conduits (No. 1 in Figure 1), given their limited bottom slope [19]. Very often, a conduit of this kind in a newly established catchment transports only limited volumes of sewage initially [20]. That denotes problems with wastewater being maintained in a “fresh” state, as opposed to putrefying. A low flow rate also inhibits self-cleaning (with tangential stressing of channel walls taking place). Ultimately, channels can tend to operate as settling tanks.
Other strategic elements present along gravity conduits are sewer manholes (No. 2 in Figure 1). These are associated with connections to channels, allowing for changes of slope, diameter, or direction of flow [17]. Given gravitational flow, the problem resembles that faced in gravity sewage conduits. Velocity of flow is insufficient, so sewage accumulates in the base units of inspection chambers. Where ventilation is inadequate and temperatures are high, a process of putrefaction can begin at these locations.
Therefore, a system operating via gravitational flow may often require a pumping station (designated by No. 3 in Figure 1) [21] as an installation transferring wastewater to a higher level, e.g., in flat areas or those with very variable slopes. Pumping may also be necessary along sections just prior to treatment plants. Gravity systems operating in conjunction with pressure conduits are particularly unsuited to maintaining wastewater in a state of appropriate quality [22]. This reflects the retention volume of wastewater [23], as adjusted in line with flow conditions. The fact that wastewater accumulates periodically as a consequence of uneven and low flow, combines with high temperatures and the emergence of anaerobic conditions to encourage putrefaction and the consequent emission of odours.
Odour annoyance is noticeable where sewage from neighbouring municipalities discharges into municipal sewerage. This reflects both the qualitative aspects of the sewage itself; and the long potential wait at pumping stations, where crushing also takes place. Turbulent movement encourages degassing here, with malodorous substances released. A significant amount of the slurry arising from petroleum-ether extraction adheres to well walls or bottoms, where malodourous putrefaction processes may again take place.
Other characteristic elements of sewerage (less often combined) are syphon transitions (marked as No. 4 in Figure 1). These allow for the transport of sewage under pressure within the gravity network. Thanks to the specific construction of a syphon transition (with a downhill section, a horizontal outflow section of limited slope; and a rising section), it is possible for an obstacle (e.g., a watercourse, track, or other infrastructure) to be bypassed. However, correct functioning of a syphon transition requires a constant flow of wastewater, which is not always achievable. In fact, the hour-by-hour consumption of water (and thus, the wastewater outflow) proves to be extremely irregular, such that flow rates fluctuate greatly. At times, flow velocities approach (or even go below) the speed at which sand falls, with a sewer then effectively converting into a settler. Zones most vulnerable to accumulation are then those in which pressure falls most, e.g., with a change of direction, and most especially prior to the aforementioned rising section.
Systems of drains carrying storm waters away from sealed surfaces (as in combined systems, shown in Figure 2) also have critical zones where solids may accumulate, especially:
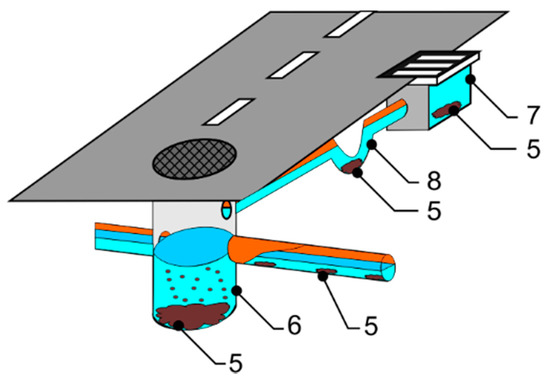
Figure 2.
Accumulation of sewage in combined sewerage/stormwater drainage systems: 5—sewage accumulation, 6—sediment wells, 7—roadside inlets, 8—siphons.
- Sedimentation wells;
- Rain inlets;
- Siphons at inlets.
Potential accumulation sites in combined sewerage + stormwater drainage systems are as shown in Figure 2.
Systems also incorporating runoff from roads include sediment wells (marked No. 6 in Figure 2). These function as settling tanks in which larger items settle on the bottom, allowing for a reduction in pollutant loading of the receiving water [24]. A similar situation applies to roadside inlets (marked No. 7 in Figure 2), whose structure also foresees sedimentation elements capturing polluting items of larger size [25].
Rain inlets are most often installed in road lanes whose surface runoff has very unfavourable quality parameters [26]. This affects oil leaks and the presence of solid deposits of pollutants from cars, as well as dusts and sand.
The last elements facilitating settlement of pollutants are siphons (marked No. 8 in Figure 2), which combine street inlets with combined sewerage conduits. Their particular use is in preventing the escape of gas from combined systems. Nevertheless, the stormwater may be contaminated with petroleum-derived compounds and suspended matter which can affect lower emission of odours—in opposition to sanitary sewerage.
Emissions from wastewater to the air constitute a complex mixture of as many as a thousand different substances produced and emitted in varying conditions [27]. Molecules typically responsible for odour would be compounds of sulphur or nitrogen, chlorinated compounds, or other substances containing carbon [28]. Table 1 offers examples of malodorous volatile compounds associated with wastewater.

Table 1.
Examples of malodorous volatile compounds associated with wastewater (adapted from [29]).
Emissions of odours at wastewater management facilities may also be dependent on sewage pH or temperature, as well as atmospheric pressure and air turbulence over the source. The presence of oxygen is also important in the generation of odours (Figure 3) [28].
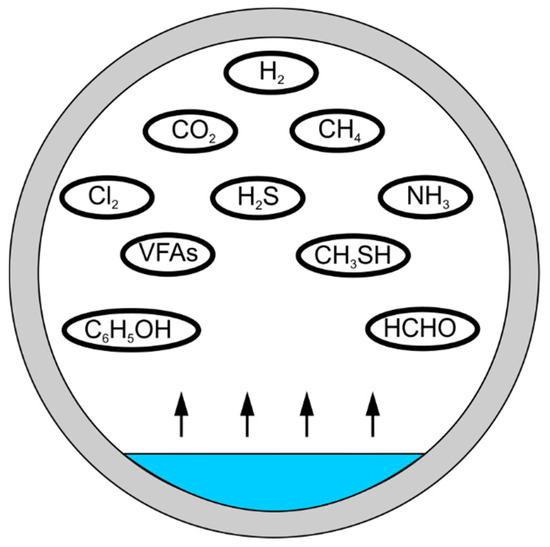
Figure 3.
Odour emission in the sewage system.
Meteorological conditions do much to ensure marked season-to-season variability in odour emissions, especially from surface sources. The range of impact of malodorous water/wastewater-management buildings and installations may even double in summer as opposed to winter (Table 2). Table 2 also presents typical concentrations of selected odours at various locations throughout a network. Substances occurring most frequently, and at highest concentrations, are hydrogen sulphide H2S (at 0.21–21,000 µg/m3) and dimethyl sulphide (at 1.1–45,000 µg/m3). Hydrogen sulphide is an inorganic sulphide, taking the form of a highly toxic, colourless gas of unpleasant rotten-egg smell. It is responsible for several problems in the environment, such as biogenic corrosion of concrete structures, odour annoyance in urban areas, and toxicity to sewer workers. Dimethyl sulphide is also known for its strong “rotten cabbage” or “canned corn” odour.
Table 2.
Examples of malodorous substances concentrating at various points in a system.
When the elements of a network are compared, the largest releases of malodorous substances are seen to be from pumping stations, as well as from siphons. This reflects a greater capacity to retain high volumes of sewage that may begin to putrefy—should conditions favour that—e.g., at pumping station tanks, or in the directional-change parts of syphon transitions.
3. Legal Conditions
There is nothing new about complications resulting in the generation of malodorous substances as wastewater is carried through sewers and pipelines. Yet, relevant legal provisions are still lacking, and the European Union has no legal act regulating abatement of odour annoyance in any comprehensive way. Difficulties with measuring odours have a great deal to do with this, though standardisation may anyway prove difficult, given various cultural, educational, and other factors affecting risk perception.
The failure of the European law in this regard also reflects a widespread subsidiarity-relevant view that counteraction of odour annoyance is a matter for the local government. Thus, while EU law obviously addresses the safeguarding of air quality, it fails to tackle the prevention or abatement of odour annoyance. Work to achieve regulation of odour annoyance has, however, been ongoing for years at a domestic level, as well as in the name of the whole EU [33]. However, such is the complexity of this problem that only 11 Member States currently have regulations based on air-quality standards in place. The number is nevertheless increasing. States regulating this annoyance currently include the United Kingdom, The Netherlands, Belgium, Germany, France, and the Czech Republic in the EU; as well as Turkey, Japan, New Zealand, Australia, the USA, and Canada. Naturally, approaches do differ (Table 3), for example, with the criteria vis-à-vis odour annoyance relating to odour concentration, substance concentration, minimum distance, duration and frequency, intensity of fragrance, odour index, annoyance prevention, quantitative emission, complaints, and best available technology [33].
Table 3.
Management to prevent or curb odour annoyance in selected countries.
Exact ranges of concentrations of individual odour components have been determined in the Japanese case. Currently, Japan has 22 designated Offensive Odour Substances, with local governments determining each standard value within the range described below (Table 4). Law enforcement seeks to ensure that concentrations in air/water do not exceed standard values.
Table 4.
Permissible contents of odour-generating substances in Japan (adapted from [35]).
4. Possibilities of Preventing Odour Annoyance
Air protection is currently a key aspect of the broader concept of environmental protection. The correct design, construction, and operation of networks dealing with wastewater can often reduce or even eliminate odour annoyance [36]. In turn, where the systems in question are already in place, odour annoyance abatement should entail all possible modifications of existing technological solutions, as well as necessary modernisation. The introduction of new systems not generating any favourable conditions for gaseous emissions is also possible. Effective emission abatement can mostly be achieved if sanitary and general engineering rules are adhered to strictly. Attempts to deodorise malodourous substances that do arise can also be made inter alia, where the odour annoyance is separated from the gases themselves, e.g., via admixtures that change the nature of a scent or reduce its intensity. Malodorous pollutants become odourless in this way, or at least come to be characterised by high(er) thresholds of olfactory perceptibility. The most frequently used methods of deodorisation are sorption, biological gas cleaning, thermal and catalytic combustion, and odour neutralisation [37]. However, gaseous compounds such as oxides of carbon and nitrogen, methane, ethene, ammonia, compounds of sulphur, etc., cannot be purified effectively by activated carbon alone [38]. Alternative, competing methods seeking to achieve the limitation or complete elimination of odour-generating processes along networks transferring wastewaters may make use of chemical reagents and so-called advanced oxidation processes (AOPs) [38,39,40,41,42,43].
To this end, use has so far been made of hydrogen peroxide, chlorine, ozone, and potassium permanganate to reduce odour emissions effectively. An example of dosing reagents to sewage systems is shown in Figure 4.
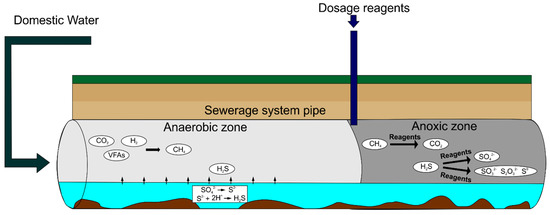
Figure 4.
An example of reagents being dosed into sewer systems.
Hydrogen peroxide is the most popular compound here, considered environment-friendly on account of its non-formation of harmful by-products with solid compounds. The only by-products of reactions are in fact water and CO2. At the same time, H2O2 is versatile enough to oxidise organic compounds of most different groups. In a process effective in eliminating odours, hydrogen peroxide achieves 85–100% removal of sulphides, leaving the aforesaid water and oxygen as by-products [41]. A further great advantage of introducing hydrogen peroxide into sewers is the resultant oxygenation that helps counteract wastewater putrefaction. The dose of oxidant will obviously need adjusting correctly to achieve the desired effect. A 1.5 h duration of action also needs to be borne in mind [38,39].
When dosing with chlorine compounds, limitations may arise due to the potential generation of halogen-based organics like the carcinogenic trihalomethanes. However, chlorine is useful in reducing sulphur to sulphate, and, not only are some of the available sulphide ions eliminated, but oxidation of organic matter in wastewater also takes place, with BOD (Biochemical Oxygen Demand) reduced in consequence. Sodium hypochlorite removes ammonia odours effectively, while also disinfecting and destroying cyanides. Chlorine dioxide is likewise effective in ridding wastewater of sulphides, phenols, and mercaptans (thiols). For its part, potassium permanganate (KMNO4) is a strong oxidising agent also capable of converting sulphide to sulphate, as well as oxidising organic substances responsible for odours. While rates of reaction are very fast, its high cost represents a major limitation. The pH of wastewater also plays an important role conditioning oxidation, with pH in the 6.5–7 range known to be optimal [38,44,45].
Ozone is another effective oxidiser of compounds impacting upon taste and odour, and not just thanks to its reducing quantities of malodorous substances. A study conducted by Laplanche et al. (1994) [46] shows the superiority of ozone + hydrogen peroxide over ozone alone. Beyond that, oxidants such as ammonium, potassium, and sodium perchlorates; sodium and potassium chlorates; sodium peroxide; sodium perborate; hydrogen peroxide; and mixtures of several of the above are all used in deodorising malodorous polyolefins [45].
However, as none of these different processes prove sufficiently effective in odour abatement, new methods or new combinations of processes are still being sought, while “advanced oxidation methods/processes” are resorted to. The latter are a series of chemical reactions ultimately generating the ●OH radicals representing relatively nonselective and high-rate reactants [47,48].
Conventional processes are often combined to raise levels of efficiency of contaminant removal. Thus, ozonation is, for example, combined with the use of hydrogen peroxide. Such approaches indeed prove superior to individual applications, when it comes to reducing amounts of flavours and odours, including the musty/earthy geosmin and isoborneol. The latter can also be eliminated effectively when hydrogen peroxide is combined with UV radiation under medium pressure lamps. Studies also report high-efficiency photocatalytic decomposition (with a titanium dioxide catalyst) of mercaptobenzimidazole, mercaptobenzoxazole, mercaptopyridine, and mercaptan paratolil [44,45].
Highly effective advanced oxidation methods include the so-called Fenton process, which can achieve rapid breakdown of pollutants. The versatility and high efficiency of this process assures it of more and more attention as a promising alternative method by which to remove contaminants, including those responsible for odour annoyance [41]. The classic Fenton reaction occurs via hydrogen peroxide breakdown, with the participation of Fe2+ ions as a process catalyst [49]. However, the reaction is actually far more complex, consisting of the series of subreactions described in Equations (1)–(8) [50,51].
Fe2++ H2O2 → Fe3+ + ●OH + OH−,
Fe3+ + H2O2 → Fe2+ + HO2● + H+,
●OH + H2O2 → H2O + HO2●,
●OH + Fe2+ → Fe3+ + OH−,
Fe3+ + HO2● → Fe2+ + O2 + H+,
Fe2+ + HO2● + H+ → Fe3+ + H2O2,
2HO2● → H2O2 + O2,
●OH + ●OH → H2O2.
In any case, it generates the aforementioned hydroxyl radicals with their high oxidation potential, which react with almost all organic compounds and are efficient inhibitors of the folding process. The utility of the Fenton process in removing malodorous substances (e.g., hydrogen sulphide) has been confirmed by Dębowski et al. (2008) [41], among others. The addition of the Fenton reagent to wastewater apparently curbs the formation of H2S in a process commencing in sewage from day 2 of detention, where conditions are anaerobic. Where the Fenton reaction was applied, no H2S was present in sewage biogas after just 8 days.
5. Summary
Many complaints from inhabitants single out networks of installations dealing with wastewater as sources of odours, and this is particularly so when air-pressure changes follow on from prolonged dry periods. Odours deserve special attention, not only because of the annoyance they represent (as the main reason for the aforesaid complaints), but also because of the potential role of the substances involved in degrading buildings and operating devices. Operators of such facilities helping to ensure the treatment and utilisation of wastewater also face threats. Thus, there is a justified need to seek out effective and economical techniques providing for the rapid abatement of unpleasant odours arising from sewage sludge.
The review of odour generation in sewerage systems and potential methods of abatement that has been provided here represents a first step on the road to further research. The subject is to be followed up via laboratory research, focusing on the use of the Fenton process in neutralising odours in a model system of sewerage. The influence of wastewater flow and airflow rates will also gain study in this way. On completion, this research will gain further validation in the real-world sewerage system present in a Polish city.
Author Contributions
Conceptualization, K.P.; data curation, M.K.; formal analysis, M.K. and S.Z.; investigation, S.Z.; methodology, M.K.; project administration, S.Z.; software, K.P.; supervision, K.P. and P.K.; validation, K.P.; writing—review and editing, K.P., M.K., S.Z., and P.K.
Funding
This research received no external funding.
Conflicts of Interest
The authors declare no conflict of interest.
References
- Barbusinski, K.; Kalemba, K.; Kasperczyk, D.; Urbaniec, K.; Kozik, V. Biological methods for odor treatment—A review. J. Clean. Prod. 2017, 152, 223–241. [Google Scholar] [CrossRef]
- Capelli, L.; Sironi, S.; Del Rosso, R.; Guillot, J.M. Measuring odours in the environment vs. dispersion modelling: A review. Atmos. Environ. 2013, 79, 731–743. [Google Scholar] [CrossRef]
- Tiziano, Z.; Reiser, M.; Naddeo, V.; Belgiorno, V.; Kranert, M. Odour emissions characterization from wastewater treatment plants by different measurement methods. CET 2014, 40, 37–42. [Google Scholar] [CrossRef]
- Hayes, J.E.; Stevenson, R.J.; Stuetz, R.M. The impact of malodour on communities: A review of assessment techniques. Sci. Total Environ. 2014, 500, 395–407. [Google Scholar] [CrossRef]
- Gostelow, P.; Parsons, S.A.; Stuetz, R.M. Odour measurements for sewage treatment works. Water Res. 2001, 35, 579–597. [Google Scholar] [CrossRef]
- Kazora, A.S.; Mourad, K.A. Assessing the Sustainability of Decentralized Wastewater Treatment Systems in Rwanda. Sustainability 2018, 10, 4617. [Google Scholar] [CrossRef]
- Shammay, A.; Sivret, E.C.; Le-Minh, N.; Fernandez, R.L.; Evanson, I.; Stuetz, R.M. Review of odour abatement in sewer networks. J. Environ. Chem. Eng. 2016, 4, 3866–3881. [Google Scholar] [CrossRef]
- Sivret, E.C.; Wang, B.; Parcsi, G.; Stuetz, R.M. Prioritisation of odorants emitted from sewers using odour activity values. Water Res. 2016, 88, 308–321. [Google Scholar] [CrossRef]
- Talaiekhozani, A.; Bagheri, M.; Goli, A.; Khoozani, M.R.T. An overview of principles of odor production, emission, and control methods in wastewater collection and treatment systems. J. Environ. Manag. 2016, 170, 186–206. [Google Scholar] [CrossRef]
- Hluštík, P.; Novotný, J. The Testing of Standard and Recyclable Filter Media to Eliminate Hydrogen Sulphide from Sewerage Systems. Water 2018, 10, 689. [Google Scholar] [CrossRef]
- Fisher, R.M.; Barczak, R.J.; Hayes, J.E.; Stuetz, R.M. Framework for the use of odour wheels to manage odours throughout wastewater biosolids processing. Sci. Total Environ. 2018, 634, 214–223. [Google Scholar] [CrossRef] [PubMed]
- Barczak, R.J.; Kulig, A. Comparison of different measurement methods of odour and odorants used in the odour impact assessment of wastewater treatment plants in Poland. Water Sci. Technol. 2017, 75, 944–951. [Google Scholar] [CrossRef] [PubMed]
- Choi, I.; Lee, H.; Shin, J.; Kim, H. Evaluation of the effectiveness of five odor reducing agents for sewer system odors using an on-line total reduced sulfur analyzer. Sensors 2012, 12, 16892–16906. [Google Scholar] [CrossRef] [PubMed]
- Jajac, N.; Marović, I.; Rogulj, K.; Kilić, J. Decision Support Concept to Selection of Wastewater Treatment Plant Location—The Case Study of Town of Kutina, Croatia. Water 2019, 11, 717. [Google Scholar] [CrossRef]
- Kordana, S. The identification of key factors determining the sustainability of stormwater systems. E3S Web Conf. 2018, 45, 33. [Google Scholar] [CrossRef]
- Singh, R.; Zhao, F.; Ji, Q.; Saravanan, J.; Fu, D. Design and Performance Characterization of Roadside Bioretention Systems. Sustainability 2019, 11, 2040. [Google Scholar] [CrossRef]
- Grygierek, M.; Kalisz, P. Influence of mining operations on road pavement and sewer system—Selected case studies. J. Sustain. Min. 2018, 17, 56–67. [Google Scholar] [CrossRef]
- Li, L.; Shan, B.; Yin, C. Stormwater runoff pollution loads from an urban catchment with rainy climate in China. Front. Environ. Sci. Eng. 2012, 6, 672–677. [Google Scholar] [CrossRef]
- Olds, H.T.; Corsi, S.R.; Dila, D.K.; Halmo, K.M.; Bootsma, M.J.; McLellan, S.L. High levels of sewage contamination released from urban areas after storm events: A quantitative survey with sewage specific bacterial indicators. PLoS Med. 2018, 15, e1002614. [Google Scholar] [CrossRef]
- Starzec, M. The impact of construction of piling partitions on the retention efficiency of a sewerage network. E3S Web Conf. 2018, 45, 87. [Google Scholar] [CrossRef]
- Tian, J.; Cheng, J.; Gong, Y. Optimization of municipal pressure pumping station layout and sewage pipe network design. Eng. Optim. 2018, 50, 537–547. [Google Scholar] [CrossRef]
- García, J.; Vigueras-Rodriguez, A.; Castillo, L.; Carrillo, J. Evaluation of Sulfide Control by Air-Injection in Sewer Force Mains: Field and Laboratory Study. Sustainability 2017, 9, 402. [Google Scholar] [CrossRef]
- Pochwat, K.; Iličić, K. A simplified dimensioning method for high-efficiency retention tanks. E3S Web Conf. 2018, 45, 65. [Google Scholar] [CrossRef]
- Pochwat, K.B.; Słyś, D. Application of Artificial Neural Networks in the Dimensioning of Retention Reservoirs. Ecol. Chem. Eng. S 2018, 25, 605–617. [Google Scholar] [CrossRef]
- Bąk, Ł.; Szeląg, B.; Sałata, A.; Studziński, J. Modeling of Heavy Metal (Ni, Mn, Co, Zn, Cu, Pb, and Fe) and PAH Content in Stormwater Sediments Based on Weather and Physico-Geographical Characteristics of the Catchment-Data-Mining Approach. Water 2019, 11, 626. [Google Scholar] [CrossRef]
- Hadera, D.; Asfaw, B. Socioeconomic Impact Assessment of Highway Drainage Outlet Erosion, Case Study of Mekelle to Adigrat Highway, Tigray, Ethiopia. J. Civil. Environ. Eng. 2016, 6, 215. [Google Scholar] [CrossRef]
- Lewkowska, P.; Cieślik, B.; Dymerski, T.; Konieczka, P.; Namieśnik, J. Characteristics of odors emitted from municipal wastewater treatment plant and methods for their identification and deodorization techniques. Environ. Res. 2016, 151, 573–586. [Google Scholar] [CrossRef]
- Wang, B.; Sivret, E.C.; Parcsi, G.; Wang, X.; Stuetz, R.M. Characterising volatile organic compounds from sewer emissions by thermal desorption coupled with gas-chromatography-mass spectrometry. Chem. Eng. 2012, 30, 73–78. [Google Scholar]
- Explore Chemistry. Available online: https://pubchem.ncbi.nlm.nih.gov/ (accessed on 25 June 2019).
- Van Gemert, L.J. Odour Thresholds: Compilations of Odour Threshold Values in Air, Water and Other Media; Oliemans Punter & Partners BV: Zeist, The Netherlands, 2003. [Google Scholar]
- Devos, M.; Patte, F.; Rouault, J.; Laffort, P.; Van Gemert, L.J. Standardized Human Olfactory Thresholds; IRL Press: Oxford, UK, 1990. [Google Scholar]
- Wang, B.; Sivret, E.C.; Parcsi, G.; Stuetz, R.M. Determination of VOSCs in sewer headspace air using TD–GC–SCD. Talanta 2015, 137, 71–79. [Google Scholar] [CrossRef]
- Brancher, M.; Griffiths, K.D.; Franco, D.; De Melo Lisboa, H. A review of odour impact criteria in selected countries around the world. Chemosphere 2017, 168, 1531–1570. [Google Scholar] [CrossRef]
- Kamigawara, K. Odor Regulation and Odor Measurement in Japan; Japanese Ministry of Environment: Tokyo, Japan, 2003. Available online: http://www.env.go.jp/en/lar/odor_measure (accessed on 25 June 2019).
- The Offensive Odor Control Law in Japan. Available online: https://www.env.go.jp/en/laws/air/offensive_odor/all.pdf (accessed on 25 June 2019).
- Both, R.; Sucker, K.; Winneke, G.; Koch, E. Odour intensity and hedonic tone - important parameters to describe odour annoyance to residents? Water Sci. Technol. 2004, 50, 83–92. [Google Scholar] [CrossRef]
- Wysocka, I.; Gębicki, J.; Namieśnik, J. Technologies for deodorization of malodorous gases. Environ. Sci. Pollut. R 2019, 26, 9409–9434. [Google Scholar] [CrossRef]
- Capelli, L.; Sironi, S.; Del Rosso, R.; Céntola, P. Predicting odour emissions from wastewater treatment plants by means of odour emission factors. Water Res. 2009, 43, 1977–1985. [Google Scholar] [CrossRef]
- Estokova, A.; Harbulakova, V.O.; Luptakova, A.; Kovalcikova, M. Analyzing the Relationship between Chemical and Biological-Based Degradation of Concrete with Sulfate-Resisting Cement. Pol. J. Environ. Stud. 2019, 28, 2121–2129. [Google Scholar] [CrossRef]
- Grabas, M.; Tomaszek, J.A.; Czerwieniec, E.; Zamorska, J.; Kukula, E.; Maslon, A.; Gruca-Rokosz, R. Noxiousness of odours and properties of wastewater sludge processing with biopreparation. Environ. Prot. Eng. 2011, 37, 17–25. [Google Scholar]
- Dębowski, M.; Zieliński, M.; Krzemieniewski, M.; Białowiec, A. The use of Fenton’s reaction to limit the process of creaming and formation of hydrogen sulphide in municipal wastewater. Annu. Set Environ. Prot. 2008, 10, 289–300. [Google Scholar]
- Kida, M.; Ziembowicz, S.; Koszelnik, P. Removal of organochlorine pesticides (OCPs) from aqueous solutions using hydrogen peroxide, ultrasonic waves, and a hybrid process. Sep. Purif. Technol. 2018, 192, 457–464. [Google Scholar] [CrossRef]
- Kida, M.; Ziembowicz, S.; Koszelnik, P. Application of an ultrasonic field for the removal of selected pesticides. E3S Web Conf. 2018, 49, 54. [Google Scholar] [CrossRef]
- Yao, H. Application of advanced oxidation processes for treatment of air from livestock buildings and industrial facilities. Tech. Rep. Biol. Chem. Eng. 2015, 2, 1–36. [Google Scholar]
- Wypych, G. Handbook of Odors in Plastic Materials; Elsevier: Amsterdam, The Netherlands, 2017. [Google Scholar]
- Laplanche, A.; Bonnin, C.; Darmon, D. Comparative Study of Odors Removal in a Wastewater Treatment Plant by Wet Scrubbing and Oxidation by Chlorine or Ozone, w: Characterization and control of odours and VOC in the process industries. In Characterization and Control of Odours and VOC in the Process Industries; Elsevier: Amsterdam, The Netherlands, 1994; Volume 61, pp. 277–294. [Google Scholar]
- Ziembowicz, S.; Kida, M.; Koszelnik, P. Removal of dibutyl phthalate (DBP) from landfill leachate using an ultrasonic field. Desalin. Water Treat. 2018, 4, 13. [Google Scholar] [CrossRef]
- Książek, S.; Kida, M.; Koszelnik, P. The occurrence and source of polycyclic aromatic hydrocarbons in bottom sediments of the Wisłok river. Pol. J. Natural Sci. 2016, 31, 373–386. [Google Scholar]
- Barbusiński, K. Intensification of the wastewater treatment process and stabilization of excess sludge using the Fenton reagent. Zeszyty Naukowe. Inżynieria Środowiska 2004, 50, 866–870. [Google Scholar]
- Aygun, A.; Yilmaz, T.; Nas, B.; Berktay, A. Effect of temperature on Fenton oxidation of young landfill leachate: Kinetic assessment and sludge properties. Glob. NEST J. 2012, 14, 487–495. [Google Scholar]
- Długosz, J. Fenton method and its modifications in the treatment leachate-for review. Arch. Waste Manag. Environ. Prot. 2014, 16, 33–42. [Google Scholar]
© 2019 by the authors. Licensee MDPI, Basel, Switzerland. This article is an open access article distributed under the terms and conditions of the Creative Commons Attribution (CC BY) license (http://creativecommons.org/licenses/by/4.0/).