Article

Analysis of the Spatial–Temporal Variation of the Surface Ozone Concentration and Its Associated Meteorological Factors in Changchun

College of New Energy and Environment, Jilin University, Changchun 130012, China
*
Author to whom correspondence should be addressed.
Environments 2019, 6(4), 46; https://doi.org/10.3390/environments6040046
Submission received: 23 February 2019 / Revised: 4 April 2019 / Accepted: 7 April 2019 / Published: 22 April 2019

Abstract

:
Ozone (O3) pollution has become one of the most challenging problems in China, and high O3 concentrations have been a major air quality issue in Changchun. Based on continuous observation data of surface ozone concentrations from ten automatic air monitoring stations and meteorological data from the meteorological bureau in Changchun, the temporal and spatial variations of the O3 concentration and its relationships with meteorological factors were analyzed by correlation analysis during the period of 2013–2017. The results showed the following: A single apex model of the annual mean O3 concentrations of the daily maximum 8 h average (MDA8) was found from the data for 2013 to 2017 in Changchun, with the highest MDA8 O3 concentrations in 2015 and a slight decline from then until 2017. The O3 concentrations in the suburban areas and the south of Changchun were higher than those downtown and north of the city. The seasonal variation of O3 concentrations was obvious, following the order summer > spring > autumn > winter, which was similar to the results of neighboring cities and provinces in Changchun. The days on which O3 concentrations exceeded the standard were concentrated in summer and spring, and the total number of ozone excess days was 91 days; the maximum number of ozone excess days was in 2015. The O3 concentration exceeded the standard in Changchun mainly in March–August, and its monthly mean value curve showed a bimodal type in which the highest values appeared in May and July, while the lowest values appeared in December. The diurnal pattern of ozone showed a single peak mode, and the peak value usually appeared at 14:00–16:00 while the minimum value appeared at 07:00–08:00. O3 concentrations in Changchun and the six selected pollutants CO, NO, NO2, NOx, PM10, and PM2.5 were negatively correlated. Higher temperature is a necessary synoptic condition for ozone pollution in Changchun: when the temperature rose, O3 concentrations increased significantly; further, O3 concentrations were negatively correlated with relative humidity and atmospheric pressure and were positively correlated with temperature and solar radiation. The O3 concentrations were highest when the wind scale approached 14~20 km/h and the wind direction was S. Combined with the research results in the surrounding areas of Changchun, it is indicated that there may be an ozone contribution from south of Changchun through long-range pollution transport and tropospheric subsidence.

1. Introduction

Ozone and fine particulate matter, as secondary pollutants, are considered to be two main atmospheric contaminants that dramatically affect the current environmental quality [1]. Ozone is mainly produced by the photochemical reaction of volatile organic compounds, nitrogen oxides, carbon monoxide, and other precursors under the action of solar radiation [2]. Studies have shown that photochemical processes are the main source of near-surface ozone, and its contribution is 7~15 times that of stratospheric ozone transport flux [3]. Tropospheric ozone has become a greenhouse gas which can affect the radiation budget of the atmosphere [4] and, at a certain concentration level, will have adverse effects on human health [5,6], ecosystems, crops [7,8], and so on. While the available data on the free troposphere are limited, a notable finding from the existing literature is that no site or region has shown a significant negative ozone trend since the 1970s [9]. In addition, significant positive upper tropospheric trends have been measured in one or more seasons above southern China and many other regions [10]. At the same time, ozone can accelerate the formation of particulate matter and other pollutants and thus affect the frequency and intensity of heavy pollution weather [11]. The formation of ozone is mainly controlled by precursor emissions and photochemical processes, but tropospheric ozone entrainment also influences the surface ozone, resulting in enhancement of its concentration [9]. It has been shown that the regional background ozone levels in the free troposphere and the boundary layer during summer contribute on average to the most part of the surface ozone levels measured in large urban areas like Athens [12]. Analysis has revealed that ozone is strongly influenced by synoptic meteorology [13,14]. Meteorological changes can affect recent and future trends in ozone and its precursors [15], and ozone pollution events are often caused by high-intensity emissions and adverse meteorological conditions [16]. Also, the tropospheric ozone is affected by climate variability [17,18]. Research over the Eastern Mediterranean indicated that the main origin of these high background ozone levels is tropospheric ozone subsidence, which seems to be strongly related with specific synoptic meteorological conditions [19]. In addition, strong summer anticyclonic subsidence in the lower troposphere, leading to enhanced ozone, has been reported over the eastern Mediterranean [20].
At present, a lot of extensive research on the photochemistry mechanism, transport, and migration of ozone has been carried out in North America [21,22]. Until the mid-2000s, only a few developed cities in China had carried out research on ozone [23,24], and there was little systematic research and coordinated monitoring of ozone nationally. Over the past few decades, ozone concentrations have been rising around the world [21,25]. With the rapid development of Chinese cities, ozone pollution is becoming more and more serious [26,27]. Since 2013, several serious air pollution phenomena have broken out in northeast China, and the environmental pollution has become increasingly serious [28,29]. Therefore, study on ozone is extremely urgent. In this paper, ozone monitoring data from Changchun, the capital of Jilin province, from 2013 to 2017 were used to analyze the variation characteristics and main causes of the ozone concentration in Changchun in combination with the relationship between various pollutants and meteorological factors.

2. Materials and Methods
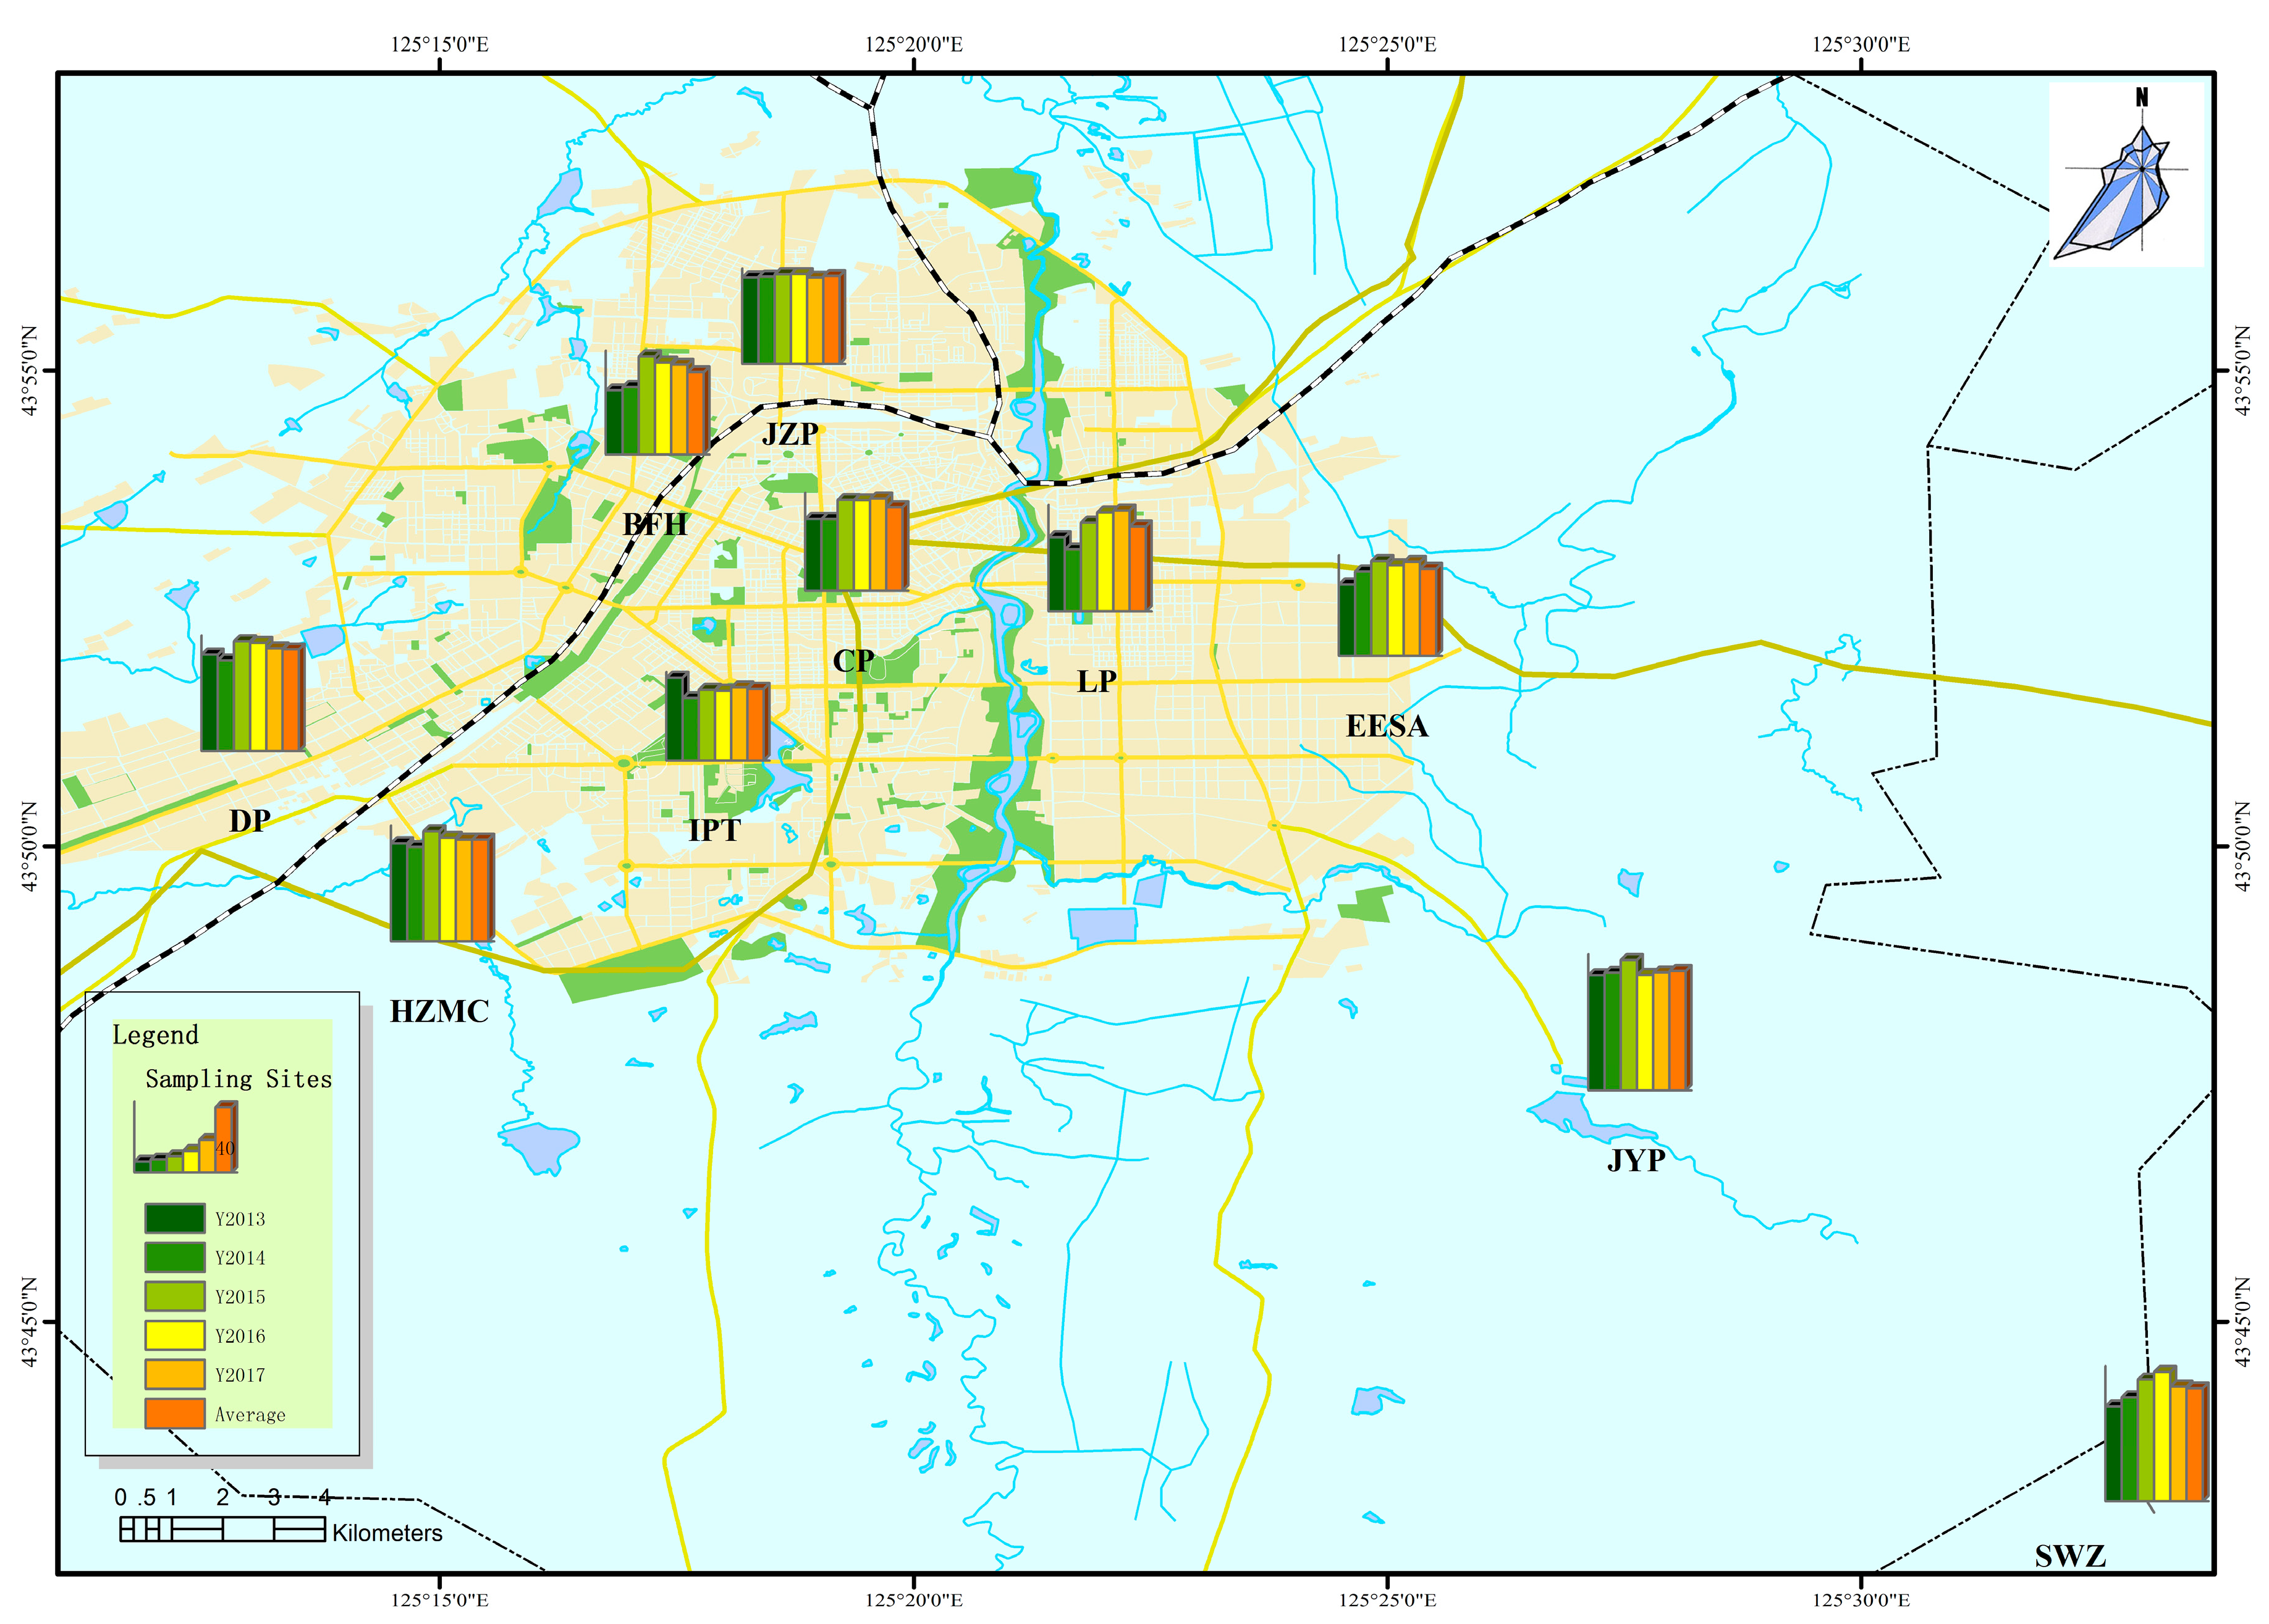
2.1. Sampling Sites

Since 2013, the Ministry of Environmental Protection has set up 1497 national automatic monitoring stations for atmospheric environmental quality, which have all been put into operation. The ozone observation data used in this paper are from ten automatic atmospheric environment monitoring stations in Changchun. Nine of the ten sites are located in the built-up area of Changchun, as shown in Figure 1: Daishan Park (DP), High-Tech Zone Management Committee (HZMC), Economic Development Zone Environment Sanitary Administration (EESA), Jingyue Park (JYP), Bus Factory Hospital (BFH), Labour Park (LP), Children’s Park (CP), Institute of Posts and Telecommunications (IPT), Junzilan Park (JZP). The tenth is one clean control station named Shuaiwanzi (SWZ), which is located in the Shuangyang district of Changchun and represents the background concentration. Data from all ten sites were used together for data processing in this paper. The equipment of the automatic monitoring stations of atmospheric environmental quality automatically collects samples and generates data every 15 min; it then automatically uploads these data to the national and provincial environmental protection departments. Table 1 shows the details of the above sampling stations.

2.2. Reference Standards and Pollutant Information

Unless specified otherwise, the ozone concentration used in this paper is the 8-hour moving average value of ozone. The environmental quality evaluation standard values of ozone concentration used herein are according to the HJ 633-2012 “Technical Regulation on Ambient Air Quality Index (on trial)” [30] issued by the Ministry of Environmental Protection; the limits of concentration at different levels in the daily evaluation of O3-8h are 161–215 μg/m3 for mild pollution, 216–265 μg/m3 for moderate pollution, and >265 μg/m3 for severe pollution and above. (The “Ozone Mass Concentration” is hereinafter referred to as the “ozone concentration” in units of µg/m3.) According to the regulation, the ozone concentration exceeds the standard when the “daily maximum 8-hour average” exceeds 160 μg/m3 or the “one-hour average” exceeds 200 μg/m3. In this paper, all measured data were selected according to the “Monitoring Regulation for Ambient Air Quality” [31], the unreasonable values were removed, and data quality control was carried out. The calculation, statistics, and evaluation of various pollutant monitoring data were carried out in accordance with the “Monitoring Regulation for Ambient Air Quality” (GB3095-2012) and the “Technical Regulation for Ambient Air Quality Assessment (on trial)” (HJ663-2013) [32]. The pollutant data used in this paper include ozone hourly values (O3-1h), ozone 8-hour moving average values (O3-8h), nitric oxide (NO), nitrogen dioxide (NO2), carbon monoxide (CO), inhalable particulate matter PM10, and fine particulate matter PM2.5 from 2013 to 2017. The meteorological data include hourly temperature, air pressure, relative humidity, wind speed and direction data, and solar radiation data at 5:00, 13:00, and 21:00 for each day in 2015. The multi-year statistical date count uses Julian days [33], and the seasonal division was adjusted with reference to the meteorological industry standard “Division of Climate Season” (QX/T152—2012) [34] and annual differences: April 16–May 31 is spring (46 days) in Changchun, June 1–August 31 is summer (92 days), September 1–October 25 is autumn (55 days), and October 26–April 15 is winter (172 days).

3. Results and Discussion

3.1. Analysis of the Spatial–Temporal Variation of the Ozone Concentration

3.1.1. Analysis of the Spatial Variation of the Ozone Concentration in Changchun

As can be seen from Figure 1, the overall spatial distribution characteristics of the ozone concentration in Changchun are similar to those in other cities [35,36]. It is shown that the ozone concentration in the periphery of Changchun is higher than that in the center of the city, and the ozone concentration in the south of the city is higher than that in the north of the city. Except for 2013, the ozone concentration of IPT station was the lowest among the nine inner stations. Taking the IPT station as the center, the urban central area covered by the IPT, CP, and BFH stations in Changchun is the area with low ozone concentration. The highest average ozone concentrations were observed at the stations JYP and SWZ, located outside of the urban area to the southwest, while at the same time the prevailing wind direction is from the south in Changchun with relatively strong winds. These are strong signs that the background ozone levels in the area might originate from various processes including long-range pollution transport and tropospheric subsidence [37]. From 2013 to 2017, the ozone concentration at JYP station was always the highest among the nine sites. JYP station is located in a national scenic spot with high vegetation coverage, low traffic volume, and no pollution sources nearby. So, the large amounts of ozone precursor that are released by plants [25], blown upwind, and transported over long distances [38] may be the main reasons for the high concentration of ozone in this region. We used a kriging interpolation method in Surfer software to process the monthly average ozone concentration for five years in Changchun at these sites from 2013 to 2017, and we plotted the contour map as shown in Figure 2. The spatial distribution characteristics of the ozone concentration in Changchun are reflected in all time periods, and the monthly spatial distribution of ozone concentration is basically consistent, which conforms to the above laws.

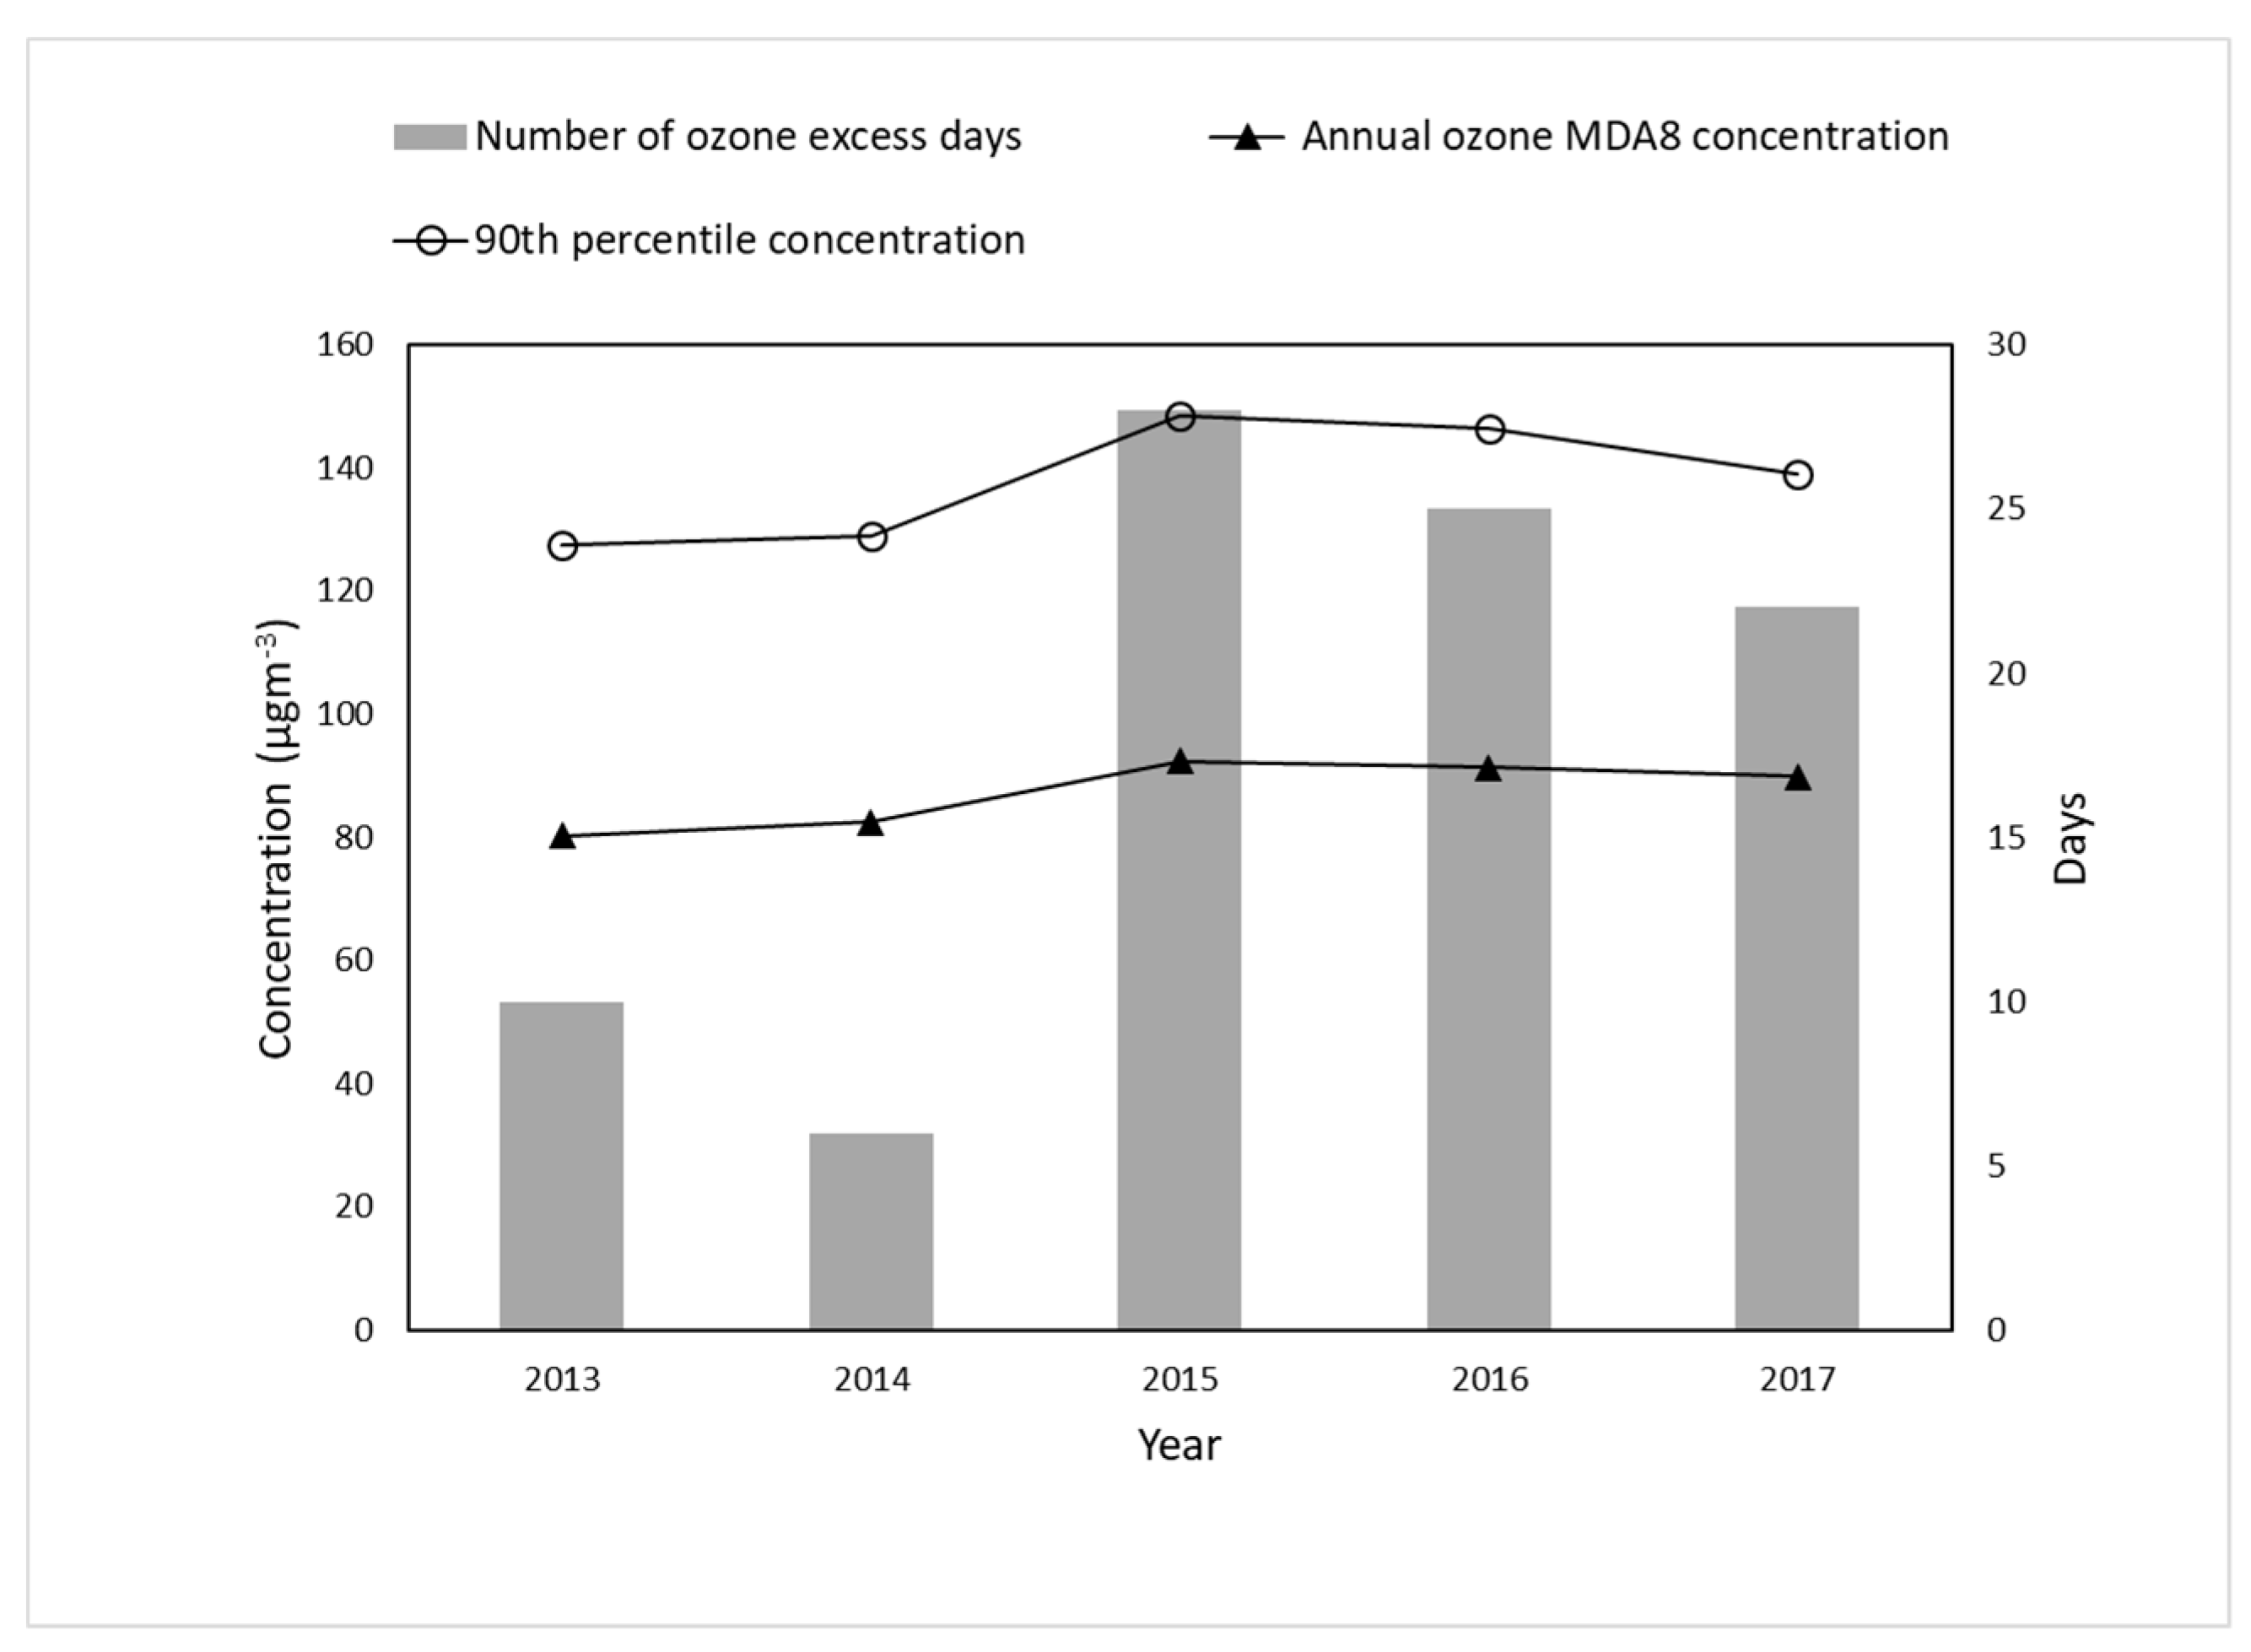
3.1.2. Analysis of the Annual Variation of the Ozone Concentration in Changchun

From 2013 to 2017, the daily maximum 8 h average (MDA8) of the ozone concentration in Changchun was 87 µg/m3. The trend of variation (Figure 3) showed a single peak distribution. The lowest concentration was 80 µg/m3 in 2013, and the highest concentration was 92 µg/m3 in 2015. The annual average concentration of MDA8 in the following two years declined very slowly, and the concentration in 2017 was 90 µg/m3. The multi-year annual concentration of ozone MDA8 in the 90th percentile was 138 µg/m3, and the average annual MDA8 of the ozone concentration ranged from 128 µg/m3 to 149 µg/m3. The total number of days on which the ozone concentration exceeded the standard in Changchun from 2013 to 2017 was 91 days. The column chart in Figure 3 shows that the number of ozone excess days in 2015 is the highest at 28 days. The number of ozone excess days in the following two years decreased but was still at a high level.
In order to analyze the five-year trend of ozone in Changchun in more detail, we calculated the daily, monthly, and annual average ozone concentrations from the 8-hour moving average values. The results are shown in Figure 4. Firstly, the annual average ozone concentration changed slightly from 2013 to 2014, rising by 19% in 2015, and then changed slightly in the following three years. Secondly, the monthly average concentration of ozone presents an obvious annual cycle. The concentration is low in the first and last cold months of the year in Changchun, and the lowest concentration occurs in December; during the warm months in the middle of the year, the concentration of ozone is relatively high, and the highest concentration of ozone, which fluctuates greatly every year, occurs in May–August. The monthly peaks of ozone concentration were in May in 2013 and 2016 and the peak was in July in the remaining three years. The long-term average annual value of daily ozone concentration was 57 µg/m3. From 2015 to 2017, the number of days with high ozone concentration increased, and the annual average ozone concentration increased generally compared with the previous two years.

3.1.3. Analysis of the Seasonal Variation of the Ozone Concentration in Changchun

The diurnal variation of the multi-year average ozone concentration over the four seasons in Changchun (Figure 5) shows a single peak trend. The concentrations in spring and summer were higher than those over the whole year and higher than those in autumn and winter. The peak ozone concentration was in the order summer > spring > autumn > winter, occurring at 14:00 p.m., and the valley concentration was in the order spring > summer > winter > autumn, generally occurring at 6:00 a.m. but at 7:00 instead in winter. The daily distribution of the ozone concentration in Figure 5 also presents diurnal and nighttime variation. During 11:00–21:00 in the daytime, the concentration of ozone in summer is higher than that in spring, while at other times that in spring is higher than that in summer. Similarly, diurnal variation of the ozone concentration in autumn and winter is also observed at 9:00–19:00. The major wind direction in spring at a synoptic scale is westerly in Changchun, which transports higher background ozone to East Asia. On the other hand, the major wind direction in summer is southerly [39], which transports cleaner air from the south. High values of near-surface ozone concentration appear in spring, which may be caused by large-scale air mass transport or stratospheric exchange caused by “tropospheric folding”, which may lead to a high concentration of tropospheric ozone in spring. Studies have shown that the tropospheric ozone concentration shows an increasing trend or abnormal value in spring, which is largely attributed to stratospheric ozone [40]. In summer, the daytime solar radiation is stronger and photochemistry reactions are more active. Near-surface NO depletes ozone and reduces its concentration. As shown in Figure A1, the concentration of NO in Changchun is higher in spring than in summer at 8:00–23:00 in the daytime and higher in summer than in spring at other times; this is also the reason why a high concentration of ozone occurs in spring at night, but there is no clear evidence to show the reason why a high concentration of ozone occurs in spring [41]. The diurnal and nocturnal variation of the ozone concentration in autumn and winter can also be explained by NO. The concentration of NO in Changchun is higher in winter than in autumn from 7:00 to 17:00, while it is higher in autumn than in winter at other times. The seasonal and diurnal variation of the NO concentration in Changchun is exactly opposite to the variation of the ozone concentration.

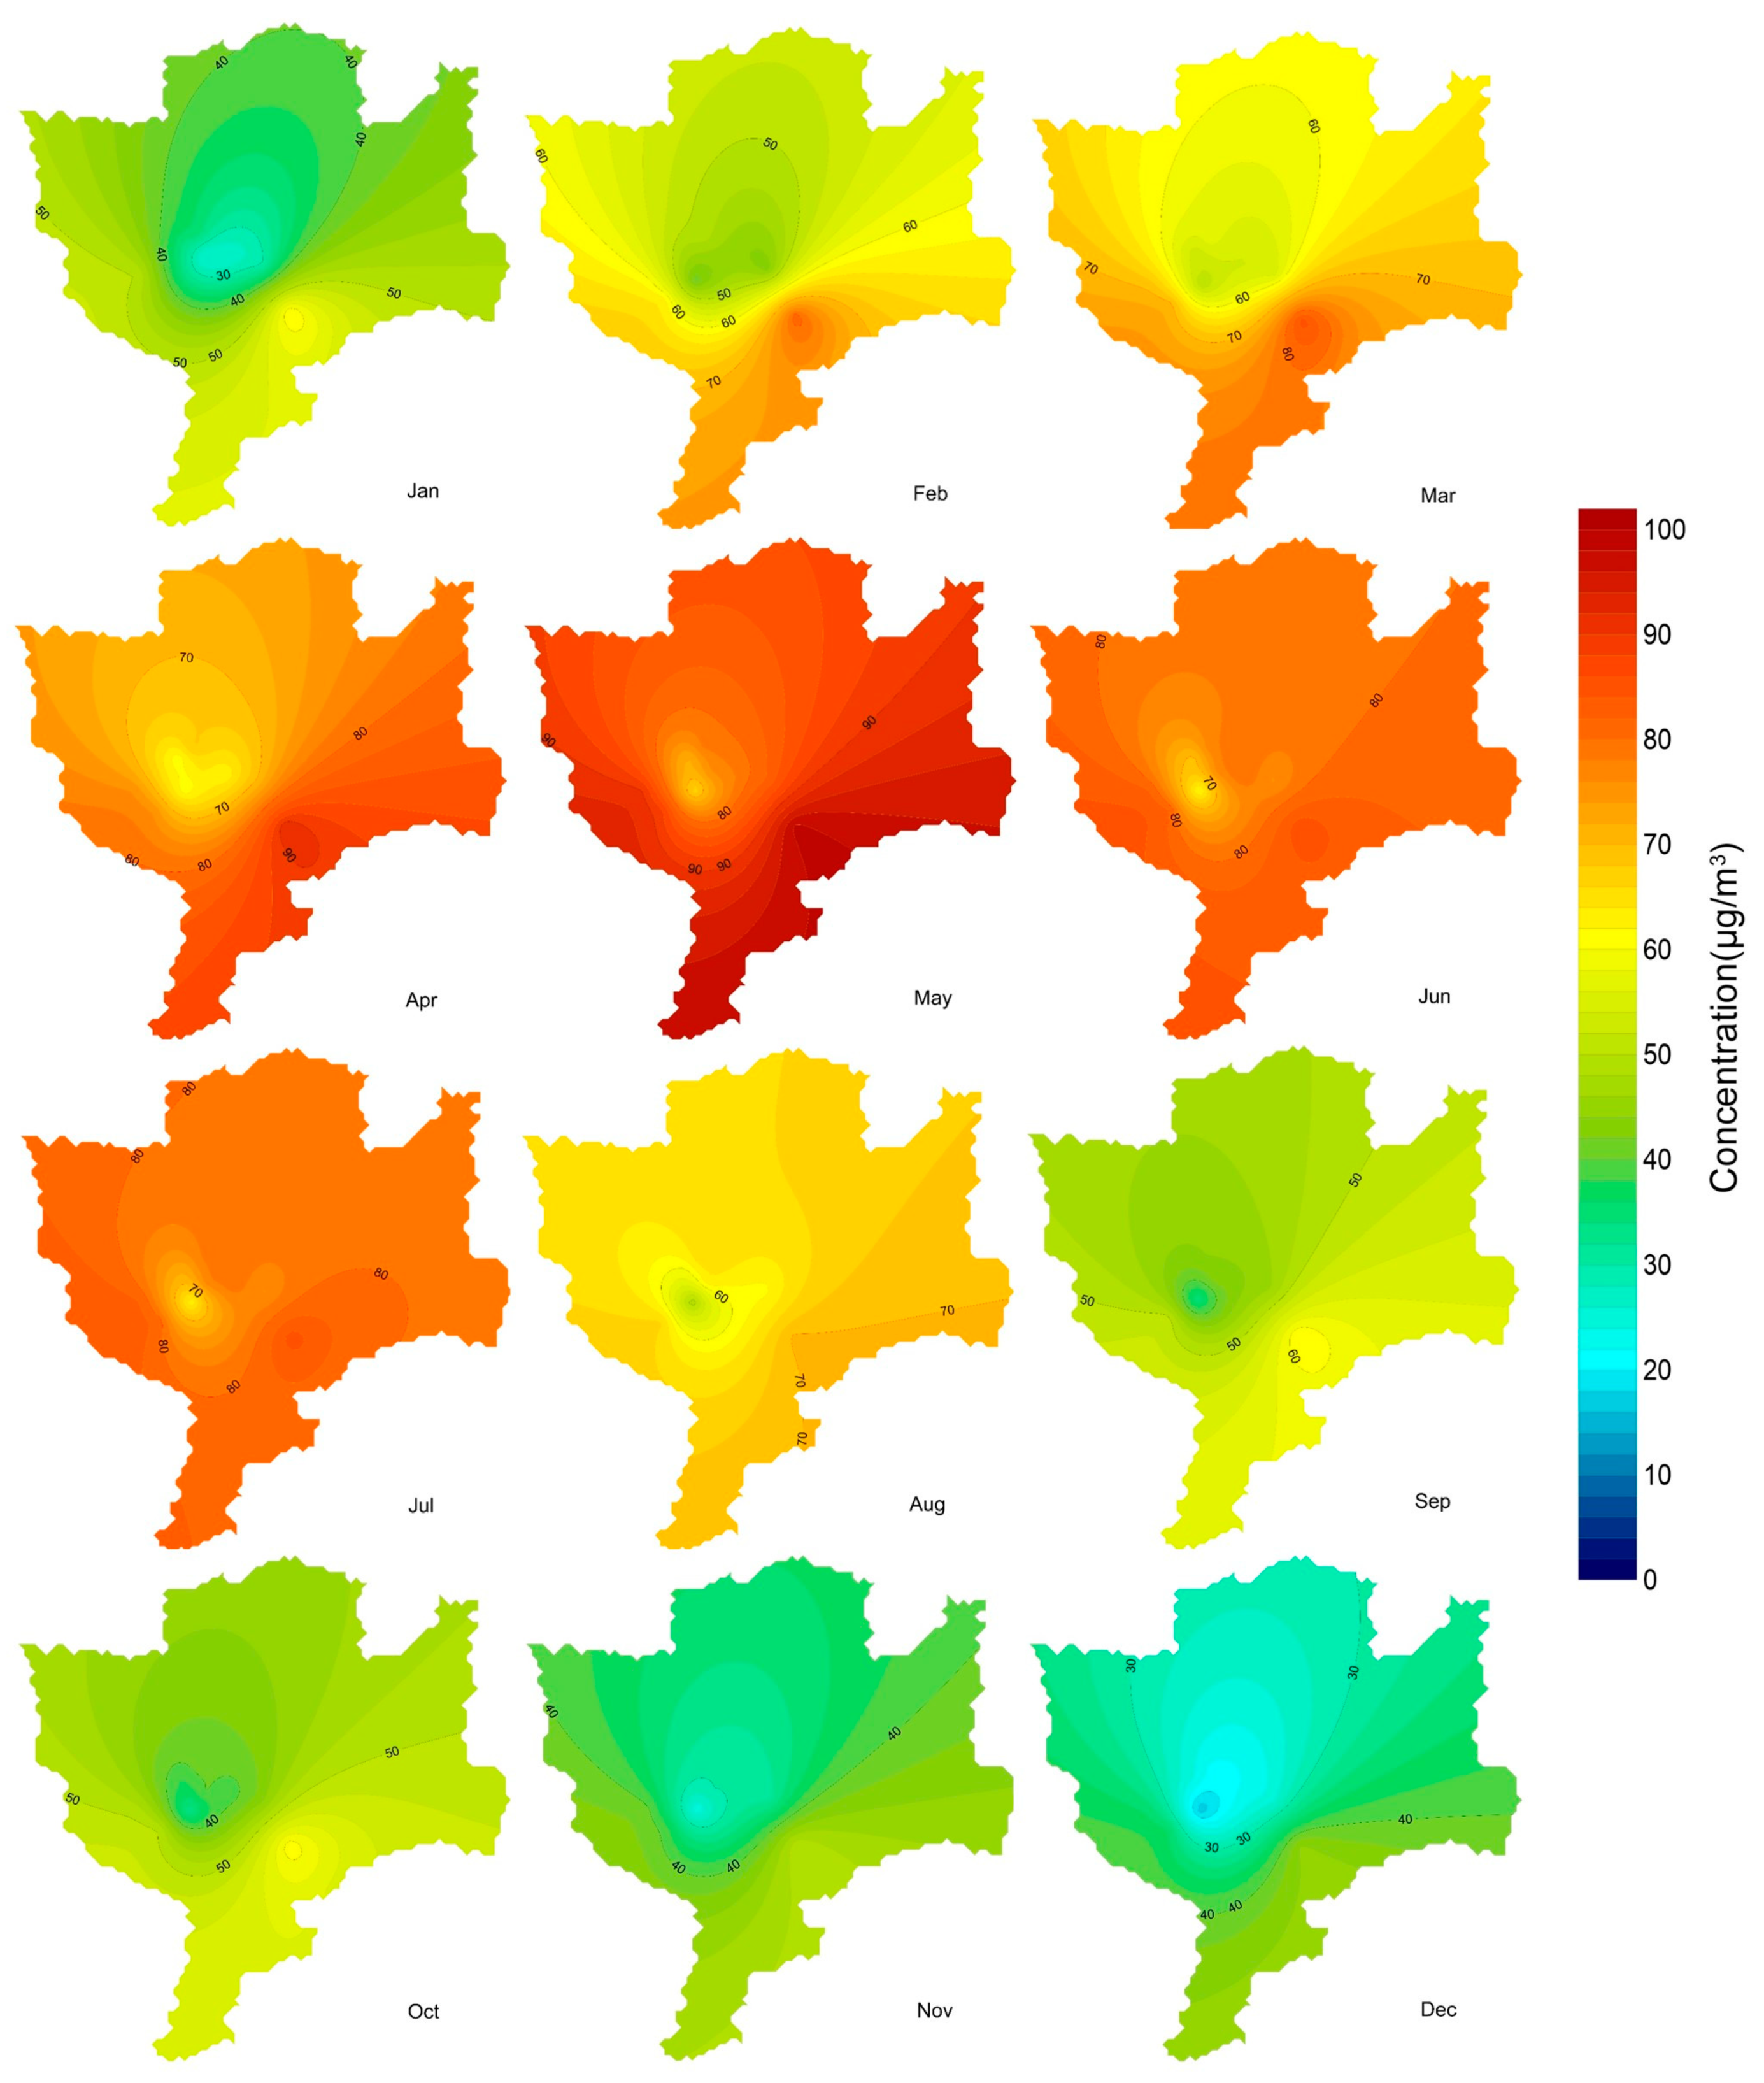
3.1.4. Analysis of the Monthly Variation of the Ozone Concentration in Changchun

The 24-hour stacked graph of the ozone concentration in Changchun (Figure 6) shows an obvious white shuttle-shaped area; this area indicates that the monthly average ozone concentration in Changchun is high in the middle hot months and low in the head and tail cold months. The reason for this is that the solar radiation during the hot months is stronger, there are more sunshine hours, and the temperature is higher, which is conducive to the formation of ozone, so the ozone concentration must be higher. It is also obvious in Figure 6 that March–August are months of high ozone concentration in Changchun. From 2013 to 2017, the monthly average ozone concentration reached its peak in May and July and its valley in December. The monthly concentration averaged over five years reached its peak in May of 82 ± 18 µg/m3 and reached its lowest value in December of 30 ± 7 µg/m3. In 2015, the monthly variation of the ozone concentration became a bimodal pattern. The peak months of ozone concentration were May and July, and the annual maximum appeared in July. The high-concentration period of ozone is also shuttle-shaped in Figure 6. The high concentration of ozone represented by red is concentrated between March and August, and the low concentrations in the middle of May and June may be associated with the high relative humidity; this is also related to larger cloud cover and lower solar radiation, which are not conducive to the formation of ozone. (The relative humidity in June is 7–10% higher than that in the next two months.)

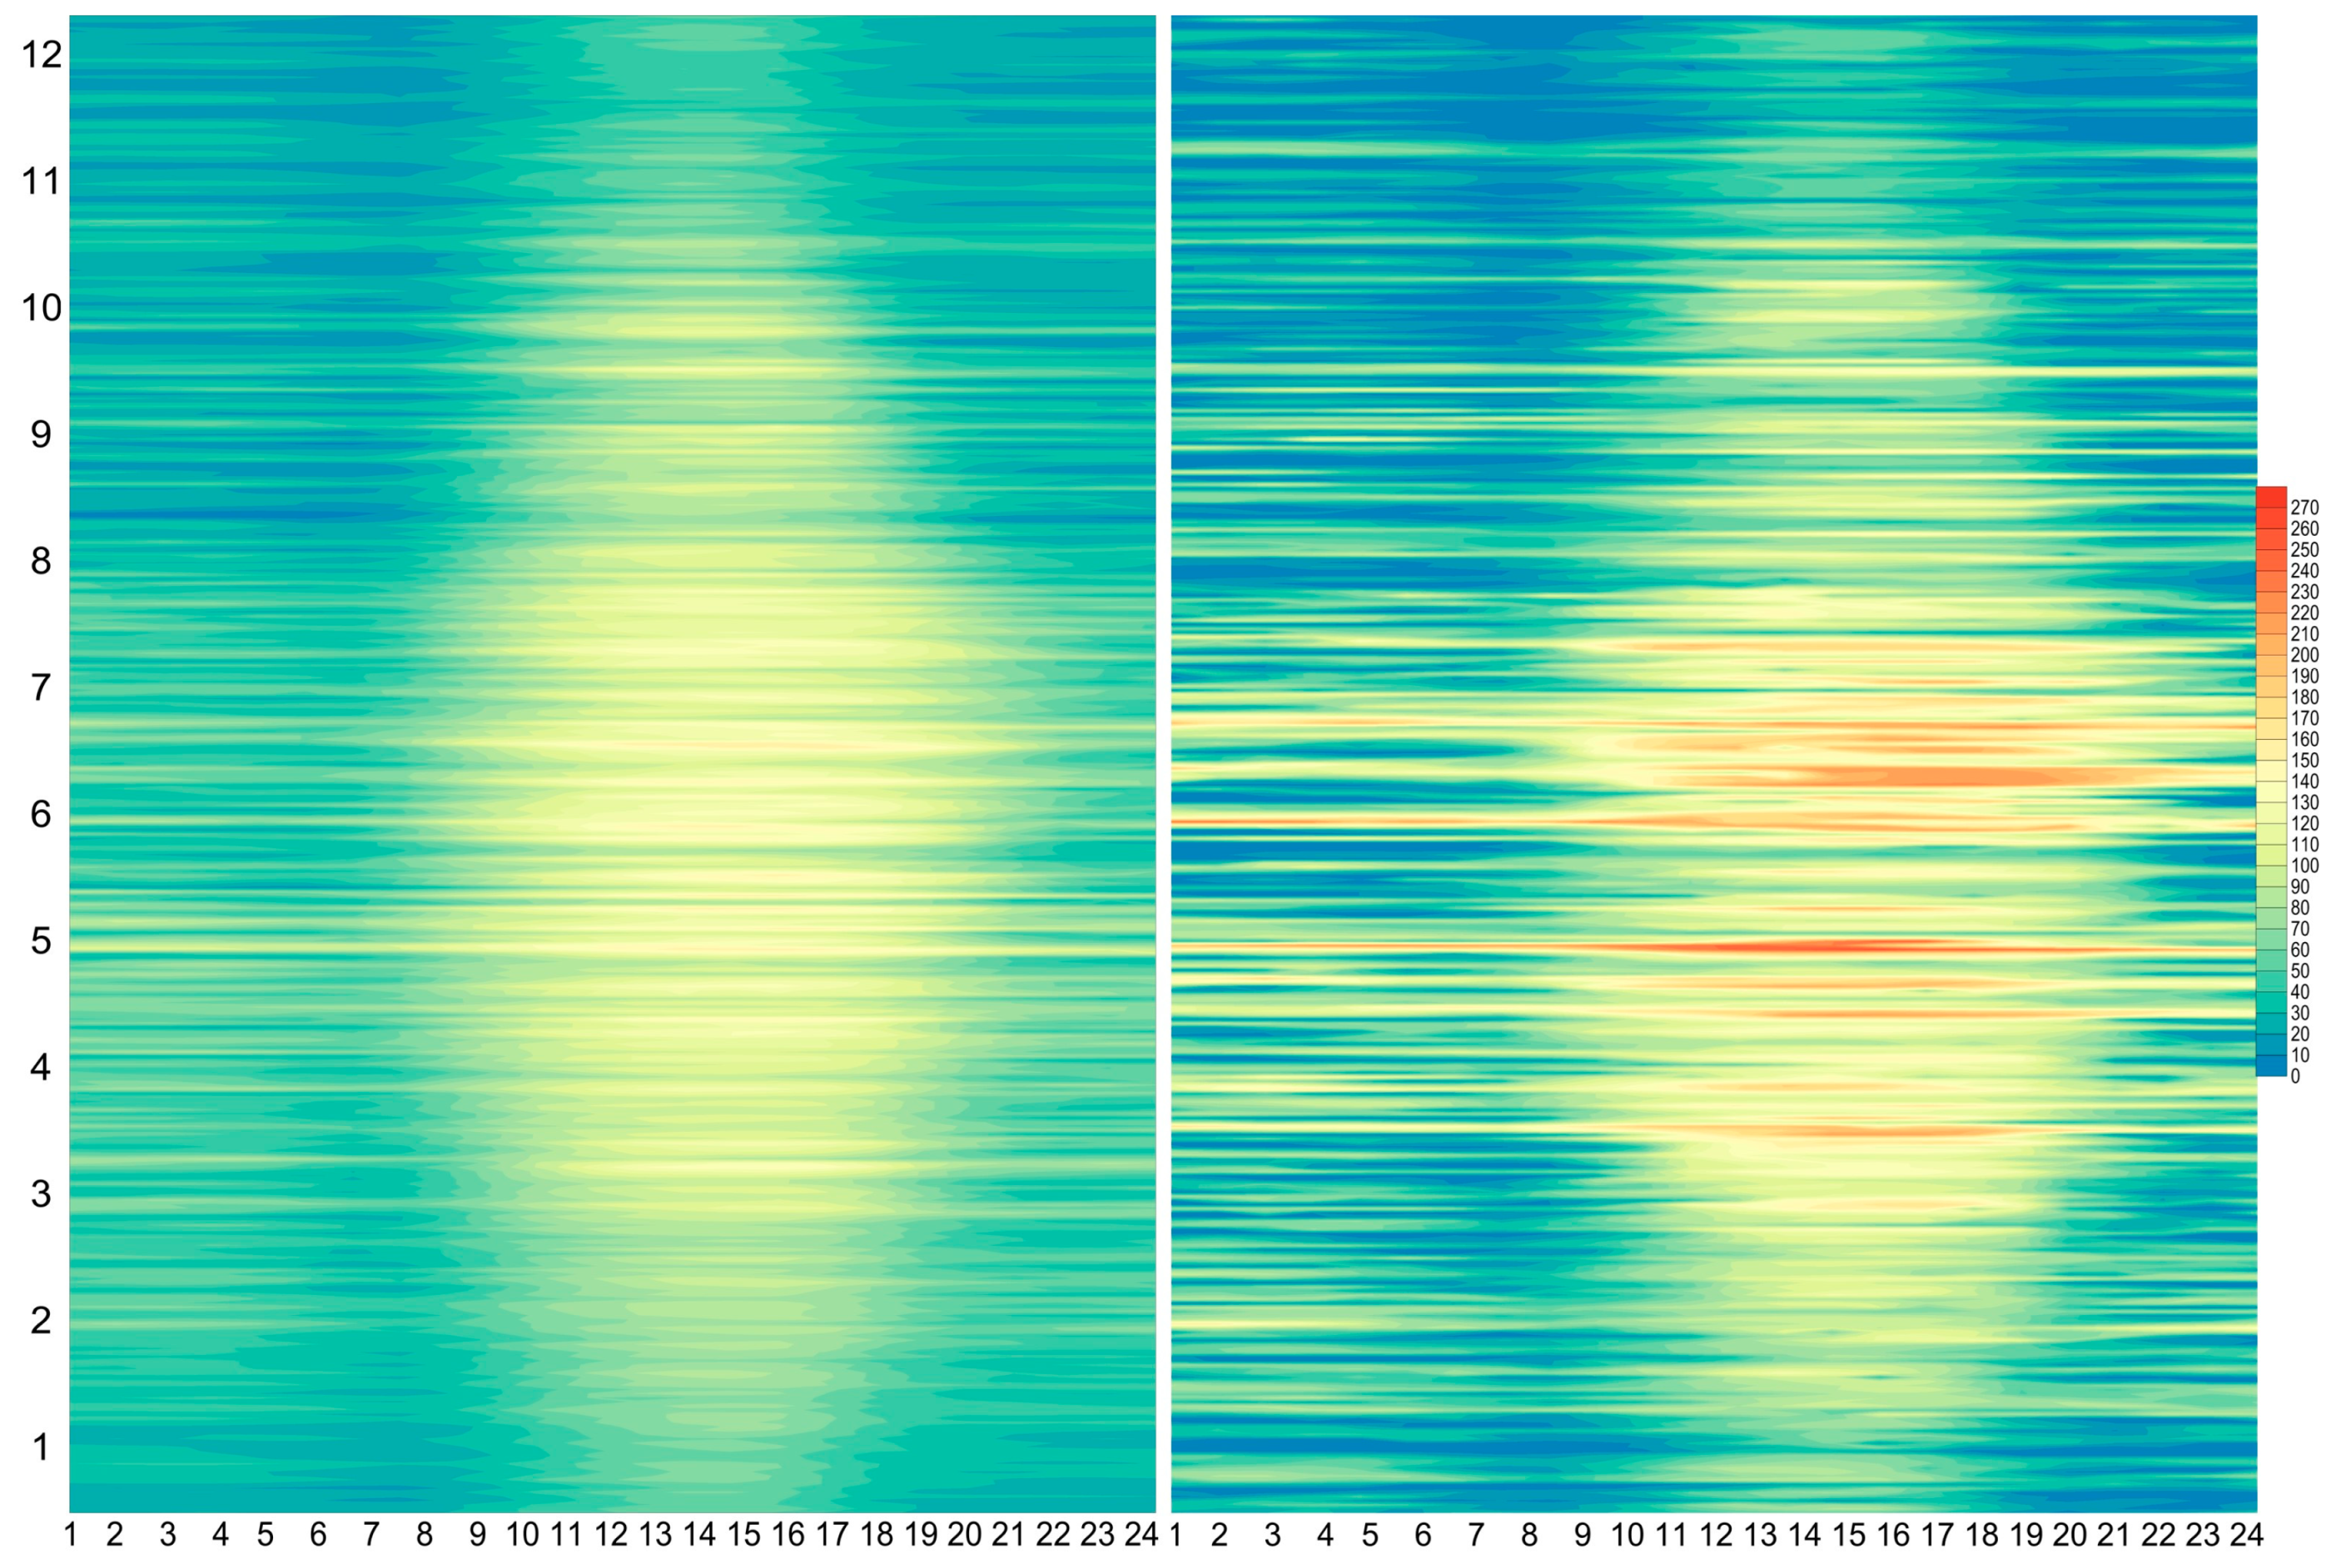
3.1.5. Analysis of the Diurnal Variation of the Ozone Concentration in Changchun

From the seasonal variation maps of ozone concentration (Figure 5) and 24-h stack maps (Figure 6), it can be seen that the diurnal variation of ozone presents a single peak distribution. Figure 5 is the eight-hour moving average value of ozone and Figure 6 is the hourly value of ozone; both charts show that low concentrations of ozone occur from 23:00 p.m. to 6:00 a.m. and high concentrations of ozone occur from 10:00 a.m. to 20:00 p.m. The maximum occurs at 14:00–16:00 p.m. and the minimum occurs at 07:00–08:00 a.m. The accumulation regularity of ozone pollution is roughly divided into three stages: the accumulation stage of ozone and precursors, the photochemistry generation stage of ozone, and the ozone depletion stage [42]. From midnight to early morning, the concentration of ozone in the urban atmosphere is in the low concentration portion of the day. Although there is no photochemical reaction at night, the near-surface NO will continue to deplete ozone through constant rapid consumption reactions with a small range of time. Therefore, the lowest level of ozone concentration in Changchun appears at 07:00–08:00 in the morning and then increases rapidly, which is usually due to ozone entrainment from the free troposphere after the breaking of the nocturnal boundary layer. While 08:00–17:00 is mainly the stage of ozone optical chemical formation, with the emergence of morning rush hour, a large number of ozone precursors are released, and the intensity of solar radiation begins to increase gradually. The strong solar radiation is prone to producing a series of photochemical reactions. The free tropospheric influence attains its maximum in the afternoon hours when the thermal mixing also attains its maximum, while local in situ photochemical ozone production is maximized around noon, which makes the ozone concentration rise and reach its maximum value in a day at 15:00.

3.2. Effects of Meteorological Factors and Other Pollutants on Ozone Concentration

Previous analysis results showed that 2015 was a year with serious ozone pollution indicators, so this paper focused on the analysis of various causes of ozone changes in 2015. Therefore, it is particularly important to analyze the relationship between ozone concentration and meteorological factors and other pollutants after comparing the daily and monthly changes in 2015. The analysis of other pollutants and meteorological factors in this chapter is based on a one-hour time scale.

3.2.1. Effects of Other Pollutants on Ozone Concentration

The relationship between O3 and meteorological factors varies slightly in different regions, but there are generally the same conclusions on solar radiation, temperature, air pressure, relative humidity, wind direction, and wind speed, etc. In order to analyze the impact of other pollutants on ozone, this paper selected CO, NO, NO2, NOx, PM10, and PM2.5 as typical atmospheric pollutants. Combined with the selected meteorological factors, correlation analysis was used to analyze the correlation of 12 factors (Table 2). In the graph, the blue bars represent positive correlation, the red bars represent negative correlation, and the lengths of the bars represent the size of the correlation coefficient. The sample number of 12 factors is 8760. The atmospheric pressure and six pollutants selected in this paper are negatively correlated with the ozone concentration, among which the pollutants carbon monoxide and nitrogen oxides are moderately negatively correlated with ozone concentration; this is inevitable and similar to the research results in many cities. Also, the negative correlation of ozone concentrations against six primary pollutants while temperature, solar irradiation, and wind speed show a positive correlation with ozone indicates that regional background ozone levels are much more important than local in situ photochemical ozone production.

3.2.2. Effects of Temperature and Relative Humidity on Ozone Concentration

From Table 2, it can be seen that the ozone concentration in Changchun has strong negative correlations with relative humidity and air pressure. Under certain synoptic weather conditions, high regional background ozone concentrations might be observed, especially at the edge of a high-pressure synoptic system, which is also associated with high irradiation and temperature and low humidity [43]. Temperature is one of the most important meteorological factors affecting ozone concentration. The higher the temperature, the higher the ozone concentration will be; this is because the high temperature reduces the concentration of peroxyacyl nitrate (PAN), one of the precursors of ozone, resulting in high ozone concentration. In addition, an increase in temperature is often accompanied by an increase in radiation, a decrease in water vapor, and the natural emission of isoprene; all these factors together lead to an increase in the ozone concentration. An increase in relative humidity is often accompanied by increases in cloud cover, wind speed, and other meteorological conditions which are not conducive to ozone generation and the accumulation of pollution, thus leading to a reduction of the ozone concentration [44]. Relevant studies have suggested that in heavily polluted urban areas, due to the presence of a large number of ozone precursors, an increase in water vapor will promote the conversion of NO2 to nitric acid, thus inhibiting the formation of ozone [45]. It is confirmed again that an increase in relative humidity will result in a significant reduction of the ozone concentration. Studies in some cities [46] have shown that the effect of temperature on the ozone concentration is not simply a positive correlation, while relative humidity may have a positive correlation with ozone concentration in some areas; this provides a more detailed and reliable research direction for the future study of the effect of meteorological factors on ozone concentration.

3.2.3. Effects of Wind Direction and Wind Speed on Ozone Concentration

Wind direction and wind speed affect the transport and diffusion of ozone pollutants, and different wind fields significantly affect the ozone concentration in Changchun. The prevailing wind direction in Changchun is southwesterly wind all year round, while southerly wind is the dominant wind direction in Changchun on ozone excess days, with an average wind speed of 14 km/h. Figure 7 also shows that the dominant wind direction in Changchun had a high wind speed of 14–20 km/h on the days when ozone exceeded the standard. In the case of ozone pollution, ozone pollutants and their precursors in the south of Changchun may be transported to Changchun through the southerly wind. Research results have shown that the ozone concentrations at the 90th percentile in each year of 2013–2015 in Shenyang, close to Changchun, were 140, 165, and 155 µg/m3, respectively—higher than those of Changchun. The highly polluted area of Shenyang is a suburb located in the south of Changchun. The ozone pollution in Shenyang may affect the generation and accumulation of ozone in Changchun. The impact of the wind field on pollutants cannot be simply inferred from a single dataset. This will be the main research direction in the future to explore the impact of the wind field on ozone pollution in Changchun based on data from all cities in Jilin Province and the surrounding provinces and cities.

3.2.4. Effects of Solar Radiation on Ozone Concentration

Because of the strong positive correlation between O3-8h and O3-1h concentrations, we chose the solar radiation data and the O3-8h data for correlation analysis and linear fitting (Figure 8). There is a strong positive correlation between ozone concentration and solar radiation in Changchun, with a correlation coefficient of 0.65. O3 concentration increases with increasing solar radiation, but there is little difference under different radiation conditions: only in the case of high radiation intensity of 30–40 W/m2, the ozone concentration exceeds 140 µg/m3. Some studies from the literature have shown that when radiation is low, the value of the O3 concentration is small, and it increases with increasing radiation. It is noteworthy that the relationship between ozone and solar radiation is not a simple linear relation. Zhao et al. [47] considered that when the solar radiation is higher than a certain value (about 40 W/m2), with increasing radiation, the value of the O3 concentration does not increase but decreases. However, the solar radiation in Changchun does not exceed this limit, so there is no such relationship. When studying the influence of temperature on ozone concentration, some scholars believe that when the temperature is higher than a certain threshold, the excessive temperature conditions will reduce pollution emissions and increase the diffusion speed, resulting in a decrease in the concentration of nitrogen oxides and VOCs in the air and thus reducing the concentration of O3 near the ground [48]. This can also explain the decrease in the O3 concentration near the ground when the solar radiation reaches a critical value.
Variation in the ozone concentration is affected by many factors, the causes and mechanisms of which need to be further analyzed in future work, and more direct evidence must be obtained.

4. Conclusions

  • The ozone concentration in the periphery of Changchun is higher than that in the city center, and that in the south of Changchun is higher than that in the north. The average ozone MDA8 in Changchun was shown to be 87 µg/m3 and the maximum ozone concentration in Changchun increased year by year from 2013 to 2017 with a gentle single-front distribution. In 2015, the concentration of ozone MDA8 was the highest and the concentration growth rate was the fastest; in addition, the number of days exceeding the standard was the greatest in this year.
  • The seasonal and diurnal variations of the ozone concentration in Changchun showed a single peak distribution, while the monthly variations showed a double peak distribution. Obvious seasonal variation characteristics were shown. The peak concentration occurred between 10:00 and 20:00 in the daytime; during this period, the seasonal variation characteristics were in the order summer > spring > autumn > winter. The valley concentration occurred in the remaining period, and the seasonal variation characteristics were in the order spring > summer > winter > autumn. The monthly average ozone concentration reached its highest in May and July and reached its lowest value in December. The diurnal variation peak of the ozone concentration occurred from 14:00 to 15:00 p.m., and the lowest concentration appeared from 07:00 to 08:00 a.m.
  • In 2015, the ozone concentration in Changchun was moderately negatively correlated with carbon monoxide and nitrogen oxides and negatively correlated with PM2.5 and PM10. The ozone concentration was negatively correlated with atmospheric pressure and relative humidity and positively correlated with temperature, and there was a linear positive correlation between ozone concentration and solar radiation.

Author Contributions

C.F. worked on the data curation and methodology. Teachers C.F. and J.W. helped with the analysis of the raw data and reviewing the original draft. Also, these teachers worked as supervisors and directors of this study. L.W. is responsible for the conceptualization, original draft writing, review and editing of the article.

Funding

This research was funded by Ecology and Environment Department of Jilin Province. The project number is 2018-19.

Acknowledgments

The authors would like to thank the air monitoring stations of Changchun for supporting us. Also, the authors would like to thank the group members of Laboratory 537 of Jilin University.

Conflicts of Interest

The authors declare no conflict of interest.

Appendix A

Figure A1. Seasonal nitric oxide concentration variation in Changchun in 2013–2017.
Environments 06 00046 g0a1

References

  1. Li, M.; Ren, X.; Yu, Y. Spatial and temporal distribution of PM2.5 pollution in Chinese mainland cities. China Environ. Sci. 2016, 3, 641–650. [Google Scholar]
  2. Monks, P.S.; Granier, C.; Fuzzi, S. Atmospheric composition change–global and regional air quality. Atmos. Environ. 2009, 43, 5268–5350. [Google Scholar] [CrossRef]
  3. Young, P.J.; Archibald, A.T.; Bowman, K.W. Pre-industrial to end 21st century projections of tropospheric ozone from the Atmospheric Chemistry and Climate Model Inter comparison Project (ACCMIP). Atmos. Chem. Phys. 2013, 13, 2063–2090. [Google Scholar] [CrossRef]
  4. Stocker, T.F.; Qin, D.; Plattner, G.K.; Tignor, M.; Allen, S.K.; Boschung, J.; Nauels, A.; Xia, Y.; Bex, V.; Midgley, P.M. IPCC, 2013: Climate Change 2013: The Physical Science Basis. Contribution of Working Group I to the Fifth Assessment Report of the Intergovernmental Panel on Climate Change; Cambridge University Press: Cambridge, UK, 2013. [Google Scholar]
  5. Brauer, M.; Freedman, G.; Frostad, J. Ambient Air Pollution Exposure Estimation for the Global Burden of Disease 2013. Environ. Sci. Technol. 2015, 50, 79–88. [Google Scholar] [CrossRef]
  6. Li, T.; Yan, M.; Ma, W. Short-term effects of multiple ozone metrics on daily mortality in a megacity of China. Environ. Sci. Pollut. Res. 2015, 22, 8738–8746. [Google Scholar] [CrossRef] [PubMed]
  7. Feng, Z.; Hu, E.; Wang, X. Ground-level O3 pollution and its impacts on food crops in China: A review. Environ. Pollut. 2015, 199, 42–48. [Google Scholar] [CrossRef]
  8. Monks, P.S.; Archibald, A.T.; Colette, A. Tropospheric ozone and its precursors from the urban to the global scale from air quality to short-lived climate forcer. Atmos. Chem. Phys. 2015, 15, 8889–8973. [Google Scholar] [CrossRef] [Green Version]
  9. Gaudel, A.; Cooper, O.R.; Ancellet, G.; Barret, B.; Boynard, A.; Burrows, J.P.; Clerbaux, C.; Coheur, P.-F.; Cuesta, J.; Cuevas Agulló, E.; et al. Tropospheric Ozone Assessment Report: Present-day distribution and trends of tropospheric ozone relevant to climate and global atmospheric chemistry model evaluation. Elem. Sci. Anthr. 2018, 6, 39. [Google Scholar] [CrossRef]
  10. Poberaj, C.S.; Staehelin, J.; Brunner, D.; Thouret, V.; Backer, H.D.; Stübi, R. Long-term changes in UT/LS ozone between the late 1970s and the 1990s deduced from the GASP and MOZAIC aircraft programs and from ozonesondes. Atmos. Chem. Phys. 2009, 9, 2435–2499. [Google Scholar] [CrossRef]
  11. Cheng, L.; Wang, S.; Gong, Z. Ozone Pollution Trend and Spatial-temporal Distribution Characteristics in Beijing-Tianjin-Hebei Region. China Environ. Monit. 2017, 33, 14–21. [Google Scholar]
  12. Kalabokas, P.D.; Repapis, C.C. A climatological study of rural surface ozone in central Greece. Atmos. Chem. Phys. 2004, 4, 1139–1147. [Google Scholar] [CrossRef] [Green Version]
  13. Kalabokas, P.D.; Mihalopoulos, N.; Ellul, R.; Kleanthous, S.; Repapis, C.C. An investigation of the meteorological and photochemical factors influencing the background rural and marine surface ozone levels in the Central and Eastern Mediterranean. Atmos. Environ. 2008, 42, 7894–7906. [Google Scholar] [CrossRef]
  14. Zhang, Y.; Wang, W.; Wu, S.Y. Impacts of updated emission inventories on source apportionment of fine particle and ozone over the southeastern US. Atmos. Environ. 2014, 88, 133–154. [Google Scholar] [CrossRef]
  15. Reddy, P.J.; Pfister, G.G. Meteorological factors contributing to the interannual variability of midsummer surface ozone in Colorado, Utah, and other western U.S. states. J. Geophys. Res. Atmos. 2016, 121, 2434–2456. [Google Scholar] [CrossRef]
  16. Otero, N.; Sillmann, J.; Schnell, J.L. Synoptic and meteorological drivers of extreme ozone concentrations over Europe. Environ. Res. Lett. 2016, 11, 024005. [Google Scholar] [CrossRef] [Green Version]
  17. Fiore, A.M.; Naik, V.; Leibensperger, E.M. Air quality and climate connections. J. Air Waste Manag. Assoc. 2015, 65, 645–685. [Google Scholar] [CrossRef] [PubMed]
  18. Barnes, E.A.; Fiore, A.M.; Horowitz, L.W. Detection of trends in surface ozone in the presence of climate variability. J. Geophys. Res. Atmos. 2016, 121, 6112–6129. [Google Scholar] [CrossRef] [Green Version]
  19. Zanis, P.; Hadjinicolaou, P.; Pozzer, A.; Tyrlis, E.; Dafka, S.; Mihalopoulos, N.; Lelieveld, J. Summertime free-tropospheric ozone pool over the eastern Mediterranean/Middle East. Atmos. Chem. Phys. 2014, 14, 115–132. [Google Scholar] [CrossRef] [Green Version]
  20. Safieddine, S.; Boynard, A.; Hao, N.; Huang, F.; Wang, L.; Ji, D.; Barret, B.; Ghude, S.D.; Coheur, P.F.; Hurtmans, D.; et al. Tropospheric ozone variability during the East Asian summer monsoon as observed by satellite (IASI), aircraft (MOZAIC) and ground stations. Atmos. Chem. Phys. 2016, 16, 10489–10500. [Google Scholar] [CrossRef] [Green Version]
  21. Simon, H.; Reff, A.; Wells, B. Ozone Trends Across the United States over a Period of Decreasing NOx and VOC Emissions. Environ. Sci. Technol. 2015, 49, 186–195. [Google Scholar] [CrossRef]
  22. Karlsson, P.E.; Klingberg, J.; Engardt, M. Past, present and future concentrations of ground-level ozone and potential impacts on ecosystems and human health in northern Europe. Sci. Total Environ. 2017, 576, 22–35. [Google Scholar] [CrossRef] [PubMed]
  23. Shi, C.; Wang, S.; Liu, R. A study of aerosol optical properties during ozone pollution episodes in 2013 over Shanghai, China. Atmos. Res. 2015, 153, 235–249. [Google Scholar] [CrossRef]
  24. Wang, W.N.; Cheng, T.H.; Gu, X.F. Assessing spatial and temporal patterns of observed ground-level ozone in China. Sci. Rep. 2017, 7, 3651. [Google Scholar] [CrossRef]
  25. Vingarzan, R. A review of surface ozone background levels and trends. Atmos. Environ. 2004, 38, 3431–3442. [Google Scholar] [CrossRef]
  26. Wang, T.; Xue, L.; Brimblecombe, P.; Lam, Y.F.; Li, L.; Zhang, L. Ozone pollution in China: A review of concentrations, meteorological influences, chemical precursors, and effects. Sci. Total Environ. 2016, 575, 1582–1596. [Google Scholar] [CrossRef] [PubMed]
  27. Li, K.; Chen, L.; Ying, F. Meteorological and chemical impacts on ozone formation: A case study in Hangzhou, China. Atmos. Res. 2017, 196, 40–52. [Google Scholar] [CrossRef]
  28. Kang, H.; Liu, Y.; Li, T. The characteristics of AQI and its relationship with meteorological elements in key cities of Heilongjiang province. J. Nat. Res. 2017, 32, 692–703. [Google Scholar]
  29. Lin, X.; Wang, D. Spatial and temporal evolution of urban air quality in China and its socio-economic driving forces. J. Geogr. 2016, 71, 1357–1371. [Google Scholar]
  30. HJ 633-2012, Technical Regulation on Ambient Air Quality Index (on Trial); China Environmental Science Press: Beijing, China, 2012.
  31. HJ/T193-2005, Monitoring Regulation for Ambient Air Quality; China Environmental Science Press: Beijing, China, 2005.
  32. HJ 663-2013, Technical Regulation for Ambient Air Quality Assessment (on Trial); China Environmental Science Press: Beijing, China, 2013.
  33. Hatcher, D.A. Simple formulae for Julian day numbers and calendar dates. R. Astron. Soc. 1984, 25, 53–55. [Google Scholar]
  34. Division of Climate Season QX/T 152—2012; China Meteorological Administration, Meteorological Publishing House: Beijing, China, 2012.
  35. Cheng, N.; Chen, Z.; Sun, F. Ground ozone concentrations over Beijing from 2004 to 2015: Variation patterns, indicative precursors and effects of emission-reduction. Environ. Pollut. 2018, 237, 262–274. [Google Scholar] [CrossRef]
  36. Li, J.; Lu, K.; Lv, W. Fast increasing of surface ozone concentrations in Pearl River Delta characterized by a regional air quality monitoring network during 2006–2011. J. Environ. Sci. 2014, 26, 23–36. [Google Scholar] [CrossRef]
  37. Tombrou, M.; Bossioli, E.; Kalogiros, J.; Allan, J.D.; Bacak, A.; Biskos, G.; Coe, H.; Dandou, A.; Kouvarakis, G.; Mihalopoulos, N.; et al. Physical and chemical processes of air masses in the Aegean Sea during Etesians: Aegean-GAME airborne campaign. Sci. Total Environ. 2015, 506, 201–216. [Google Scholar] [CrossRef]
  38. Lin, W.; Lin, W.; Xu, X.; Sun, J. Effects of background concentration of reactive gas and long distance transport in Jinsha atmospheric background station. SCIENTIA SINICA Terrae 2011, 41, 573–582. [Google Scholar]
  39. Fernández-Fernández, M.I.; Gallego, M.C.; García, J.A. A study of surface ozone variability over the Iberian Peninsula during the last fifty years. Atmos. Environ. 2011, 45, 1946–1959. [Google Scholar] [CrossRef]
  40. Jia, L.N. Changchun Almanac; Jilin People’s Publishing House, Changchun Local Chronicles Compilation Committee: Changchun, China, 2018; pp. 12–20. [Google Scholar]
  41. Qi, B.; Niu, Y.; Du, R. Analysis of variation characteristics of near-surface ozone concentration in Hangzhou. China Environ. Sci. 2017, 37, 443–451. [Google Scholar]
  42. Fujita, E.M.; Stockwell, W.R.; Campbell, D.E.; Chinkin, L.R.; Main, H.H.; Roberts, P.T. Weekend/Weekday Ozone Observations in the South Coast Air Basin: Retrospective Analysis of Ambient and Emissions Data and Refinement of Hypotheses. Volume I—Executive Summary. Final Report Prepared for the National Renewable Energy Laboratory, Golden, CO, USA and Coordinating Research Council, Alpharetta, GA, USA. Available online: https://www.researchgate.net/publication/242179822_WEEKENDWEEKDAY_OZONE_OBSERVATIONS_IN_THE_SOUTH_COAST_AIR_BASIN_VOLUME_I_-_EXECUTIVE_SUMMARY (accessed on 12 June 2002).
  43. Kalabokas, P.D.; Thouret, V.; Cammas, J.P.; Volz-Thomas, A.; Boulanger, D.; Repapis, C.C. The geographical distribution of meteorological parameters associated with high and low summer ozone levels in the lower troposphere and the boundary layer over the Eastern Mediterranean (Cairo case). Tellus B Chem. Phys. Meteorol. 2015, 67, 27853. [Google Scholar] [CrossRef]
  44. Camalier, L.; Cox, W.; Dolwick, P. The effects of meteorology on ozone in urban areas and their use in assessing ozone trends. Atmos. Environ. 2007, 41, 7127–7137. [Google Scholar] [CrossRef]
  45. Jacob, D.J.; Winner, D.A. Effect of climate change on air quality. Atmos. Environ. 2009, 43, 51–63. [Google Scholar] [CrossRef] [Green Version]
  46. Impact of Meteorological Factors on Ozone Pollution in Hong Kong. Available online: http://kns.cnki.net/kcms/detail/11.1895.X.20180822.1711.006.html (accessed on 22 August 2018).
  47. Characteristics of near Surface O3 Concentration in Harbin. Available online: http://kns.cnki.net/kcms/detail/11.1843.X.20180625.1540.001.html (accessed on 25 June 2018).
  48. Zhao, X.; Dong, H.; Ji, M. Analysis on the spatial-temporal distribution Characteristics of O3. J. Environ. Sci. 2018, 38, 649–660. [Google Scholar]
Figure 1. Air monitoring stations of Changchun, as well as the annual average concentration and five-year average concentration of O3 for each monitoring station in 2013–2017.
Environments 06 00046 g001
Figure 2. The spatial distribution of the monthly average O3 concentrations for five years in Changchun during 2013–2017.
Environments 06 00046 g002
Figure 3. Annual O3 daily maximum 8 h average (MDA8) concentrations and its 90th percentile variation and the number of O3 excess days in Changchun from 2013 to 2017.
Environments 06 00046 g003
Figure 4. Variation of daily, monthly, and annual average O3 concentrations in Changchun from 2013 to 2017.
Environments 06 00046 g004
Figure 5. Seasonal O3 concentration variation of Changchun in 2013–2017.
Environments 06 00046 g005
Figure 6. Average hourly stacked graph of O3 concentration for five years during 2013–2017 (Left) and for the specific year of 2015 (Right).
Environments 06 00046 g006
Figure 7. Wind speed (km/h) and direction frequency (%) chart of ozone excess days in Changchun in 2015.
Environments 06 00046 g007
Figure 8. Correlation between O3 and solar radiation (n = 1095).
Environments 06 00046 g008
Table 1. Basic information of the air monitoring stations in Changchun.
NameEnvironmental Air Quality Functional AreaMajor Source of Pollution (Area)Wind Direction
CPIIUrban and ruralUpwind
BFHIIIndustrial dischargeUpwind
IPTIIDensely populatedUpwind
LPIIDensely populatedDownwind
HZMCIIUrban and ruralUpwind
DPIIIndustrial dischargeUpwind
JYPINatural reserveSide wind
EESAIIDensely populatedDownwind
JZPIIVehicle emissionDownwind
SWZIBackgroundSide wind
Children’s Park (CP), Bus Factory Hospital (BFH), Institute of Posts and Telecommunications (IPT), Labour Park (LP), High-Tech Zone Management Committee (HZMC), Daishan Park (DP), Jingyue Park (JYP), Economic Development Zone Environment Sanitary Administration (EESA), Junzilan Park (JZP). The tenth is one clean control station named Shuaiwanzi (SWZ).
Table 2. Correlation diagrams and correlation coefficients of O3 with other six pollutants and four meteorological factors (n = 8760).
Environments 06 00046 i001

