1. Introduction
One of the main challenges in weather radar data quality is electromagnetic interference (Tristant [
1] and Saltikoff et al. [
2]). Often, weather radars operate in frequency bands close to, or shared with, other telecommunication systems. This is the case of C- and X-band weather radars managed by Arpa Piemonte, the environmental protection agency of Piemonte region, Italy. The interferences received by these radars affect the data quality, especially for polarimetric observations. In Italy, as in most European countries, operational weather radars operate at C-band, in the 5.6 GHz band, sharing the frequency band with Radio Local Area Network (RLAN) and Wireless Local Area Network (WLAN). Analyzing the data available in the regional database of electromagnetic sources, managed by Arpa Piemonte, these telecommunication systems are continuously increasing in rural areas as broadband Internet access points. The coexistence of C-band weather radar and WLAN is nowadays a primary concern in the weather radar community.
Concerning the X-band weather radar, electromagnetic interferences started a couple of years ago and are continuously increasing. The analysis of the interferences received during the month of October 2017 and January 2019 shows a day–night pattern, with interferences received from approximately 06:00 to 12:00. This typical pattern seems to be caused by human-related activity or an out-of-band emission of some transmitting towers. This last hypothesis is being verified with in-field measurement. Since the number of X-band radars deployed in Europe is constantly increasing, as well as in the United States, the coexistence of weather radars with telecommunication systems requires further investigations.
A method to preliminarily detect the likely interfering sources is implemented based on the regional database of electromagnetic sources. This paper gives a survey on the electromagnetic interferences in weather radars located in northwestern Italy. Interference removal or mitigation tools will be developed based on the features of interfering signals, but these methods are not discussed in this paper.
2. Frequency Allocation
In Europe, most weather radars are operating at C-bands, around 5.6 GHz, sharing the same frequency band with Radio Local Area Network and Wireless Local Area Network. Since the World Radiocommunication Conference in 2003 (WRC-03), the primary allocation for Wireless Access Systems WAS, including RLAN and WLAN, was set in the bands of 5.150–5.350 and 5.4750–5.725 GHz [
3]. Since then, weather radars and WAS are expected to coexist in the same frequency band, thus the latter are required to implement the Dynamic Frequency Selection (DFS) function [
4]. This algorithm should be able to detect radar signals in the WAS operating frequency. However, as reported by Saltikoff et al. [
2], several issues affect the DFS’s ability to detect radar signals: first of all weather radars performs short pulses (e.g., 0.5
s) and different Pulse Repetition Frequency (PRF), which are difficult to be detected by the DFS. Then, the radar waveform may also not be the same as the one for which the DFS is certified. All these issues may cause interferences in weather radars. According to the latest standards [
5] and regulations (e.g., Italian law n.259/2003), in Piemonte region, a WLAN transmits an Orthogonal Frequency-Division Multiplexing (OFDM) modulation with maximum power up to 100 mW for hotspots and up to 500 mW for HiperLAN access points (point to multi-point transmissions). In the 5.6 GHz band, the occupied bandwidth can be 20, 40, 80, or 160 MHz, according to the implemented standard, and the transmitted signal is slant polarized.
At higher frequency, such as 9.3 GHz (X-band), no civil communications are allowed in the same frequency band as the weather radar managed by Arpa Piemonte. In this case, it is likely that the electromagnetic interference are caused by out-of-band or spurious emissions.
3. Arpa Piemonte Weather Radars
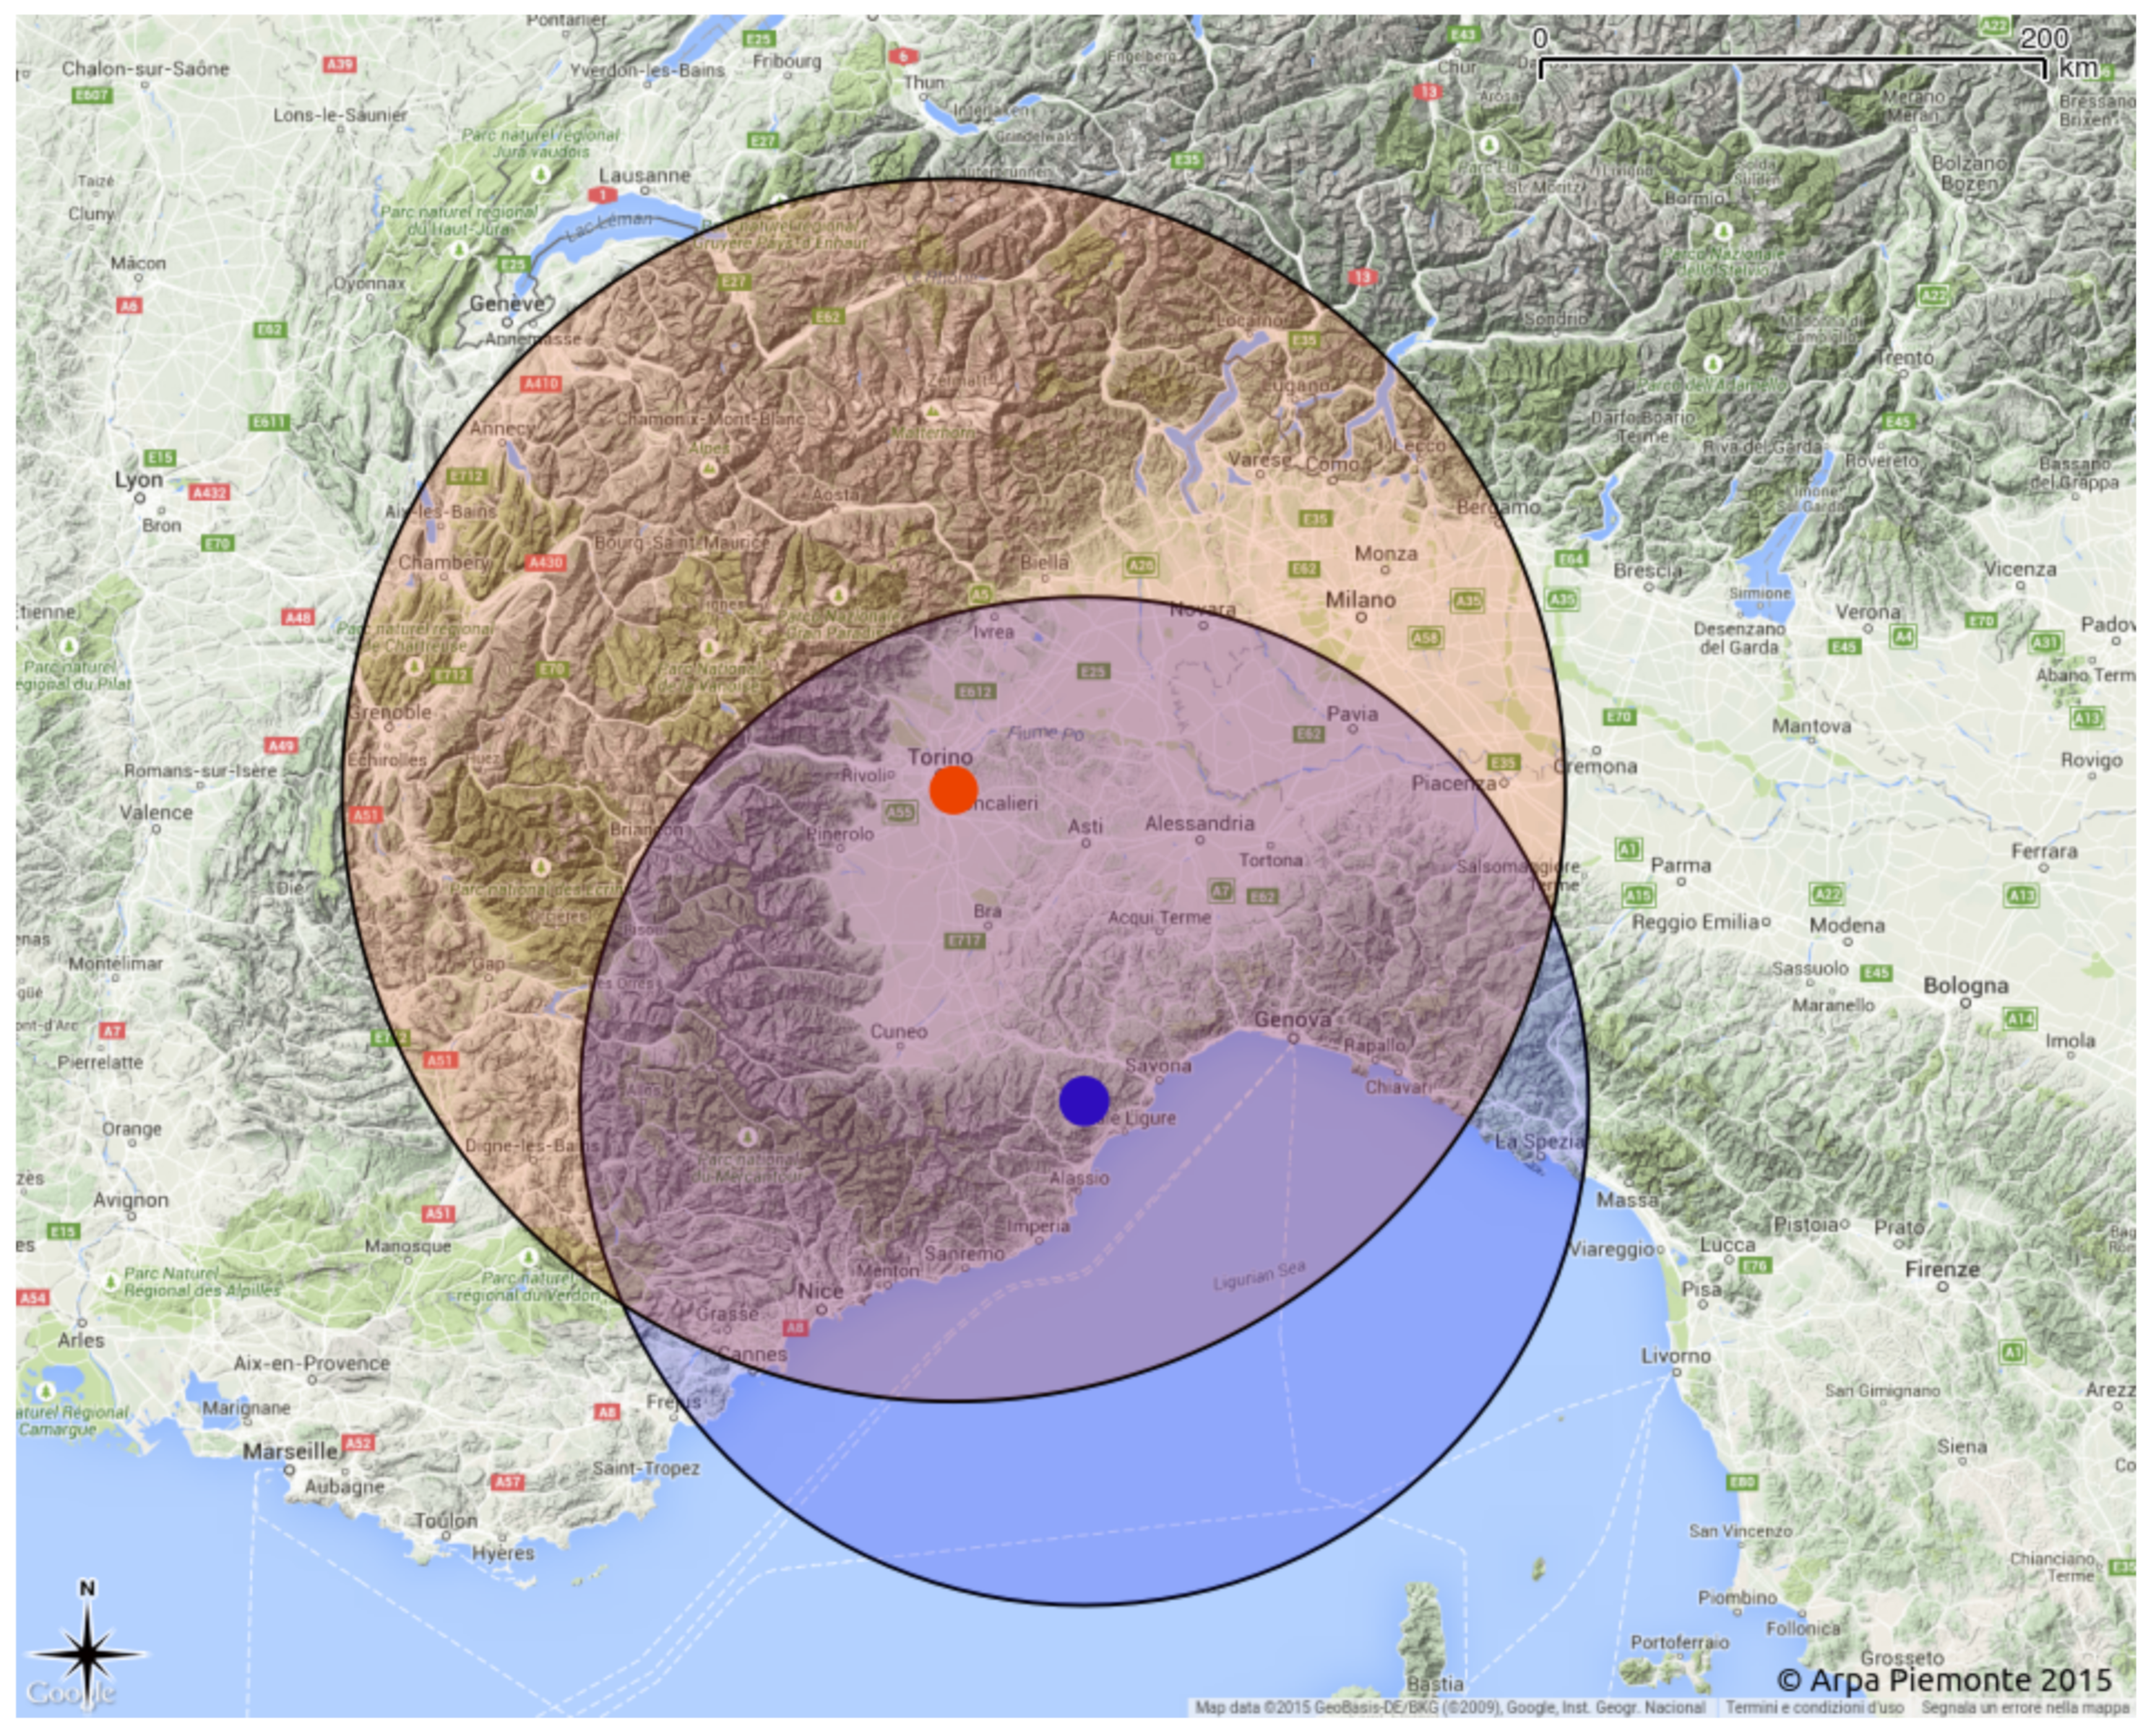
The continuous surveillance of the territory in the northwestern region of Italy is operated by the Regional Agency for environmental protection (Arpa) Piemonte, which manages two C-band weather radars and a mobile X-band radar for research purposes. The two C-band radars are located at Bric della Croce hill and at Monte Settepani mountain (
Figure 1).
Bric della Croce radar is located on the hills near Turin, at 736 m above sea level (ASL). It is placed on the top of a 33 m tower and covers the Piemonte region. There are no obstacles on the east side of the radar domain that may block the radar beam, while, on the western side of the radar domain, the visibility is limited by the Alps and, on the southern side, by the Apennines. The radar of Bric della Croce performs a volume scans every 5 min. The scan is composed of 11 elevations between and degrees. Each measurement is the result of the integration of about 50 pulses for each polarization. The range of the volume scan is 170 km and the range resolution is 340 m. The angular resolution is one degree. The pulse time width is 0.5 s (short pulse), which may not be detected by WAS DFS algorithm. Bric della Croce radar operates in dual-PRF mode to mitigate the radar dilemma, with frequencies of 882 and 588 Hz.
The second C-band weather radar is located on the top of Monte Settepani mountain at 1386 m ASL, near Savona, in the Ligurian Apennines. Monte Settepani radar has an excellent visibility in the north and east sectors, corresponding to the Po valley and the mountain areas of Piemonte. Monte Settepani radar performs a volume scan every 10 min. The volume scan is polarimetric and the acquired parameters are the same as for the Bric della Croce radar. The volumetric scan is composed by seven elevations between −0.3 and 14.9 degrees. The range is 136 km and the range resolution is 375 m, using short pulses of 0.5 s and PRF of 1090 Hz.
The specific differential phase shift
is operationally calculated for both systems using the algorithm of Wang and Chandrasekar [
6]. After
estimation, a hydrometeor classification is performed on the dual polarization observations [
7]. The output of the classification is used to select the data for the different calibration procedures. To account for the effects of attenuation and differential attenuation, the rain profiling algorithm based on Testud et al. [
8] is applied to correct the horizontal reflectivity for path attenuation, while differential attenuation is linearly estimated from the horizontal attenuation [
9].
Both C-band radars have a 4.2 m diameter antenna and the beam width is ∼1.0°. The antenna gain is 44.5 dB and the maximum sidelobe level is −28 dB. As shown in
Figure 1, radar coverage areas are mainly composed by hills and mountains, in which HiperLAN systems are expanding to provide broadband Internet access in rural areas (data available in Arpa Piemonte database of electromagnetic sources). In addition to C-band radars, Arpa Piemonte manages a X-band mobile radar. The mobile X-band weather radar is a transportable compact system that can be employed for small or medium hydrological catchments monitoring, mountain area hydrological monitoring, urban hydrology, and as gap filler of the national C-band radar network. The X-band radar operated by Arpa Piemonte is manufactured by Selex-SI. This radar transmits (and receives) simultaneously both horizontal and vertical polarized signals. It operates a volume scan and two vertical scans every 5 min. The volume scan is polarimetric and the radar reflectivity
Z, differential reflectivity
, differential propagation phase shift
, specific differential phase shift
, correlation coefficient
, and the Doppler velocity
V are acquired. Two Range Height Indicators (RHI) are produced from the vertical scan: one along the direction 162° south with elevation between 0° and 180°; the second is along 248° west with elevation between 0° and 90°. The scanning range is 80 km and the range resolution is 125 m, providing a high spatial resolution. The pulse width of the transmitted pulse is 0.5
s and the PRF is 800 Hz and 1200 Hz (dual-PRF mode). The antenna is smaller than that of the C-band and its diameter is large only 1.8 m. The beam width is 1.3°and the antenna gain is 43 dB.
3.1. EMI at C-Band
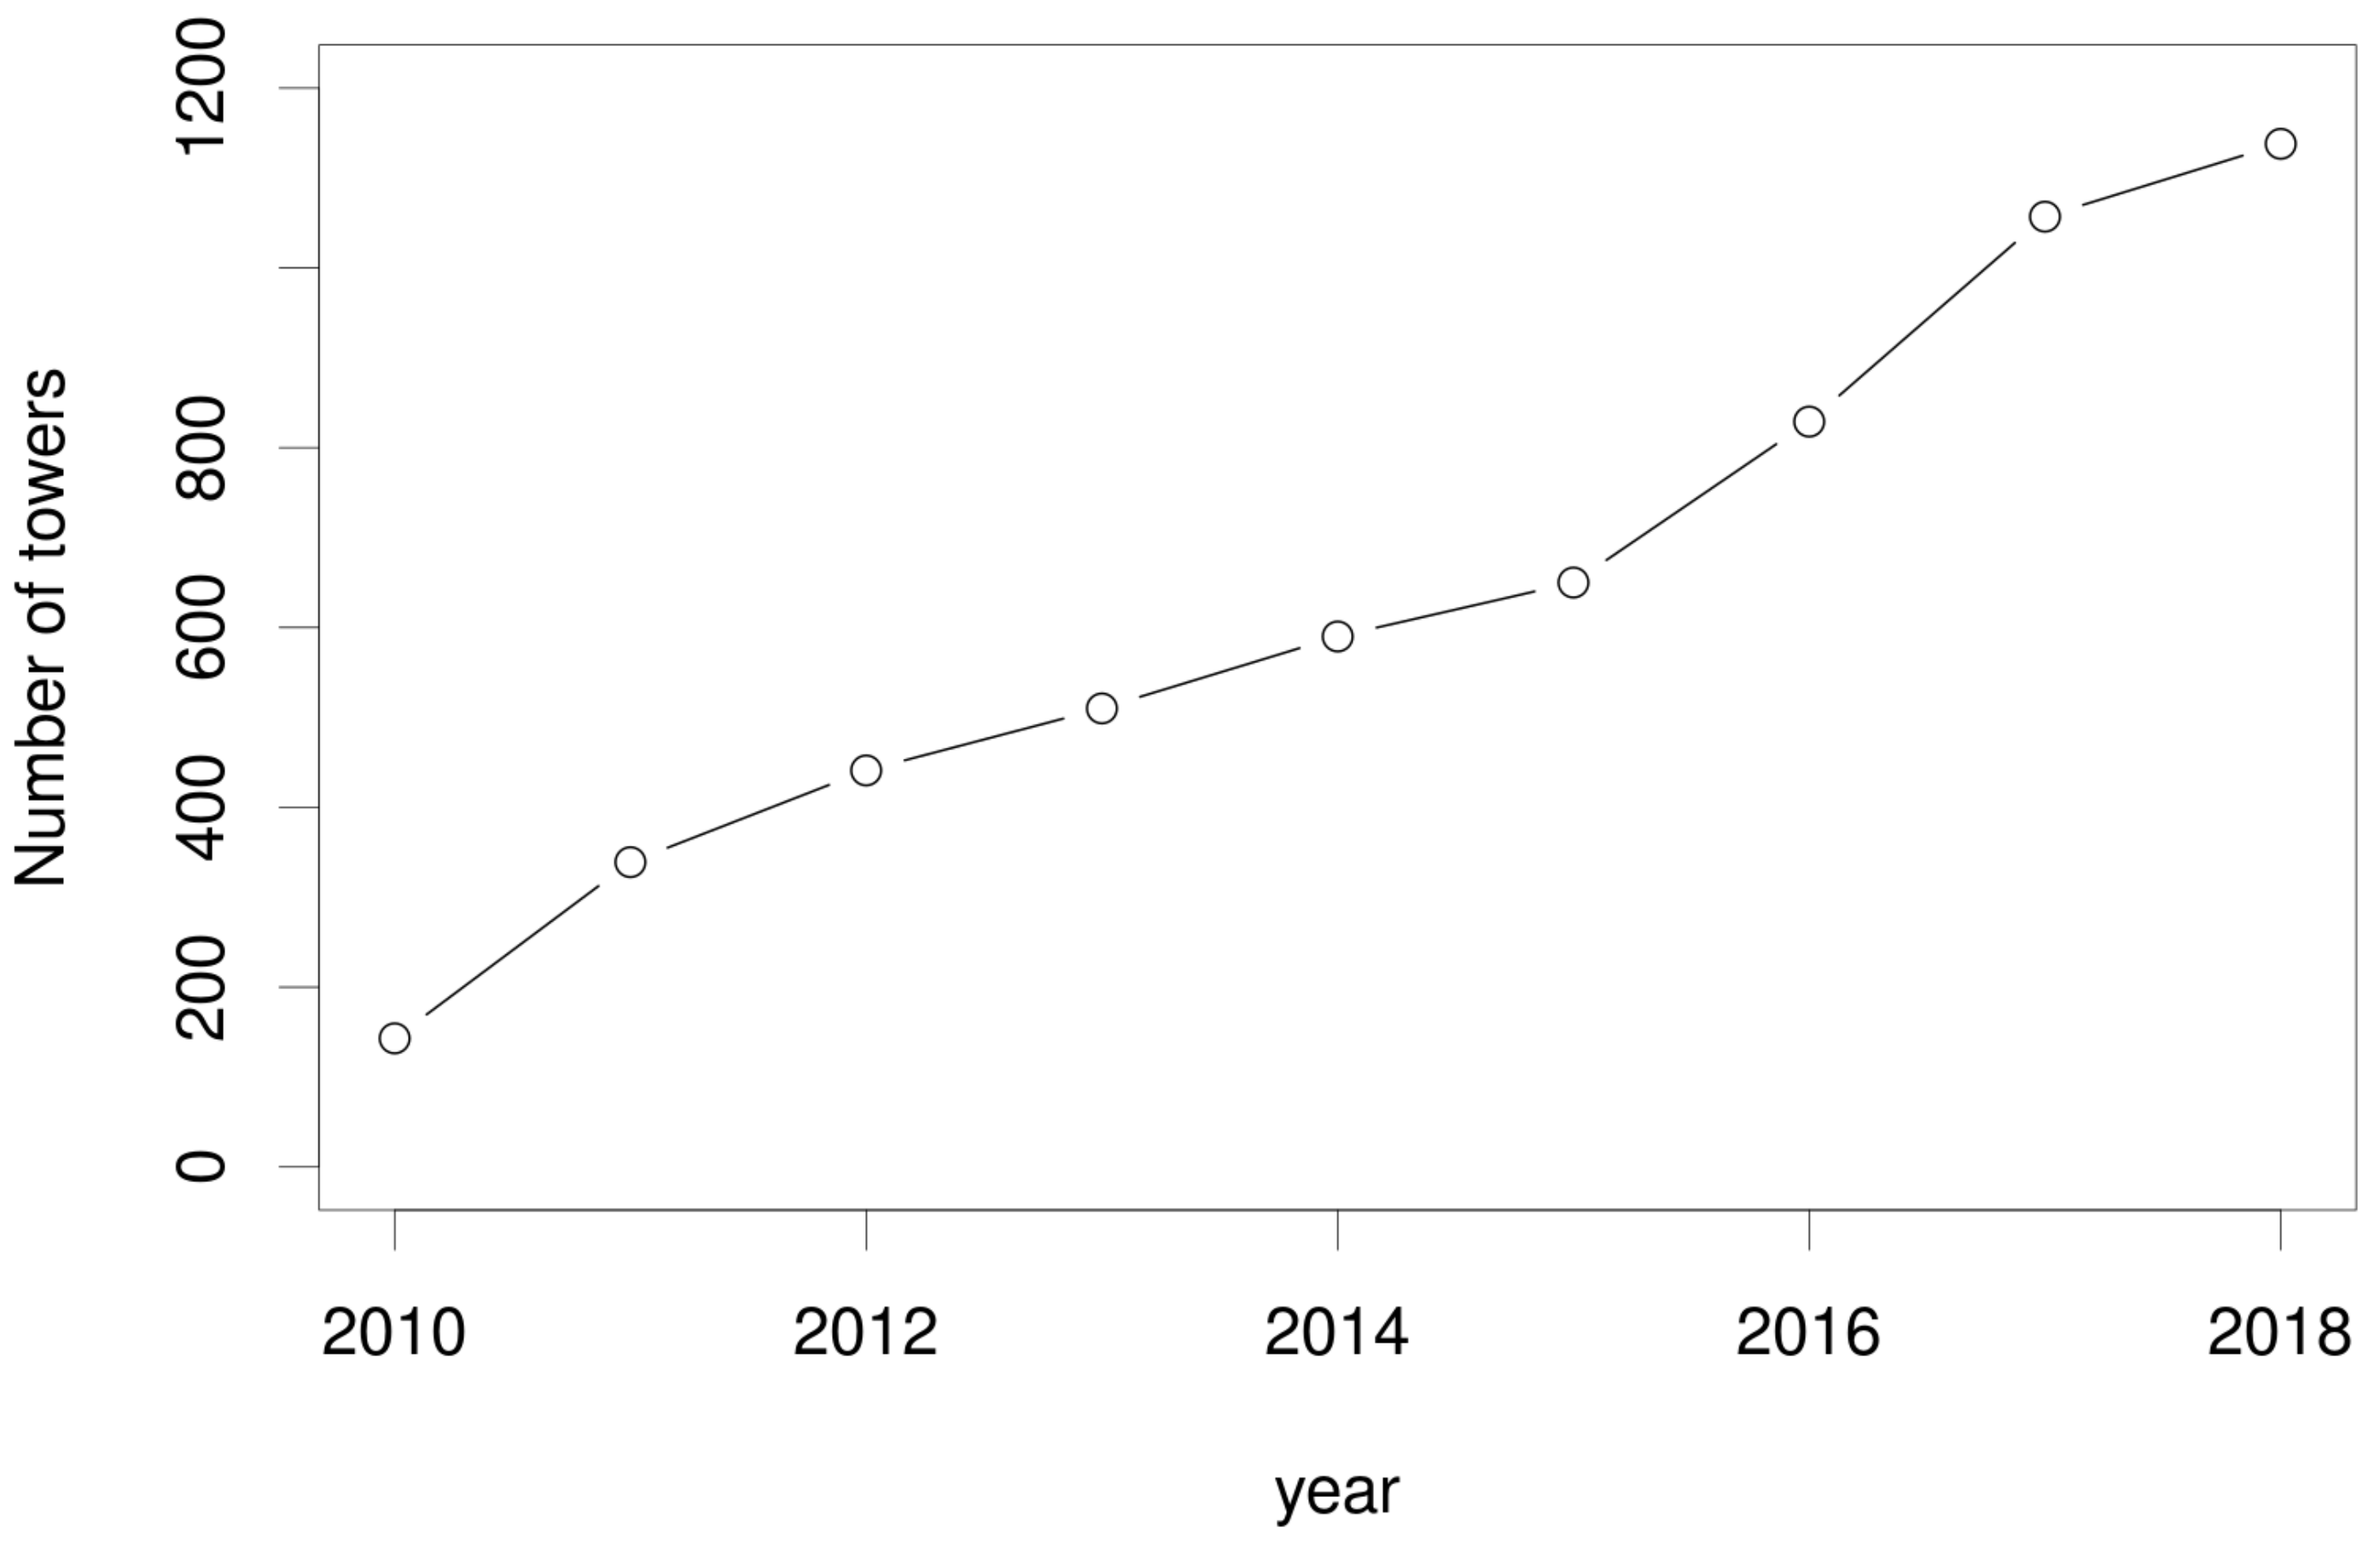
C-band weather radars share the unlicensed 5.4750–5.725 GHz frequency band with RLAN, WLAN. and HiperLAN systems, which are continuously expanding. Due to its particular orography, composed by hills and mountains, Piemonte region is experiencing a quick and continuous growth of WAS, especially HiperLAN systems. Nowadays, considering the data available in Arpa Piemonte database of electromagnetic sources, more than 1200 towers are currently transmitting in the same frequency band as C-band radars. In 2010, fewer than 200 towers were operational (
Figure 2).
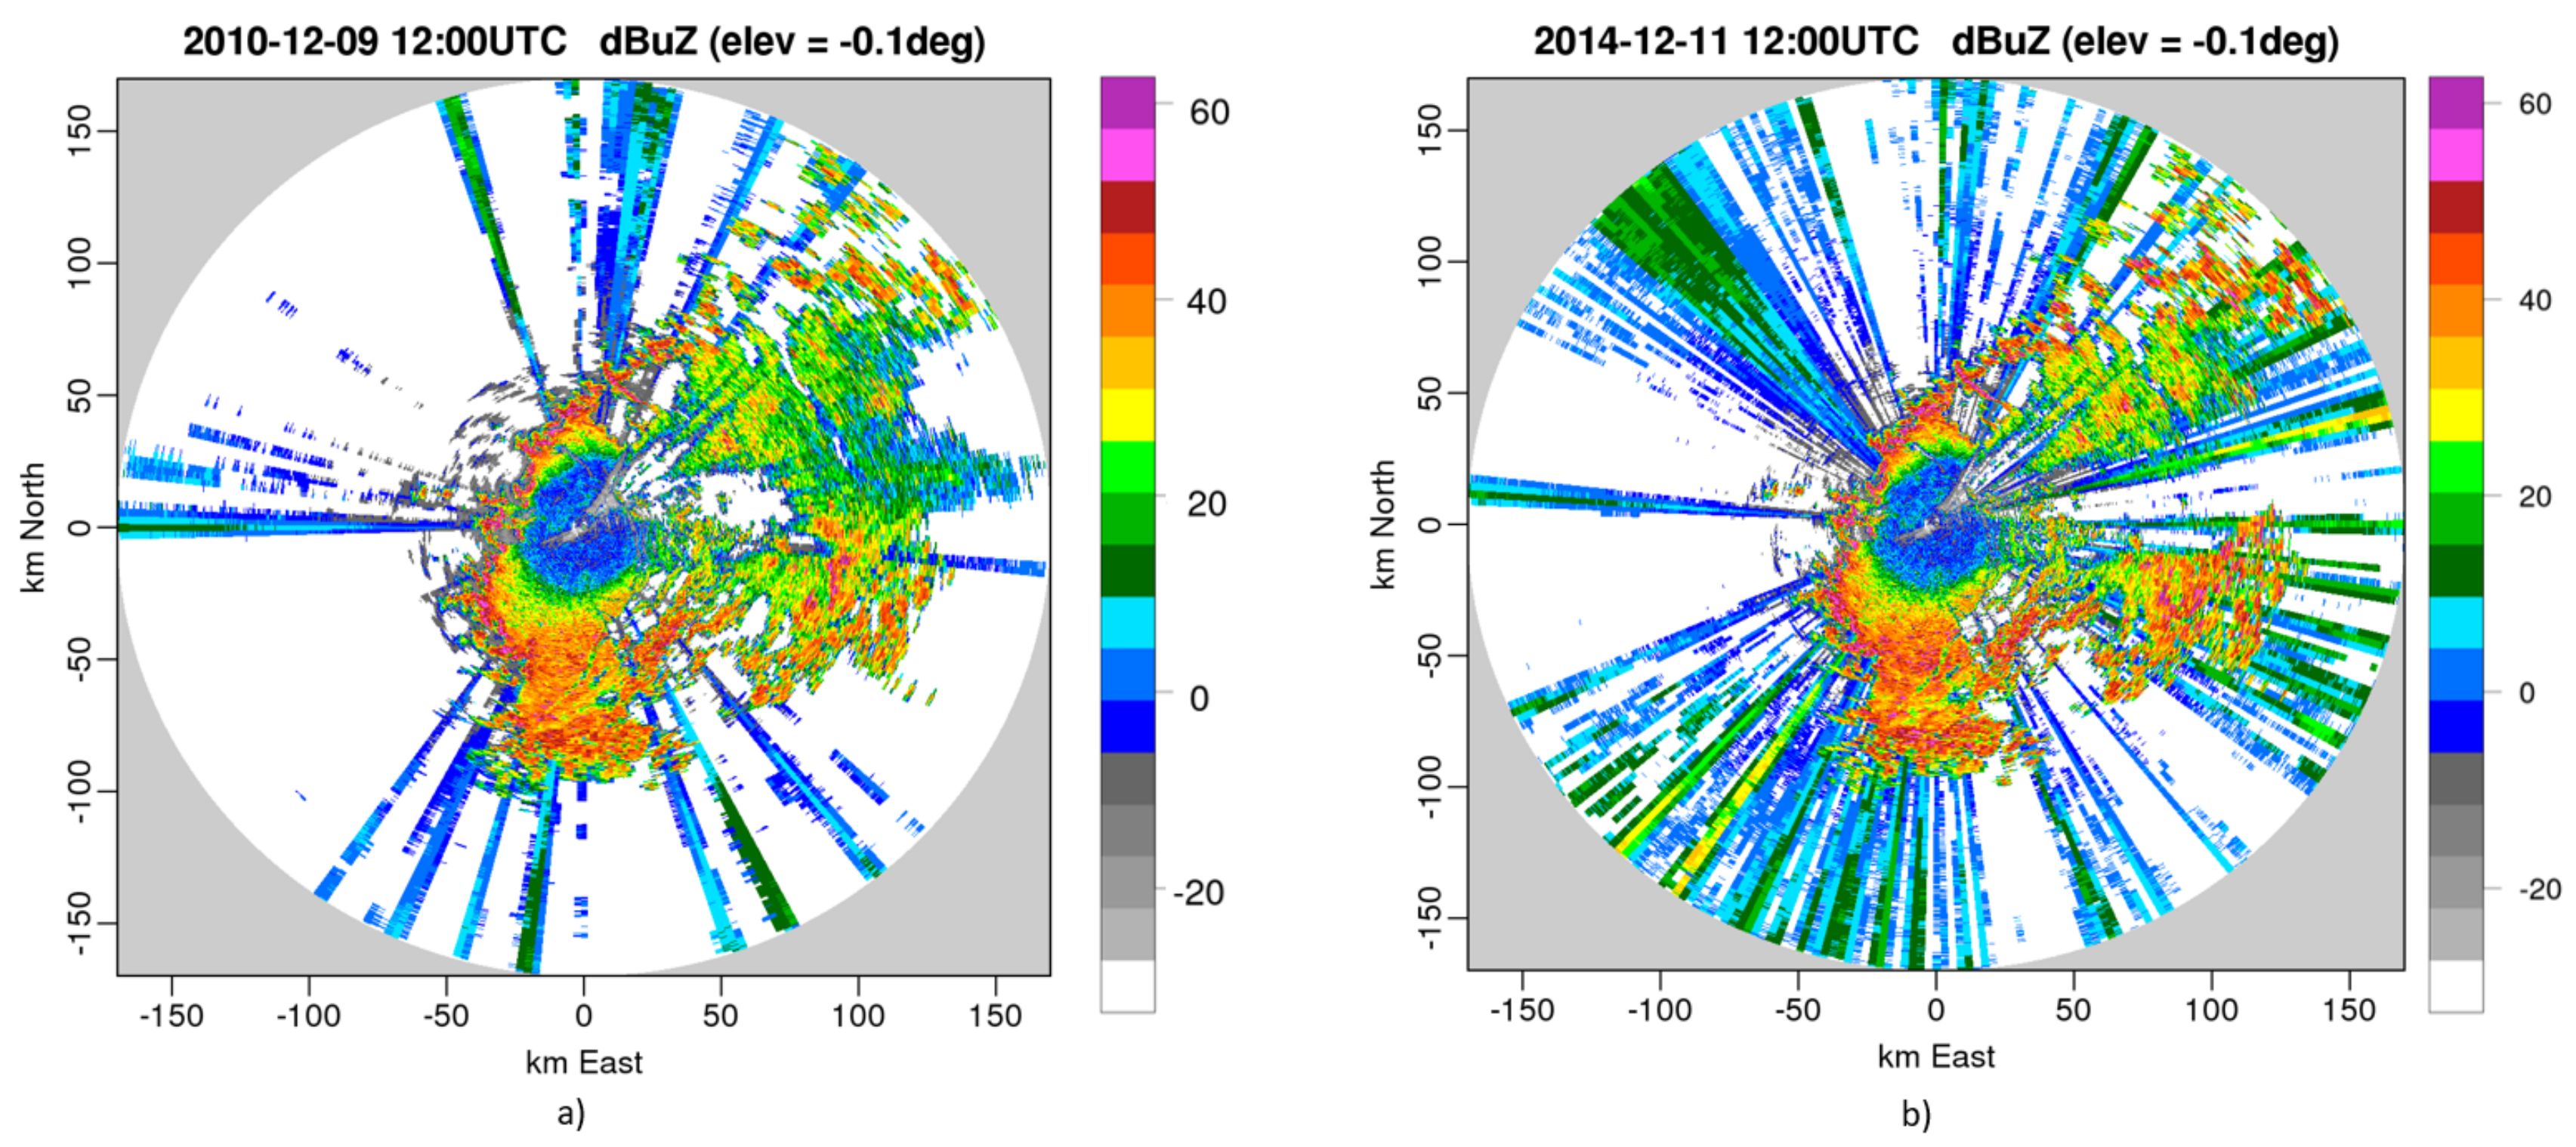
These towers, whose technical information are available in the regional database of electromagnetic sources managed by Arpa Piemonte, are mainly HiperLAN systems, which provide broadband Internet access in rural areas. In the last couple of years, a remarkable amount of wireless surveillance cameras have been deployed by municipalities. The 2010–2018 trend suggests a continuous growth of telecommunication systems operating in the 5.4750–5.725 GHz. From the radar perspective, the electromagnetic spectrum sharing with those towers produces a notable amount of radio interferences, causing a data quality loss. In
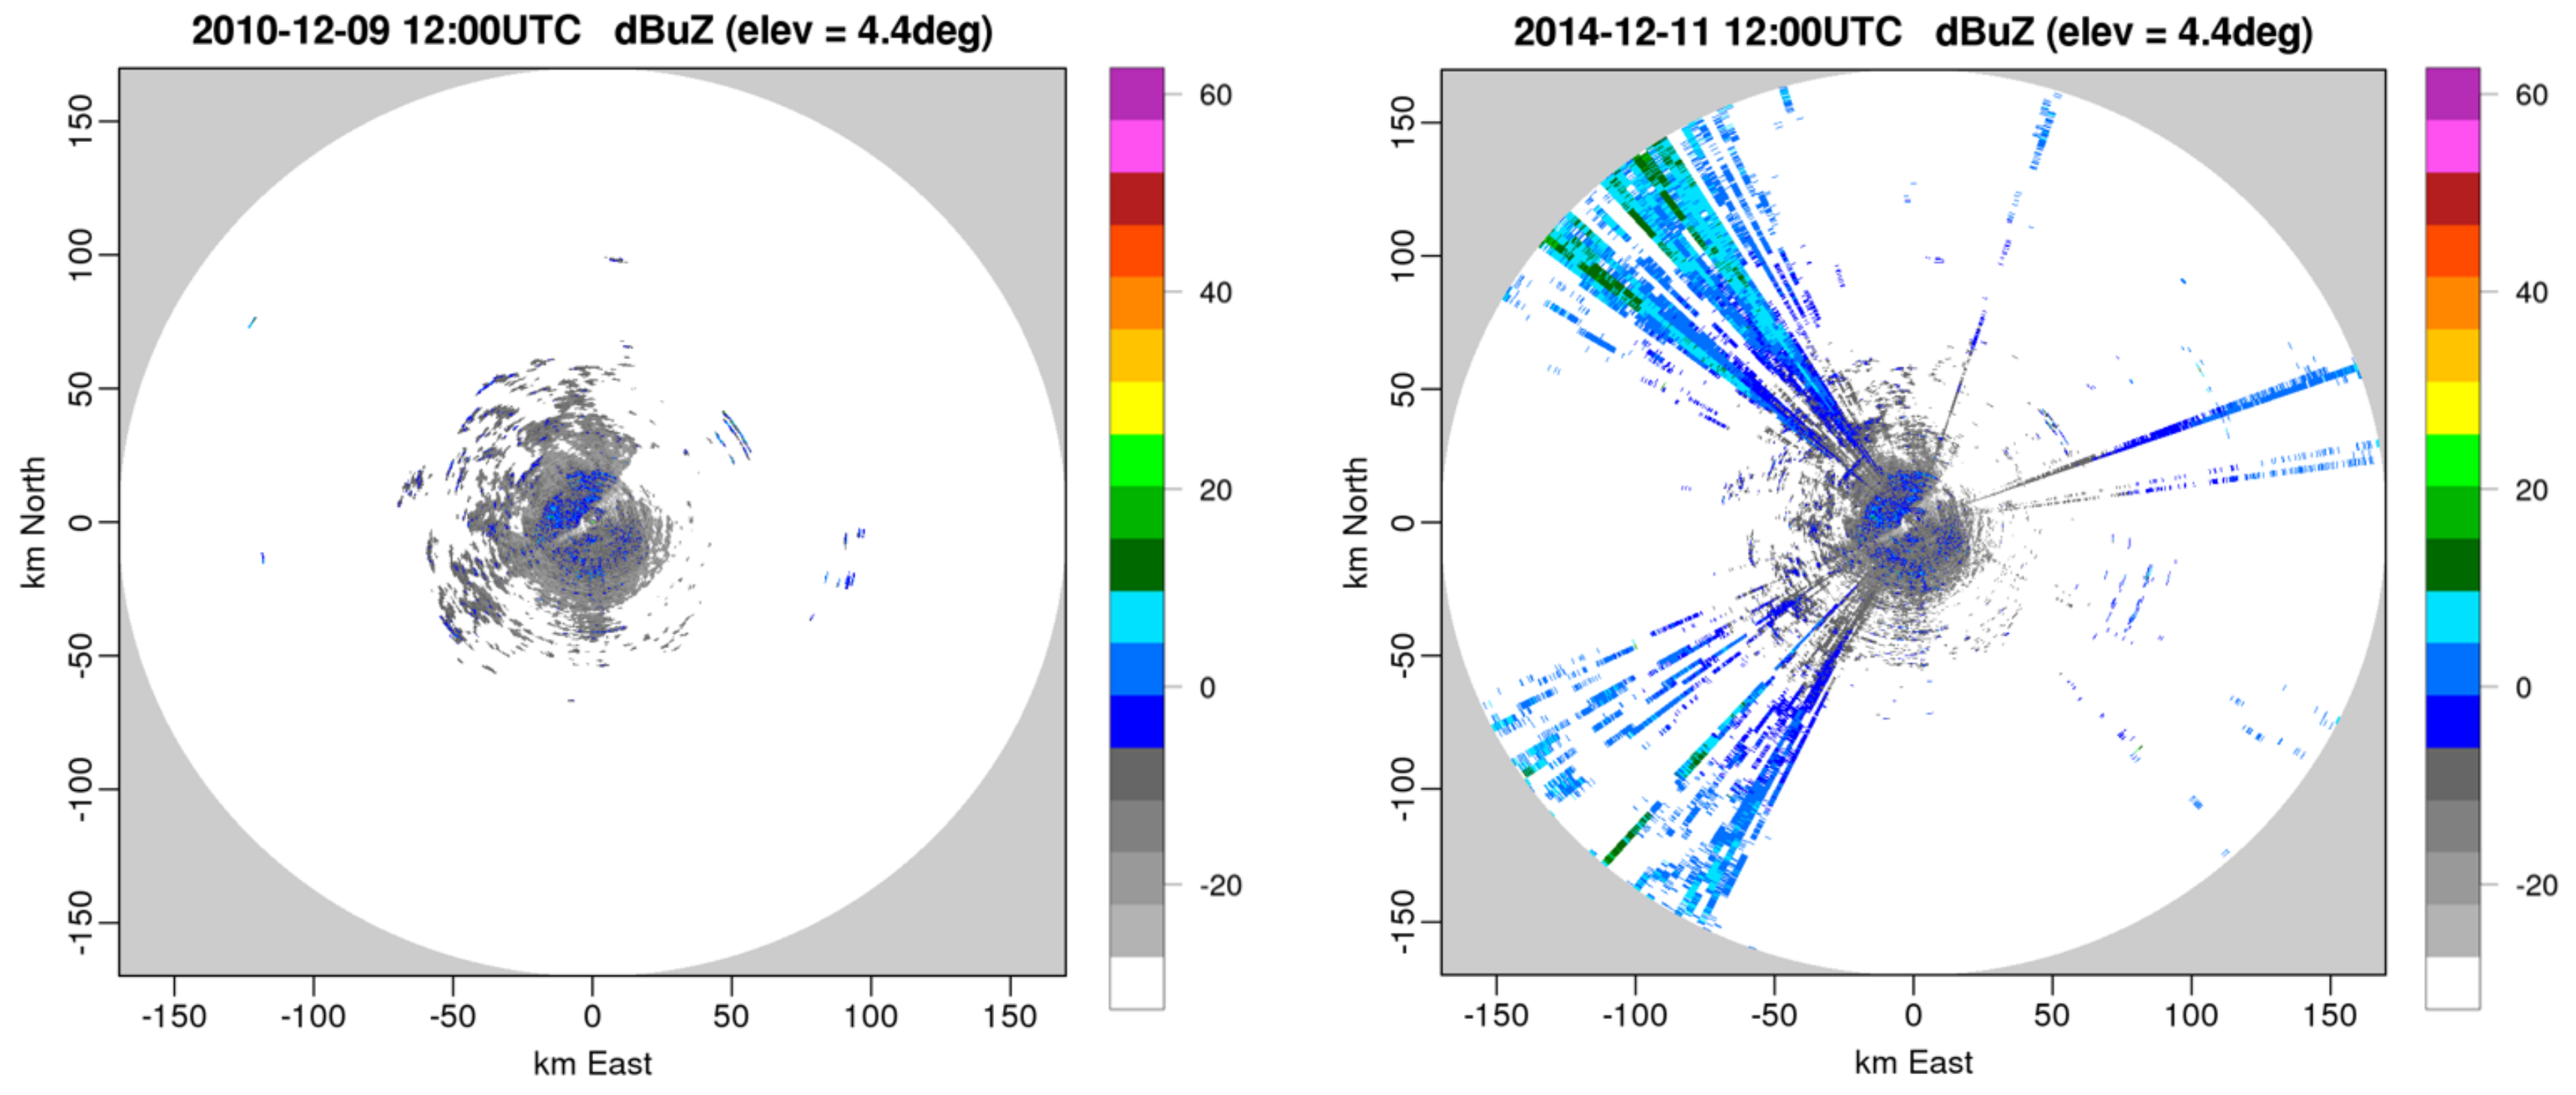
Figure 3, the same scans acquired in 2010 and 2014 at the lowest elevation angle are shown. Few interferences were received in 2010, while four years later only west sector was not affected by electromagnetic interferences. Considering the 4.4
elevation scan (
Figure 4), in 2010, no interferences were received, while, in 2014, the southwest and northwest sectors were affected by electromagnetic interferences.
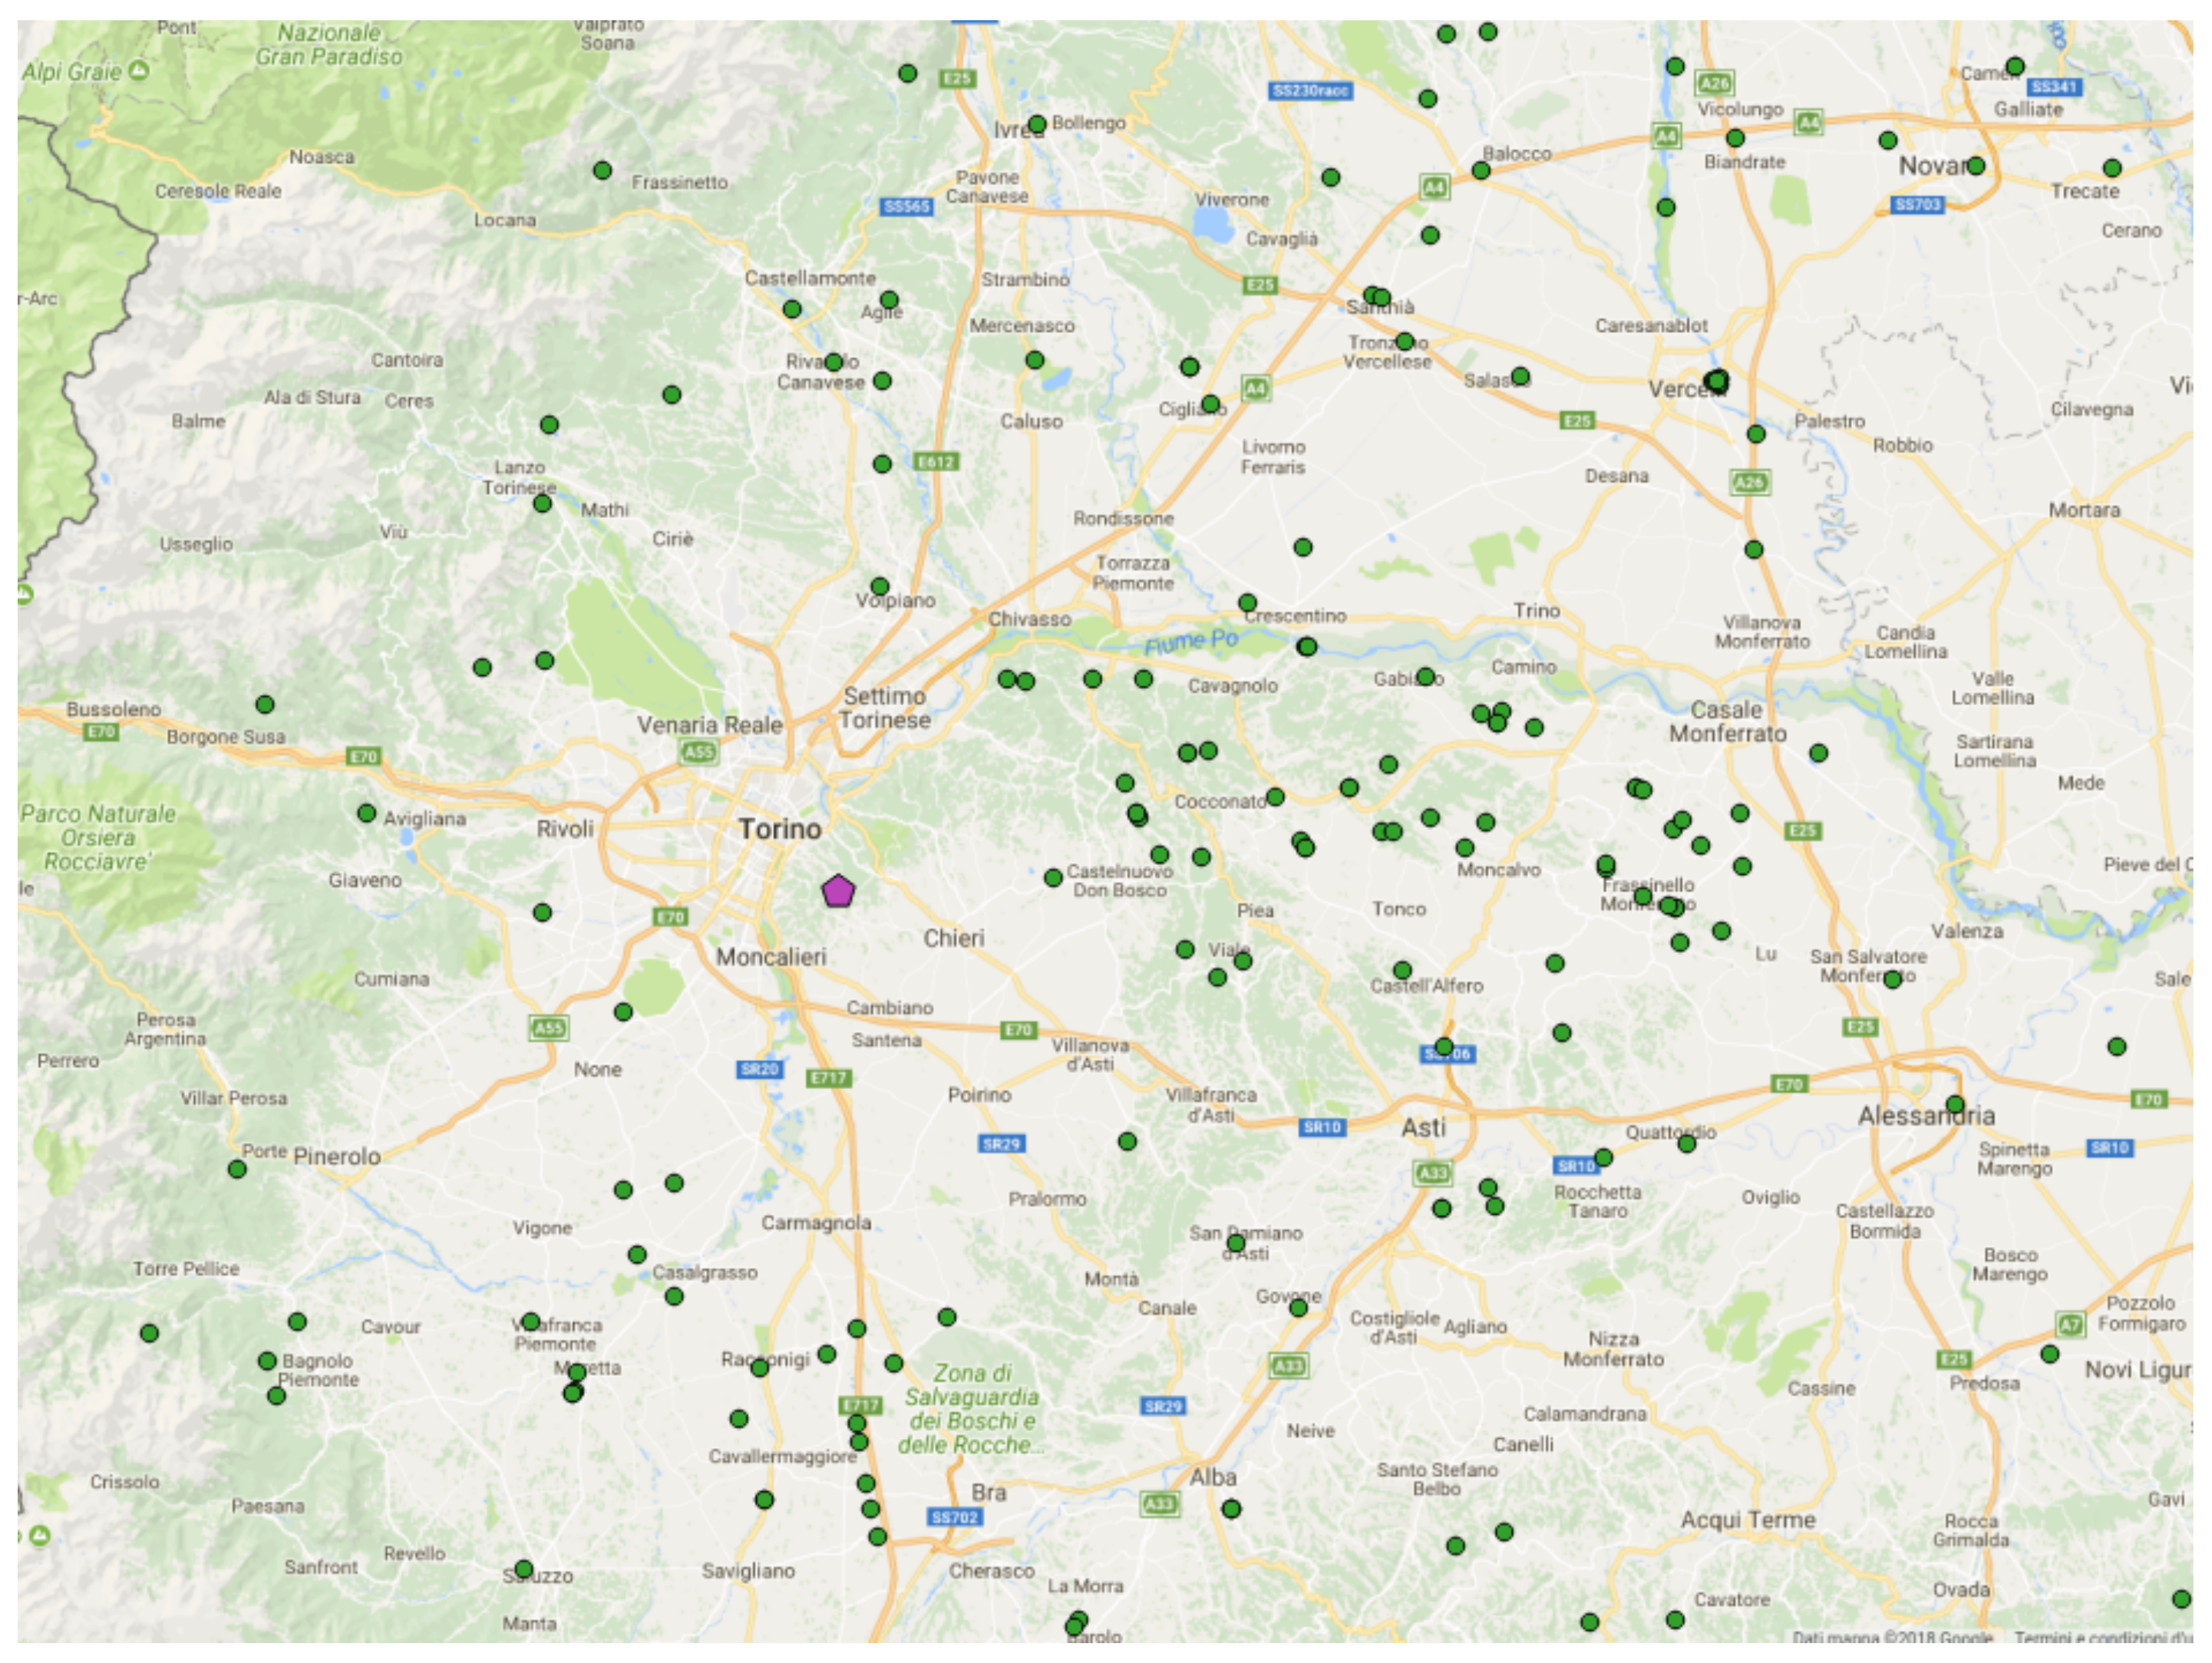
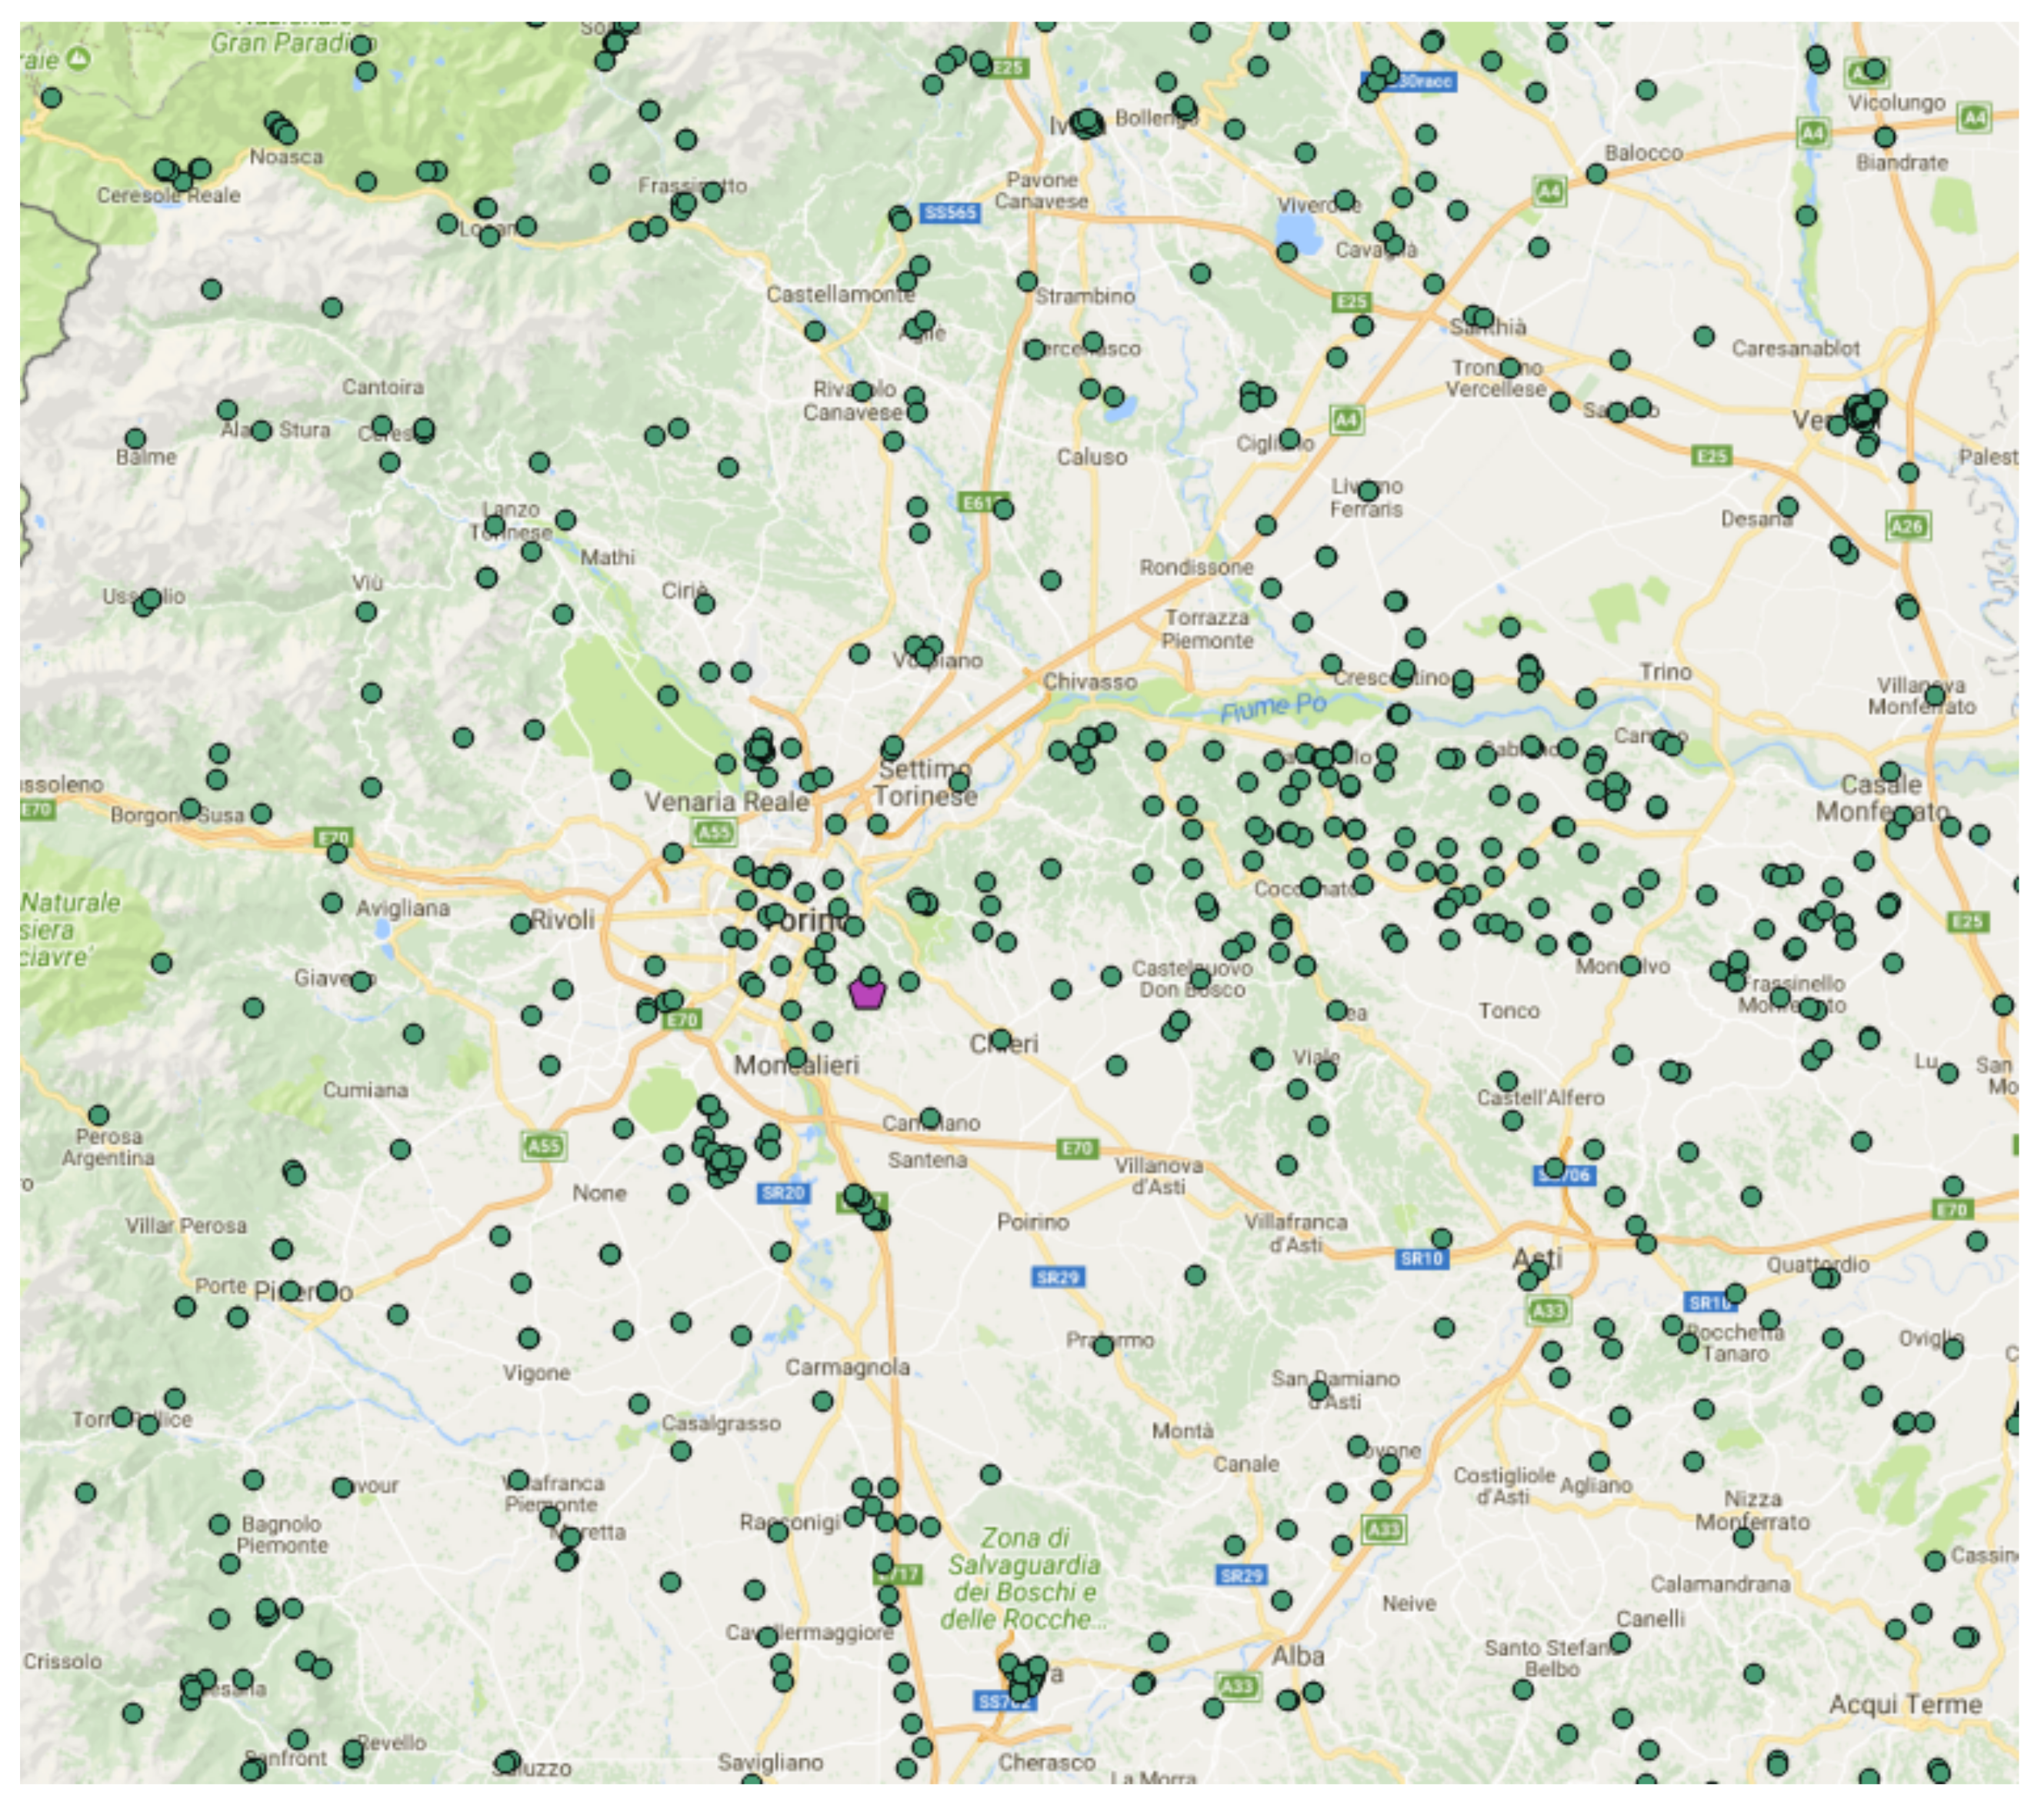
The spatial location of the towers transmitting in the 5.4750–5.725 GHz frequency band is displayed in
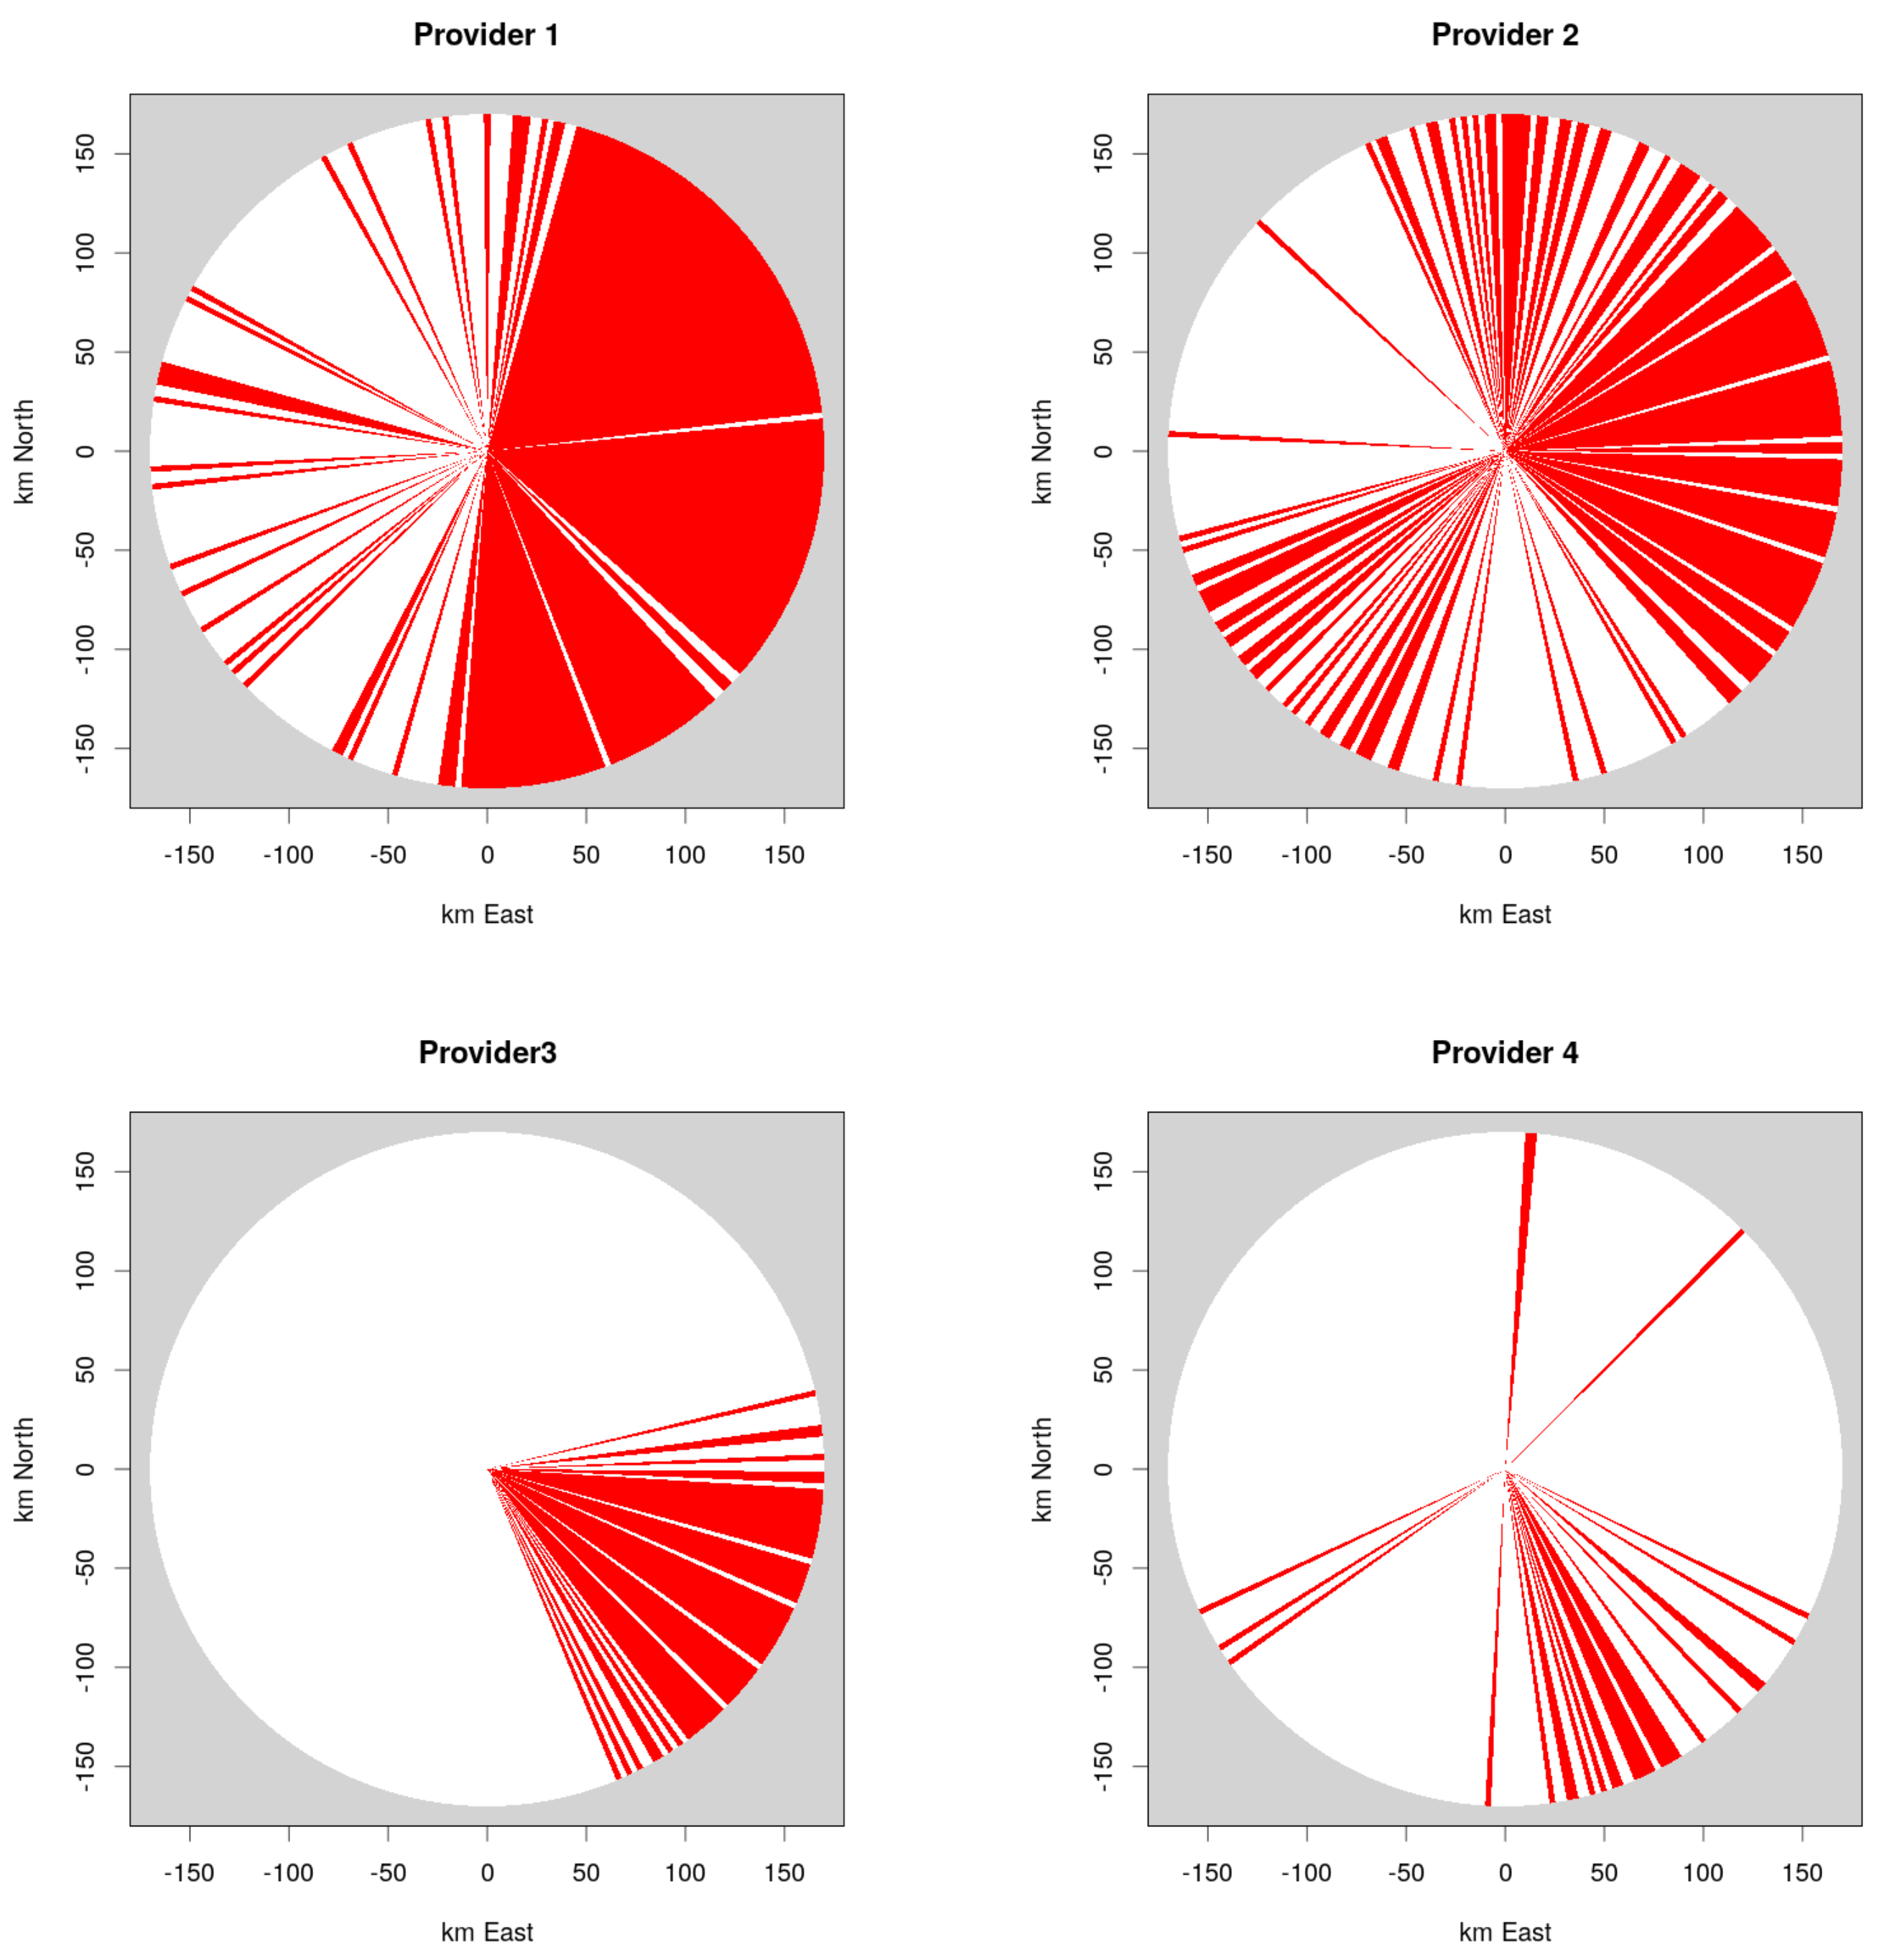
Figure 5. The density of sources transmitting in the C-band around the radar site is remarkable, and, as a consequence, some radar sectors are potentially affected by electromagnetic interferences. In fact, as reported in
Figure 6, for four main HiperLAN Internet providers, the east and south sectors of Bric della Croce radar may be completely affected by interferences due to the high density of towers and the good radar visibility in that area. However, some towers may not be in visibility from the radar site or the radar beam may not intercept some towers due to the operational scan strategy. Therefore, Arpa Piemonte and Colorado State University have implemented a model to preliminarily discriminate which towers may cause interferences. The model can be useful to preliminary understand (e.g., during the authorization processes carried out at local or regional level to install a given base station) if a tower, transmitting at the radar frequency band, may or not interfere with a given radar. The model was performed on the electromagnetic source database and the likely interfering towers were selected according to the following criteria:
tower operating frequency in the 5.4750–5.725 GHz band;
radar center beam intercepts tower location with 5 horizontal tolerance and 2 vertical tolerance;
visibility between radar and tower using high resolution digital elevation model; and
tower coverage antenna points to the radar with 5 tolerance.
These thresholds were selected according to the radar beam geometrical features. In
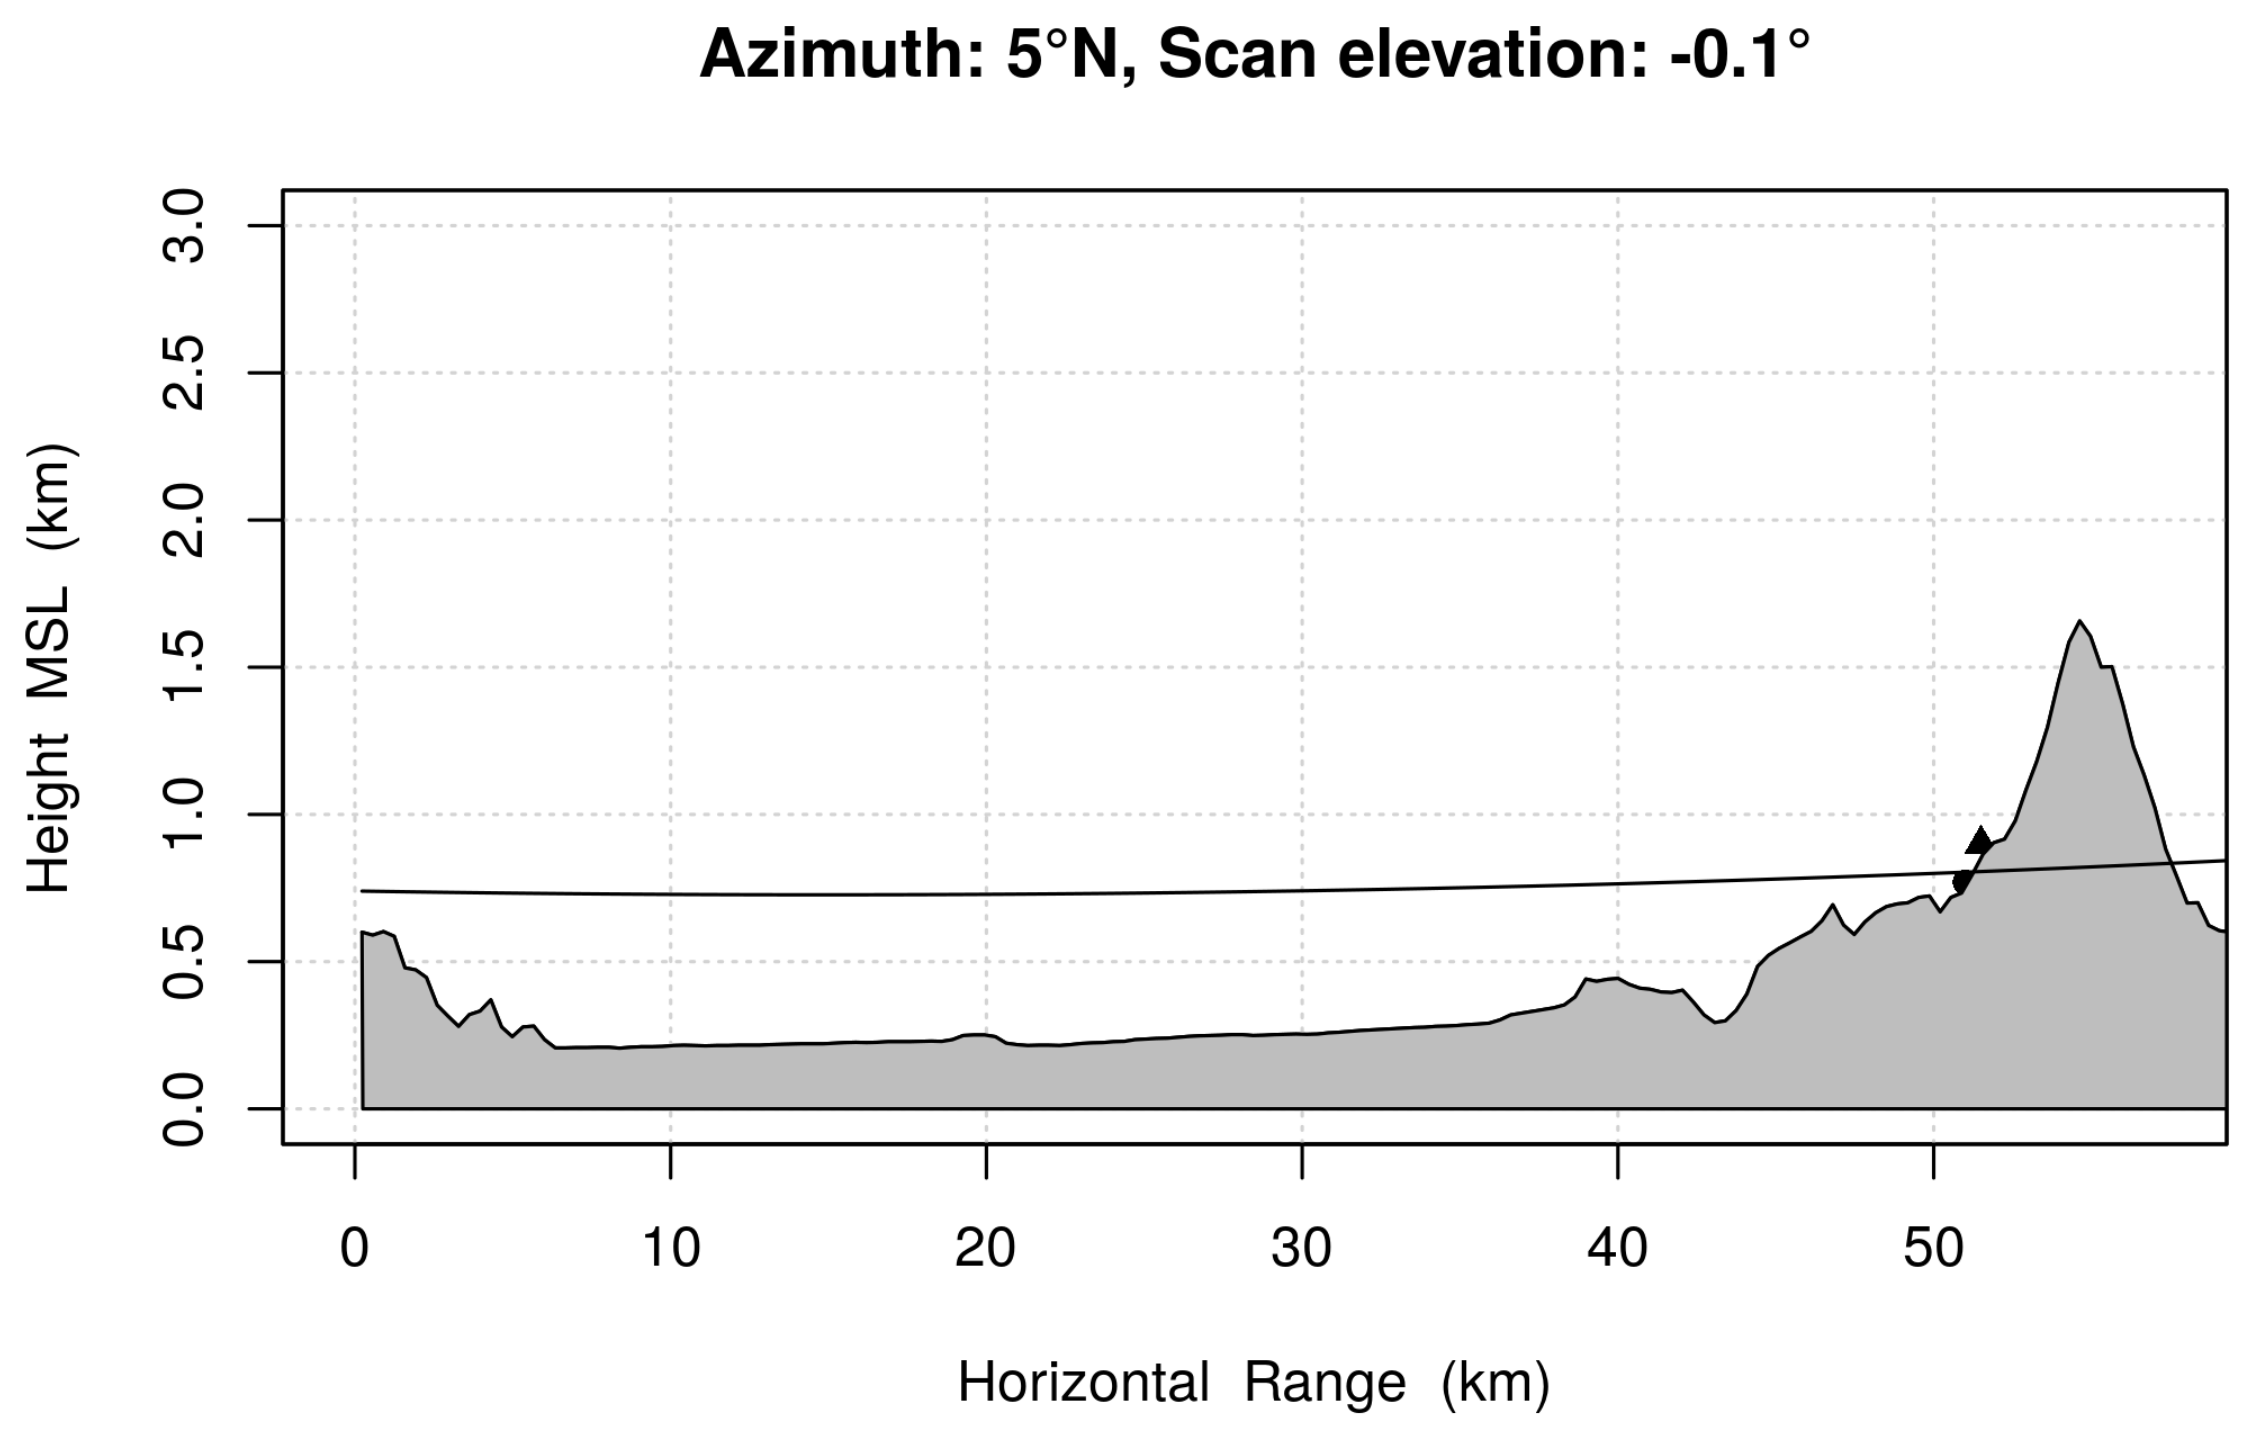
Figure 7, the towers selected by the interference model are displayed. There are about 250 likely interfering towers, available in the electromagnetic sources database, in Piemonte region. The model was validated on the data retrieved during an in-field measurement campaign. In 2015, Arpa Piemonte, in collaboration with the Italian Ministry of Economical Development, made SSIDs measurements at the Bric della Croce radar to identify the interfering sources. One of the towers, which was identified by the information reported in the SSID, is located 50 km north from Bric della Croce radar. As displayed in
Figure 8, the radar beam at the elevation scan of −0.1
intercepts the tower site, without orography blocking. Since the tower antenna is pointing to the radar, this radial direction is affected by interference.
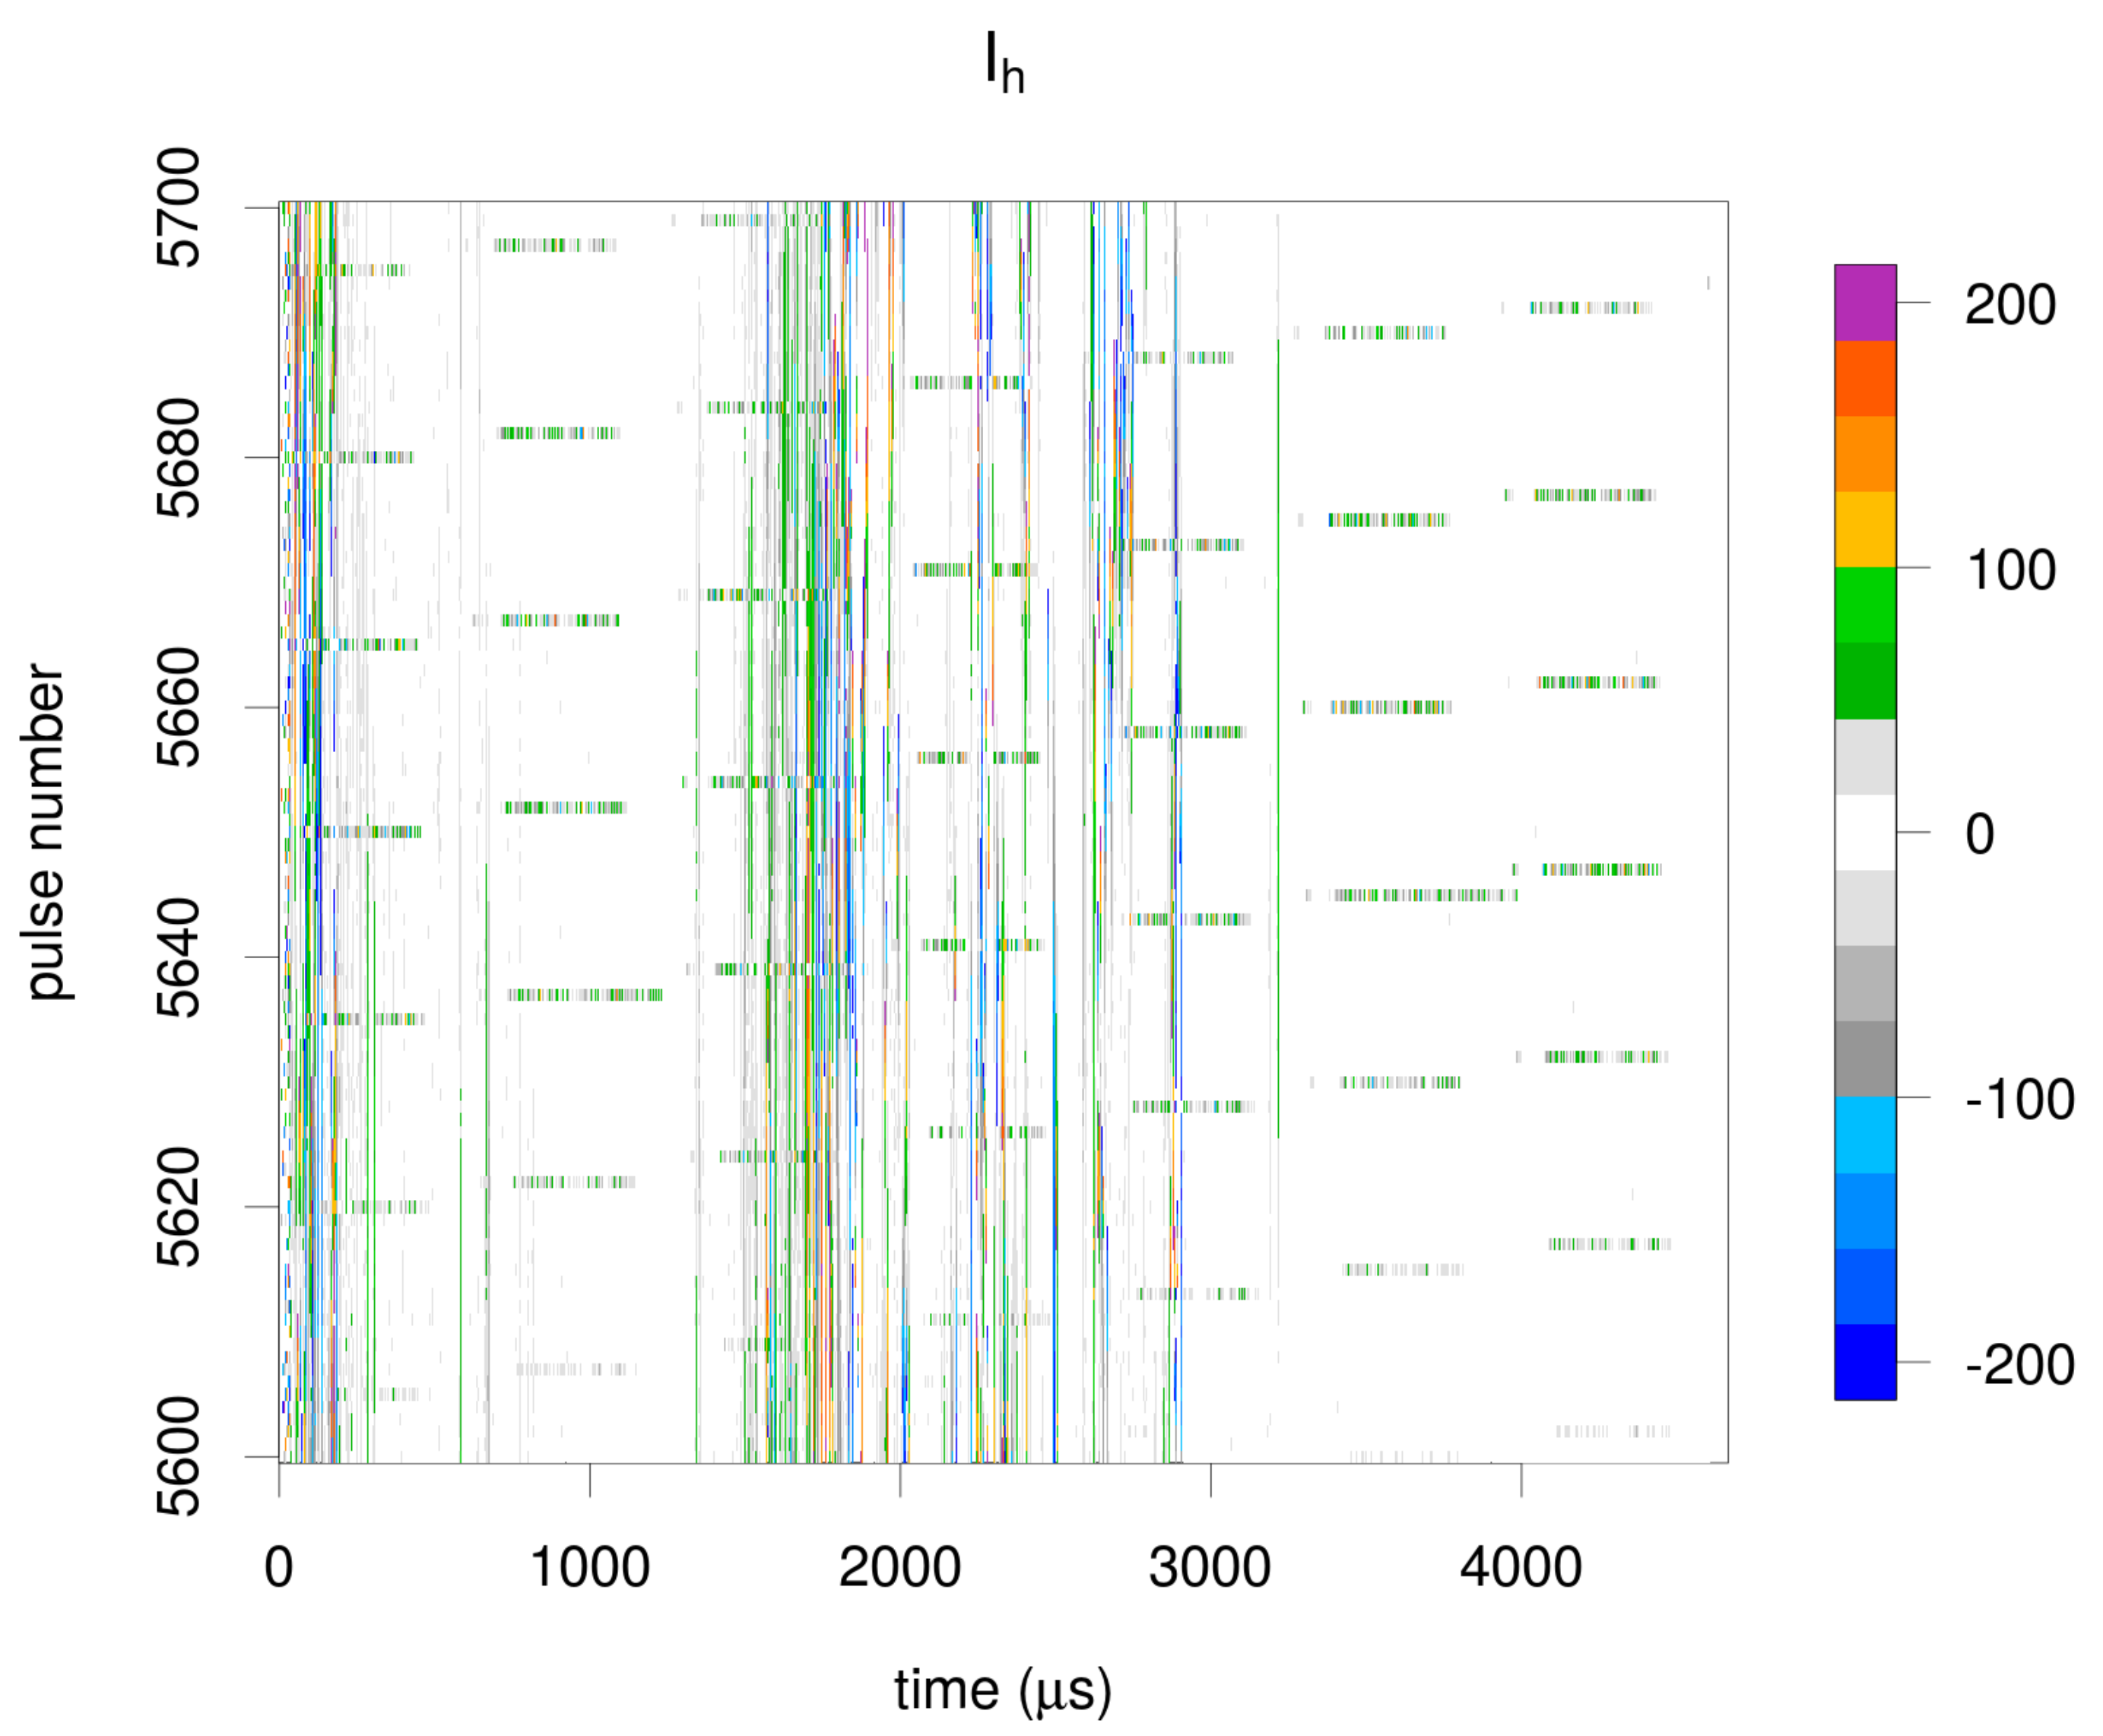
A further investigation was performed acquiring time series of interfering signals.
Figure 9 shows a pulsed interfering signal received by the radar in a portion of the east sector. The signal duration is 5.8
s and it repeats every 1.2
s. The received signal is slant polarized, which is common for telecommunication antennas since it increases performances in dense wireless environments. The interfering signals are currently being recorded in order to perform a signal analysis on an extensive dataset of interferences.
3.2. X-Band
In addition to C-band radars, Arpa Piemonte manages a X-band mobile radar, currently located near Vercelli, 50 km northeast of Turin. The radar operational frequency is 9.365 GHz, licensed by the Italian Ministry of Economical Development. At X-band, no other communications are allowed. This radar started to receive electromagnetic interferences, with an increasing trend, in 2014.
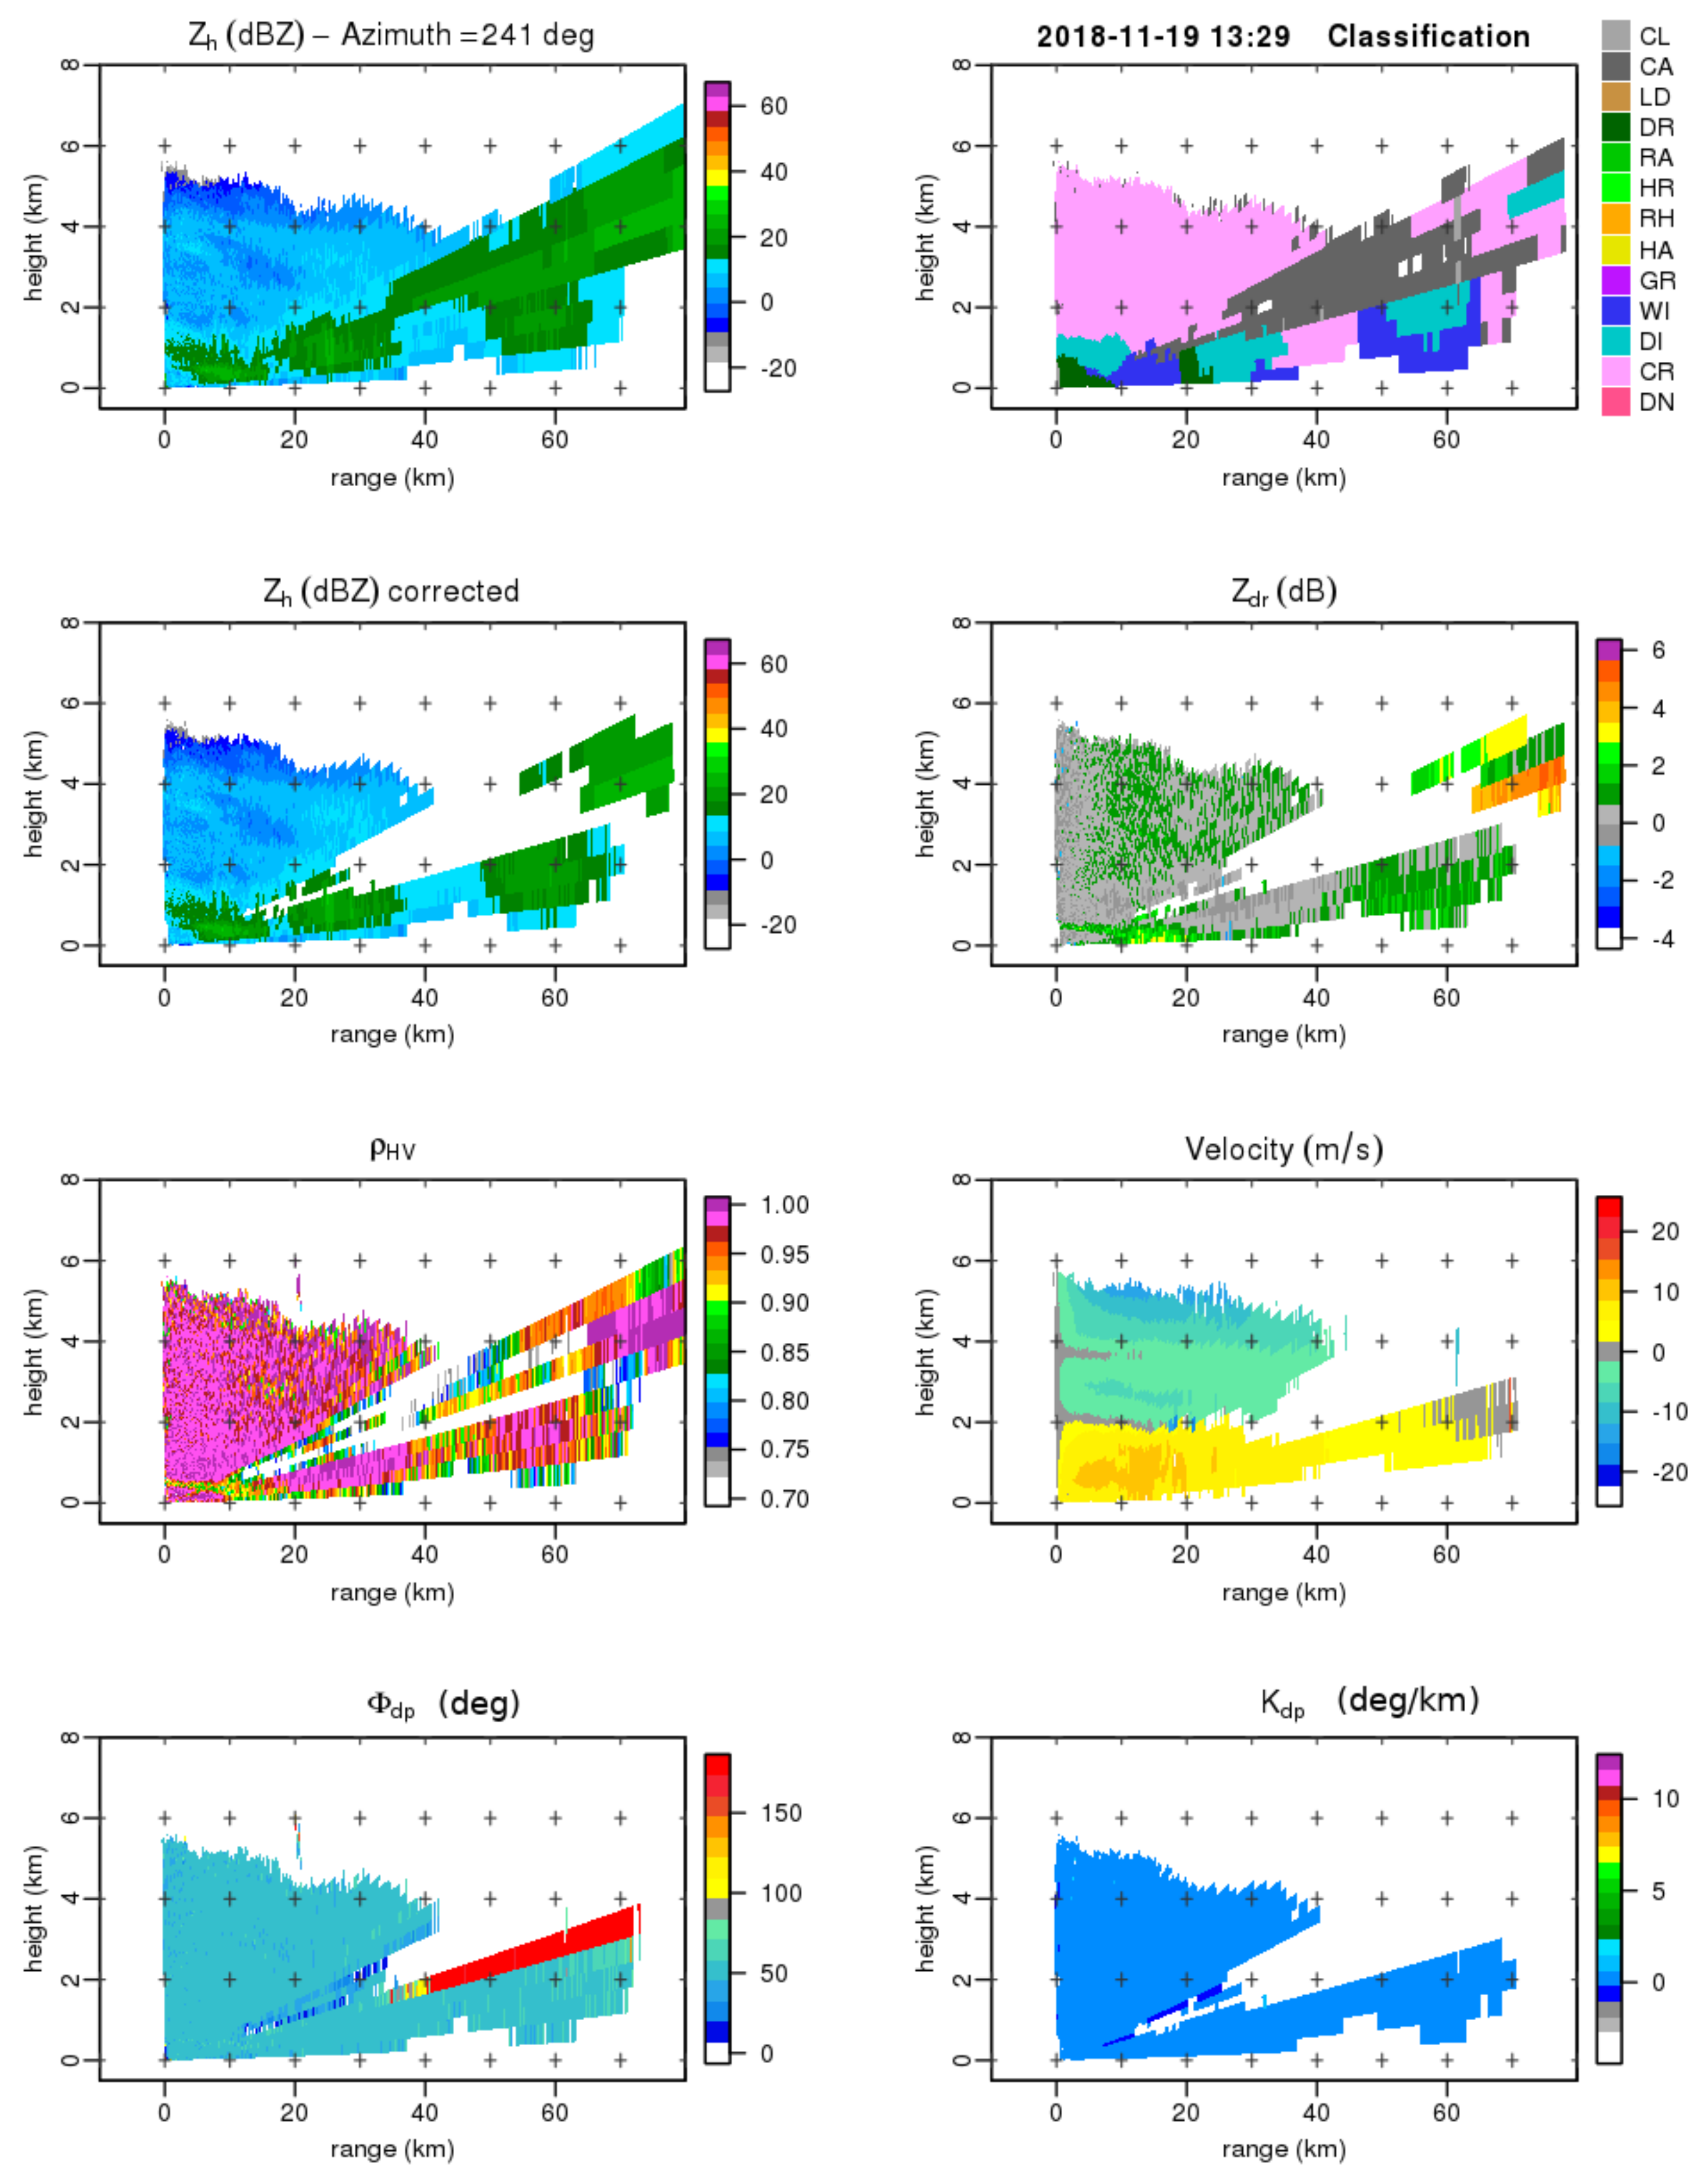
Electromagnetic interference may deeply impact dual-polarization radar retrievals. In
Figure 10, the RHI acquired on 19 November 2018 at 13:29 UTC is shown. An electromagnetic interference is received for several elevation angles, overlapping with meteorological echoes: in
Figure 10 (top left), the uncorrected radar reflectivity shows weak weather echoes and radar interference, visible as rays with increasing reflectivity along the ray, due to the radar range correction. The hydrometeor classification based on Bechini and Chandrasekar [
7] partially identifies the nature of the received echoes. The interference was recognized as clutter and those data were removed and not considered for quantitative estimations and post-processing analysis. Nevertheless, the meteorological information was removed too, causing the underestimation of the weather event, in this case drizzle and wet ice on the ground. In
Figure 10 (bottom left), the differential propagation phase shift
of the received echoes is shown. We can note that ray
exceeds 150°, pointing out the RFI contamination, which is also remarkable in some rays between 10 and 30 km from the radar. Similarly, as reported in
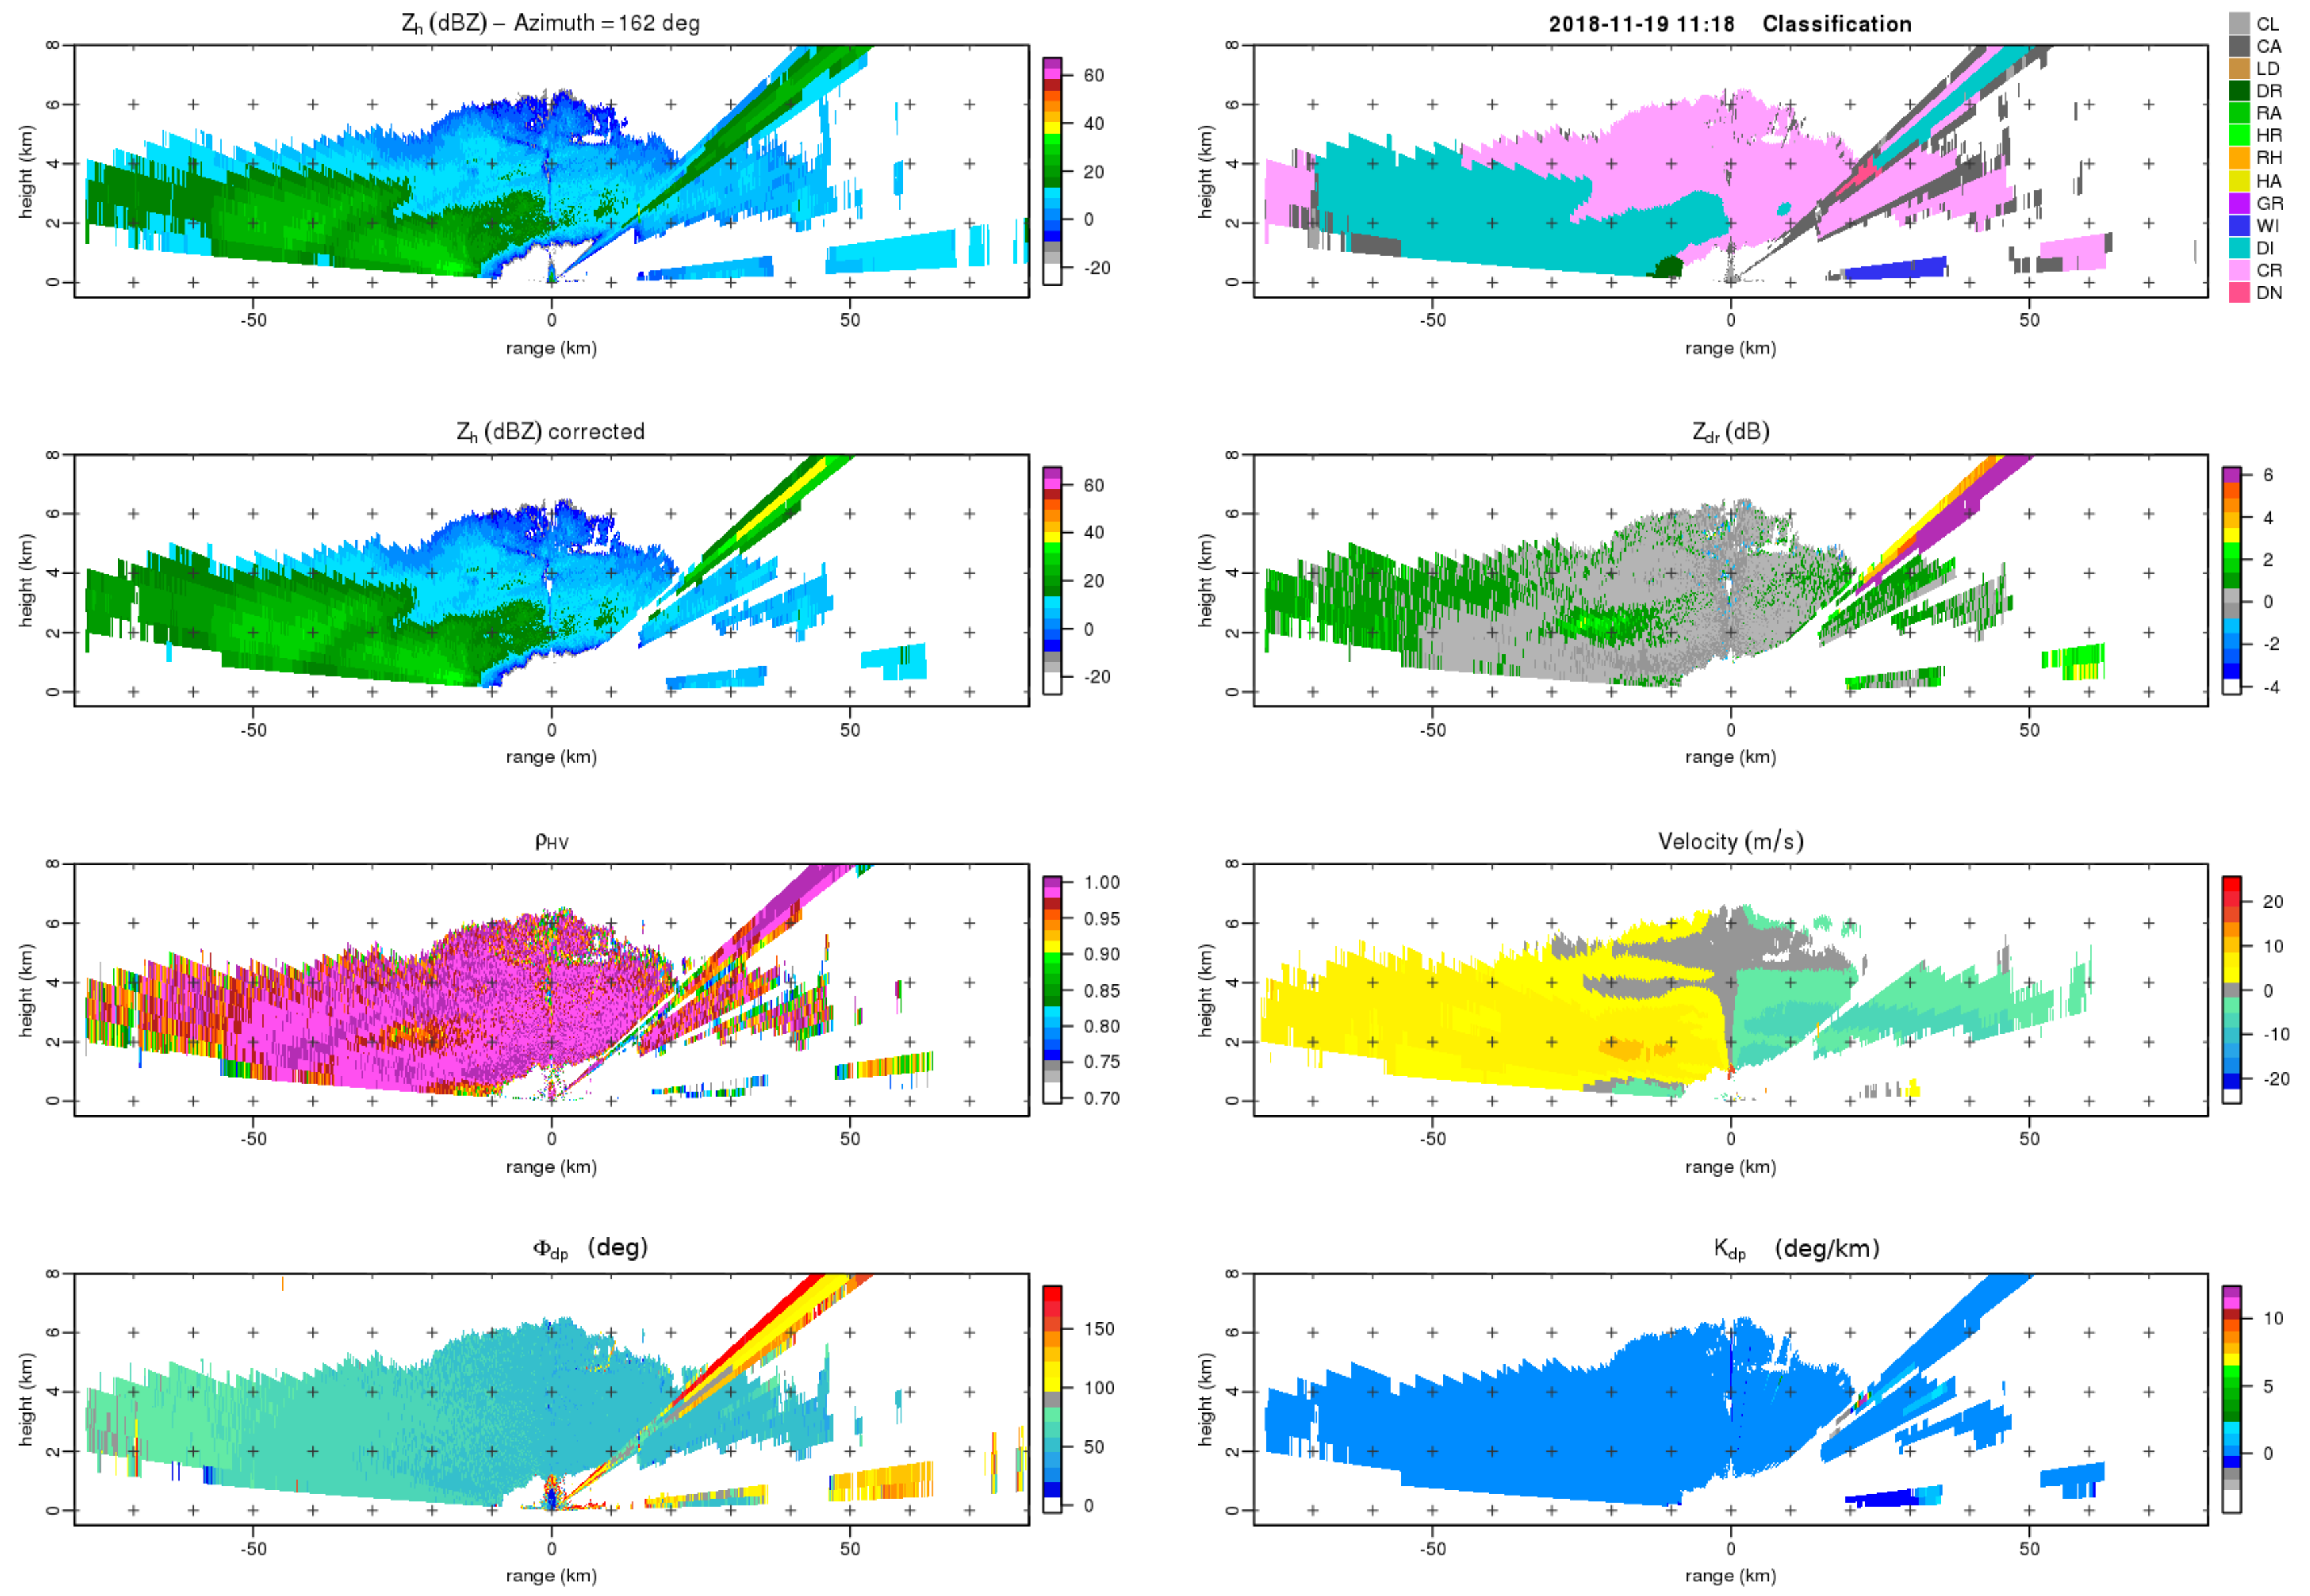
Figure 11, at 11:18 UTC, during the RHI scan, electromagnetic interferences were received when the radar antenna was pointing at 162
N. In this case, two interferences were visible: one received for low elevation angles and one around 50
of elevation likely received in the secondary lobes of the antenna. These particular interferences were not completely removed by the hydrometeor classification since their polarimetric signatures overlap with the range of values expected from weather targets such as ice particles considering the RFI received at the lowest elevation angle. We can note that the reflectivity and differential reflectivity values are close to the one in the core of the precipitation. From the radar perspective, this shows that RFI echoes may have polarimetric signatures, related to the interfering signal, similar to weather echoes, caused by electromagnetic scattering of the radar pulses, depending to the nature of the interfering source such as duty cycle, transmitted power level, and modulation.
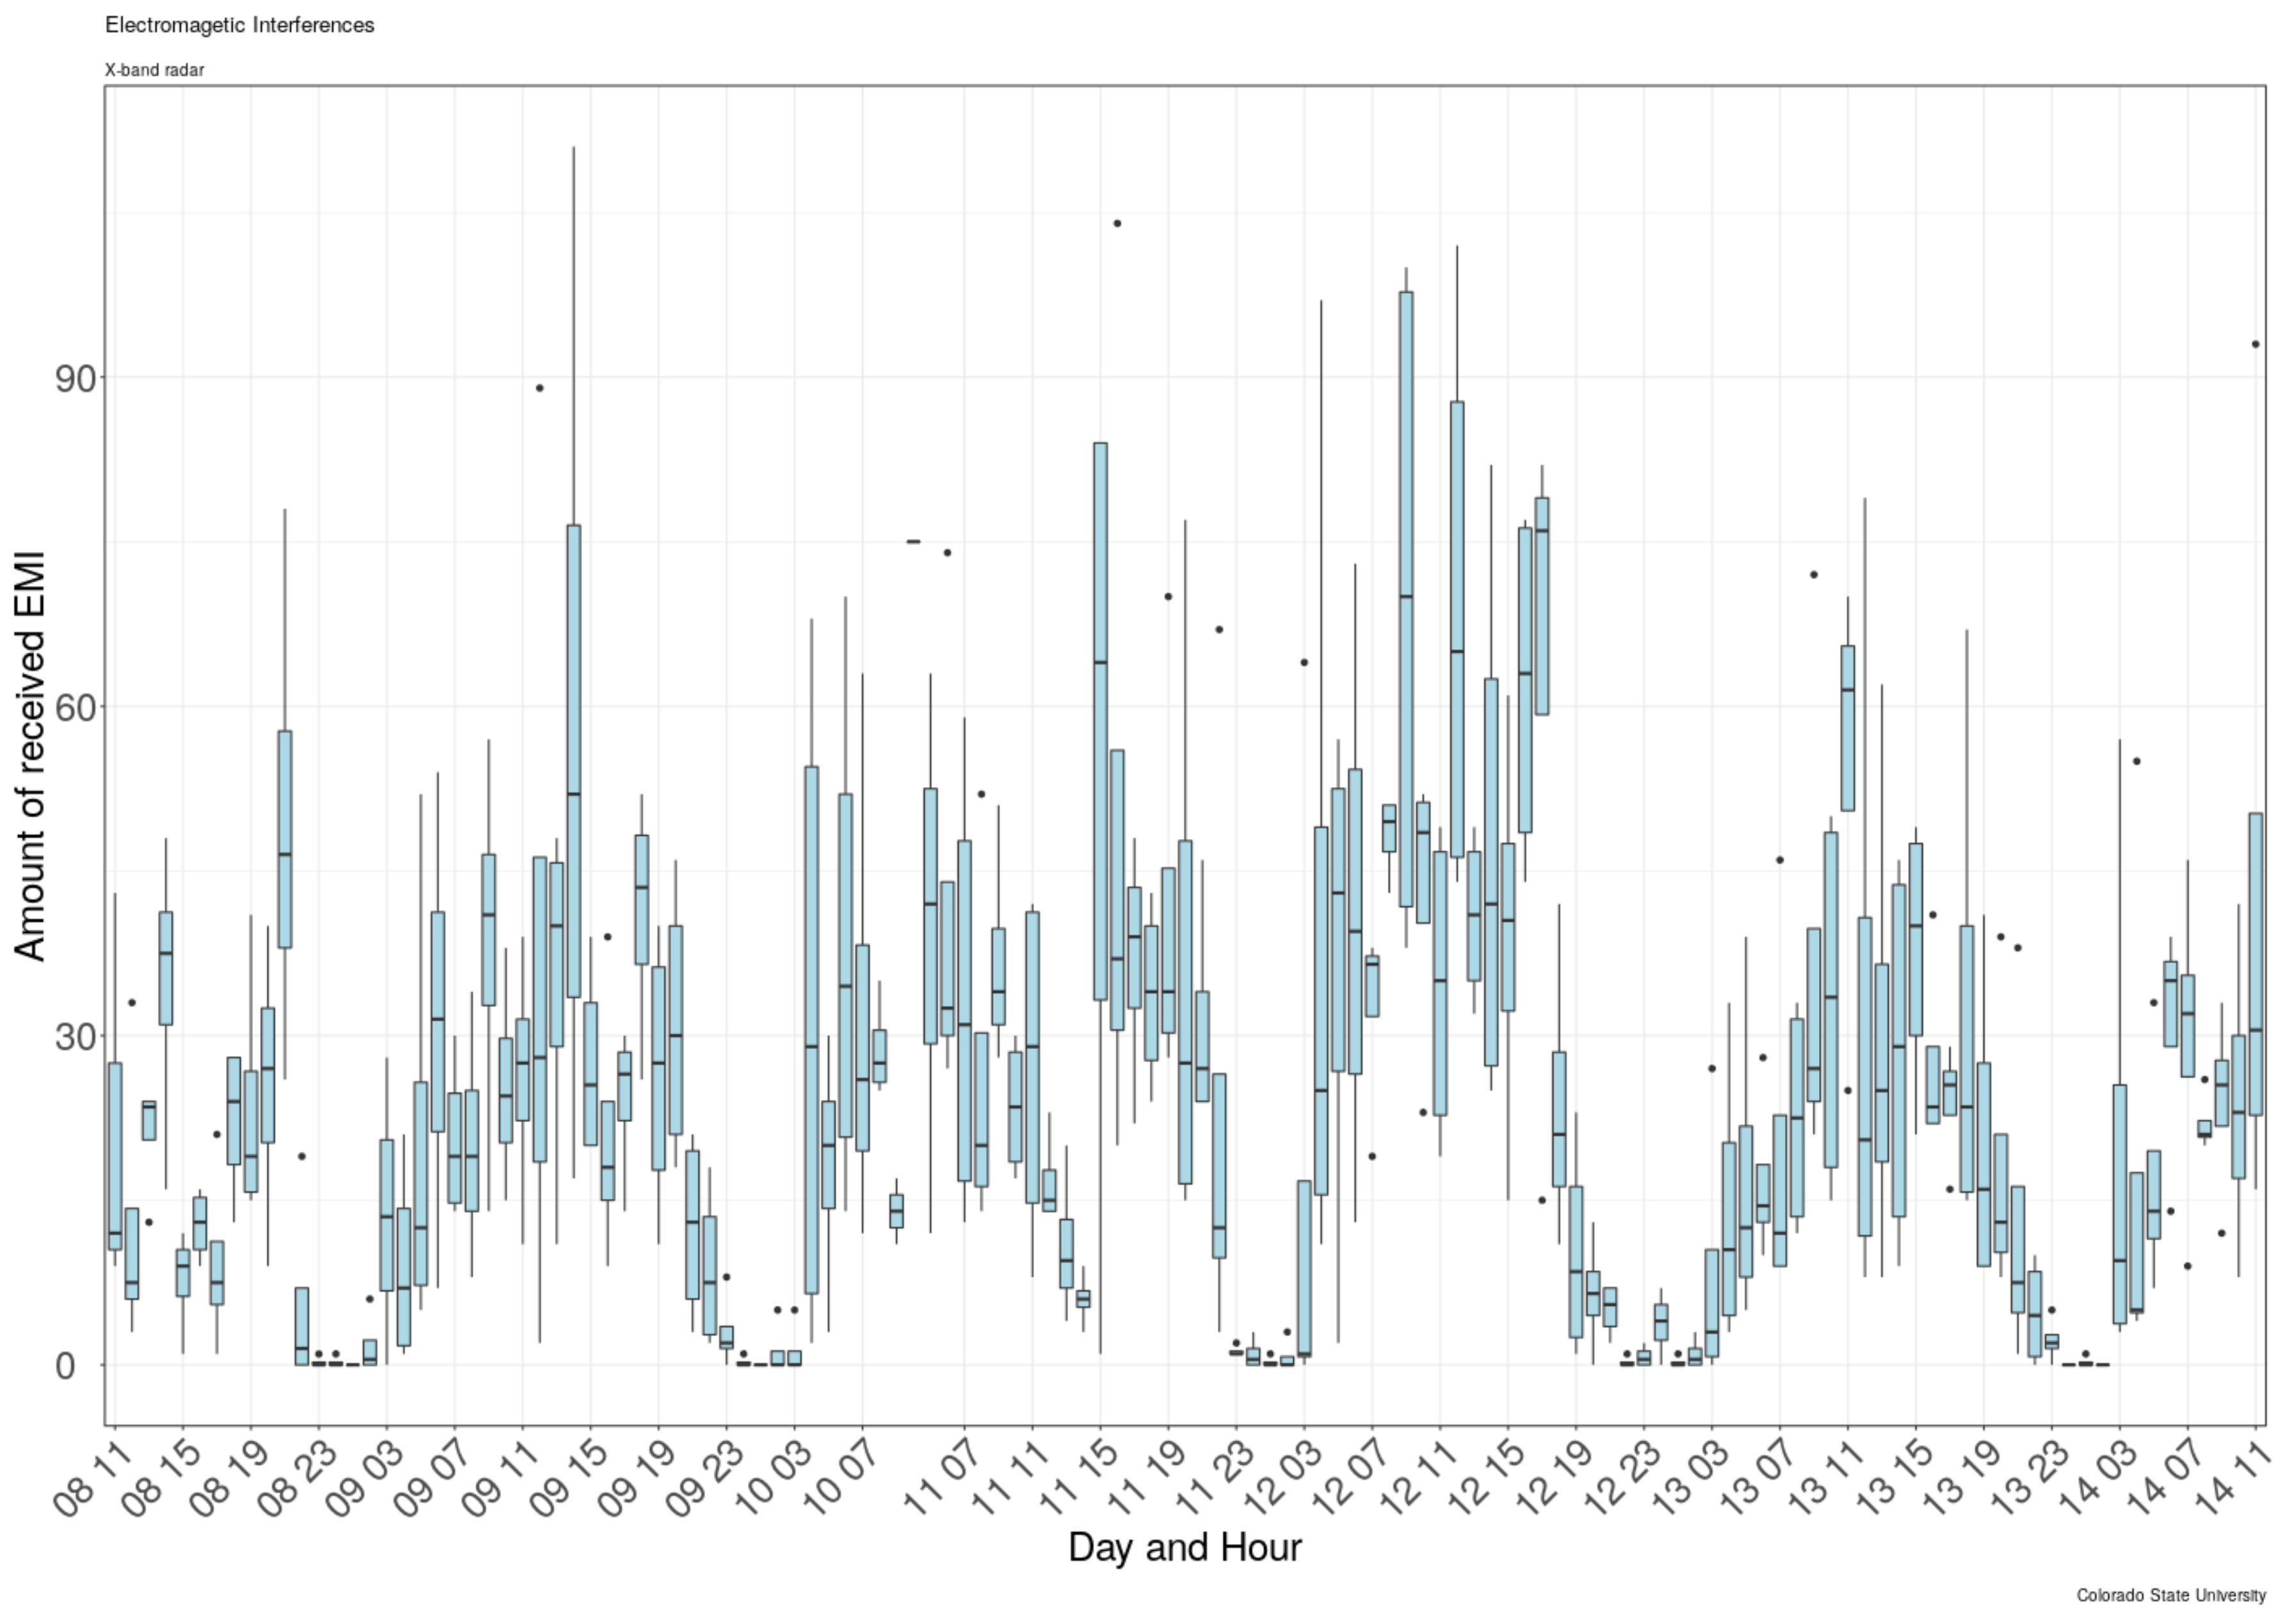
The analysis of clear air radar observations shows a daily pattern, with interferences detected mostly between 06:00 and midnight, local time. To further investigate this pattern, the radar was deployed in a fixed-point measurement campaign from 8 to 14 January 2019. The radar performed a RHI scan every 2 min at 58° azimuth. The interferences collected during this campaign exceeded 10,000.
In
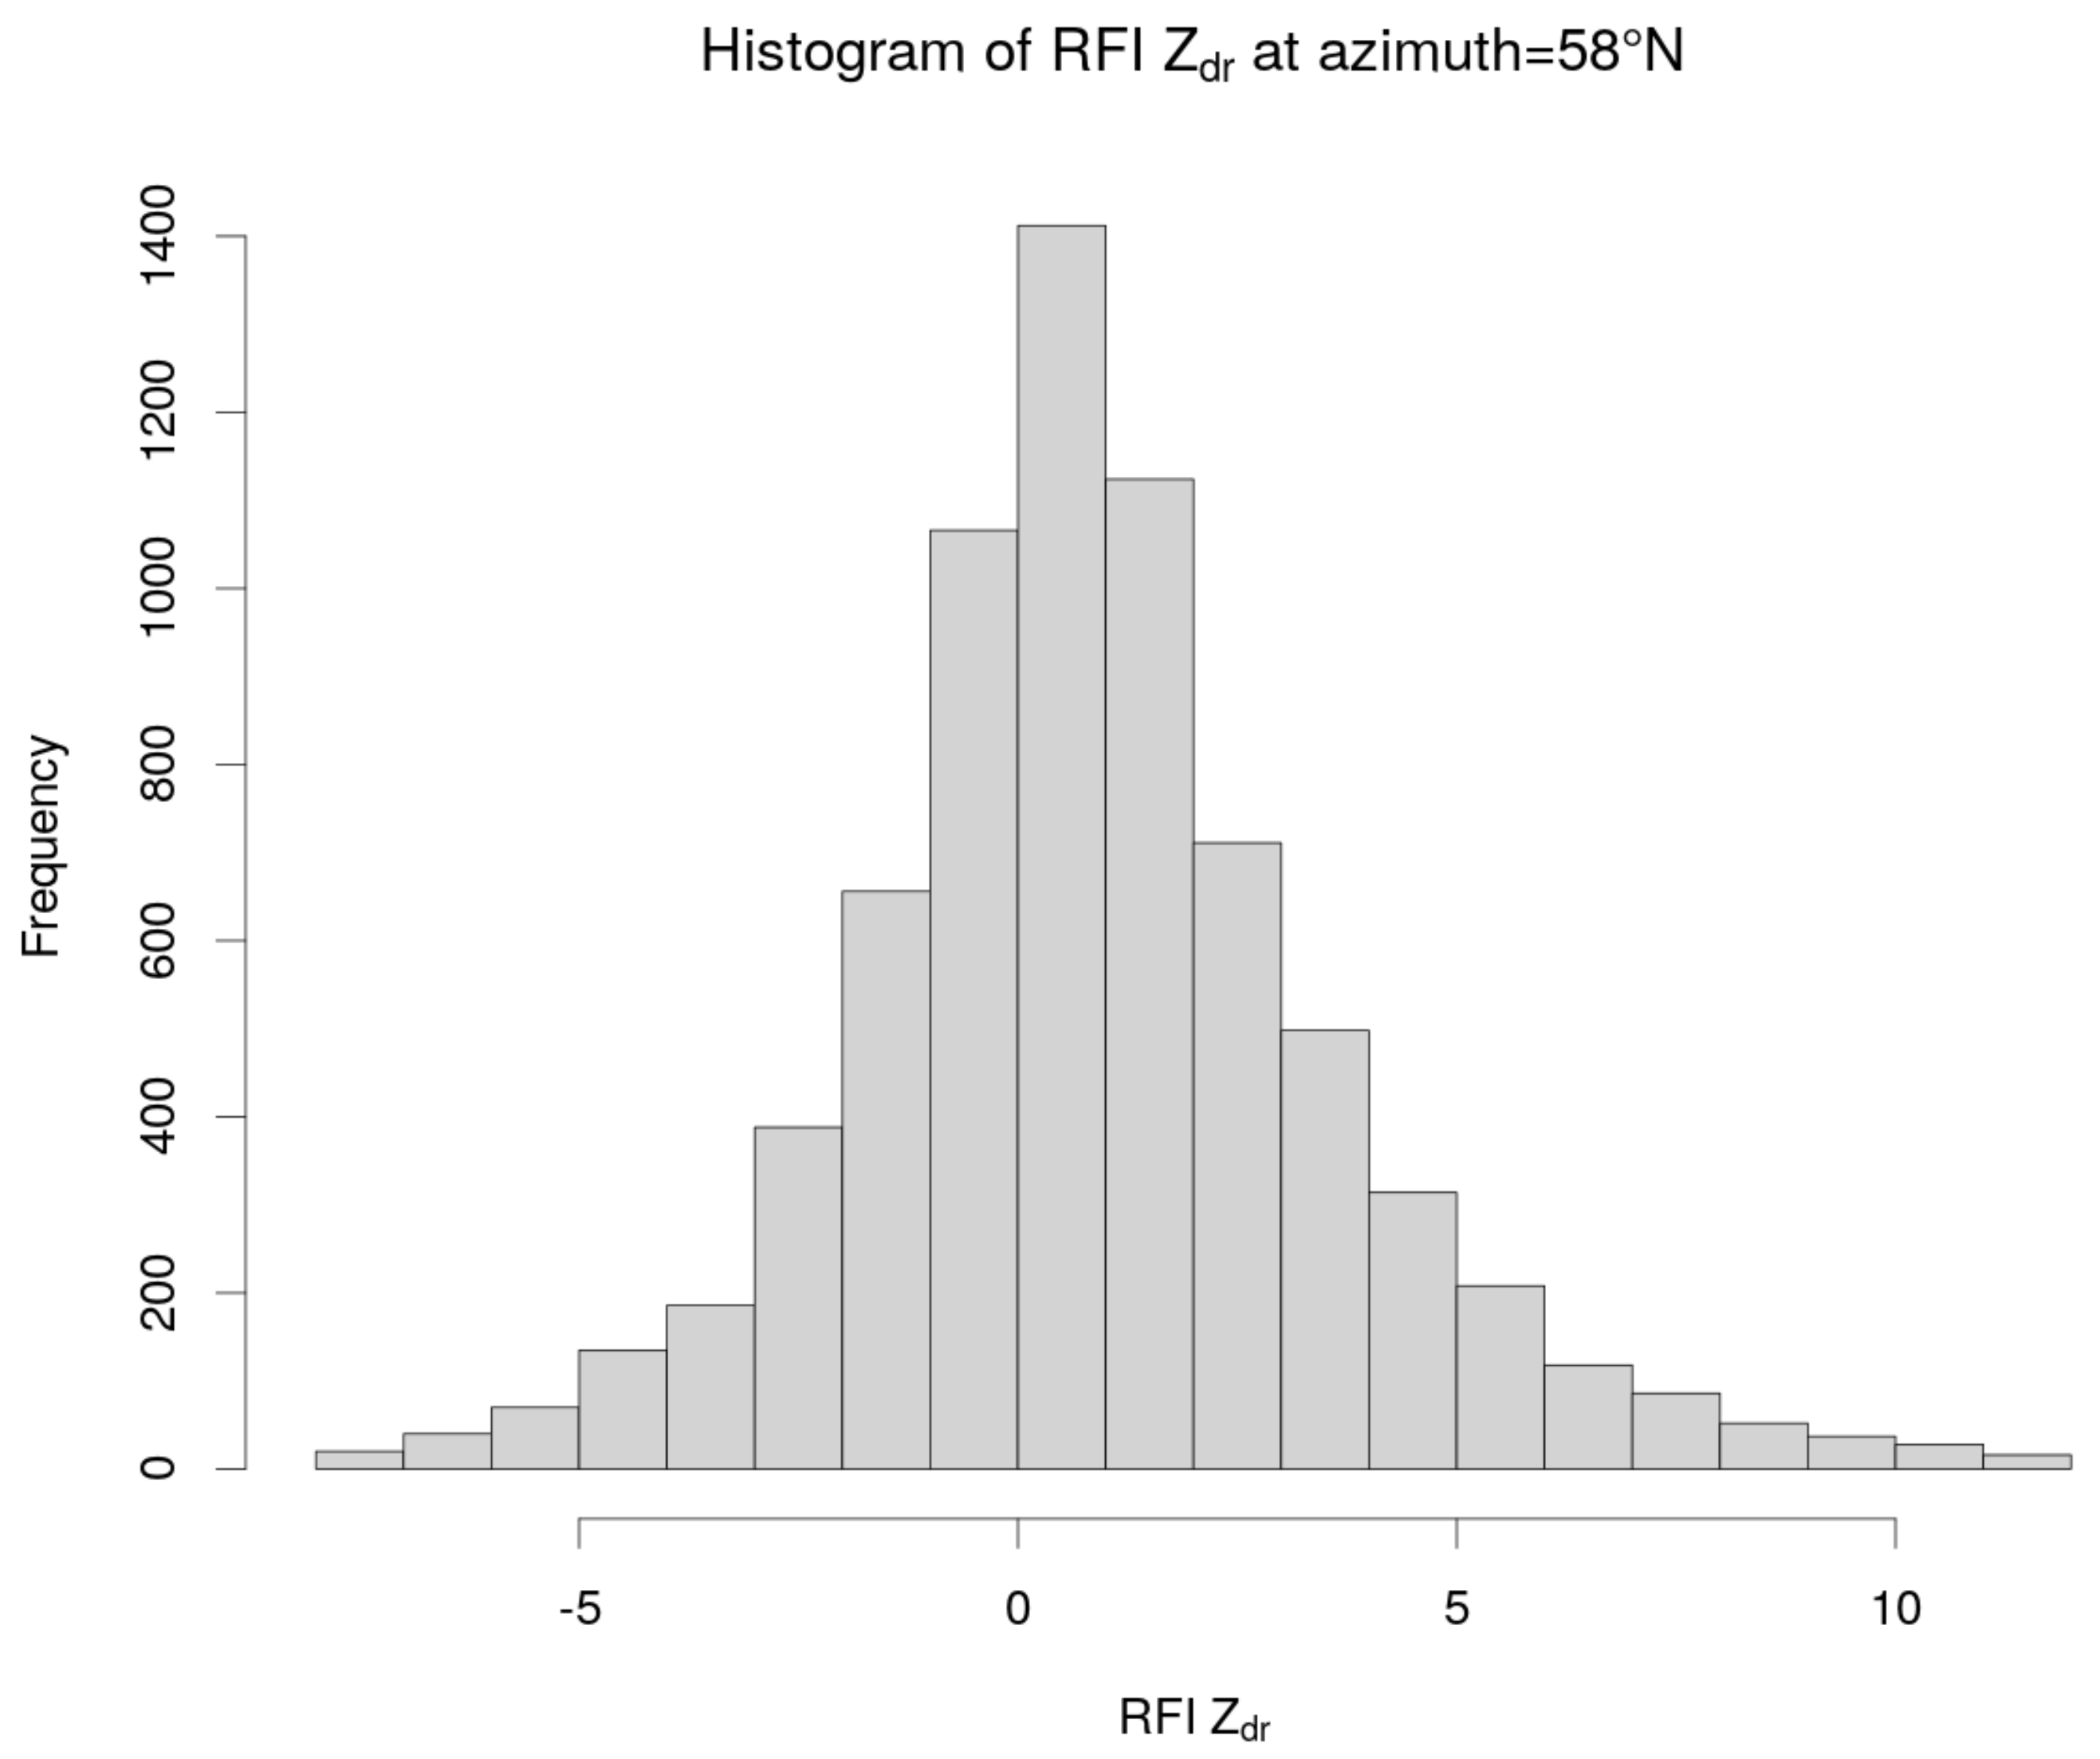
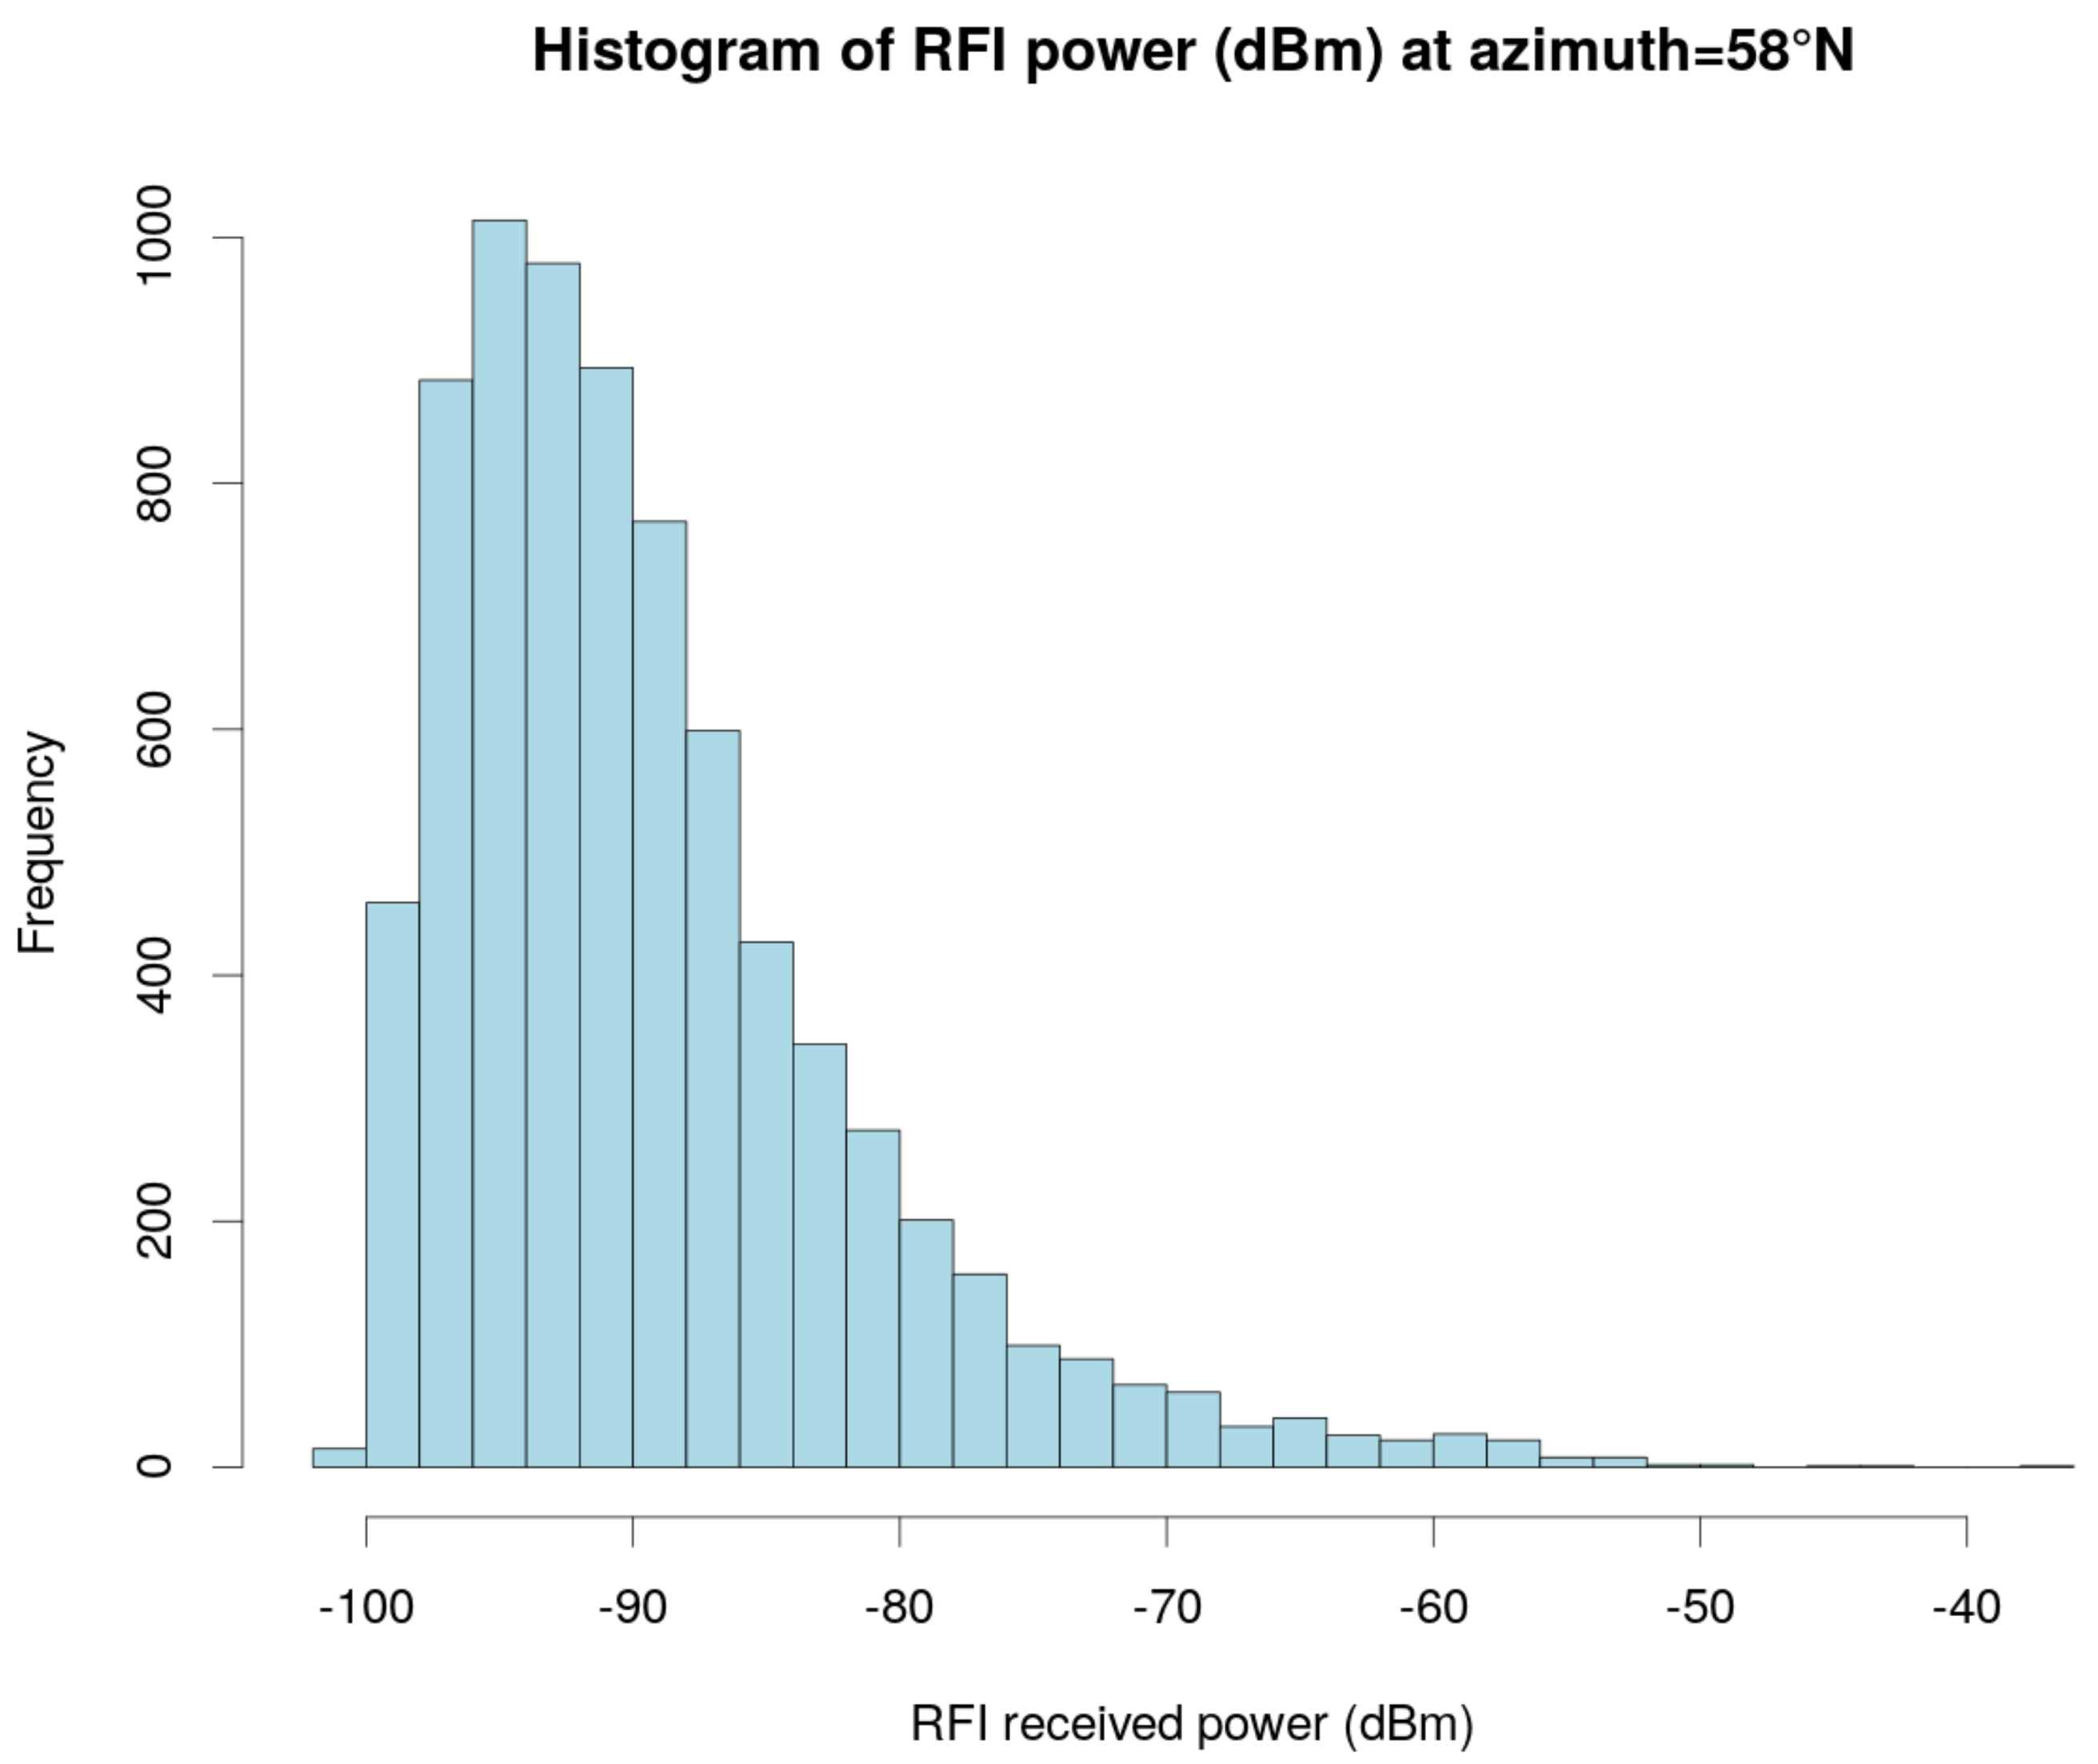
Figure 12, the statistics of the electromagnetic interferences is displayed by data aggregation every 15 min of the RFIs collected every 2 min. The radar was not operating from the morning of 10 January to the morning of 11 January, except for few hours during the day. Except for this period, the day–night pattern of EMI affecting the X-band radar is remarkable. The maximum number of interferences, computed as 15 min aggregation, was achieved on 9 January at 14:15 UTC, with more than 110 EMI received by the radar. The maximum daily number of interferences was reached on 12 January. The histograms of RFI power, differential reflectivity, and copolar correlation coefficient are shown in
Figure 13,
Figure 14 and
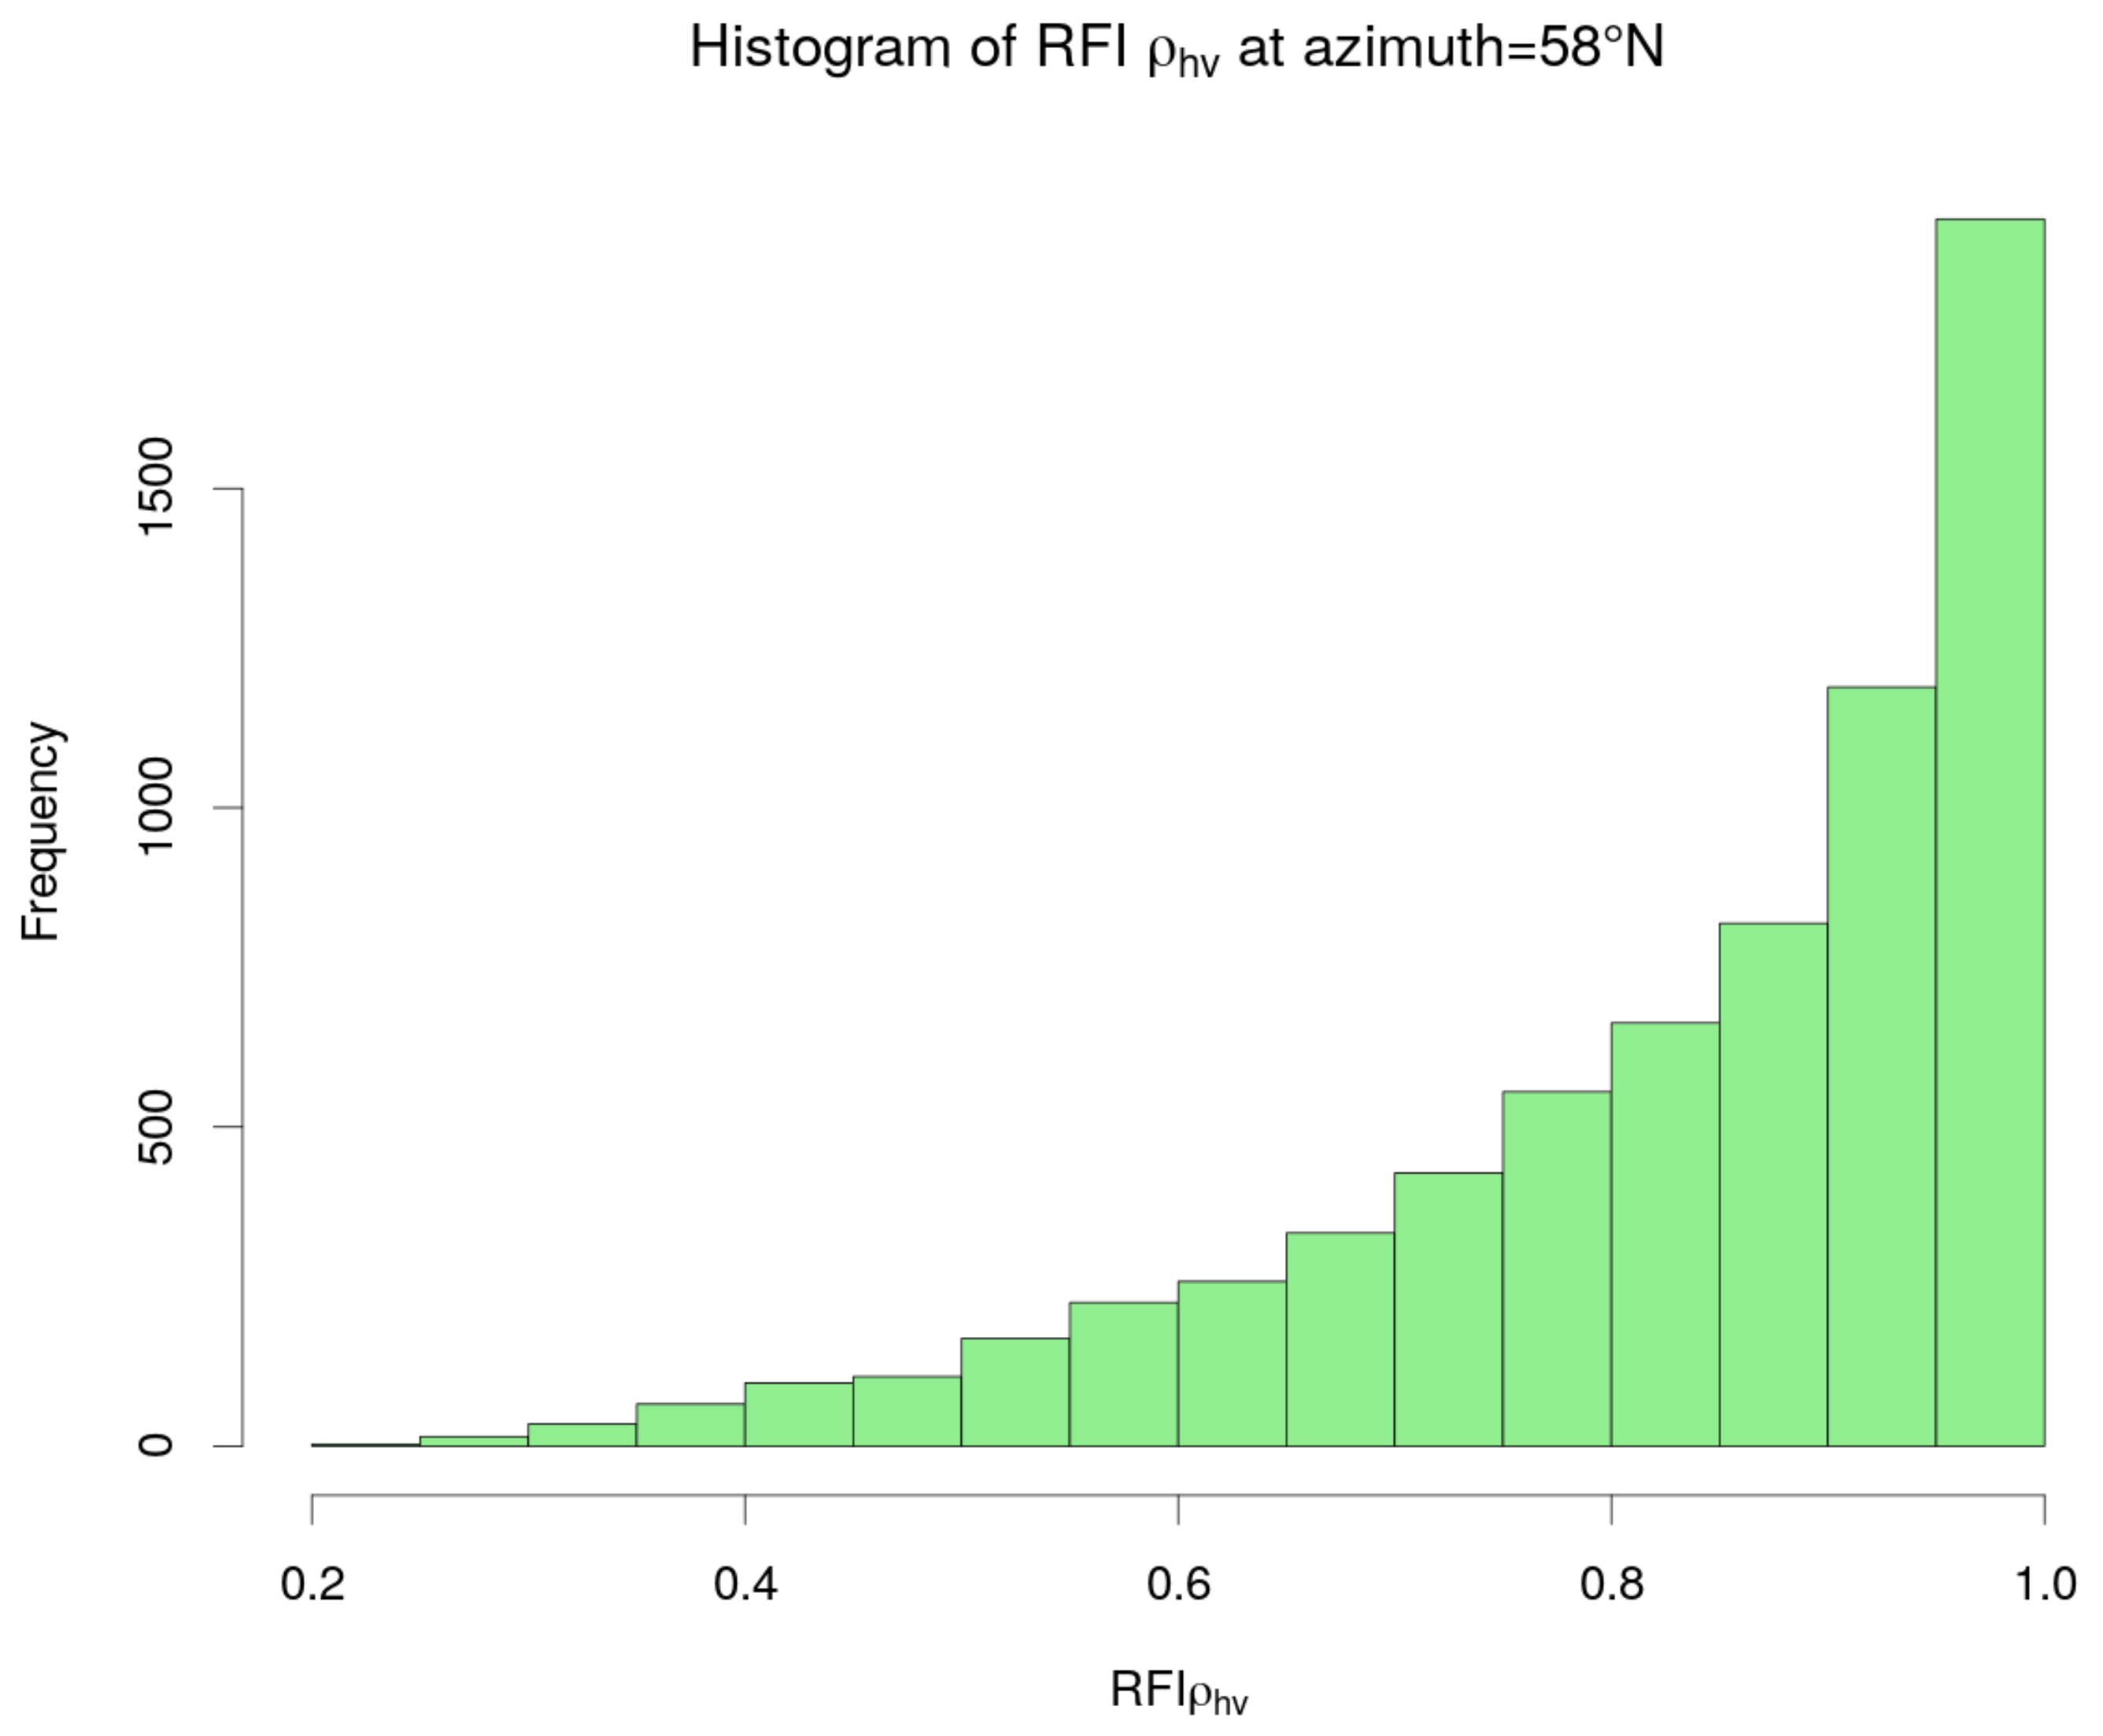
Figure 15, respectively. The maximum received RFI power was −37.8 dBm, while the average value was −89 dBm. More than 96% of received RFIs had power less than −80 dBm. This values are likely related to the average transmitted power of the sources interfering at X-band, their duty cycles, and their antenna patterns and distances from the radar. RFIs’
was Gaussian distributed around 0.9 dB, with few signals highly polarized. The analysis of the collected RFIs shows that approximately 80% of collected RFIs had copolar coefficient
higher than 0.9, pointing out the high correlation between the two orthogonal polarizations. Thus, polarimetric signatures of RFI may not be completely distinguished from weather echoes, as previously shown.
4. Conclusions
Electromagnetic interference is one of the main challenges in weather radar data quality assurance. In Italy, as in most European countries, C-band weather radars are continuously dealing with interferences caused by RLAN and WLAN, which share the same frequency band as weather radars. In this survey of electromagnetic interferences in northwestern Italy, a preliminary method to locate the interfering sources was implemented. This method consists in the early detection of towers or antennas, located in Piemonte region and available in the regional database of electromagnetic sources, which may interfere with the two C-band radars managed by Arpa Piemonte. The number of towers transmitting in the C-band in Piemonte region is higher than 1000, while in 2010 fewer than 200 towers were operational. Those towers are mainly located in rural areas, hills, and mountains, providing broadband Internet access. The analysis of the collected interferences by Bric della Croce radar confirmed that WLANs are one of the major sources of RFIs.
In 2014, the Arpa Piemonte X-band mobile weather radar received the first interferences. Previously, the X-band was not affected by interfering signals. In January 2019, during an in-field measurement campaign to acquire an extensive RFI dataset, the mobile X-band radar collected more than 100 interfering signals on 15 min. The dataset collected by the radar exceeds 10,000 RFIs and the analysis of polarimetric features of those signals was performed. It is shown that most of the collected RFIs have polarimetric signatures that may not be distinguished from weather echoes: only in few cases the polarimetric observables may be used to detect RFIs. At this moment, the nature of RFIs at X-band is not clearly established.
The effect of electromagnetic interferences in weather radars leads to a biased hydrometeor classification and quantitative precipitation estimation. Removal tools based on polarimetric observations may not be able to completely detect interferences. This survey of electromagnetic interferences in weather radars aims to show the interference phenomena at different frequencies in northwestern Italy. Future works will discuss the origin and nature of interfering signals and they will provide a new enhanced removal tool.
Author Contributions
Conceptualization and investigation, M.V. and C.V.C.; and data curation, R.B. and R.C.
Funding
This research was funded by National science foundation and NASA GPM GV programs.
Acknowledgments
This research is supported by the National Science Foundation (RELAMPAGO project) and NASA GPM GV programs.
Conflicts of Interest
The authors declare no conflict of interest. The funders had no role in the design of the study; in the collection, analyses, or interpretation of data; in the writing of the manuscript, or in the decision to publish the results.
References
- Tristant, P. RLAN 5 GHz interference to weather radars in Europe. In ITU/WMO Seminar on Use of Radio Spectrum for Meteorology: Weather, Water and Climate Monitoring and Prediction; WMO/OMM: Genevea, Switzerland, 2009. [Google Scholar]
- Saltikoff, E.; Cho, J.Y.; Tristant, P.; Huuskonen, A.; Allmon, L.; Cook, R.; Becker, E.; Joe, P. The threat to weather radars by wireless technology. Bull. Am. Meteorol. Soc. 2016, 97, 1159–1167. [Google Scholar] [CrossRef]
- Union, I.T. ITU Resolution 229. 2003. Available online: https://www.itu.int/oth/R0A0E00002E/en (accessed on 15 December 2019).
- Recommendation ITU-R, M. 1652-1(05/2011) Dynamic Frequency Selectionin Wireless Access Systems Includingradio Local Area Networks for the Purposeof Protecting the Radiodeterminationservice in the 5 GHz Band. ITU, 2011. Available online: https://www.itu.int/rec/R-REC-M.1652 (accessed on 15 December 2019).
- IEEE. IEEE Standard for Information technology—Telecommunications and information exchange between systems Local and metropolitan area networks—Specific requirements—Part 11: Wireless LAN Medium Access Control (MAC) and Physical Layer (PHY) Specifications; IEEE Std 802.11-2016 (Revision of IEEE Std 802.11-2012); IEEE: Piscataway, NJ, USA, 2016; pp. 1–3534. [Google Scholar] [CrossRef]
- Wang, Y.; Chandrasekar, V. Algorithm for estimation of the specific differential phase. J. Atmos. Ocean. Technol. 2009, 26, 2565–2578. [Google Scholar] [CrossRef]
- Bechini, R.; Chandrasekar, V. A Semisupervised Robust Hydrometeor Classification Method for Dual-Polarization Radar Applications. J. Atmos. Ocean. Technol. 2015, 32, 22–47. [Google Scholar] [CrossRef]
- Testud, J.; Bouar, E.L.; Obligis, E.; Ali-Mehenni, M. The rain profiling algorithm applied to polarimetric weather radar. J. Atmos. Ocean. Technol. 2000, 17, 332–356. [Google Scholar] [CrossRef]
- Bringi, V.N.; Chandrasekar, V.; Balakrishnan, N.; Zrnic, D.S. An Examination of Propagation Effects in Rainfall on Radar Measurements at Microwave Frequencies. J. Atmos. Ocean. Technol. 1990, 7, 829–840. [Google Scholar] [CrossRef]
Figure 1.
Weather radars in northwestern Italy. The circles correspond to the scan domains and the colors are related to the markers in the map. The red and blue markers represent the two C-band radar locations. The circles represent the Bric della Croce scan (red) and the Monte Settepani scan (blue).
Figure 2.
Increase of transmitting towers operating in the 5.4750–5.725 GHz frequency band in Piemonte region. Data available in the regional database of electromagnetic sources.
Figure 2.
Increase of transmitting towers operating in the 5.4750–5.725 GHz frequency band in Piemonte region. Data available in the regional database of electromagnetic sources.
Figure 3.
Uncorrected horizontal reflectivity acquired by Bric della Croce radar in 2010 and 2014 at the same elevation angle (−0.1 degrees). Note the increase of electromagnetic interferences visible as continuous rays.
Figure 3.
Uncorrected horizontal reflectivity acquired by Bric della Croce radar in 2010 and 2014 at the same elevation angle (−0.1 degrees). Note the increase of electromagnetic interferences visible as continuous rays.
Figure 4.
Uncorrected horizontal reflectivity acquired by Bric della Croce radar in 2010 and 2014 at 4.4 elevation angle (−0.1 degrees). Note the increase of electromagnetic interferences visible as continuous rays.
Figure 4.
Uncorrected horizontal reflectivity acquired by Bric della Croce radar in 2010 and 2014 at 4.4 elevation angle (−0.1 degrees). Note the increase of electromagnetic interferences visible as continuous rays.
Figure 5.
Transmitting towers (green points) operating in the 5.4750–5.725 GHz frequency band in Piemonte region. The violet pentagon represents the Bric della Croce radar.
Figure 5.
Transmitting towers (green points) operating in the 5.4750–5.725 GHz frequency band in Piemonte region. The violet pentagon represents the Bric della Croce radar.
Figure 6.
Radial directions of Bric della Croce radar likely affected by electromagnetic interferences (shown as red rays) caused by four main Internet providers in Piemonte region.
Figure 6.
Radial directions of Bric della Croce radar likely affected by electromagnetic interferences (shown as red rays) caused by four main Internet providers in Piemonte region.
Figure 7.
Transmitting towers (green points) operating in the 5.4750–5.725 GHz frequency band in Piemonte region. The violet pentagon represents the Bric della Croce radar. The towers are filtered based on the interference model criteria.
Figure 7.
Transmitting towers (green points) operating in the 5.4750–5.725 GHz frequency band in Piemonte region. The violet pentagon represents the Bric della Croce radar. The towers are filtered based on the interference model criteria.
Figure 8.
HiperLAN towers (black point and triangle) located 50 km north from Bric della Croce radar. Only the HiperLAN reported as black point was identified during in-field measurements. The radar center beam at the elevation scan of −0.1 is shown as the black line, while the orography is reported as the gray area.
Figure 9.
Horizontal in-phase component of the received signals in a portion of the east sector. The electromagnetic interference is visible as pulsed signal in the time axis.
Figure 9.
Horizontal in-phase component of the received signals in a portion of the east sector. The electromagnetic interference is visible as pulsed signal in the time axis.
Figure 10.
Range Height Indicator acquired on 19 November 2018 at 13:29 UTC. From top-left, the following polarimentric observables are shown: uncorrected H-pol reflectivity, hydrometeor classification, clutter removed H-pol reflectivity, differential reflectivity, co-polar correlation coefficient, velocity, differential propagation phase, and specific differential propagation phase. The electromagnetic interference, clearly visible in the uncorrected reflectivity, is removed by hydrometeor classification algorithm.
Figure 11.
Range Height Indicator acquired on 19 November 2018 at 11:18 UTC. From top-left, the following polarimentric observables are shown: uncorrected H-pol reflectivity, hydrometeor classification, clutter removed H-pol reflectivity, differential reflectivity, co-polar correlation coefficient, velocity, differential propagation phase, and specific differential propagation phase. The electromagnetic interference, clearly visible in the uncorrected reflectivity, is removed by hydrometeor classification algorithm.
Figure 12.
Box plot of the EMI amount received during the January 2019 field campaign. The EMI amount was aggregated every 15 min and the hourly average data are displayed.
Figure 12.
Box plot of the EMI amount received during the January 2019 field campaign. The EMI amount was aggregated every 15 min and the hourly average data are displayed.
Figure 13.
Power distribution of electromagnetic interferences based on signals received at azimuth 58° from 8 to 14 January 2019.
Figure 13.
Power distribution of electromagnetic interferences based on signals received at azimuth 58° from 8 to 14 January 2019.
Figure 14.
Power distribution of electromagnetic interferences based on signals received at azimuth 58° from 8 to 14 January 2019, but for differential reflectivity.
Figure 14.
Power distribution of electromagnetic interferences based on signals received at azimuth 58° from 8 to 14 January 2019, but for differential reflectivity.
Figure 15.
Power distribution of electromagnetic interferences based on signals received at azimuth 58° from 8 to 14 January 2019, but for copolar correlation coefficient.
Figure 15.
Power distribution of electromagnetic interferences based on signals received at azimuth 58° from 8 to 14 January 2019, but for copolar correlation coefficient.
© 2019 by the authors. Licensee MDPI, Basel, Switzerland. This article is an open access article distributed under the terms and conditions of the Creative Commons Attribution (CC BY) license (http://creativecommons.org/licenses/by/4.0/).

