Article

Rainfall Variability across the Agro-Climatic Zones of a Tropical Highland: The Case of the Jema Watershed, Northwestern Ethiopia

1
Institute of Disaster Risk Management and Food Security Studies, Bahir Dar University, P. O. Box 5501 Bahir Dar, Ethiopia
2
Centre for Environment and Development Studies, Addis Ababa University, P. O. Box 1176 Addis Ababa, Ethiopia
3
Department of Earth and Planetary Sciences, Johns Hopkins University, Baltimore, MD 21218, USA
4
College of Agriculture and Environmental Sciences, Bahir Dar University, P. O. Box 5501 Bahir Dar, Ethiopia
5
Department of Environmental and Occupational Health, Florida International University, 11200 S.W. 8th st., Miami, FL 33199, USA
*
Author to whom correspondence should be addressed.
Environments 2019, 6(11), 118; https://doi.org/10.3390/environments6110118
Submission received: 23 September 2019 / Revised: 8 November 2019 / Accepted: 11 November 2019 / Published: 12 November 2019

Abstract

:
The objective of the study was to analyze the variability of various climate indicators across the agro-climatic zones (ACZs) of the Jema watershed. The variability was analyzed considering mean annual rainfall (MARF, mm), mean daily minimum temperature (MDMinT, °C), and mean daily maximum temperature (MDMaxT, °C). A one-way analysis of variance (ANOVA) was employed to test whether group mean differences exist in the values of the indicated climatic indicators among the ACZs of the watershed. The coefficient of variation was computed to analyze the degree of climate variability among the ACZs. Rainfall and temperature data sets from 1983 to 2017 were obtained from nearby meteorological stations. The effect of climate variability in the farming system was assessed with reference to local farmers’ experience. Ultimately, the values of the stated indicators of exposure to climate variability were indexed (standardized) in order to run arithmetic functions. The MARF decreases towards sub-alpine ACZs. Based on the result of the ANOVA, the two-tailed p-value (≤ 0.04) was less than 0.05; that is, there was a significant variation in MARF, MDMaxT (°C), and MDMinT (°C) among the ACZs. The coefficient of variation showed the presence of variations of 0.18–0.88 for MARF, 0.18 to 0.85 for MDMaxT, and 0.02–0.95 for MDMinT across the ACZs. In all of the indicators of exposure to climate variability, the lowest and highest indexed values of coefficient of variation were observed in the moist–cool and sub-alpine ACZs, respectively. Overall, the aggregate indexed values of exposure to various climate indicators ranged from 0.13–0.89 across the ACZs. The level of exposure to climate variability increased when moving from moist–cool to sub-alpine ACZs. The overall crop diversity declined across the ACZs of the watershed. Nevertheless, mainly because of the rise in temperature, the climate became suitable for cultivating maize and tef even at higher elevations. In order to adapt to the inter-annual variability of the rainy season, the process of adapting early-maturing crops and the use of improved seeds needs to be enhanced in the watershed, especially in the higher-elevation zones. It is also essential to revise traditional crop calendars and crop zones across the ACSz.

1. Introduction

There is a consensus that climate change has impacted agriculture and the process of ensuring food security and reducing poverty, particularly in Africa [1,2,3,4]. Water is considered as a major means by which climate change and climate variability affect the Earth’s ecosystems and people’s livelihoods and wellbeing [3]. In most parts of the world, especially in developing economies, the most important source of water for crop production and animal rearing is rainfall [1,2]. Africa is one of the most vulnerable continents to climate change and climate variability [4], and a heavy dependence on rain-fed agriculture makes the livelihoods of African farmers more vulnerable to such change and variability [2].
Ethiopia has shown considerable spatiotemporal differences in precipitation in the past [5,6]. The presence of other constraints such as inadequate farming technology, agricultural extension services, poor access to credit, poor financial market, poor infrastructure [7], soil degradation [8,9], and an incompetent institutional and administrative setup [5] have made the situation in the farming system more challenging.
If Ethiopia’s institutional setup continues to be irresponsive to climate variability and its associated hazards, it is projected that by the 2050s, 350–600 million people will be at risk of water shortage [10]. Additionally, in Ethiopia, the future impacts of exposure to climate change and climate variability could cost up to 10% of the country’s GDP by 2050, which could hamper the country’s economic growth ambitions and disproportionately affect its most vulnerable populations [11]. Ultimately, people would face severe shortages of food, water, fiber, energy, and other essential goods and services from the ecosystem.
Numerous studies [5,12,13,14,15] have been conducted on climate variability and trend indicators in Ethiopia. Despite differences in the spatiotemporal scales analyzed, these studies reported consistent results—i.e., a warming trend over the past few decades. The mean daily maximum temperature in the Upper Blue Nile river basin showed increasing trends (20%) over the northern, central, and southern parts, and observed declining trends in the western part (13%) in the last 30 years [16]. In the Choke Mountain ecosystem, located in the Blue Nile River basin, the average annual maximum temperature was found to have increased on the order of 0.03 °C per year since 1979 [7]. Additionally, the mean annual minimum and maximum temperature across Ethiopia have been found to have increased by about 0.25 °C and about 0.1 °C per decade, respectively [17]. Studies [13,18] linked the climate variability in Ethiopia with the El Niño–Southern Oscillation (ENSO) phenomenon.
Precipitation shows spatiotemporal differences at a global level [4]. After some decades, mean annual rainfall (MARF, mm) is expected to increase by about 7% in tropical Africa and decrease by up to 40% in winter (June–August) in Southern Africa. Rainfall increased by 0.5–1.0% per decade in the mid and high latitudes of the Northern Hemisphere and decreased by 0.3% per decade in subtropical land areas of the Northern and Southern Hemispheres. As reported in [16], the normally high inter-annual variability of MARF in the Upper Blue Nile river basin hinders the identification of any trend. This study reported that the total annual rainfall showed an increasing trend of 35 mm per decade. Projections for precipitation are far more uncertain in Ethiopia [4] [13,14], and no trend in rainfall has been identified over the northeastern Ethiopian Highlands. On the other hand, in [13], a declining trend of rainfall in Eastern, Southern, and Southwestern Ethiopia was reported. Furthermore, in [14], a declining trend of rainfall in Southwestern and Eastern Ethiopia was observed, while a declining pattern of total annual rainfall from the southeast to the northwest in the uppermost Upper Blue Nile river basin was observed in [19]. The spatial variability of precipitation across various elevation zones at a smaller spatial scale has presented many questions and has been the subject of many research studies [19,20]. While climate change could influence agriculture at a broad scale, regional or country-level assessments can miss critical details [21].
East Africa is mainly characterized by semi-arid and sub-humid climates with a noticeable dry season. The variability of rainfall in these regions is connected with global processes such as the El Niño/La Niña–Southern Oscillation (ENSO) [11,22]. However, the magnitude of exposure to climate variability is different in different seasons and under different geographic conditions. For instance, El Niño episodes are often associated with above-normal rainfall conditions over the equatorial parts of East Africa between October and December and below-normal rainfall over much of the Horn of Africa between the June–September rainy season. In contrast, La Niña events result in an increase in rainfall over much of the Greater Horn of Africa during June–September. In [7], the authors indicated that aggregated national statistics do not capture the complex state of vulnerability to climate variability/change at the local level. This creates a challenge for generating local-level recommendations for developing adaptation strategies. It is believed that the comparison across agro-climatic zones (ACZs) helps to identify agro-ecosystem-specific climate change adaptation strategies [5].
In Ethiopia, regions with elevations >1500 m are considered as highlands. Almost 90% of the nation’s population resides in such regions, perhaps to take advantage of its relatively disease-free environment [23,24]. Ethiopia has great diversity in terms of its socio-cultural practices and livelihood [25,26,27]. This diversity is reflected in the spatial and temporal variations of livelihood vulnerability to drought and famine among the rural communities in the country [25]. In [7], the authors stated that, in a topographically diverse region, socio-economic and environmental conditions can vary dramatically over relatively short distances. This could result in a challenge for development strategies for climate resilience, as exposure to climate variability and change, climate impacts, and adaptive capacity differ between communities located within common cultural and administrative units.
In [28], the authors concluded the importance of capturing the distributional aspects of adaptation options by highlighting heterogeneous effects of climate variability and adaptation options. Access to relevant information on climate issues is a key driver of adaptation in the Nile Basin [29]. More importantly, the issue of generating information relevant to micro-scale development planning is critical for Ethiopia, where the characteristics of agro-ecosystems vary over very short distances [7,19,27]. However, most studies have offered recommendations for smaller scales [28,29,30], which may not be appropriate to capture the distinct features of various agro-climatic zones of countries. Altitude is generally accepted to be the most common topographic variable used to explain spatial variations in precipitation due to precipitation enhancement through orographic uplift. However, the effects of altitude are not always straightforward [9]. In [6], it was indicated that relatively less-developed, semiarid, and arid regions of Ethiopia are highly vulnerable to climate change. However, these studies may be considered as smaller-scale to capture the spatial pattern of climate variability or climate change, particularly in the uppermost part of the Upper Blue Nile river basin, where the topography is very complex; i.e., its elevation ranges from ~1500 to ~4000 m a.s.l. [7,16]. In [19], the inverse correlation between summer precipitation and altitude in the Upper Blue Nile river basin was discussed. In [5], it was found that the lowland agro-climatic zone of the Upper Blue Nile river basin exhibited higher climate variability. On the other hand, in [7], more vulnerability to climatic hazards in both the highest and lowest elevation zones of the Upper Blue Nile river basin was observed.
Previous studies of climate variability failed to consider ACZs in their analysis of the exposure of geographic regions [12,28,30]. It is believed to be essential to generate information regarding the degree of spatial climate variability, taking into account essential climatic variables across the ACZs in which the climate system is complex. The objective of this study is to analyze the variability of various climate indicators across the agro-climatic zones (ACZs) of the Jema watershed, in the northwestern Ethiopian Highlands.

2. Materials and Methods

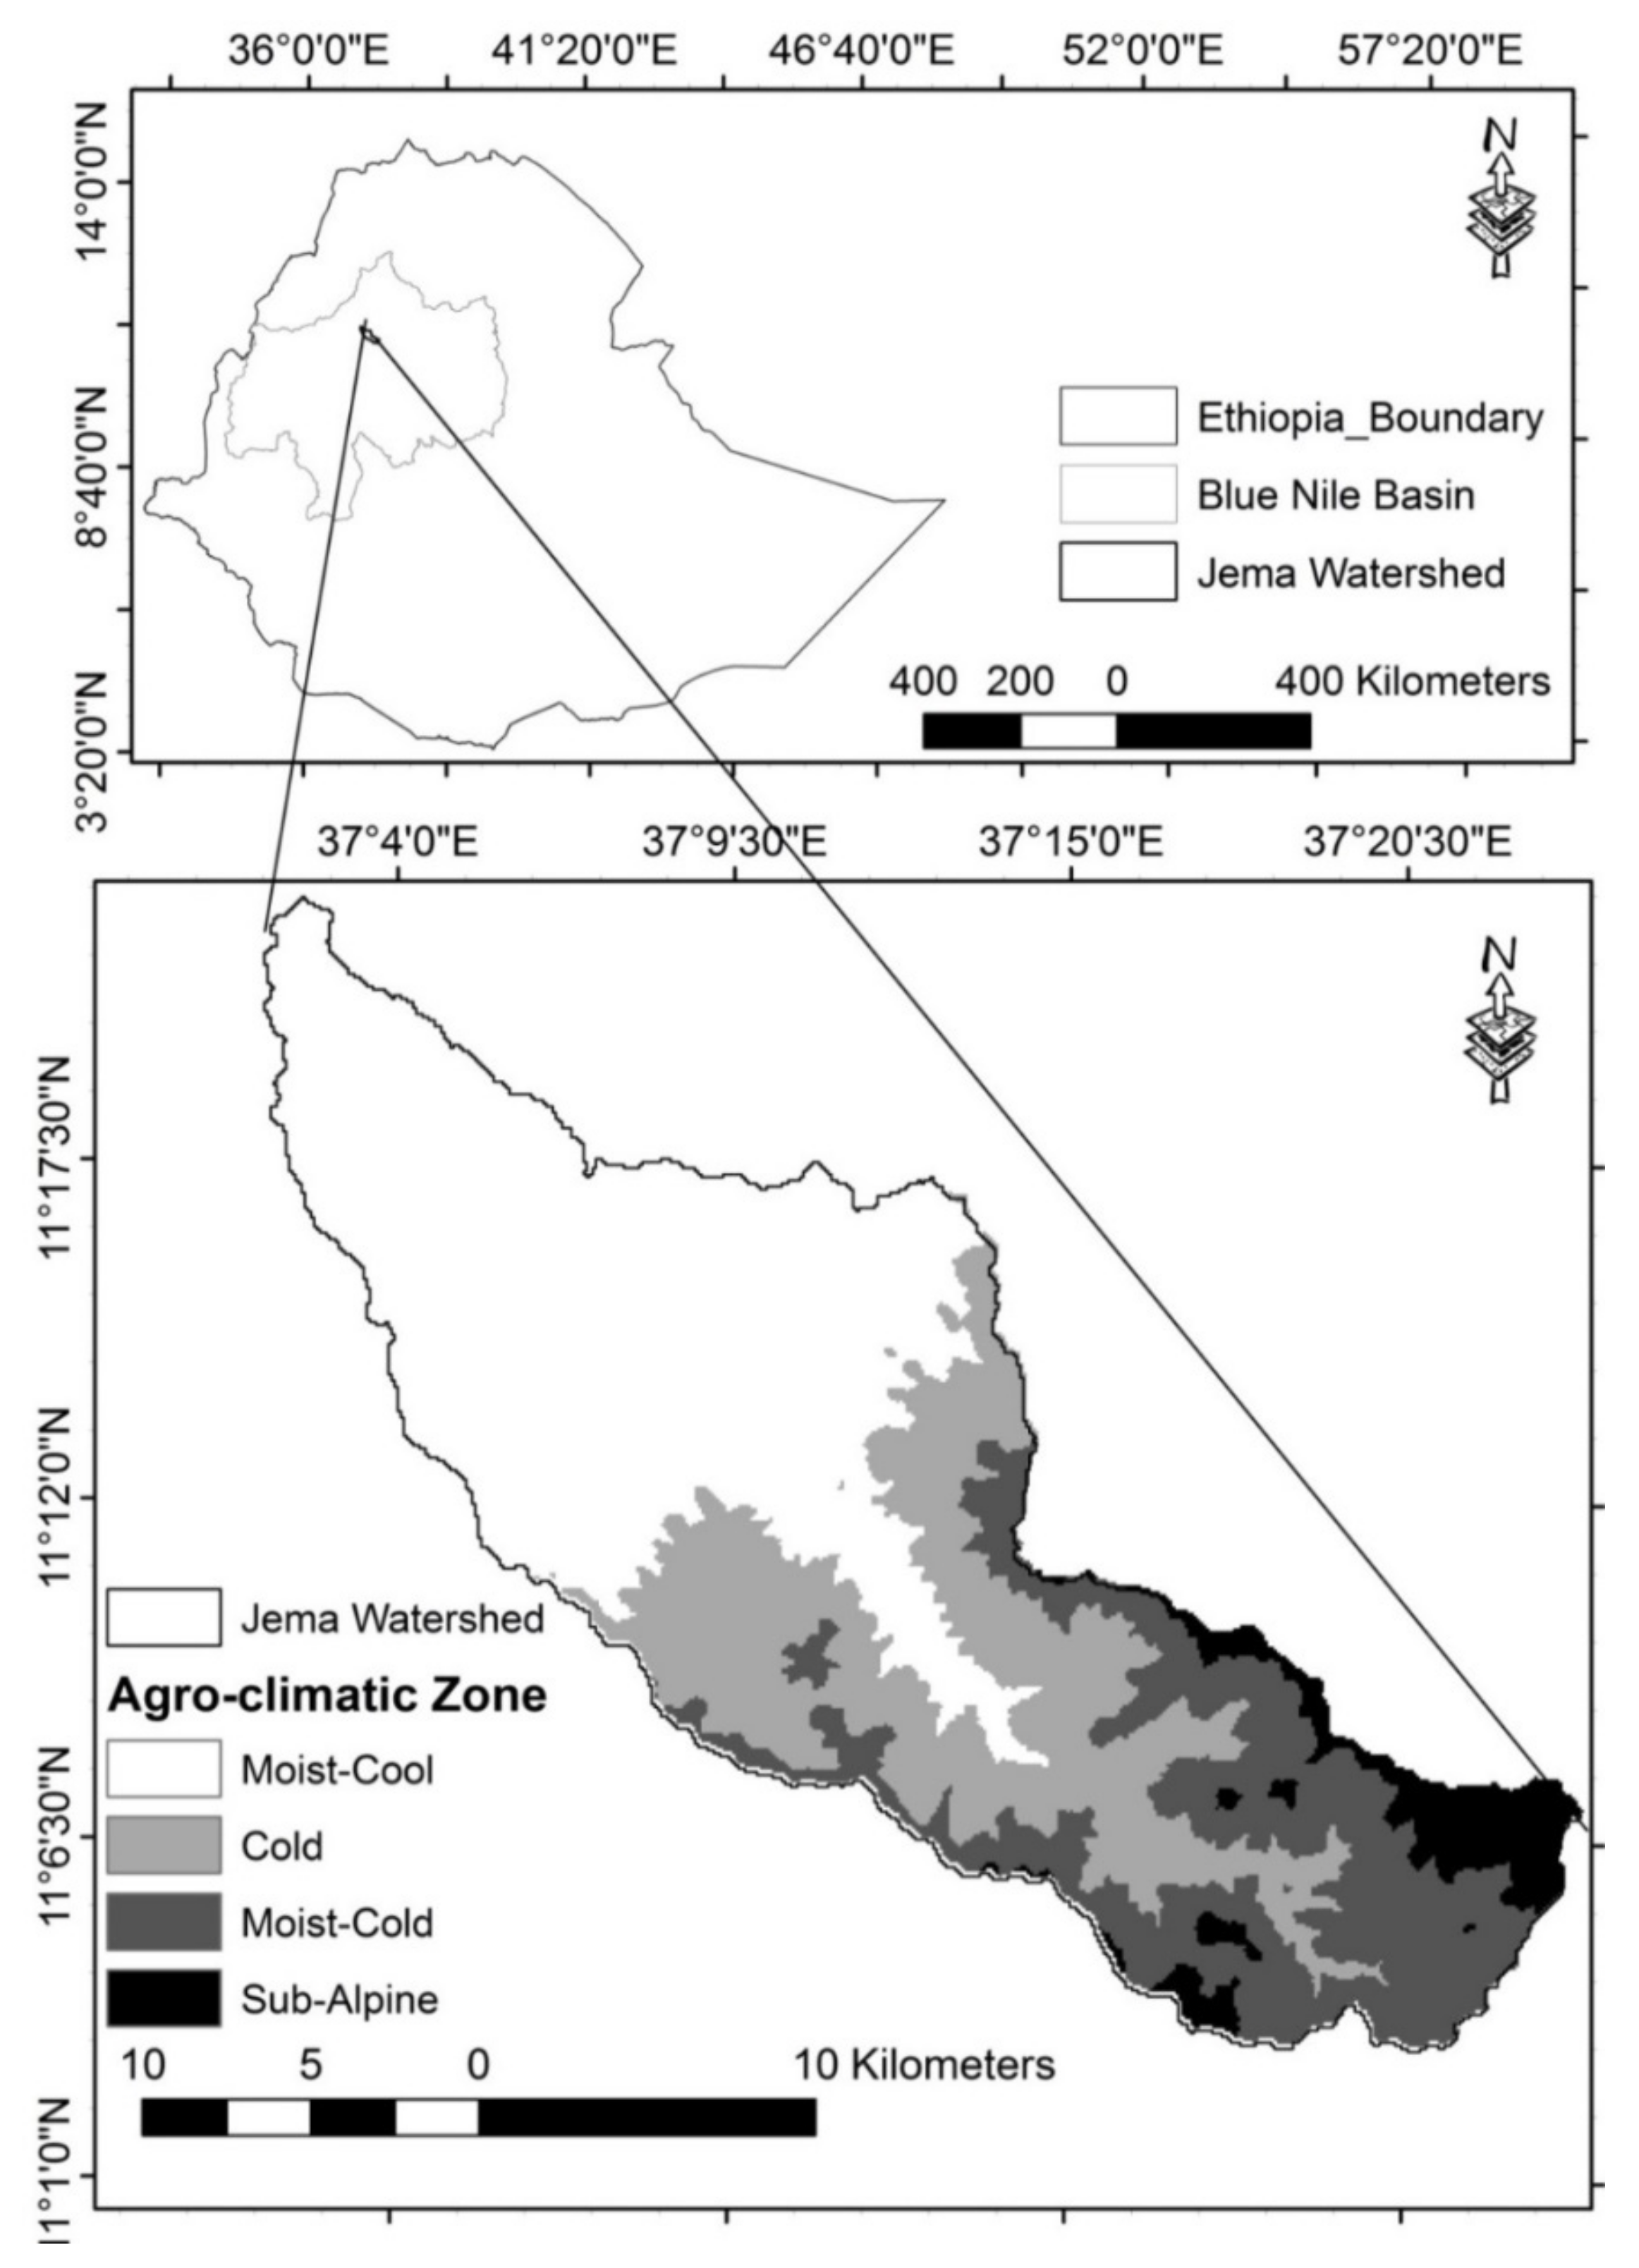
2.1. Description of the Study Area
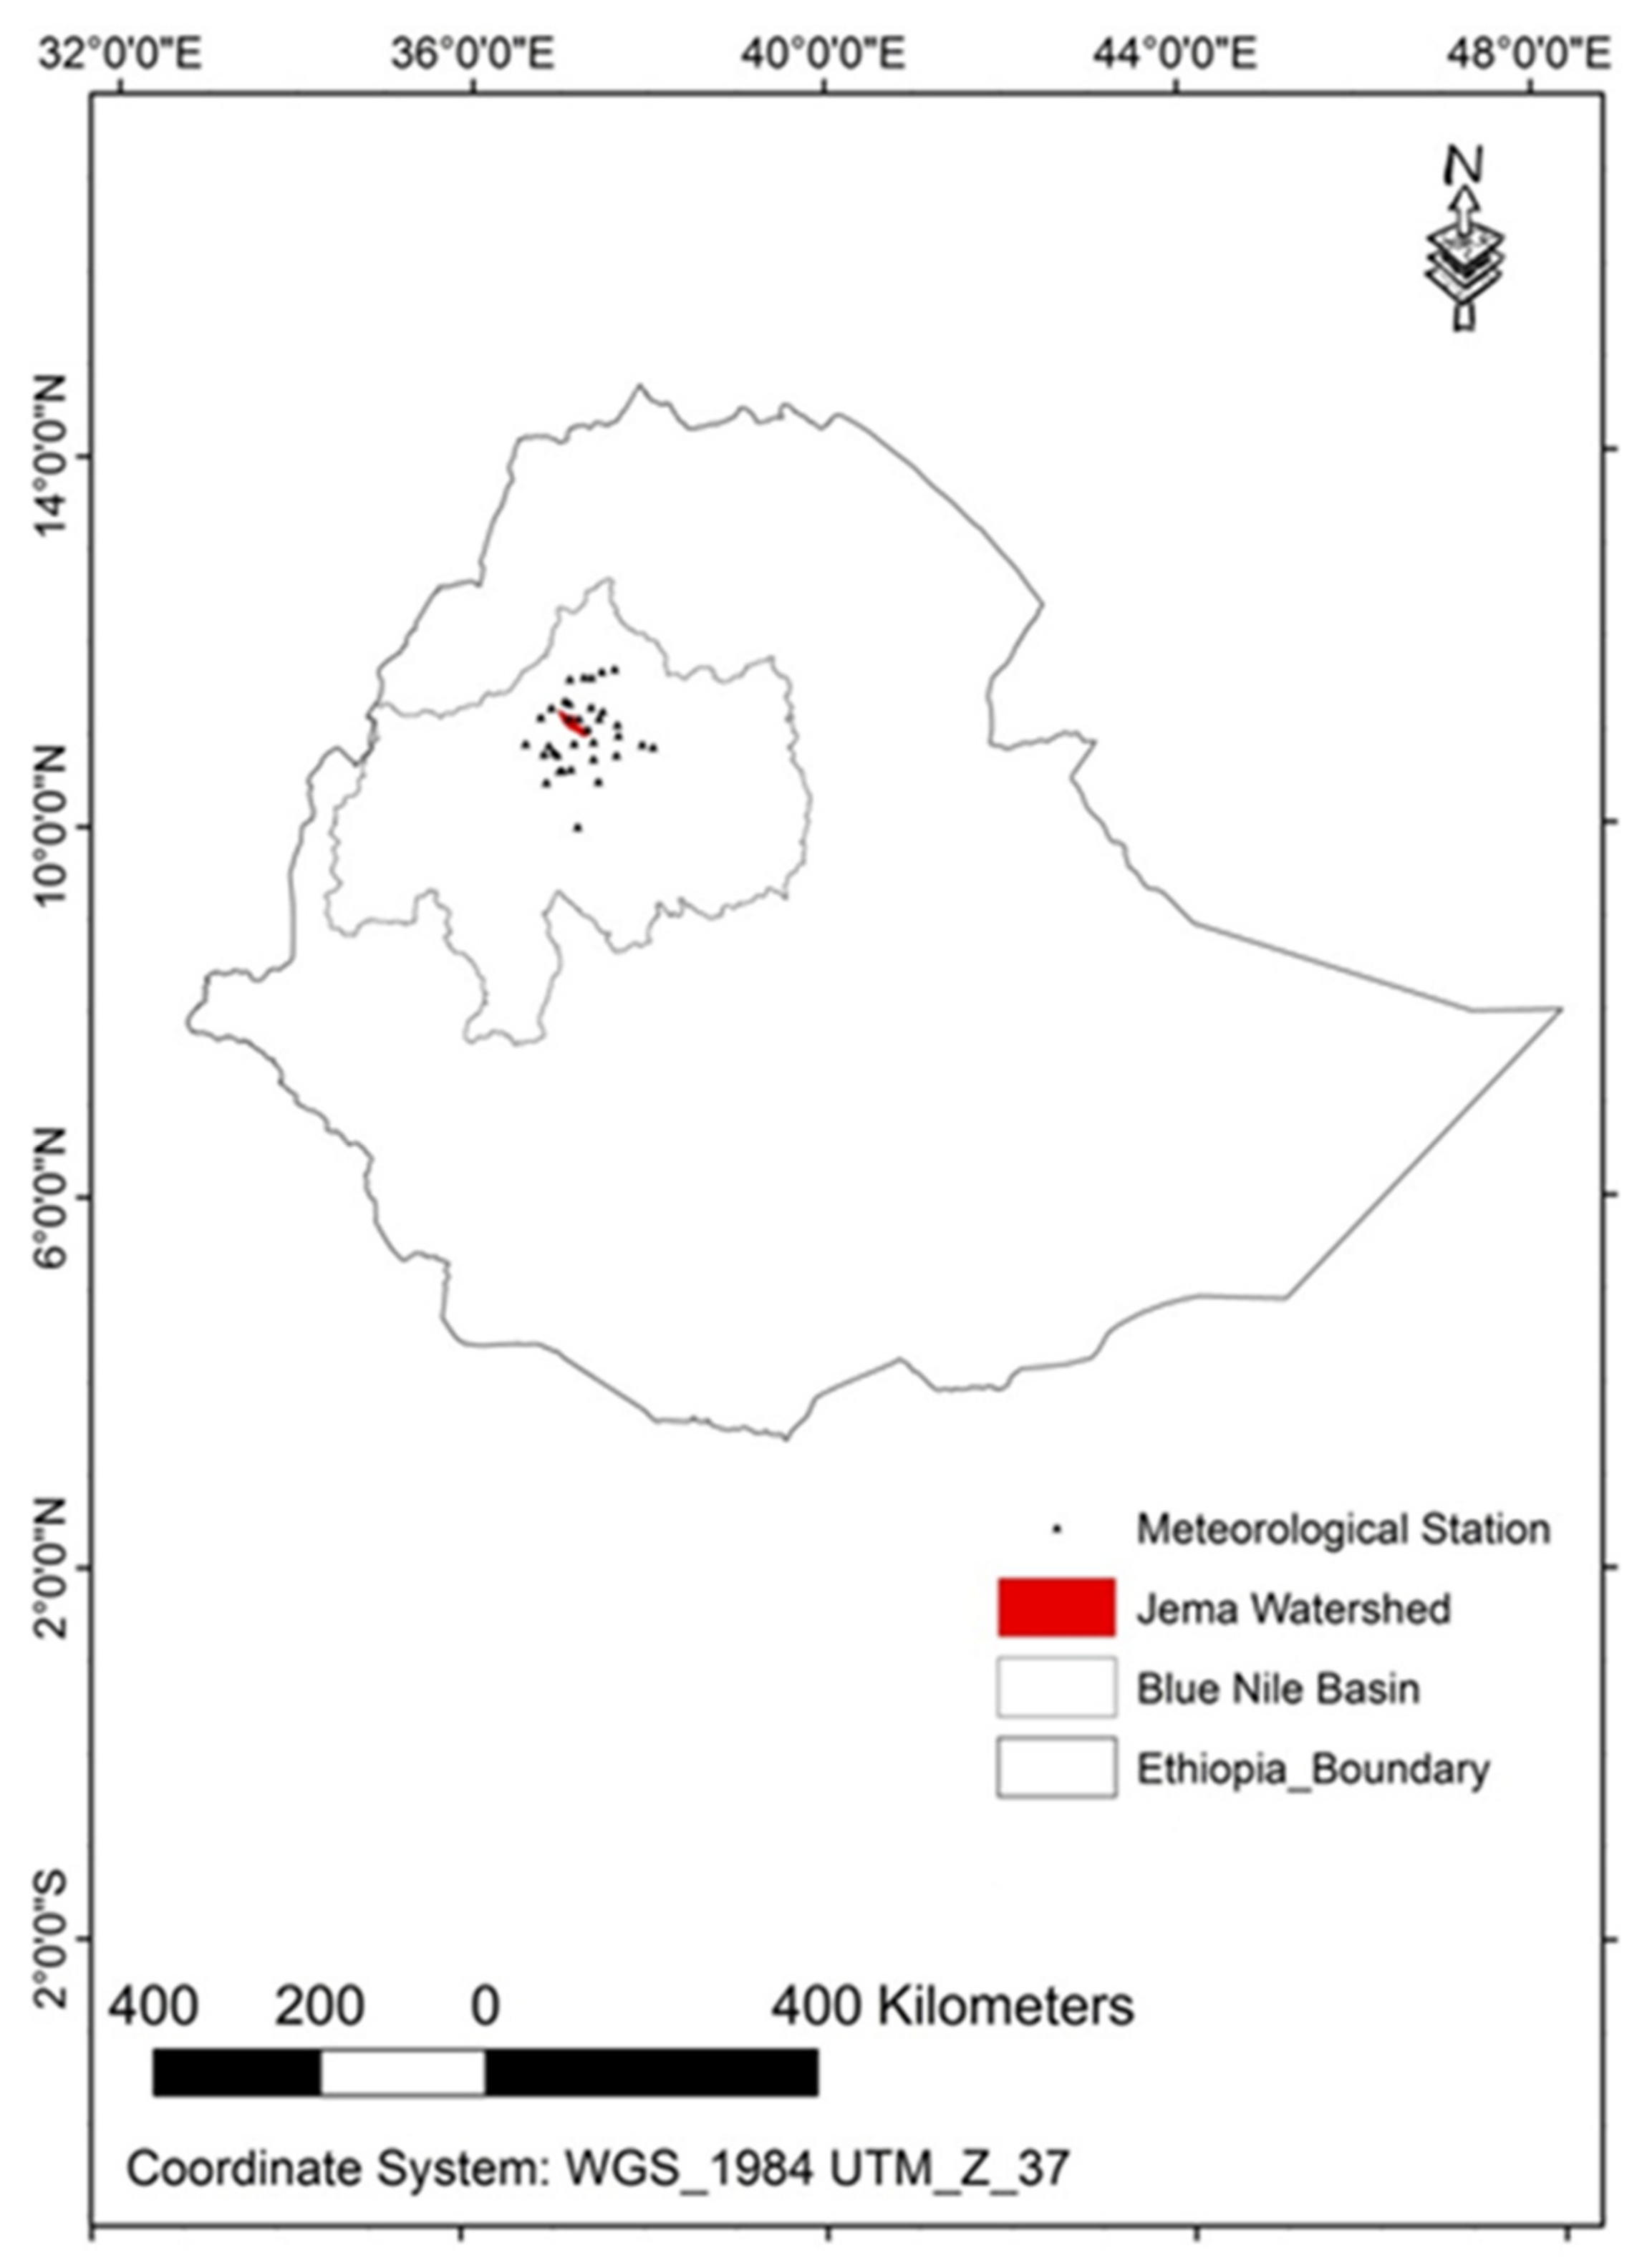
The Jema watershed is situated between 11°22′0′′ and 11°3′30′′ N and 37°2′0′′ to 37°23′30′′ E (based on a digital elevation model (DEM) with a 30 m spatial resolution). It is part of the northwest Ethiopian highlands (a tropical highland) in the Lake Tana sub-basin in the Upper Blue Nile river basin (Figure 1). The watershed covers a geographical area of ~483 km2 and has an elongated physical structure. The watershed is located ~80 km south of Bahir Dar—the capital of the regional state—and ~500 km north of Addis Ababa, the country’s capital.
Volcanic rocks of the Late-Tertiary to Quaternary age dominate the geology of the watershed [31]. The watershed is characterized by complex terrain with a gentle slope, hilly landscape, and steep slopes. Based on a DEM with a 30 m spatial resolution, the elevation of the watershed ranges from 1895 to 3518 m a.s.l. Based on the local ACZ classification system [23], the site consists of moist–cool highland (Weyina-Dega), cold highland (Low-Dega), moist–cold highland (High-Dega), and sub-alpine (Low-Wurch) ACZs (Table 1). The elevation declines from southeast to northwest across the watershed.
Based on the DEM with a 30 m spatial resolution, the slope of the watershed ranges from 0% to 45%. The steepness decreases from the southeastern (moist–cool) to the northwestern (sub-alpine) part of the watershed [19]. The MARF of the watershed is ~1400 mm [17,32]. About 80% of the total rainfall occurs during the summer (Kiremt) season. On average, the mean daily maximum temperature (MDMaxT) and mean daily minimum temperature (MDMinT) are ~25 °C and ~7 °C, respectively. According to the National Meteorological Agency of Ethiopia (NMA), the maximum temperature was recorded in March, during the spring (Belg) season [17,32]. In [33], it was stated that the main soil orders in the watershed are Alisols, Nitisols, and Vertisols.
In the Amhara Regional State, where the study site is situated, the average family size is estimated to be 4.6 people, while the population density is estimated to be ~189.4 people km−2 [34]. The LULC types in the site are cropland, grazing land, settlement land, bare land, bush land, wood land, riverine trees, water bodies, and forest land [9]. The livelihood of the inhabitants is dependent on subsistence-scale mixed farming; i.e., food crop production and livestock rearing. The farming heavily depends on rain-fed systems with scant small-holding irrigation. According to Bureau of Finance and Economic Development-BOFED [34] and the focus group discussion conducted in the current study, the main crops grown include barley (Hordeum vulgare), wheat (Triticum aestivum), maize (Zea mays), potato (Solanum tuberosum), tef (Eragrostis tef), horse bean (Vicia faba), pea, and onion (Allium cepa). The main livestock types include cattle, sheep, goat, horse, donkey, mule, and poultry. A very small proportion of households are engaged in off-farm activities to generate additional income, such as petty trading, weaving, daily labor, hand smith, and pottery production.

2.2. Data Used

The data sets used in the current study were generated from meteorological data sets recorded from 1983 to 2017. The meteorological record was subjected to interpolation and other inferential statistical analysis methods. The meteorological sites that were considered in this study are shown in Figure 2. Estimating climatic variables such as rainfall is challenging due to the highly variable nature of meteorological processes, the effects of terrain and geography, and the difficulty of establishing a representative network of stations. In order to fill spatial data gaps, various statistical and technological techniques were used. Geostatistical interpolation is one of the universal methods that have been used by the scientific community to estimate precipitation amounts. In order to calculate the values of sample MARF across the entire watershed, it was essential to employ a robust statistical interpolation method. After evaluating the performance of various interpolation methods, it was found to be reasonable to use the ordinary co-kriging (OCK) method. The performances of the models were evaluated in terms of the mean error (ME), root-mean-square error (RMSE), mean standardized error (MSE), root-mean-square standardized error (RMSSE), and mean standard error (ASE). Moreover, a bias of estimators was also computed. The methods and procedures used for interpolation are explained in detail in previous works [19,27].
The possible consequences of climate variability on the farming system, including crop diversity and the length of the growing period, were assessed using the results of focus group discussions (FGDs). FGDs may have a potential limitation in generating historical data; however, since the livelihoods of the local farmers depend on rain-fed agriculture, the participants of the FGDs of the current study were in a position to recall consequences of climate-related hazards with minimal error. One FGD was conducted in each of the ACZs. Each FGD involved six to eight participants. Participants were selected taking into account the ACZ in which they resided and their age. To collect information about climate change, elders (>50 years of age) were deliberately included in the FGDs. Each FGD lasted two hours and was conducted with the support of a trained moderator. As noted in [35], pilot studies help to improve skills related to the proper addressing of questions, effective eye contact, minimizing/avoiding domination, effective note-taking, the understanding of body language, probing of participants for further discussion, and controlling the direction of the discussion. The FGDs were implemented as recommended in [35,36].

2.3. Indexing the Values of Indicators of Exposure to Climate Variability

As part of the investigation into the presence of climate variability, it was essential to generate information about the coefficient of variation for MARF (mm), MDMinT (°C), and MDMaxT (°C) from the meteorological data set. Ultimately, the values of all indicators of exposure to climate variability were indexed (standardized) using Equation (1). The same indexing technique was used in recent climate-related studies [5,7,37]. The purpose of standardizing the measured indicators is to eliminate the unit of measurement and run arithmetic functions.
I n d e x V A C Z = I A I W m i n I W m a x I W m i n
where IndexVACZ is the indexed (standardized) value of an indicator in an ACZ, IA is the actual value of an indicator in an ACZ, IWmin is the actual minimum value of the same indicator over the entire watershed, and IWmax is the actual maximum value of the same indicator over the entire watershed.

3. Results and Discussion

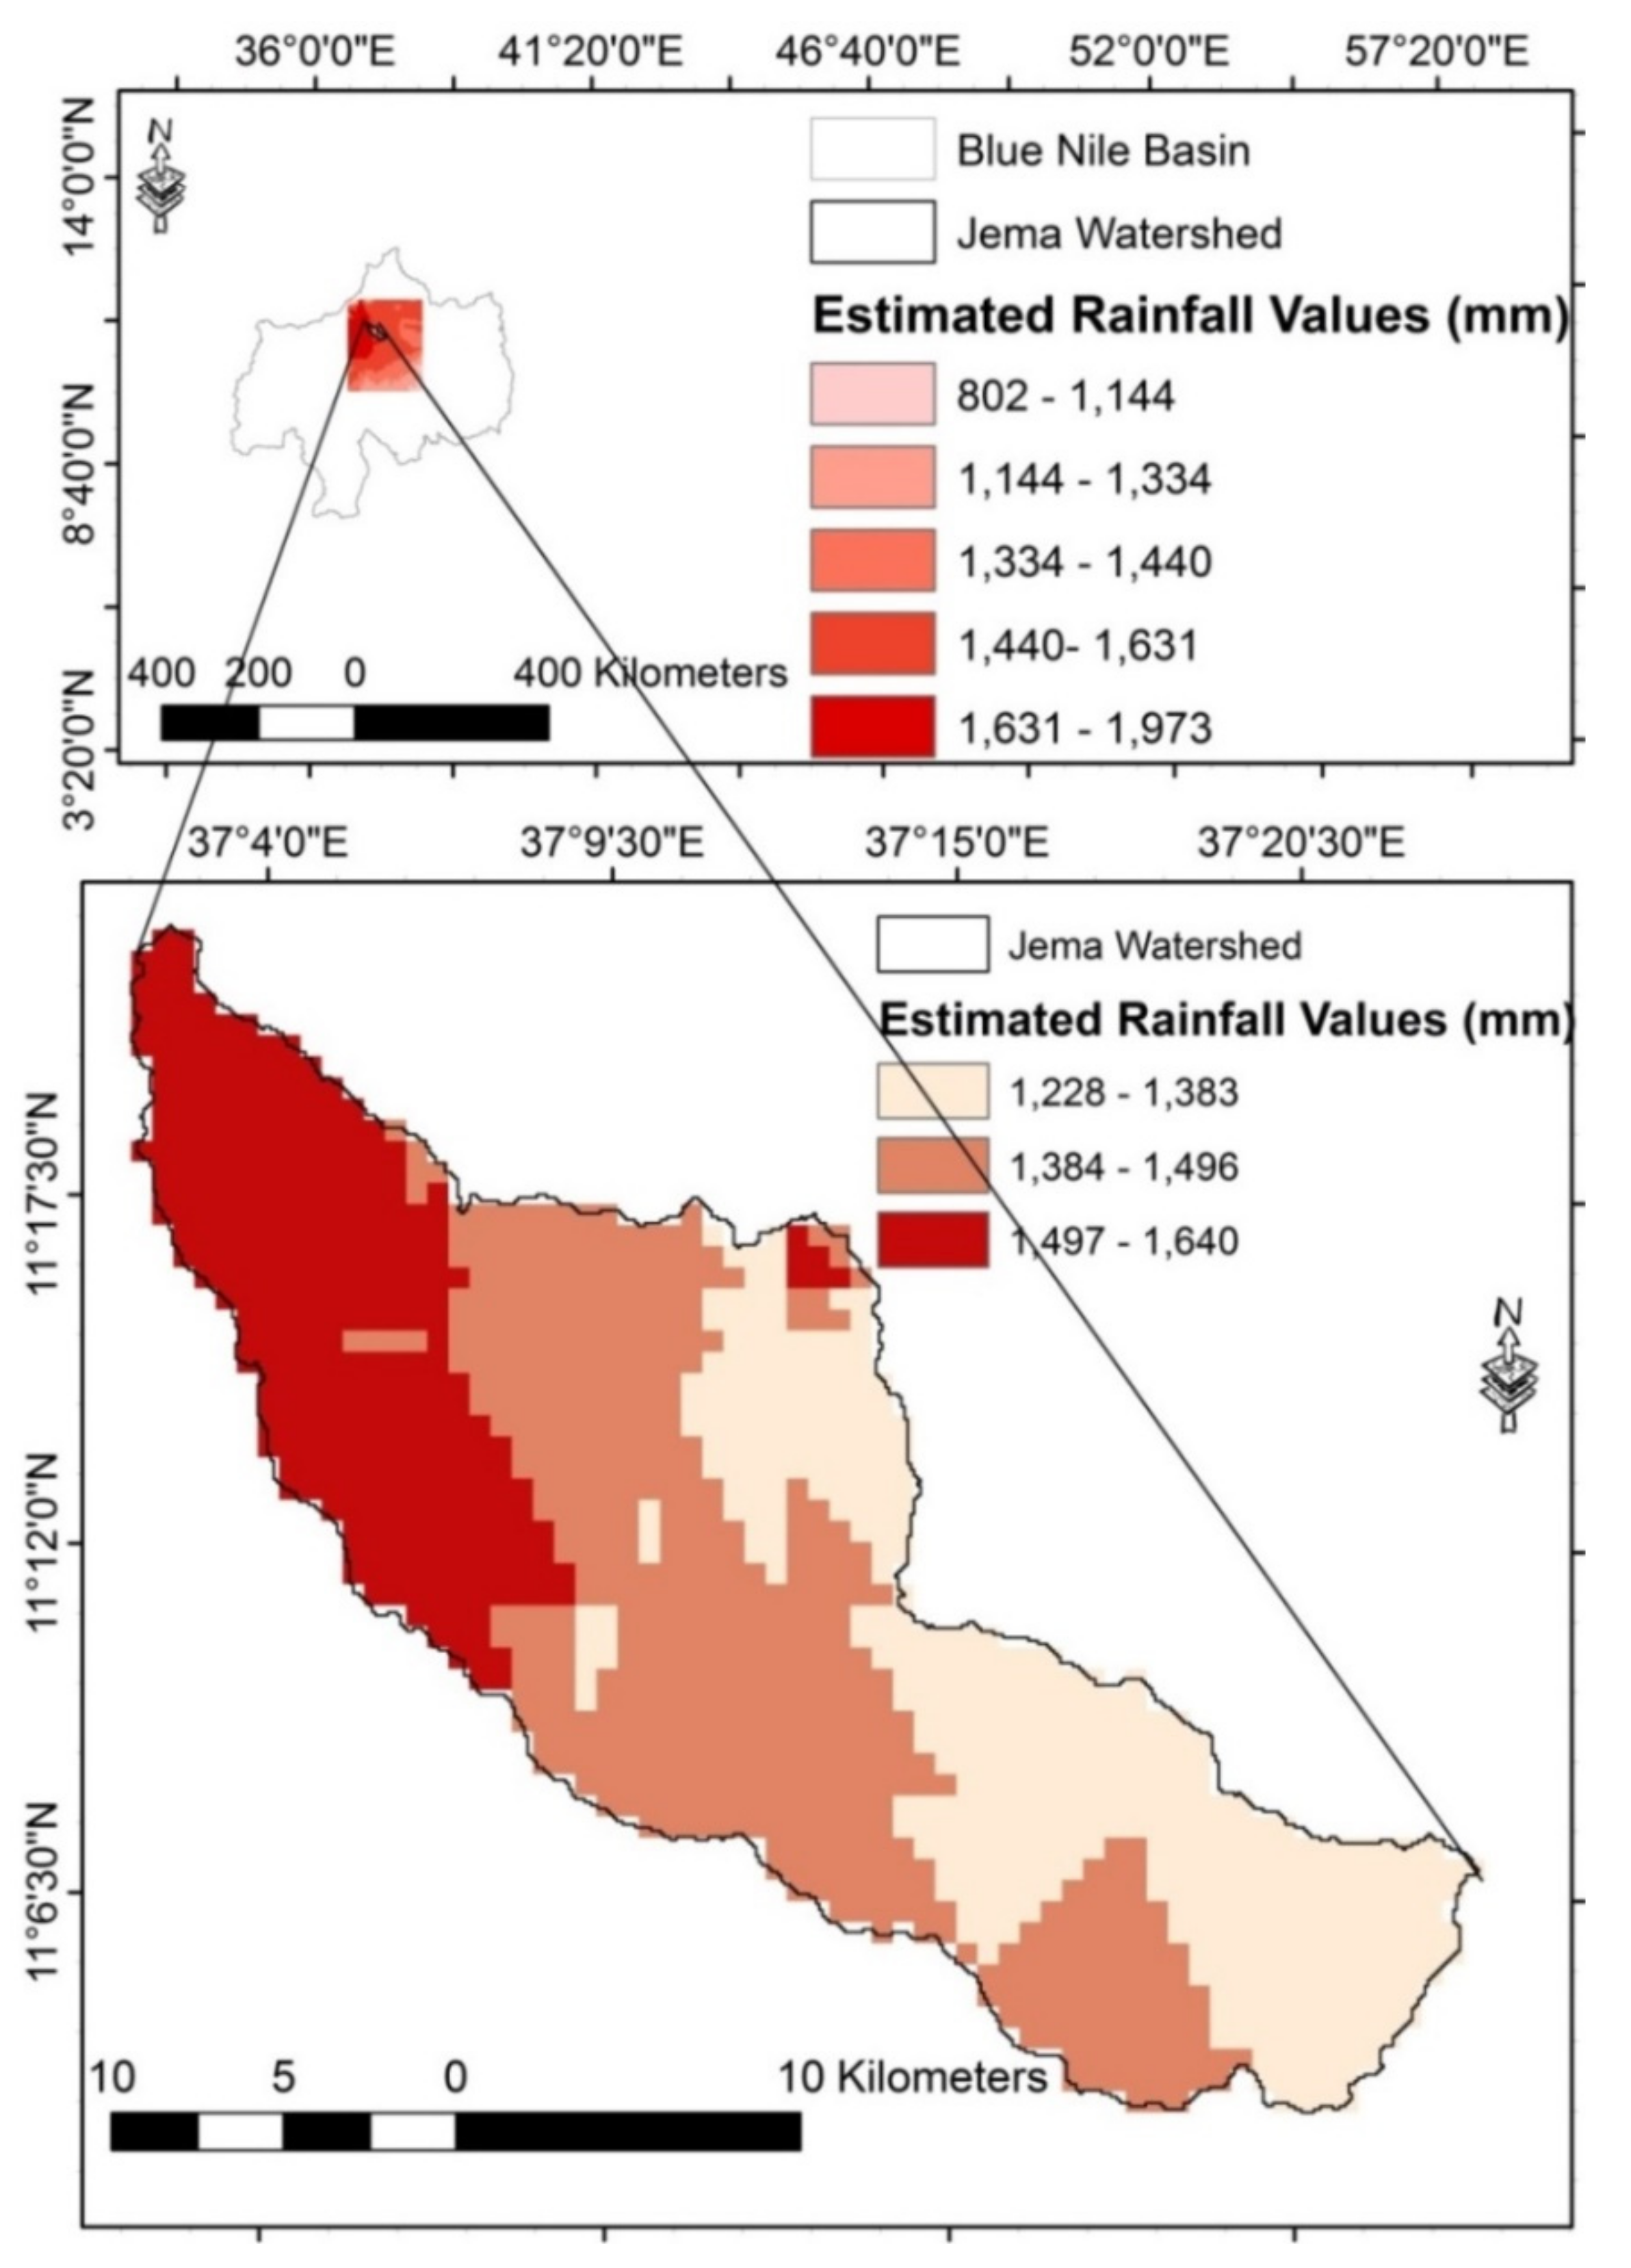
3.1. Spatiotemporal Variability of Rainfall and Temperature

The interpolated MARF for all the ACZs in the Jema watershed was found to be in the range of 1228 to 1640 mm (Table 2 and Figure 3). The MARF decreases towards sub-alpine ACZs. Based on the result of a one-way analysis of variance (ANOVA), the two-tailed p-value (0.04) was less than 0.05 (Table 3). Thus, the null hypothesis stating that there would be no significant variation among groups (H0) was rejected. Likewise, H0 was rejected for MDMaxT and MDMinT; that is, there was a significant variation in MARF, MDMaxT (°C), and MDMinT (°C) among the ACZs. In terms of MARF, all of the ACZs received sufficient rainfall (1228 to 1640 mm) to grow the local food crops; i.e., cereals and pulses. According to [26], a total annual rainfall of 1200 mm would allow the local food crops to be cultivated.
The values of the inter-annual variability (coefficient of variation) of the MARF and the MDMaxT and MDMinT data sets were found to be different among the ACZs. The coefficient of variation showed the presence of a variation of 0.18–0.88 for MARF, a variation of 0.18 to 0.85 for MDMaxT, and a variation of 0.02–0.95 for MDMinT, across the ACZs. In all of the indicators of exposure to climate variability, the lowest and highest values of coefficient of variation were observed in the moist–cool and sub-alpine ACZs, respectively.
Consistent with the results of the current study, in [16], it was reported that the mean daily maximum temperature showed increasing trends over the northern, central, and southern parts of the Upper Blue Nile river basin and showed declining trends in the western part of the basin. In the Choke Mountain ecosystem, located in the Blue Nile river basin, the annual maximum temperature has increased by an average of 0.03 °C per year since 1979 [7]. The presence of varying figures in the topic implies the complexity of microclimates in the broader region (the Blue Nile river basin) in which the study site was situated. Over the past 50 years, the mean annual minimum and maximum temperatures across Ethiopia have increased by about 0.25 °C and about 0.1 °C per decade, respectively [17].
Similar to the result of meteorological observations, farmers in all of the ACZs perceived a historical decline in MARF. On the contrary, farmers perceived a rise in temperature in the last 20 years. As a result, in the sub-alpine ACZ (especially at the highest part of Birr Adama Mountain, where the Jema watershed has its source), no accumulation of ice has been observed within around the last 20 years; in contrast, ice accumulation was commonly observed before this time.
The local farmers noted that the length of the growing period has increased in the upstream part of the watershed mainly due to a rise in temperature. The cultivation of maize and tef has spread to higher elevations in the moist–cold and sub-alpine ACZs, respectively. The production of onion, oat (Avena sativa), local wheat or temezh (Triticum), and pea (Pisum sativum) has been abandoned by many farmers in the upstream region of the Jema watershed, whereas the production of linseed or telba (Linmu usitatisimum), barley (Hordeum vulgare), and nigeror nug (Guizotia abyssinica) has been abandoned by many farmers in the downstream regions. The rise of temperature also caused the appearance of malaria, crop pests, and weeds in the cold and moist–cold ACZs. Due to the rise in temperature, the length of the growing period reduced by a large amount in the upstream (moist–cold) ACZ.
As stated in [38]—conducted in Northwestern Ethiopia—the inter-annual variability of MARF observed in the study area was related to El Niño. The inter-annual variability of Ethiopia’s June–September rainy season was primarily governed by the ENSO and secondarily reinforced by more local climate indicators near Africa and the Atlantic and Indian oceans. In 2015/2016, a strong El Niño caused droughts and crop failure in Ethiopia during the whole of the spring and summer rainy seasons [15].

3.2. Degree of Exposure to Climate Variability among the ACZs

To allow a comparison between the degree of exposure to climate variability among the ACZs, the results mentioned above were standardized (indexed) and summarized (Figure 4 and Table 4). The aggregated indexed values ranged from 0.16–0.89. The highest value was observed in the ACZs located at higher elevations, namely the sub-alpine and moist–cold ACZs. Overall, higher-elevation areas that are situated towards the east of the watershed were found to be more vulnerable to climate variability. A small-scale (country-level) study [7] identified the same parameters of climate variability indicated above as the major risks in the ACZs of northwestern Ethiopia. Moreover, due to the 2015/2016 ENSO event, drought was more severe towards the eastern part of Amhara Regional State [15], which is nearer to the upstream part of the study watershed.

4. Conclusions and Recommendations

The aggregate indexed value of exposure to various climate indicators (variability of temperature and rainfall) for the Jema watershed ranged from 0.13 to 0.89. The indexed value increased from the lower to higher-elevation areas. Climate variability is one of the environmental hazards in the watershed. In relative terms, due to the variability of MARF (mm), MDMinT (°C), and MDMaxT (°C), the ACZs situated at higher elevations (the moist–cold and sub-alpine ACZs) are more exposed to climate variability. In terms of facing climatic hazards, the livelihood of people who live in the upstream is more vulnerable. The overall crop diversity declined across the ACZs of the watershed. However, the climate became suitable for cultivating maize and tef at higher elevations. As part of adapting to the existing climate variability, the capacity of institutions to forecast and disseminate agro-meteorological conditions needs to be strengthened more in the higher-elevation area. In order to adapt to the inter-annual variability of the rainy season, early-maturing crops and improved seeds need to be introduced in the watershed, especially in the higher-elevation zones. It is also essential to take actions such as revisiting crop calendars and crop zones in the ACZs of tropical highlands.

Author Contributions

Conceptualization, M.T.; Formal analysis, M.T.; Investigation, M.T.; Methodology, M.T.; Supervision, B.S., B.F.Z., S.S. and Y.G.S.; Writing—original draft, M.T.

Funding

This research was funded by Belmont Forum: via NSF award ICER-1624335.

Conflicts of Interest

The authors declare no conflict of interest.

References

  1. Food and Agriculture Organization (FAO). Land Evaluation towards a Revised Framework; Land and Water Discussion Paper; FAO: Rome, Italy, 2007; Volume 6. [Google Scholar]
  2. Mearns, R.; Norton, A. The Social Dimensions of Climate Change: Equity and Vulnerability in a Warming World; The World Bank: Washington, DC, USA, 2009. [Google Scholar]
  3. Field, C.B. (Ed.) Climate Change 2014–Impacts, Adaptation and Vulnerability: Regional Aspects; Cambridge University Press: Cambridge, UK, 2014. [Google Scholar]
  4. Solomon, S.; Qin, D.; Manning, M.; Averyt, K.; Marquis, M. (Eds.) Climate Change 2007-the Physical Science Basis: Working Group I Contribution to the Fourth Assessment Report of the IPCC; Cambridge University Press: Cambridge, UK, 2007. [Google Scholar]
  5. Tessema, I.; Simane, B. Vulnerability analysis of smallholder farmers to climate variability and change: An agro-ecological system-based approach in the Fincha’a sub-basin of the upper Blue Nile Basin of Ethiopia. Ecol. Process. 2019, 8, 5. [Google Scholar] [CrossRef]
  6. Deressa, T.T.; Hassan, R.M.; Ringler, C.; Alemu, T.; Yesuf, M. Determinants of farmers’ choice of adaptation methods to climate change in the Nile Basin of Ethiopia. Glob. Environ. Chang. 2009, 19, 248–255. [Google Scholar] [CrossRef]
  7. Simane, B.; Zaitchik, B.F.; Foltz, J.D. Agroecosystem specific climate vulnerability analysis: Application of the livelihood vulnerability index to a tropical highland region. Mitig. Adapt. Strateg. Glob. Chang. 2016, 21, 39–65. [Google Scholar] [CrossRef] [PubMed]
  8. Hurni, H.; Tato, K.; Zeleke, G. The implications of changes in population, land use, and land management for surface runoff in the upper Nile basin area of Ethiopia. Mt. Res. Dev. 2005, 25, 147–155. [Google Scholar] [CrossRef]
  9. Taye, M.; Simane, B.; Zaitchik, B.F.; Yihenew, G.S.; Setegn, S. Land Use Evaluation over the Jema Watershed, in the Upper Blue Nile River Basin, Northwestern Highlands of Ethiopia. Land 2019, 8, 50. [Google Scholar] [CrossRef]
  10. Arnell, N.W. Climate change and global water resources: SRES emissions and socio-economic scenarios. Glob. Environ. Chang. 2004, 1, 31–52. [Google Scholar] [CrossRef]
  11. Fekadu, K. Ethiopian seasonal rainfall variability and prediction using canonical correlation analysis (CCA). Earth Sci. 2015, 4, 112–119. [Google Scholar] [CrossRef]
  12. Bewket, W. Rainfall variability and crop production in Ethiopia: Case study in the Amhara region. In Proceedings of the 16th International Conference of Ethiopian Studies, Trondheim, Norway, 2–7 July 2007. [Google Scholar]
  13. Seleshi, Y.; Zanke, U. Recent changes in rainfall and rainy days in Ethiopia. Int. J. Climatol. 2004, 24, 973–983. [Google Scholar] [CrossRef]
  14. Verdin, J.; Funk, C.; Senay, G.; Choularton, R. Climate science and famine early warning. Philos. Trans. R. Soc. B Biol. Sci. 2005, 360, 2155–2168. [Google Scholar] [CrossRef] [PubMed]
  15. Funk, C.; Harrison, L.; Shukla, S.; Korecha, D.; Magadzire, T.; Husak, G.; Galu, G.; Hoell, A. Assessing the contributions of local and east Pacific warming to the 2015 droughts in Ethiopia and Southern Africa. Bull. Am. Meteorol. Soc. 2016, 97, S75–S80. [Google Scholar] [CrossRef]
  16. Mengistu, D.; Bewket, W.; Lal, R. Recent spatiotemporal temperature and rainfall variability and trends over the Upper Blue Nile River Basin, Ethiopia. Int. J. Climatol. 2014, 34, 2278–2292. [Google Scholar] [CrossRef]
  17. National Meteorological Agency. Initial National Communication of Ethiopia to the United Nations Framework Convention on Climate Change (UNFCCC); FSS Discussion Paper No. 9; NMA: Addis Ababa, Ethiopia, 2007. [Google Scholar]
  18. Shanko, D.; Camberlin, P. The effects of the Southwest Indian Ocean tropical cyclones on Ethiopian drought. Int. J. Climatol. 1998, 18, 1373–1388. [Google Scholar] [CrossRef]
  19. Taye, M.; Simane, B.; Zaitchik, B.; Setegn, S.; Selassie, Y. Analysis of the Spatial Patterns of Rainfall across the Agro-Climatic Zones of Jema Watershed in the Northwestern Highlands of Ethiopia. Geosciences 2019, 9, 22. [Google Scholar] [CrossRef]
  20. Roe, G.H. Orographic precipitation. Annu. Rev. Earth Planet. Sci. 2005, 33, 645–671. [Google Scholar] [CrossRef]
  21. Thornton, P.K.; Jones, P.G.; Alagarswamy, G.; Andresen, J. Spatial variation of crop yield response to climate change in East Africa. Glob. Environ. Chang. 2009, 19, 54–65. [Google Scholar] [CrossRef]
  22. Segele, Z.T.; Lamb, P.J. Characterization and variability of Kiremt rainy season over Ethiopia. Meteorol. Atmos. Phys. 2005, 89, 153–180. [Google Scholar] [CrossRef]
  23. Hurni, H. Degradation and conservation of the resources in the Ethiopian highlands. Mt. Res. Dev. 1988, 8, 123–130. [Google Scholar] [CrossRef]
  24. Devereux, S. Livelihood insecurity and social protection: A re-emerging issue in rural development. Dev. Policy Rev. 2001, 19, 507–519. [Google Scholar] [CrossRef]
  25. Mesfin, W. Rural Vulnerability to Famine in Ethiopia 1958–1977; Vicas: New Delhi, India, 1984. [Google Scholar]
  26. Ministry of Agriculture and Rural Development (MOARD). Agroclimatic Zonation of Ethiopia; Ministry of Agriculture and Rural Development: Addis Ababa, Ethiopia, 2000.
  27. Taye, M.; Simane, B.; Yihenew, G.S.; Zaitchik, B.; Setegn, S. Analysis of the Spatial Variability of Soil Texture in a Tropical Highland: The Case of the Jema Watershed, Northwestern Highlands of Ethiopia. Int. J. Environ. Res. Public Health 2018, 15, 1903. [Google Scholar] [CrossRef] [PubMed]
  28. Wossen, T.; Berger, T.; Haile, M.G.; Troost, C. Impacts of climate variability and food price volatility on household income and food security of farm households in East and West Africa. Agric. Syst. 2018, 163, 7–15. [Google Scholar] [CrossRef]
  29. Di Falco, S.; Yesuf, M.; Kohlin, G.; Ringler, C. Estimating the impact of climate change on agriculture in low-income countries: Household level evidence from the Nile Basin, Ethiopia. Environ. Resour. Econ. 2012, 52, 457–478. [Google Scholar] [CrossRef]
  30. Wossen, T.; Berger, T. Climate variability, food security and poverty: Agent-based assessment of policy options for farm households in Northern Ghana. Environ. Sci. Policy 2015, 47, 95–107. [Google Scholar] [CrossRef]
  31. Poppe, L.; Frankl, A.; Poesen, J.; Admasu, T.; Dessie, M.; Adgo, E.; Deckers, J.; Nyssen, J. Geomorphology of the Lake Tana basin, Ethiopia. J. Maps 2013, 9, 431–437. [Google Scholar] [CrossRef]
  32. Ministry of Agriculture and Rural Development (MOARD). Sustainable Land Use Technologies and Approaches in Ethiopia. Ethiopian Overview of Conservation Approaches and Technologies (EthiOCAT); Ministry of Agriculture and Rural Development: Addis Ababa, Ethiopia, 2010.
  33. Agriculture Organization for the United Nations. World Reference Base for Soil Resources; Food & Agriculture Organization of the United Nations: Rome, Italy, 1998. [Google Scholar]
  34. Bureau of Finance and Economic Development (BOFED). Population Affaires Core Process Based on 2012 Inter-Censal Survey; State Development Indicator; Amhara National Regional State: Bair Dar, Ethiopia, 2014.
  35. Ghosh, B.N. Scientific Method and Social Research; Stosius Inc./Advent Books Division: New Delhi, India, 1985. [Google Scholar]
  36. Kothari, C.R. Research Methodology: Methods and Techniques; New Age International: New Delhi, India, 2004. [Google Scholar]
  37. Hahn, M.B.; Riederer, A.M.; Foster, S.O. The Livelihood Vulnerability Index: A pragmatic approach to assessing risks from climate variability and change—A case study in Mozambique. Glob. Environ. Chang. 2009, 19, 74–88. [Google Scholar] [CrossRef]
  38. Korecha, D.; Barnston, A.G. Predictability of June–September rainfall in Ethiopia. Mon. Weather Rev. 2007, 135, 628–650. [Google Scholar] [CrossRef]
Figure 1. Location map of the agro-climatic zones (ACZs) of the Jema watershed [19].
Environments 06 00118 g001
Figure 2. The distribution of meteorological stations used for this study [19].
Environments 06 00118 g002
Figure 3. Kriging values of the mean annual rainfall (MARF, in mm) in different elevation zones of the Jema watershed [19].
Environments 06 00118 g003
Figure 4. The aggregated index values of exposure to climate variability among the ACZs of the Jema watershed.
Environments 06 00118 g004
Table 1. Spatial coverage of the agro-climatic zones (ACZs) of the Jema watershed as computed from a digital elevation model (DEM) with a resolution of 30 m [27].
Elevation (m a.s.l.)
Area (ha)
ACZ
Moist–CoolColdMoist–ColdSub-AlpineWatershed
1895–23002301–27002701–32003201–35181895–3518
28,690.5314,863.514253.62436.4648,244.12
%593191100
Table 2. Mean annual rainfall (MARF, in mm), mean daily maximum temperature (MDMaxT, in °C), and mean daily minimum temperature (MDMinT, in °C) for the ACZs of the Jema watershed [19].
ACZElevation (m)MARF (mm)MDMaxT (°C)MDMinT (°C)
Moist–cool1895–2300164026.5310.33
Cold2301–2700154025.339.86
Moist–cold2701–3200142023.127.52
Sub-alpine3201–3518122821.014.71
Note: Df (degree of freedom) = 3.
Table 3. Result of single-factor one-way analysis of variance (ANOVA) for MARF, MDMaxT, and MDMinT among the ACZs.
Source of VariationDependent Variablep-Value
Between groupsMARF (mm)0.04
MDMaxT (°C)0.01
MDMinT (°C)0.04
Table 4. The indexed values for indicators of exposure to climate variability in the ACZs of the Jema watershed.
Watershed MaximumWatershed MinimumMoist–CoolIndex Value for Moist–CoolColdIndex Value for ColdMoist–ColdIndex Value for Moist–ColdSub-AlpineIndex Value for Sub-Alpine
Coefficient of variation for MARF (mm)11.008.008.540.189.420.4710.560.8510.630.88
Coefficient of variation for MDMaxT (°C)10.207.007.580.187.970.308.820.579.710.85
Coefficient of variation for MDMinT (°C)39.5016.0016.460.0217.850.0823.800.3338.430.95
Average 0.13 0.28 0.58 0.89

