Impact of Zirconium on Freshwater Periphytic Microorganisms


Abstract
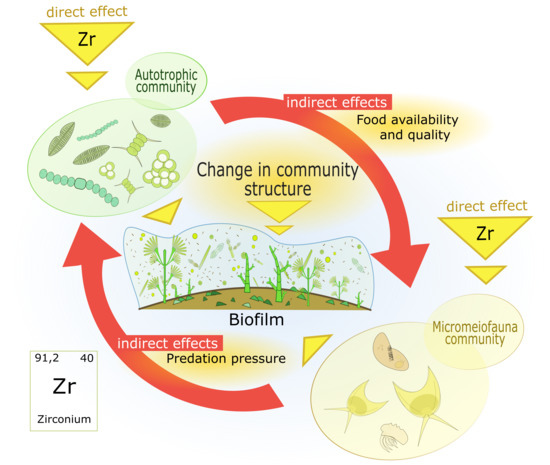
1. Introduction
2. Materials and Methods
2.1. Experimental Setup
2.2. Biofilm Microorganisms Analysis
2.3. Data Treatment
3. Results
3.1. Physicochemical Conditions
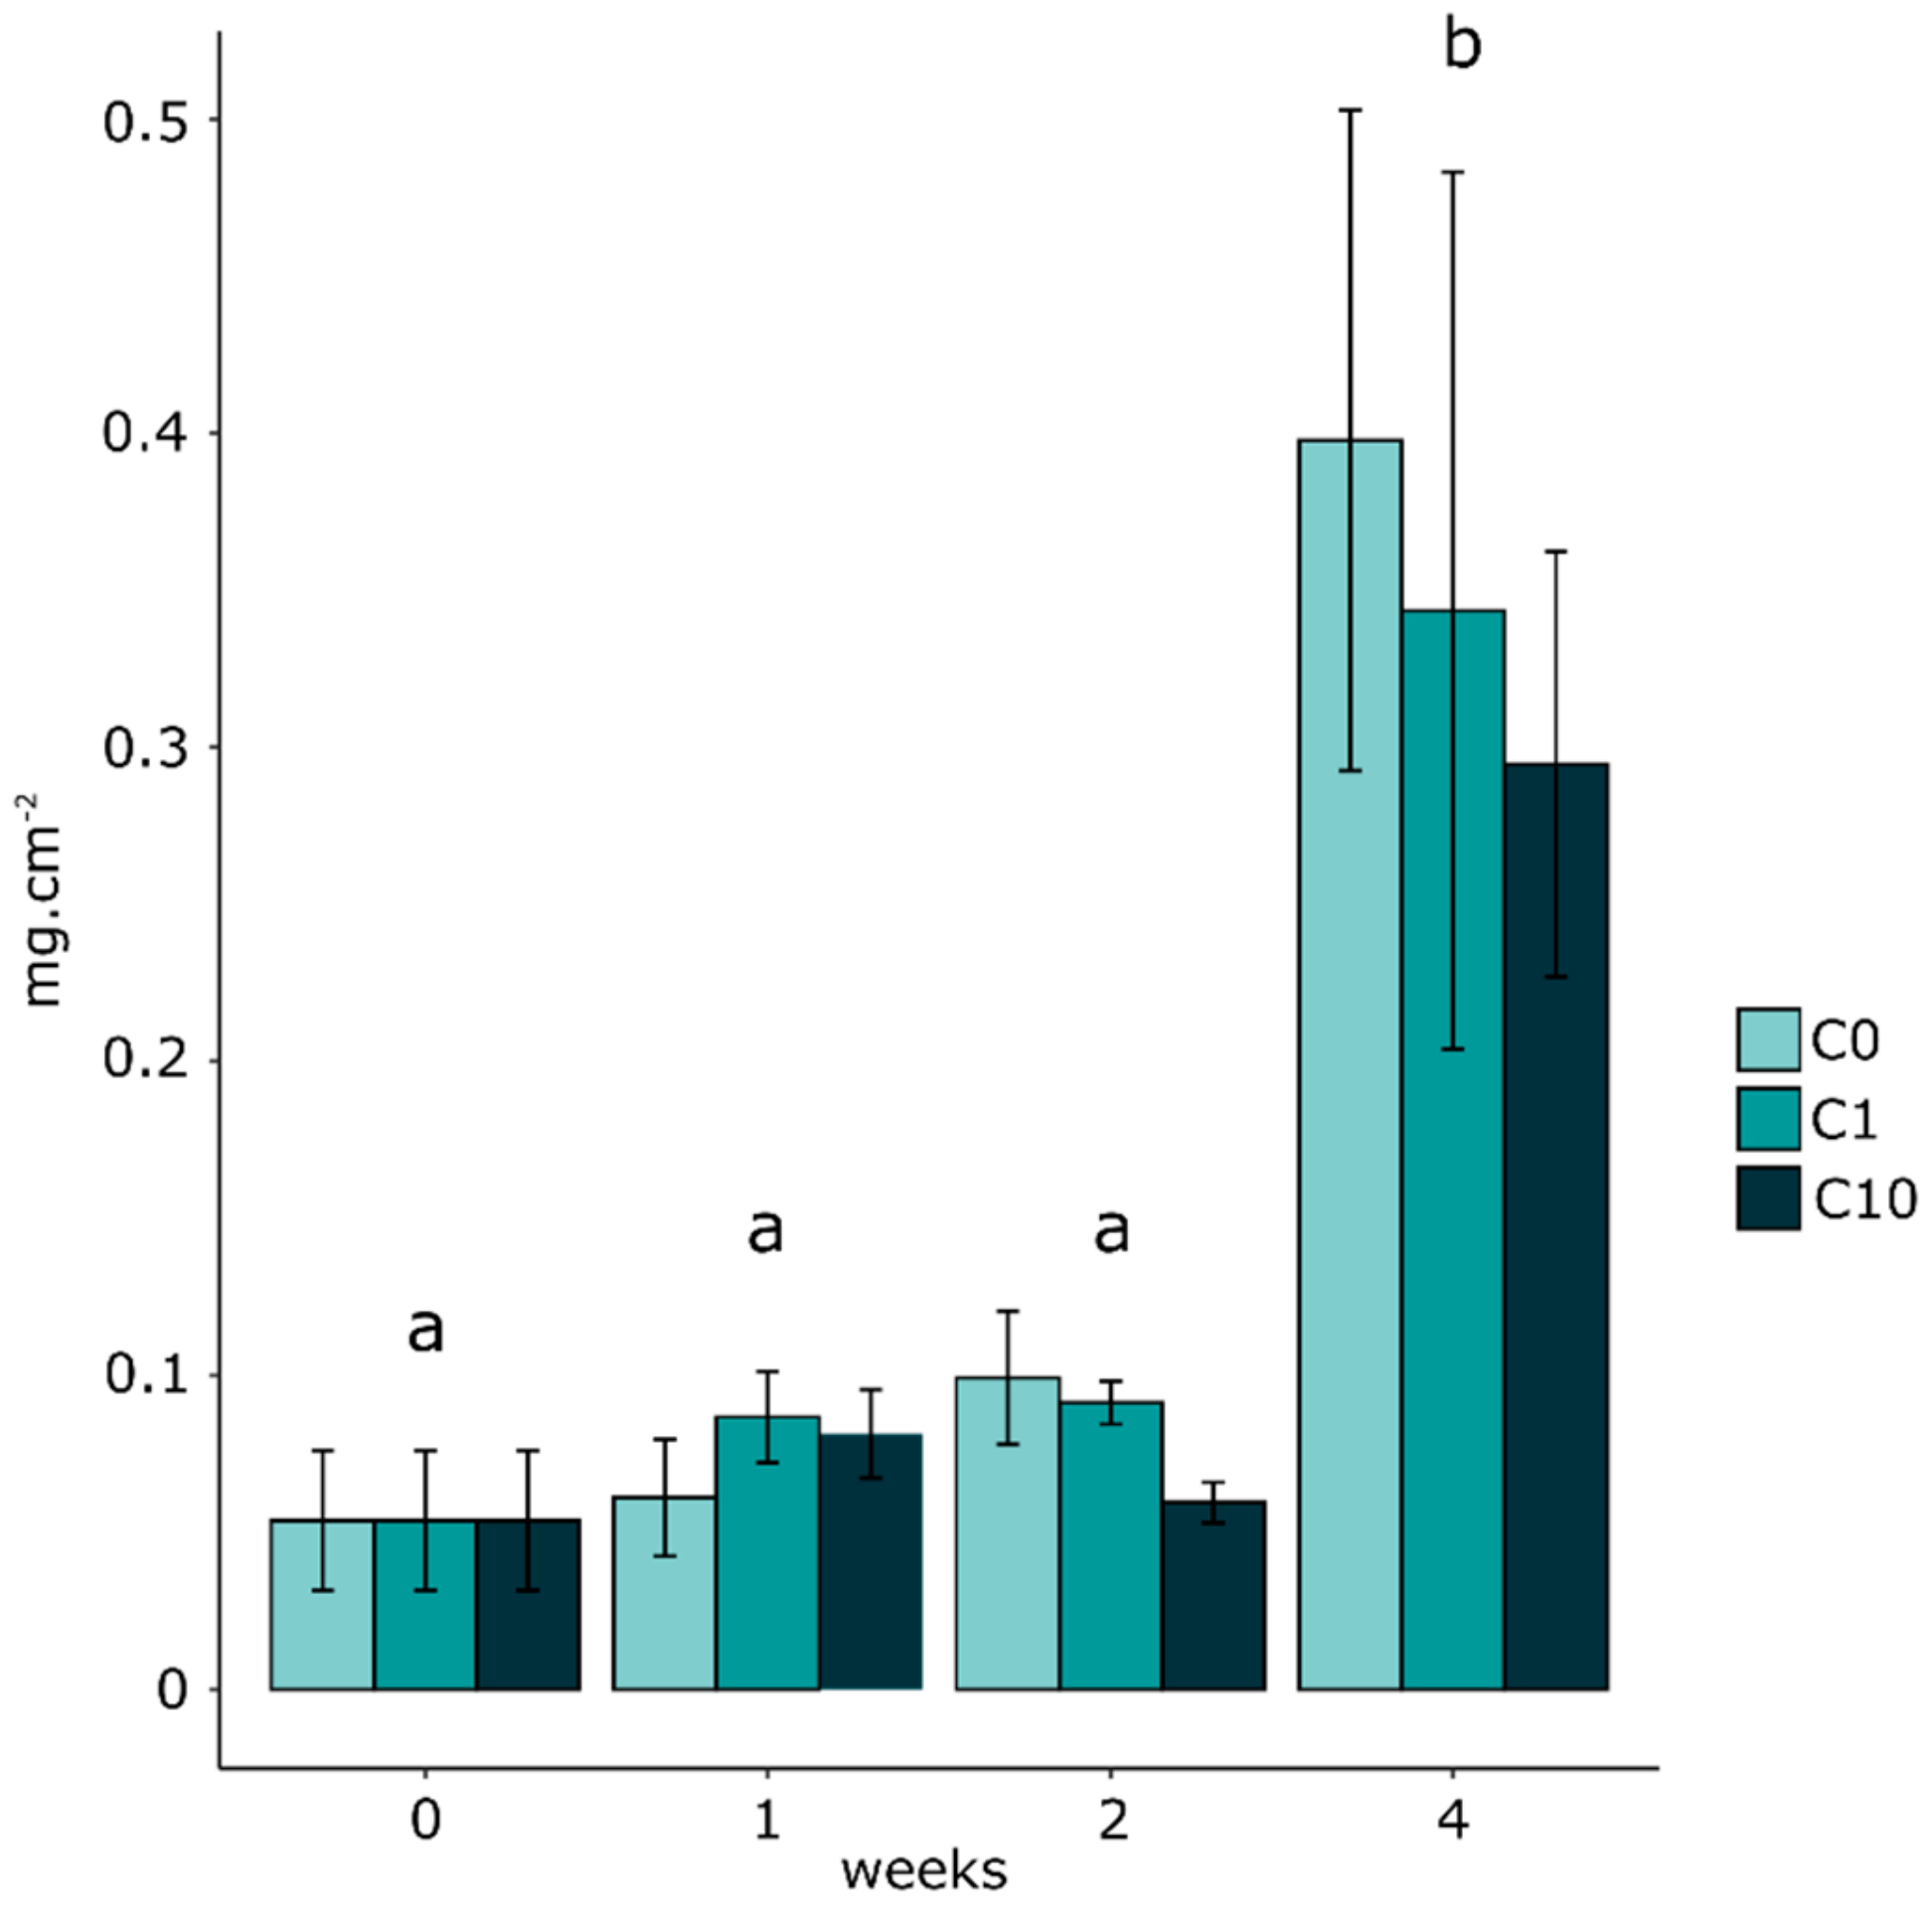
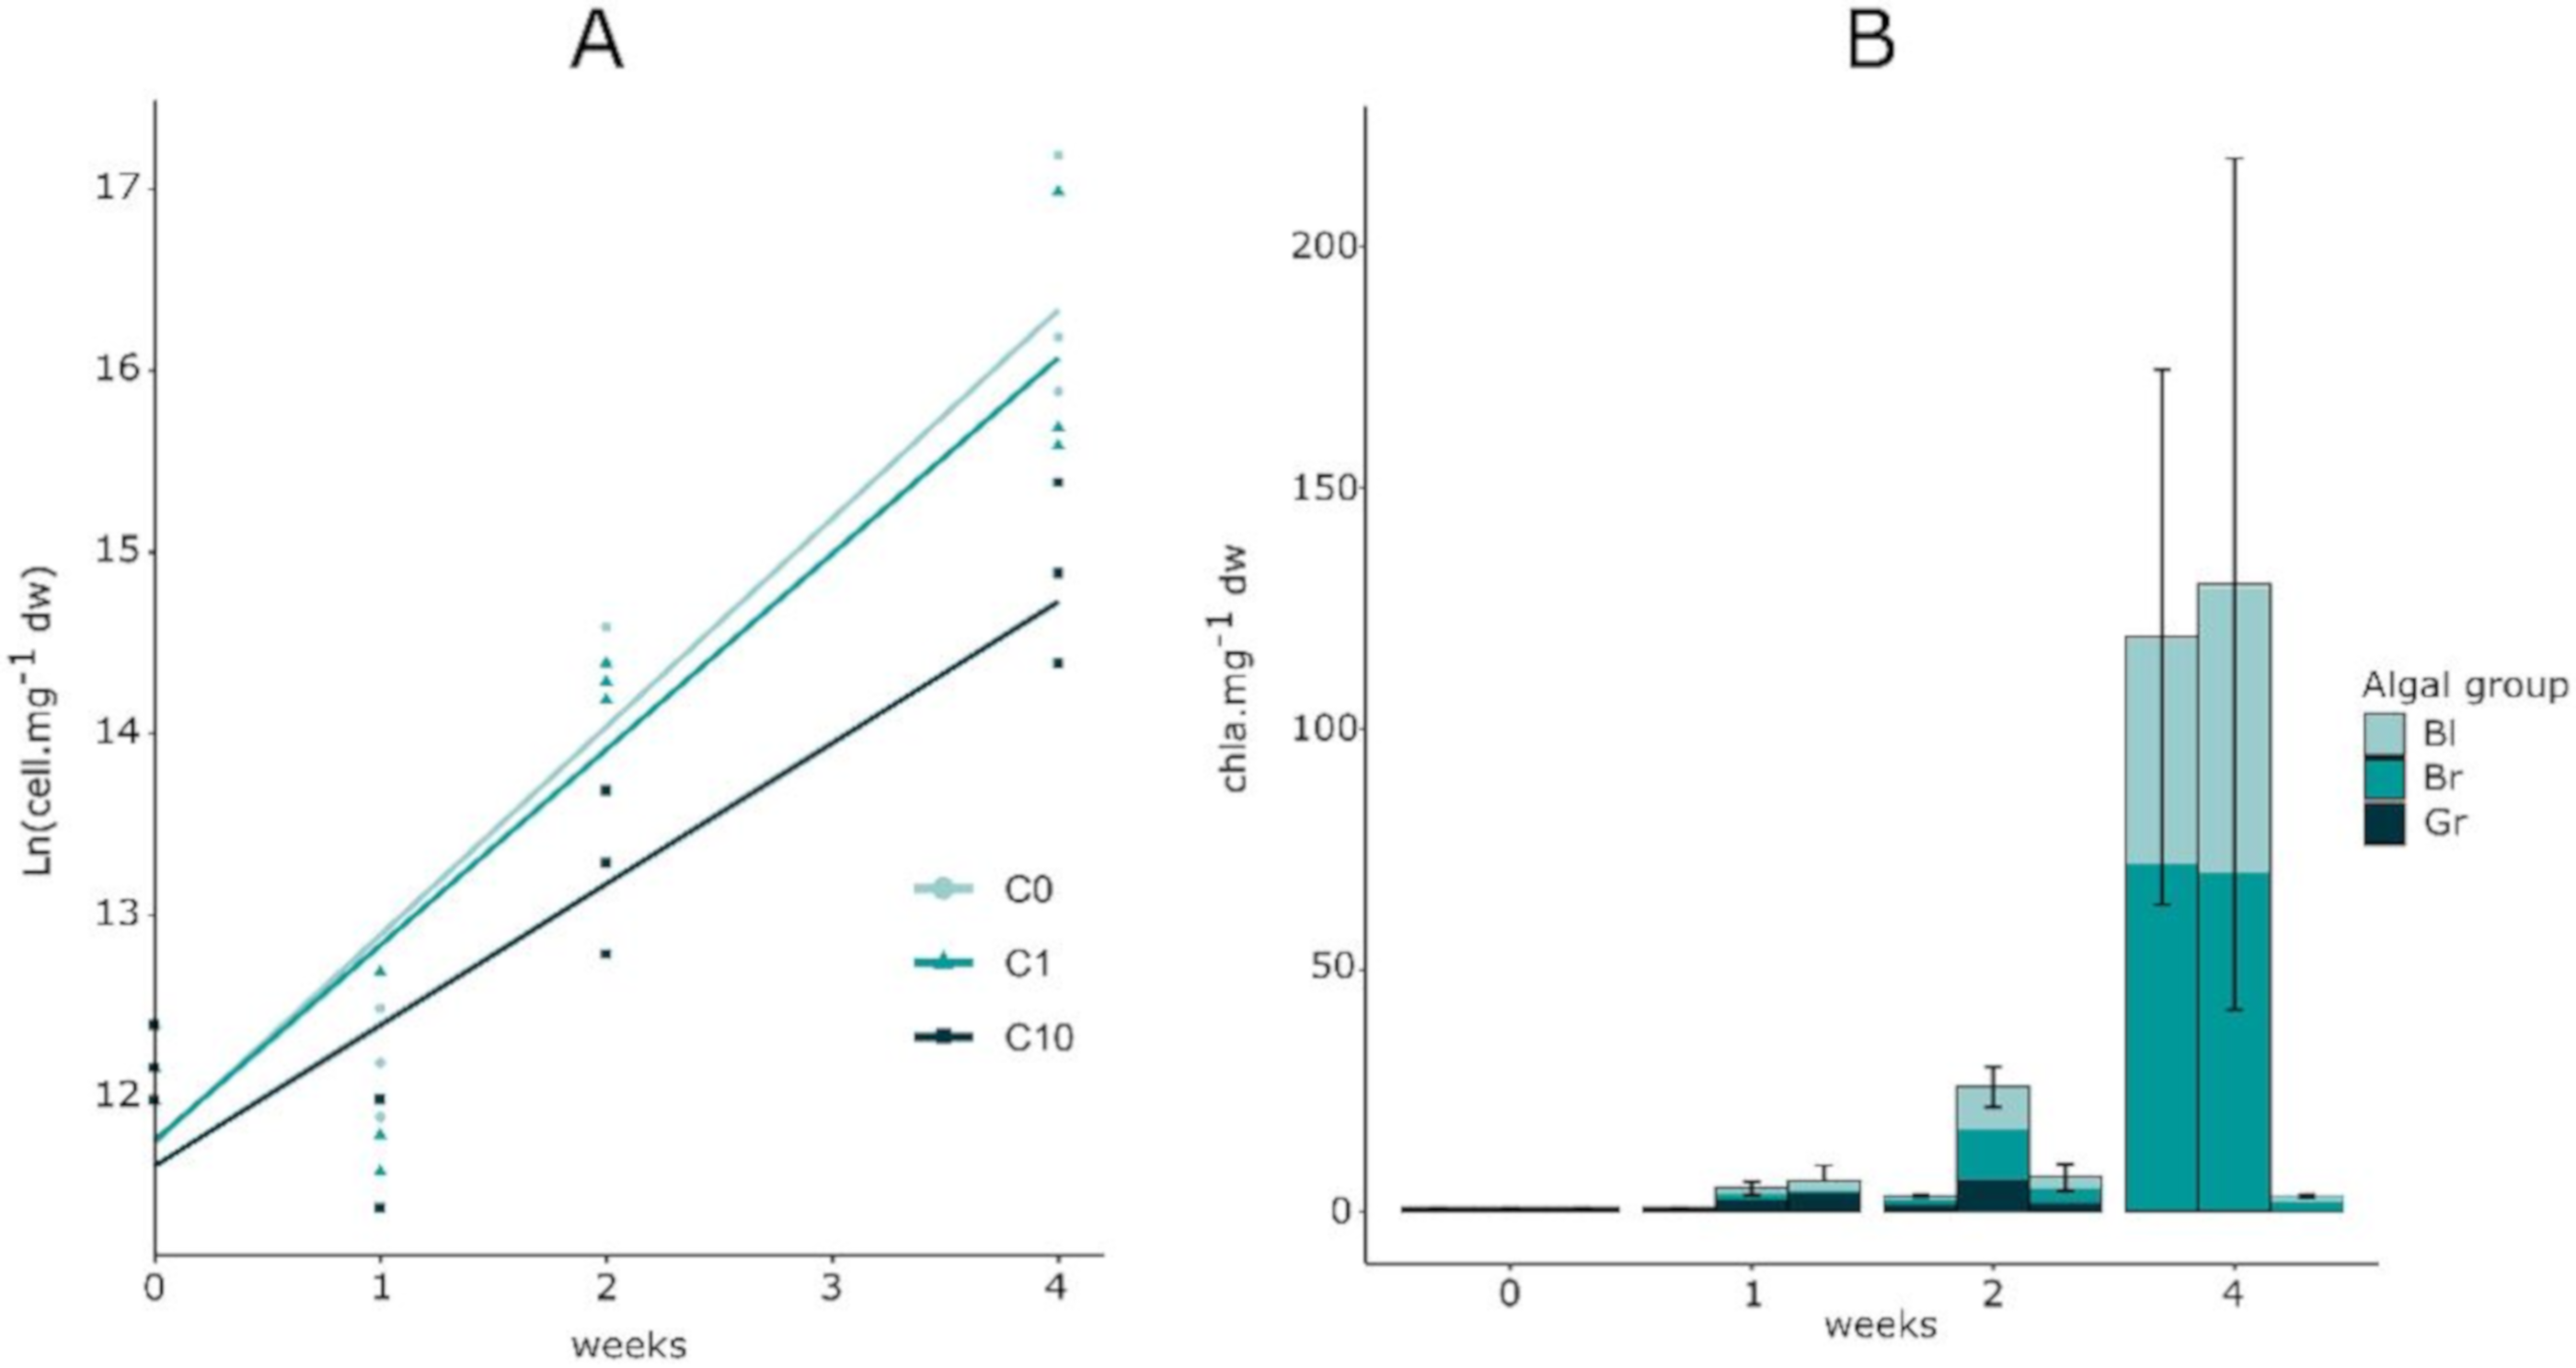
3.2. Biofilm Biomass and Zr Effects on Autotrophic Organism Composition
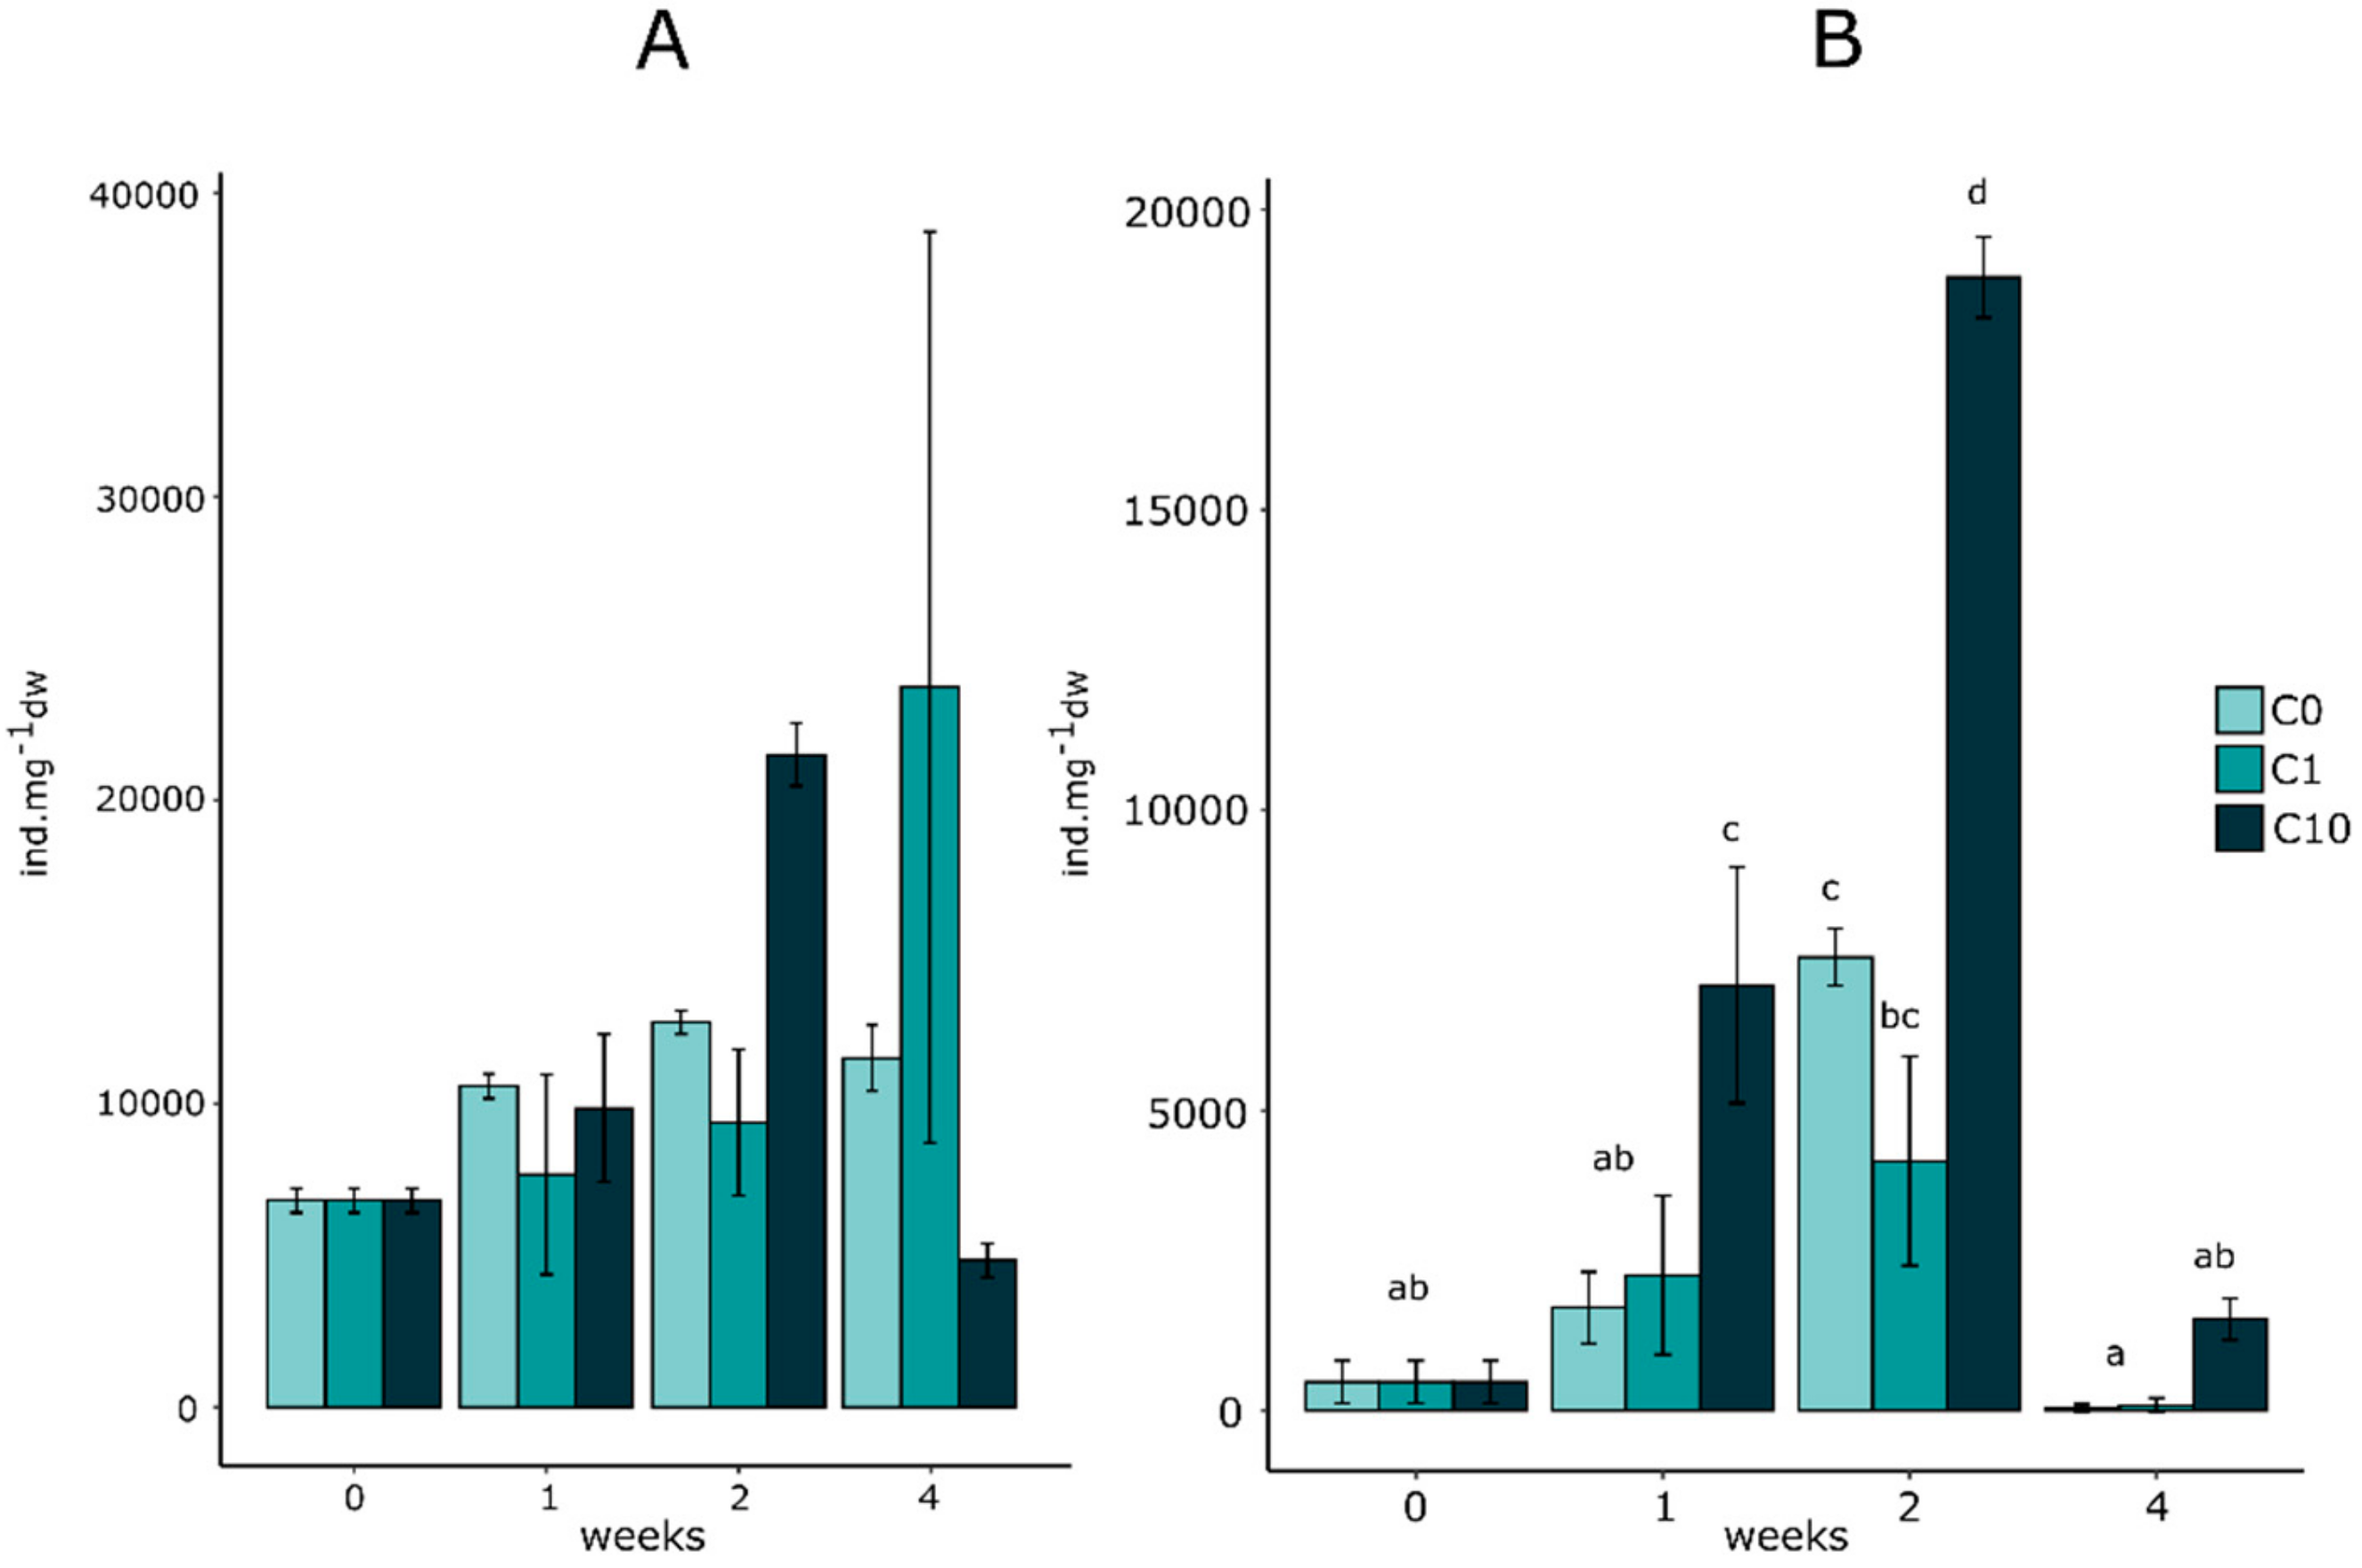
3.3. Effect on Micromeiofauna Composition
3.3.1. Total Counted Individuals
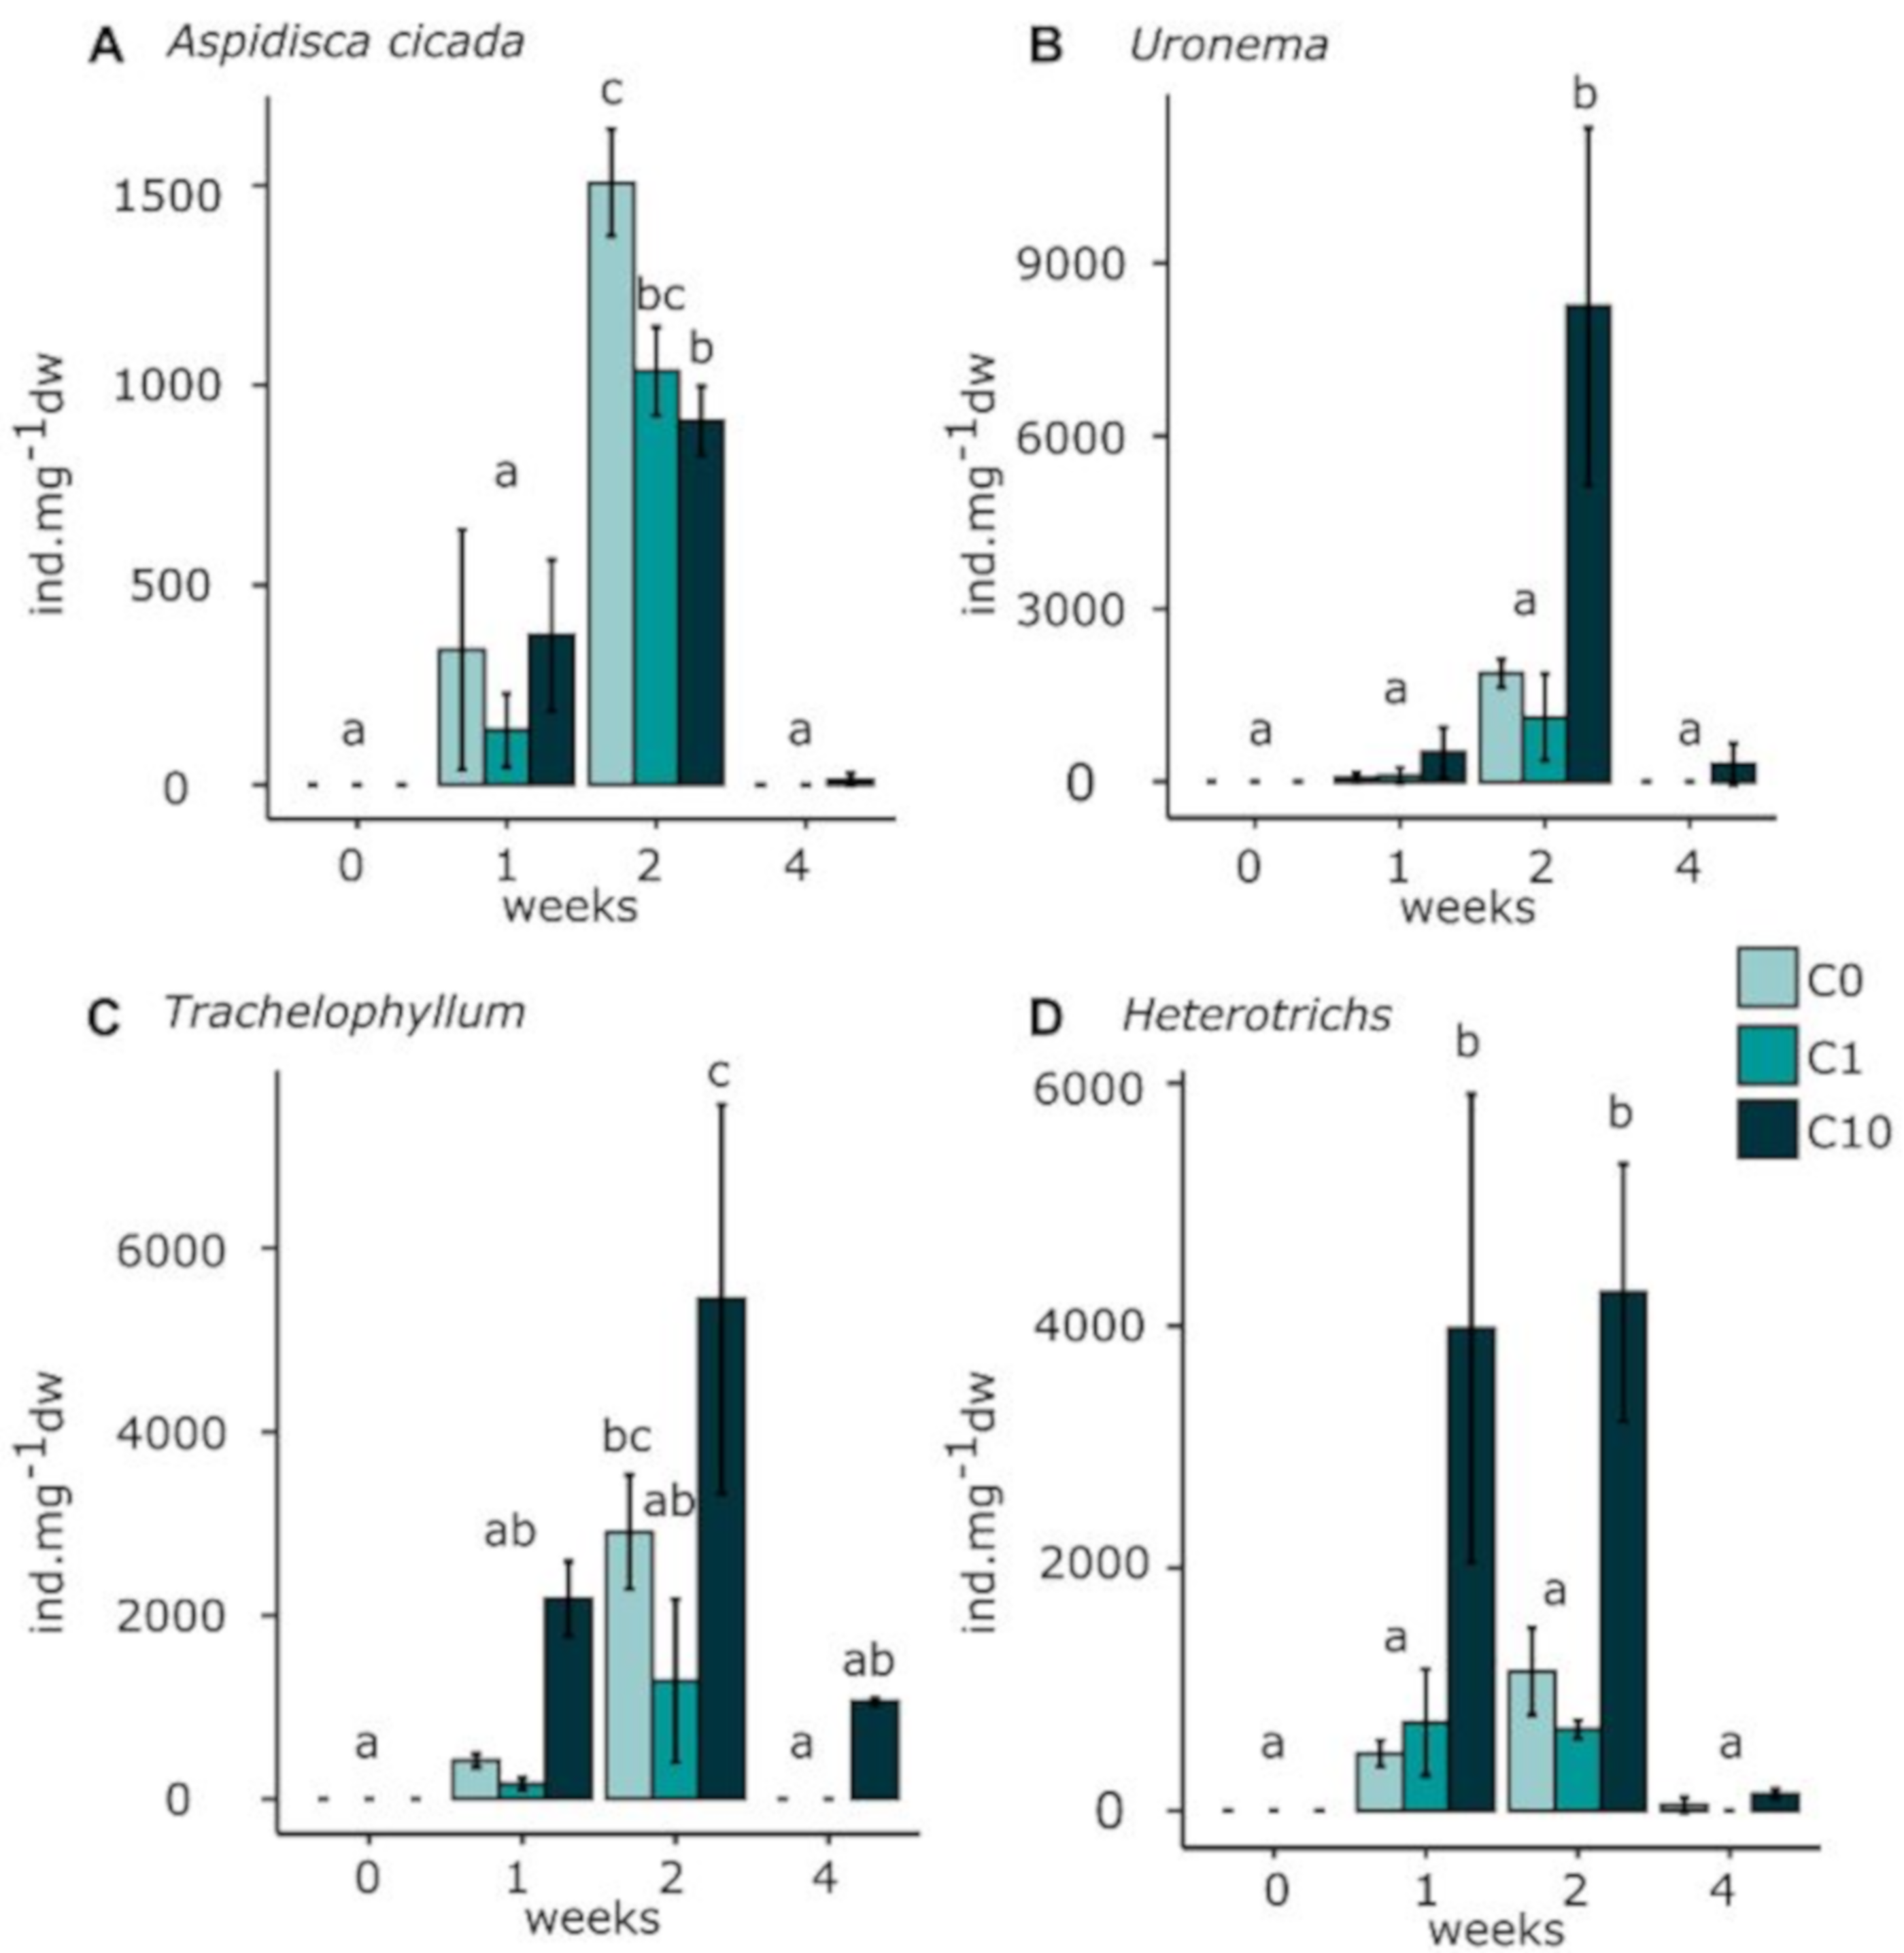
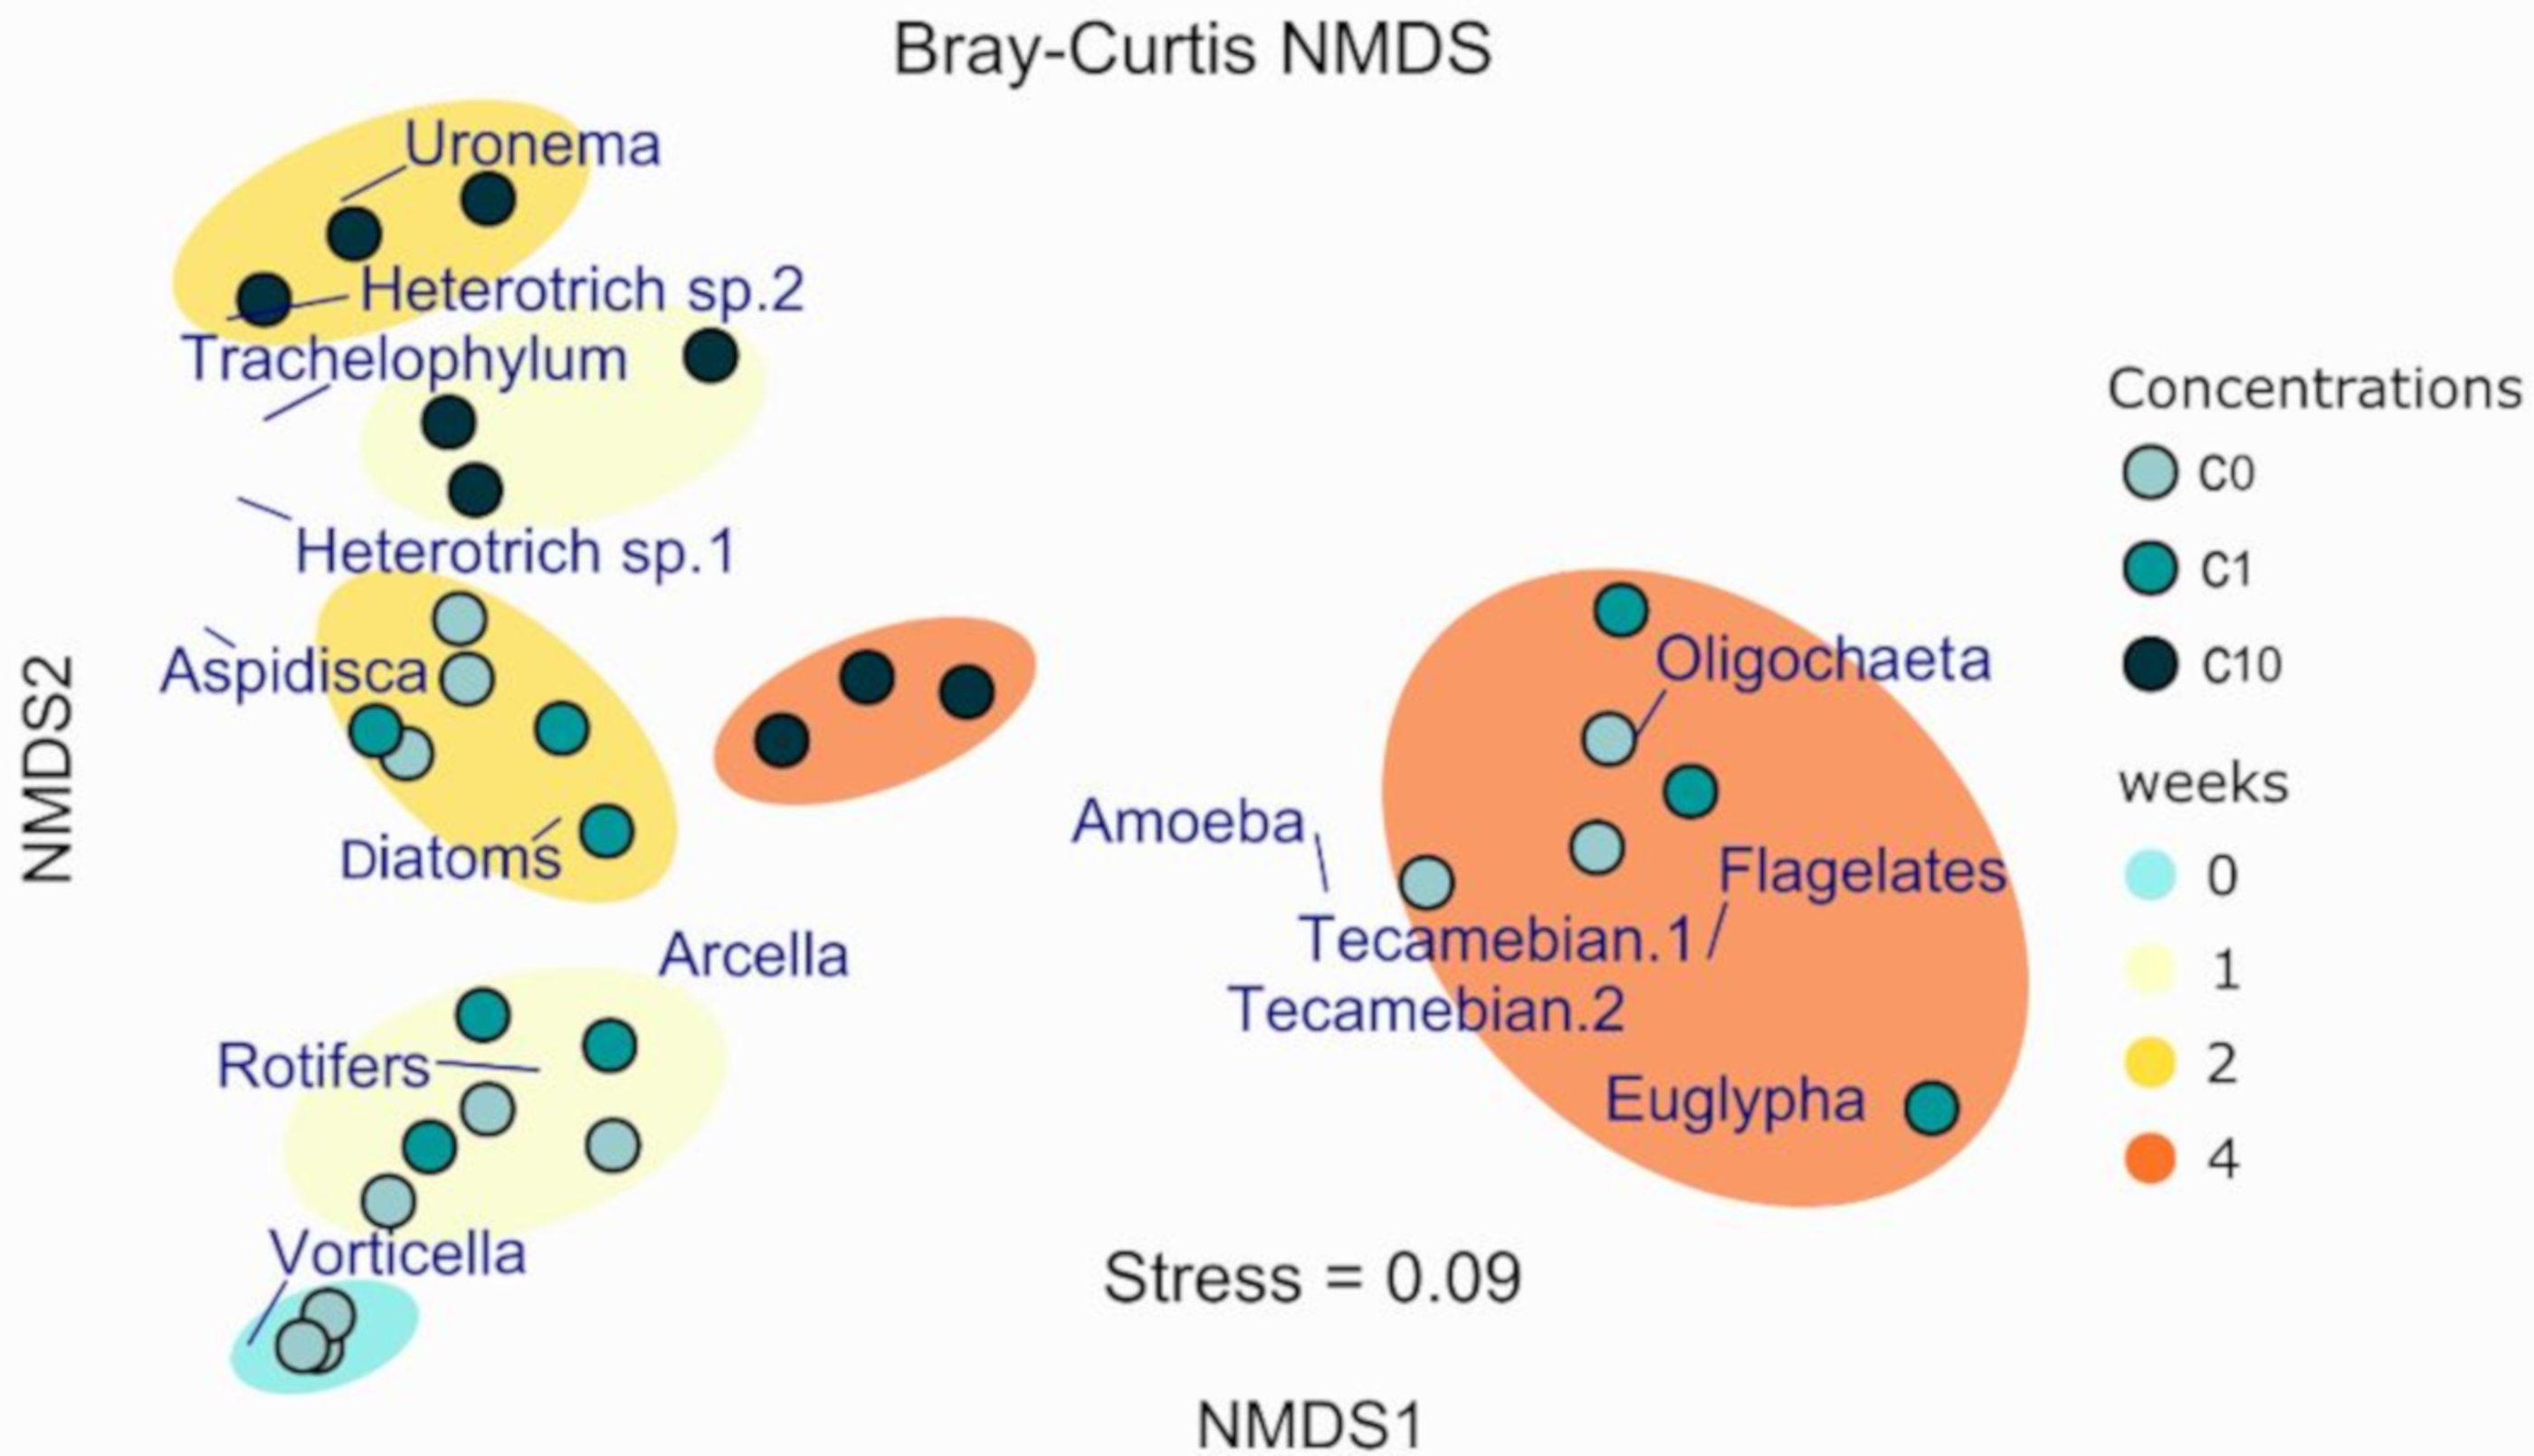
3.3.2. Micromeiofauna Composition
Ciliates
Rotifers
4. Discussion
4.1. Exposure Conditions
4.2. Effects on Autotrophic Community Structure
4.3. Effects on Micromeiofauna Community Structure
4.3.1. Rotifers
4.3.2. Ciliates
5. Conclusions
Author Contributions
Funding
Acknowledgments
Conflicts of Interest
References
- A Literature Review of the Concentration Ratios of Selected Radionuclides in Freshwater and Marine Fish; Poston, T.M., Klopfer, D.C., Eds.; Pacific Northwest Laboratory: Richland, WA, USA, 1986. [Google Scholar]
- Boswell, S.M.; Elderfield, H. The determination of zirconium and hafnium in natural waters by isotope dilution mass spectrometry. Mar. Chem. 1988, 25, 197–209. [Google Scholar] [CrossRef]
- Gobeil, C.; Rondeau, B.; Beaudin, L. Contribution of municipal effluents to metal fluxes in the St. Lawrence river. Environ. Sci. Technol. 2005, 39, 456–464. [Google Scholar] [CrossRef] [PubMed]
- Bedinger, G.M. 2012 Minerals Yearbook. Zirconium and Hafnium; USGS: Reston, VA, USA, 2016; Volume 85, pp. 1–8. Available online: https://www.usgs.gov/centers/nmic/minerals-yearbook-metals-and-minerals (accessed on 27 April 2018).
- Abollino, O.; Aceto, M.; Malandrino, M.; Mentasti, E.; Sarzanini, C.; Barberis, R. Distribution and mobility of metals in contaminated sites. Chemometric investigation of pollutant profiles. Environ. Pollut. 2002, 119, 177–193. [Google Scholar] [CrossRef]
- Schulin, R.; Curchod, F.; Mondeshka, M.; Daskalova, A.; Keller, A. Heavy metal contamination along a soil transect in the vicinity of the iron smelter of Kremikovtzi (Bulgaria). Geoderma 2007, 140, 52–61. [Google Scholar] [CrossRef]
- Little, M.G.; Lee, C.T.A. Sequential extraction of labile elements and chemical characterization of a basaltic soil from Mt. Meru, Tanzania. J. African Earth Sci. 2010, 57, 444–454. [Google Scholar] [CrossRef]
- Couture, P.; Cluis, D.; Bastien, C. Phosphorus removal from swine manure supernatant: Precipitant efficiency. Water Air Soil Pollut. 1988, 4, 353–364. [Google Scholar] [CrossRef]
- Coste, M.; Boutry, S.; Tison-Rosebery, J.; Delmas, F. Improvements of the Biological Diatom Index (BDI): Description and efficiency of the new version (BDI-2006). Ecol. Indic. 2009, 9, 621–650. [Google Scholar] [CrossRef]
- Morin, S.; Gómez, N.; Tornés, E.; Licursi, M.; Rosebery, J. Aquatic Biofilms: Ecology, Water Quality and Wastewater Treatment; Romaní, A.M., Guasch, H., Balaguer, M.D., Eds.; Caister Academic Press: Norfolk, UK, 2016; ISBN 9781910190173. [Google Scholar]
- Lavoie, I.; Lavoie, M.; Fortin, C. A mine of information: Benthic algal communities as biomonitors of metal contamination from abandoned tailings. Sci. Total Environ. 2012, 425, 231–241. [Google Scholar] [CrossRef]
- Behra, R.; Landwehrjohann, R.; Vogel, K.; Wagner, B.; Sigg, L. Copper and zinc content of periphyton from two rivers as a function of dissolved metal concentration. Aquat. Sci. 2002, 64, 300–306. [Google Scholar] [CrossRef]
- Holding, K.L.; Gill, R.A.; Carter, J. The relationship between epilithic periphyton (biofilm) bound metals and metals bound to sediments in freshwater systems. Environ. Geochem. Health 2003, 25, 87–93. [Google Scholar] [CrossRef] [PubMed]
- Prygiel, J.; Coste, M.; Bukowska, J. Review of the major diatom-based techniques for the quality assessment of rivers - State of the art in Europe. In Use of algae for monitoring rivers III; Prygiel, J., Whitton, B.A., Bukowska, J., Eds.; Agence de l’Eau Artois-Picardie: Douai, France, 1999; pp. 224–238. ISBN 2-9502083-5-5. Available online: https://books.google.de/books/about/Use_of_Algae_for_Monitoring_Rivers_III.html?id=eQG8tAEACAAJ&redir_esc=y (accessed on 1 October 2019).
- Morin, S.; Cordonier, A.; Lavoie, I.; Arini, A.; Blanco, S.; Duong, T.T.; Tornés, E.; Bonet, B.; Corcoll, N.; Faggiano, L.; et al. Consistency in Diatom Response to Metal-Contaminated Environments. In Handbook of Environmental Chemistry vol 19: Emerging and Priority Pollutants in Rivers; Guasch, H., Ginebreda, A., Geiszinger, A., Eds.; Springer-Verlag: Heidelberg, Germany, 2012; pp. 117–146. ISBN 978-3-642-25722-3. [Google Scholar]
- Kim Tiam, S.; Feurtet-Mazel, A.; Delmas, F.; Mazzella, N.; Morin, S.; Daffe, G.; Gonzalez, P. Development of q-PCR approaches to assess water quality: Effects of cadmium on gene expression of the diatom. Eolimna minima. Water Res. 2012, 46, 934–942. [Google Scholar] [CrossRef] [PubMed]
- Paule, A.; Lauga, B.; Ten-Hage, L.; Morchain, J.; Duran, R.; Paul, E.; Rols, J.L.; Lambert, A.S.; Pesce, S.; Foulquier, A.; et al. Experimental evaluation of the contribution of acidic pH and Fe concentration to the structure, function and tolerance to metals (Cu and Zn) exposure in fluvial biofilms. Ecotoxicology 2014, 23, 1270–1282. [Google Scholar]
- Bonnineau, C.; Tlili, A.; Faggiano, L.; Montuelle, B.; Guasch, H. The use of antioxidant enzymes in freshwater biofilms: Temporal variability vs. toxicological responses. Aquat. Toxicol. 2013, 136–137, 60–71. [Google Scholar] [CrossRef] [PubMed]
- Guasch, H.; Ricart, M.; López-Doval, J.; Bonnineau, C.; Proia, L.; Morin, S.; Muñoz, I.; Romaní, A.M.; Sabater, S. Influence of grazing on triclosan toxicity to stream periphyton. Freshw. Biol. 2016, 61, 2002–2012. [Google Scholar] [CrossRef]
- Perrier, F.; Baudrimont, M.; Mornet, S.; Mesmer-Dudons, N.; Lacomme, S.; Etcheverria, B.; Simon, O.; Feurtet-Mazel, A. Gold nanoparticle trophic transfer from natural biofilm to grazer fish. Gold Bull. 2018, 51, 163–173. [Google Scholar] [CrossRef]
- Neury-Ormanni, J.; Vedrenne, J.; Morin, S. Who eats who in biofilms? Exploring the drivers of microalgal and micromeiofaunal abundance. Bot. Lett. 2016, 163, 83–92. [Google Scholar] [CrossRef]
- Pratt, J.R.; Cairns, J. Functional groups in the Protozoa: Roles in differing ecosystems. J. Protozool. 2007, 32, 356–360. [Google Scholar] [CrossRef]
- Madoni, P.; Zangrossi, S. Ciliated protozoa and saprobical evaluation of water quality in the Taro River (Northern Italy). Ital. J. Zool. 2009, 72, 20–25. [Google Scholar] [CrossRef]
- Nisbet, B. Heterotrophic Feeding. In Nutrition and Feeding Strategies in Protozoa; Springer: Dordrecht, Germany, 1984. [Google Scholar]
- Horan, N.J. (Ed.) Biological wastewater treatment systems: Theory and operation; Wiley: Hoboken, NJ, USA, 1989; ISBN 9780471924258. [Google Scholar]
- Dauta, A. Conditions de développement du phytoplancton. Etude comparative du comportement de huit espèces en culture. I. Détermination des paramètres de croissance en fonction de la lumière et de la température. Ann. Limnol. 1982, 18, 217–262. [Google Scholar] [CrossRef]
- Kobayashi, T.; Sasaki, T.; Takagi, I.; Moriyama, H. Solubility of Zirconium (IV) Hydrous Oxides. J. Nucl. Sci. Technol. 2007, 44, 90–94. [Google Scholar] [CrossRef]
- AFNOR Qualité de l’eau - Dosage des matières en suspension - Méthode par filtration sur filtre en fibres de verre. NF EN 872. Available online: https://www.boutique.afnor.org/norme/nf-en-872/qualite-de-l-eau-dosage-des-matieres-en-suspension-methode-par-filtration-sur-filtre-en-fibres-de-verre/article/722523/fa135090 (accessed on 19 August 2019).
- Foissner, A.; Berger, H. A user friendly guide to the ciliates. Freshw. Biol. 1996, 35, 375–482. [Google Scholar]
- De Puytorac, P.; Grain, J.; Mignot, J.-P. Précis de protistologie; Editions Boubée: Paris, France, 1987; ISBN 2850040495 9782850040498. [Google Scholar]
- Jersabek, C.D.; Leitner, M.F. The rotifer world catalog. World Wide Web electronic publication. Available online: http://www.rotifera.hausdernatur.at/ (accessed on 6 December 2018).
- Fienberg, S.E.; Sokal, R.R.; Rohlf, F.J.; Rohlf, F.J.; Sokal, R.R. Biometry. The principles and practice of statistics in biological research statistical tables. Biometrics 2012, 26, 351. [Google Scholar] [CrossRef]
- Clarke, K.R. Nonmetric multivariate analysis in community-level ecotoxicology. Environ. Toxicol. Chem. 1999, 18, 118–127. [Google Scholar] [CrossRef]
- Soldo, D.; Behra, R. Long-term effects of copper on the structure of fresh water periphyton communities and tolerance to copper, zinc, nickel and silver. Aquat. Toxicol. 2000, 47, 181–189. [Google Scholar] [CrossRef]
- Foster, P.L. Metal resistances of Chlorophyta from rivers polluted by heavy metals. Freshw. Biol. 1982, 12, 41–61. [Google Scholar] [CrossRef]
- Segers, H.H.; Yule, C.M. Rotifera: Monogononta. In Freshwater Invertebrates of the Malaysian Region; Academy of Sciences Malaysia: Kuala Lumpur, Malaysia, 2012; pp. 106–120. [Google Scholar]
- Wallace, R.L.; Snell, T.W. Rotifera. In Ecology and Classification of North American Freshwater Invertebrates; Covich, J.T.A., Ed.; Elsevier: Amsterdam, The Netherlands, 2010; pp. 173–235. ISBN 9780123748553. [Google Scholar]
- Serra, M.; Aparici, E.; Carmona, M.J. When to be sexual: Sex allocation theory and population density-dependent induction of sex in cyclical parthenogens. J. Plankton Res. 2008, 30, 1207–1214. [Google Scholar] [CrossRef]
- Edmonson, W.T. Reproductive rate of planktonic rotifers as related to food and temperature in nature. Ecol. Monogr. 1965, 35, 61–111. [Google Scholar] [CrossRef]
- Ramakrishna Rao, T.; Sarma, S.S.S. Mitic and amitic modes of reproduction in the rotifer Brachionus patulus. Curr. Sci. Assoc. 2018, 54, 499–501. [Google Scholar]
- Dahms, H.U.; Hagiwara, A.; Lee, J.S. Ecotoxicology, ecophysiology, and mechanistic studies with rotifers. Aquat. Toxicol. 2011, 101, 1–12. [Google Scholar] [CrossRef]
- Moreno-Garrido, I.; Lubián, L.M.; Soares, A.M.V.M. In vitro populations of rotifer Brachionus plicatilis Muller demonstrate inhibition when fed with copper-preaccumulating microalgae. Ecotoxicol. Environ. Saf. 1999, 44, 220–225. [Google Scholar] [CrossRef] [PubMed]
- Madoni, P.; Esteban, G.; Gorbi, G.; Agua, D.I.; Poveda, L.; Rey, A. Acute toxicity of cadmium, copper, mercury and zinc to ciliates from activated sludge plants. Bull. Environ. Contam. Toxicol. 1992, 49, 900–905. [Google Scholar] [CrossRef] [PubMed]
- Madoni, P.; Davoli, D.; Gorbi, G. Acute toxicity of lead, chromium, and other heavy metals to ciliates from activated sludge plants. Bull. Environ. Contam. Toxicol. 1994, 53, 420–425. [Google Scholar] [CrossRef] [PubMed]
- Gücker, B.; Fischer, H. Flagellate and ciliate distribution in sediments of a lowland river: Relationships with environmental gradients and bacteria. Aquat. Microb. Ecol. 2003, 31, 67–76. [Google Scholar] [CrossRef]
- Curds, C.R. The ecology and Role of Protozoa in aerobic sewage treatment processes. Annu. Rev. Microbiol. 1982, 46, 27–44. [Google Scholar] [CrossRef] [PubMed]
- Madoni, P. Protozoa in wastewater treatment processes: A minireview. Ital. J. Zool. 2011, 78, 3–11. [Google Scholar] [CrossRef]
- Ancion, P.Y.; Lear, G.; Dopheide, A.; Lewis, G.D. Metal concentrations in stream biofilm and sediments and their potential to explain biofilm microbial community structure. Environ. Pollut. 2013, 173, 117–124. [Google Scholar] [CrossRef]
- Ellis, R.J.; Neish, B.; Trett, M.W.; Best, J.G.; Weightman, A.J.; Morgan, P.; Fry, J.C. Comparison of microbial and meiofaunal community analyses for determining impact of heavy metal contamination. J. Microbiol. Methods 2001, 45, 171–185. [Google Scholar] [CrossRef]
- Strickland, M.S.; Lauber, C.; Fierer, N.; Bradford, M.A. Testing the functional significance of microbial community composition. Ecology 2009, 90, 441–451. [Google Scholar] [CrossRef]
- Battin, T.J.; Besemer, K.; Bengtsson, M.M.; Romani, A.M.; Packmann, A.I. The ecology and biogeochemistry of stream biofilms. Nat. Rev. Microbiol. 2016, 14, 251–263. [Google Scholar] [CrossRef]
- Singh, S.; James, A.; Bharose, R. Biological assessment of water pollution using periphyton productivity: A review. Nat. Environ. Pollut. Technol. 2017, 16, 559–567. [Google Scholar]
- Barranguet, C.; Charantoni, E.; Plans, M.; Admiraal, W. Short-term response of monospecific and natural algal biofilms to copper exposure. Eur. J. Phycol. 2000, 35, 397–406. [Google Scholar] [CrossRef]


| Parameter | C0 | C1 | C10 |
|---|---|---|---|
| [Zr]total (nM) | 0.2 ± 0.1 | 0.5 ± 0.3 | 2.9 ± 0.3 * |
| Orthophosphate (mg P-PO4·L−1) | 2.8 ± 1.1 | 4.0 ± 1.9 | 3.4 ± 0.9 |
| Nitrate (mg N-NO3·L−1) | 9.2 ± 2.0 | 13.5 ± 7.0 | 10.2 ± 1.8 |
| Water temperature (°C) | 21.1 ± 0.6 | 21.7 ± 0.6 | 21.8 ± 0.5 |
© 2019 by the authors. Licensee MDPI, Basel, Switzerland. This article is an open access article distributed under the terms and conditions of the Creative Commons Attribution (CC BY) license (http://creativecommons.org/licenses/by/4.0/).
Share and Cite
Caroline, D.; Soizic, M.; Jacky, V.; Claude, F. Impact of Zirconium on Freshwater Periphytic Microorganisms. Environments 2019, 6, 111. https://doi.org/10.3390/environments6100111
Caroline D, Soizic M, Jacky V, Claude F. Impact of Zirconium on Freshwater Periphytic Microorganisms. Environments. 2019; 6(10):111. https://doi.org/10.3390/environments6100111
Chicago/Turabian StyleCaroline, Doose, Morin Soizic, Vedrenne Jacky, and Fortin Claude. 2019. "Impact of Zirconium on Freshwater Periphytic Microorganisms" Environments 6, no. 10: 111. https://doi.org/10.3390/environments6100111
APA StyleCaroline, D., Soizic, M., Jacky, V., & Claude, F. (2019). Impact of Zirconium on Freshwater Periphytic Microorganisms. Environments, 6(10), 111. https://doi.org/10.3390/environments6100111