Article

How Inter-Basin Transfer of Water Alters Basin Water Stress Used for Water Footprint Characterization

1
Institute for Water Science, Suntory Global Innovation Center Limited, 8-1-1 Seikadai, Seika-cho, Soraku-gun, Kyoto 619-0284, Japan
2
Secretariat of Water Cycle Policy Headquarters, Cabinet Secretariat, Tokyo 100-8918, Japan
3
Water Resources Department, Water and Disaster Management Bureau, Ministry of Land, Infrastructure, Transport and Tourism, Water Resources Planning Division, Tokyo 100−8918, Japan
4
CTI Engineering Co., Ltd., Tokyo 103-8430, Japan
5
Research and Development Center, Nippon Koei Co., Ltd., Ibaraki 300-1259, Japan
6
United Nations University, Tokyo 150-8925, Japan
7
Integrated Research System for Sustainability Science, The University of Tokyo Institutes for Advanced Study, Tokyo 113-8654, Japan
*
Author to whom correspondence should be addressed.
Environments 2018, 5(9), 105; https://doi.org/10.3390/environments5090105
Submission received: 1 August 2018 / Revised: 7 September 2018 / Accepted: 10 September 2018 / Published: 12 September 2018
(This article belongs to the Special Issue Water Footprint in Life Cycle Assessment: From Theory to Practice)

Abstract

:
Water footprint assessments contribute to a better understanding of potential environmental impacts related to water and have become essential in water management. The methodologies for characterizing such assessments, however, usually fail to reflect temporal and spatial variations at local scales. In this paper, we employ four widely-used characterization factors, which were originally developed with global estimates of water demand and availability, to evaluate the impact that inter-basin transfer (IBT) of water has on water risk assessments and, consequently, on the evaluation of the soundness of water cycle. The study was conducted for two major river basins in Japan, where diversion channels were built to move water from the Tone river basin to the Arakawa river basin. Considering IBT, the available water in the Arakawa river basin increases a 45%, reducing the characterization factors a 44% on average and denoting their tendency to overestimate the risk in this basin, while the Tone river basin increased the characterization factors a 28% on average by IBT. Moreover, with a simple example we show how ambiguity in the definition of some characterization factors may cause significant changes in the result of the assessments. Finally, we concluded that local water footprint characterization can be more helpful in local assessment of water resources if the results are unanimous, Targetable, Replicable, Ameliorable, Comparable, and Engageable (uTRACE).

1. Introduction

Water resources are of vital importance for the health and livelihood of humans as well as the surrounding natural environments. The sixth goal of the Sustainable Development Goals (SDGs) acknowledges water as an essential part of the livelihood of the world’s population, emphasizing on two requisites for accomplishing a healthy, environmentally sustainable and economically prosper quality of life. These requisites are (1) access to safe water and sanitation and (2) sound management of freshwater ecosystems [1,2]. The targets included in this goal encompass access to safe and affordable drinking water, water quality improvement, water-use efficiency, protection of water-related ecosystems, and capacity-building support to developing countries. The essentiality of water and its natural cycle in human activities is demonstrated by looking at the contents of other SDGs, such as the goal 3, 4, 12, 13, and 15. The definition of the sixth SDG and its specific targets were accompanied by indicators, one of which measures the degree of water stress in terms of a relationship between the freshwater withdrawn for human consumption and the availability or renewability of freshwater resources. Because water stress can be defined in different mathematical ways and also include other variables (e.g., space, time, and source), the evaluation and inter-regional comparison is not simple and has led to the development of alternative ways to measure water stress and the associated environmental risks.
Water sustainability cannot be discussed without considering its natural cycle, given that water depends on it as a renewable resource [3,4,5,6]. In the Basic Act on Water Cycle Policy of Japan, a sound water cycle is defined as a water cycle adequately maintained to facilitate the function of water in contribution to human activities and conserving the environment [7,8]. Because the evaluation of the soundness of the water cycle should include not only the use of water for environmental conservation but also the use in human activities, the sustainability assessment of water use aimed at achieving a sound water cycle should be based on Life Cycle Assessment (LCA) techniques.
In LCAs, the water footprint is a fundamental concept that has been defined differently by the Water Footprint Network (WFN) and the International Organization for Standardization (ISO). Water footprint, as defined by WFN, is a measure of humanity’s appropriation of fresh water in volumes of water consumed and/or polluted [9,10]. Because this concept of water footprint is consumption-based, it can be used to assess the use of water from both ends of supply chains. However, the local state of water resources was overlooked causing the possibility of water footprint values being similar in tropical and arid areas. Later, the International Organization for Standardization set the requirements and guidelines of water footprint assessments by using life-cycle assessment principles [11,12]. Because water resources are unevenly distributed both geographically and temporally, the spatiotemporal impact of water use is uneven as well [3,13,14], and the inclusion of specific impacts in water footprint assessments, as intended by ISO, needs to adopt characterization factors of such impacts [12]. However, because the (mathematical) definition of the characterizations are driven by different interests, the results of different evaluation frameworks may be disparate causing uncertainty and conflict. Some of the more widely used evaluation frameworks are summarized below.
The characterization of water stress is usually some representation of the unbalance between human demand (water withdrawals) and natural supply (freshwater availability). Baseline Water Stress (BWS), defined as annual water withdrawals divided by mean available water [15], is a fundamental concept that has been widely used in scientific and policy literature to identify water stress [16,17,18]. However, because spatiotemporal variations of water are not explicitly represented by BWS, following the ISO standards, other water risk assessments have included the uneven distribution of water resources in the characterization process. The Water Stress Index (WSI) is a screening indicator that accounts for temporal variability in water availability and the effects of regulated flows (e.g., dams) [19]. The water unavailability factor (fwua) evaluates the potential impacts of water use on fresh water availability by considering the uneven distribution of water resources over space, time and source. Because the fwua is obtained globally using the same spatial and temporal references of water quantities, comparisons with other areas are straightforward [20]. The Available WAter REmaining (AWARE) characterization factor (CFAWARE) was proposed as an indicator of available water remaining after the human and aquatic ecosystem demands have been met [21].
The abovementioned assessment frameworks and their corresponding characterizations factors are useful for making large-scale assessments or comparisons. However, their regional application needs further improvement in order to achieve more robust and beneficial results. We consider that some of the existing assessments overlook local condition of water resources, some midpoint indicators are calculated based on particular requirements with a top-down approach. Additionally, because the calculation of characterization factors is based on different definitions (mathematical relationships) of water stress, the comparison between assessment frameworks is not straightforward.
There are a limited number of studies that have validated (or improved) the results of global assessments of water risk with local data and statistical records. Examples are the case studies of the Colorado river basin (United States) [22], the Yellow river basin (China) [23], the Yangtze river basin (China) [24], the Mekong river basin (Southeast Asia) [25] and the Orange-Senqu river basin (Southern Africa) [26], in which the water risk metrics of the Aqueduct framework and the quantities needed for their calculation (e.g., BWS) were recalculated using the available local data. Such local validations were critical for achieving more robust and objective assessments of water demand-to-availability that provided useful information that can be used in regional planning [27].
In this paper, we report the results of recalculating the four abovementioned characterization factors (i.e., BWS, WSI, fwua and CFAWARE) using local data and adapting the formulations of water demand-to-availability to reflect the effect of the IBT between the Tone and Arakawa river basins. Then, we show how the inclusion of temporal variability has a relevant role in the characterization of demand-to-availability, yet the risk of temporal variability can be mitigated through the implementation of an adequate mitigation such as IBT. Finally, considering the merits and weaknesses of existing characterization factors and the fact that the inclusion of local alterations to water supply in the assessment process might serve as motivation to improve the current state of the water cycle, we propose five fundamental requirements that we consider the process of water footprint characterization should fulfil.

2. Materials and Methods
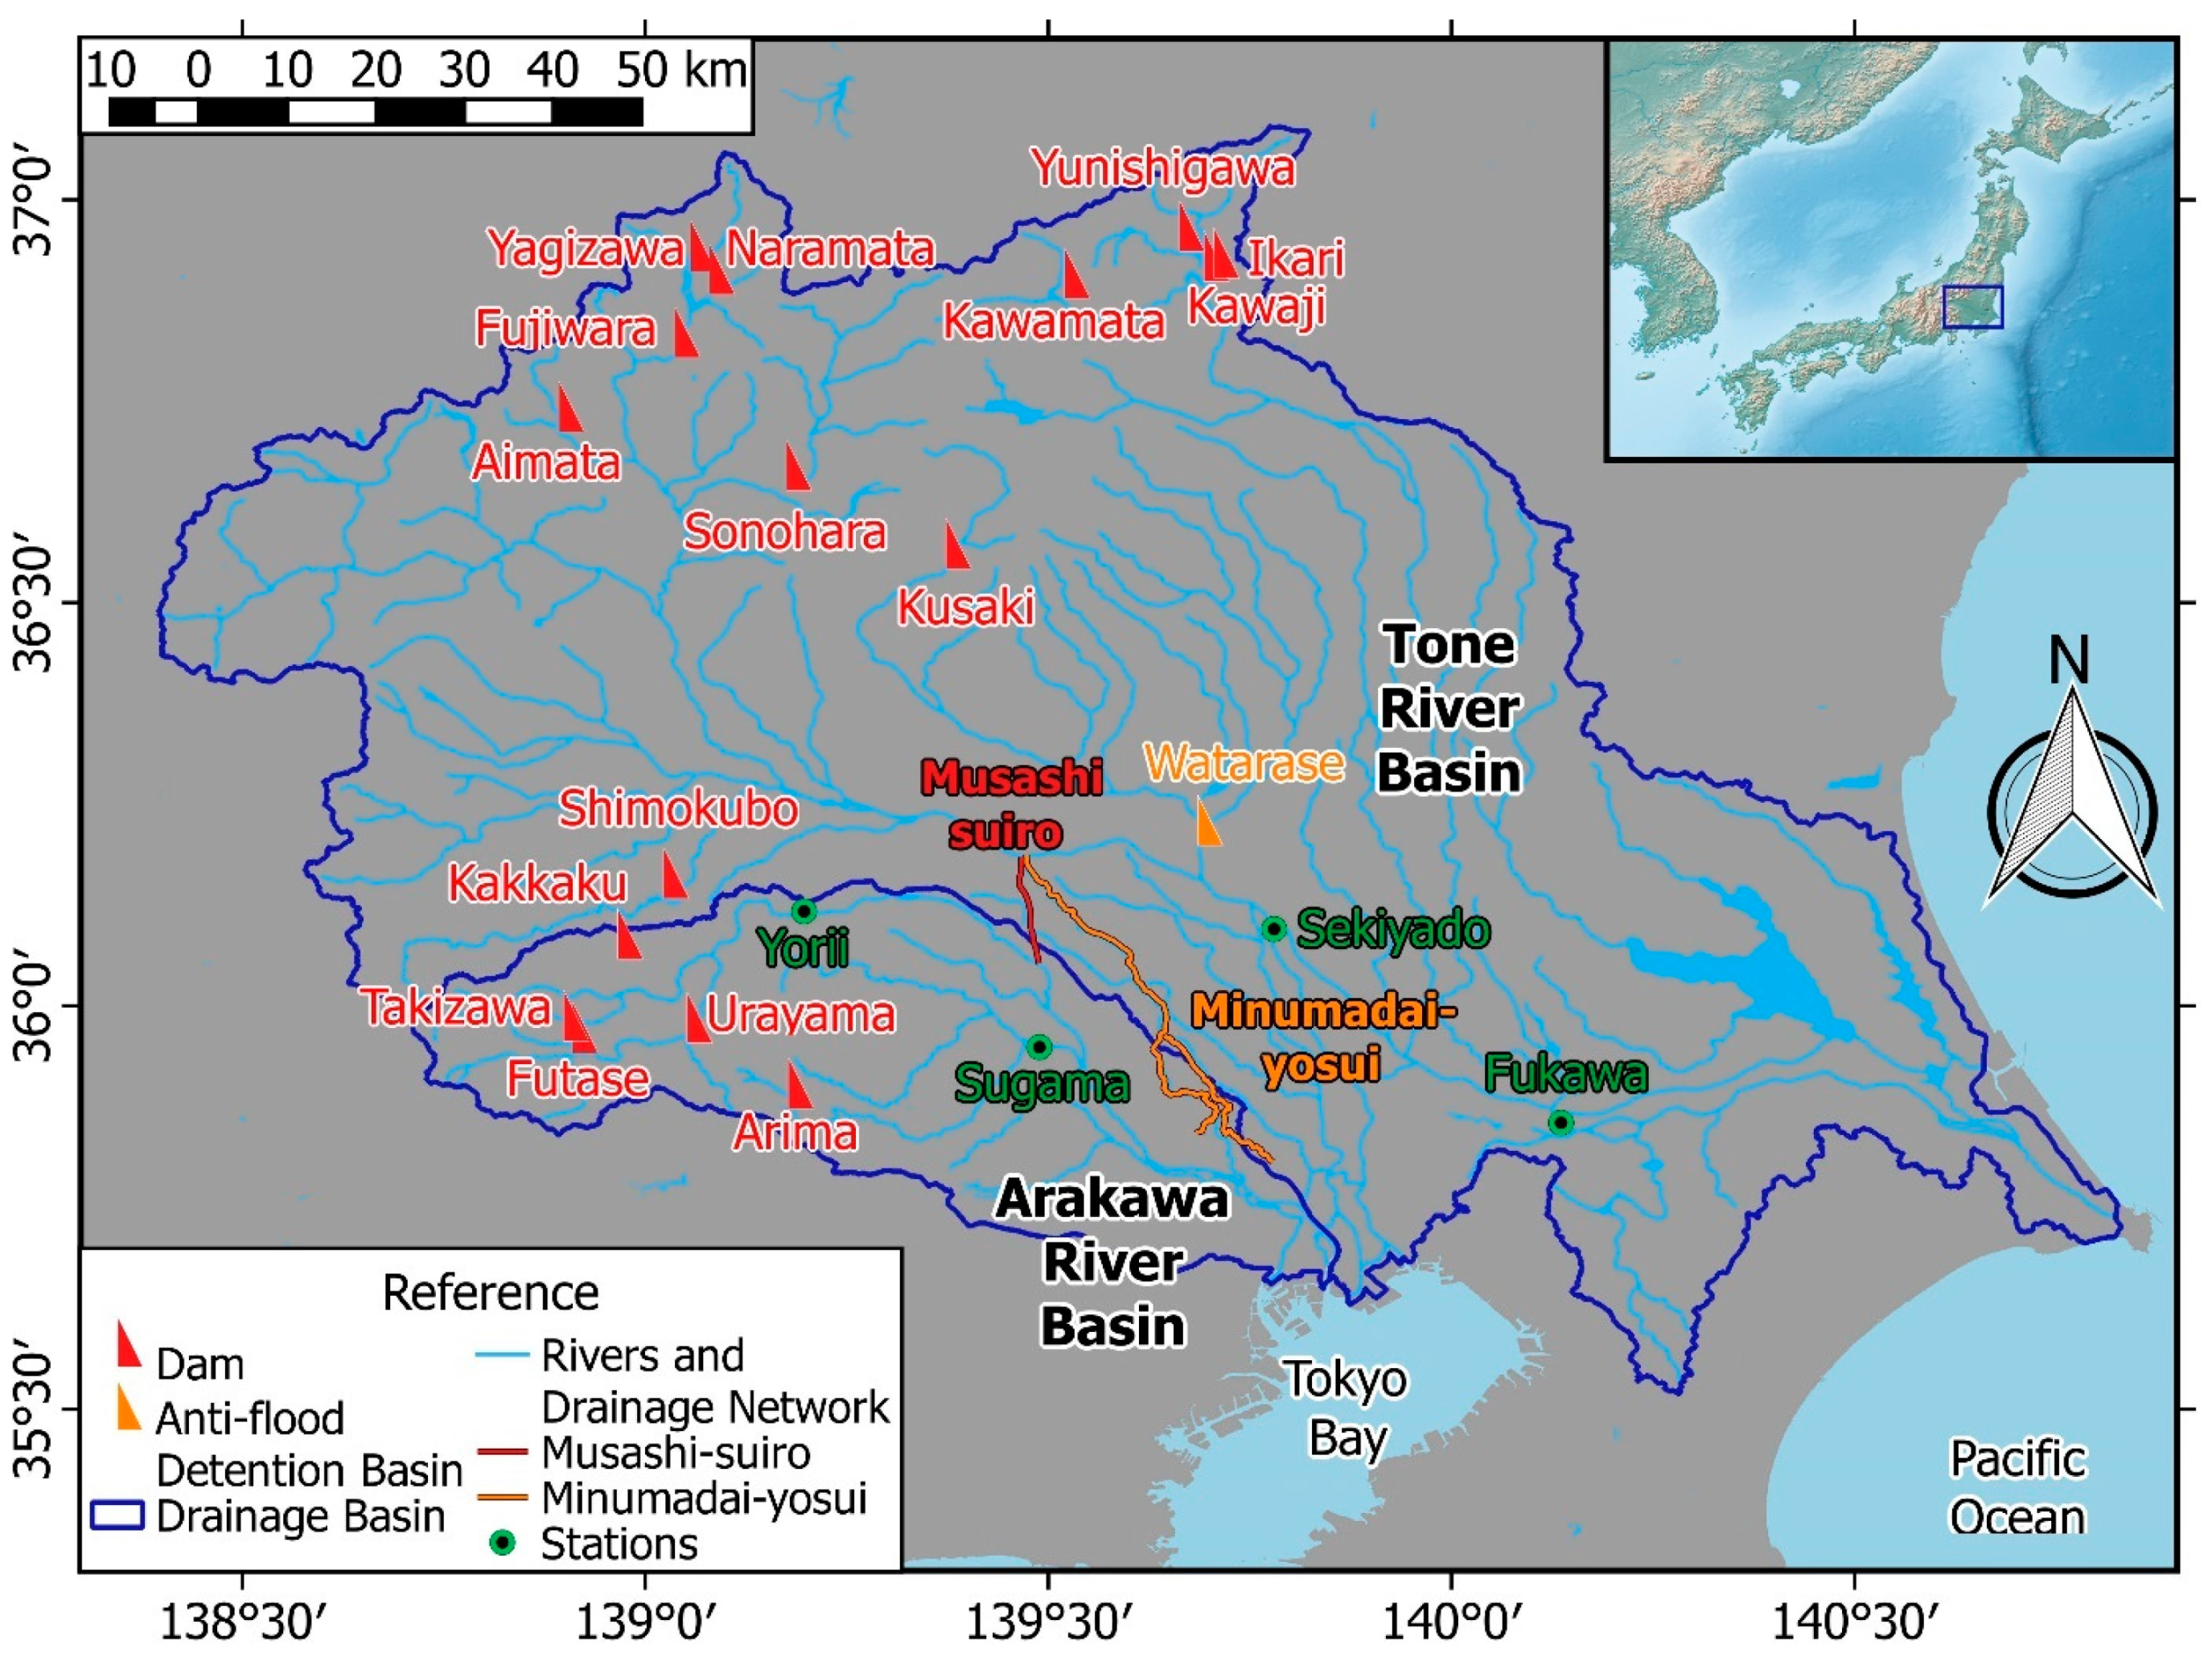
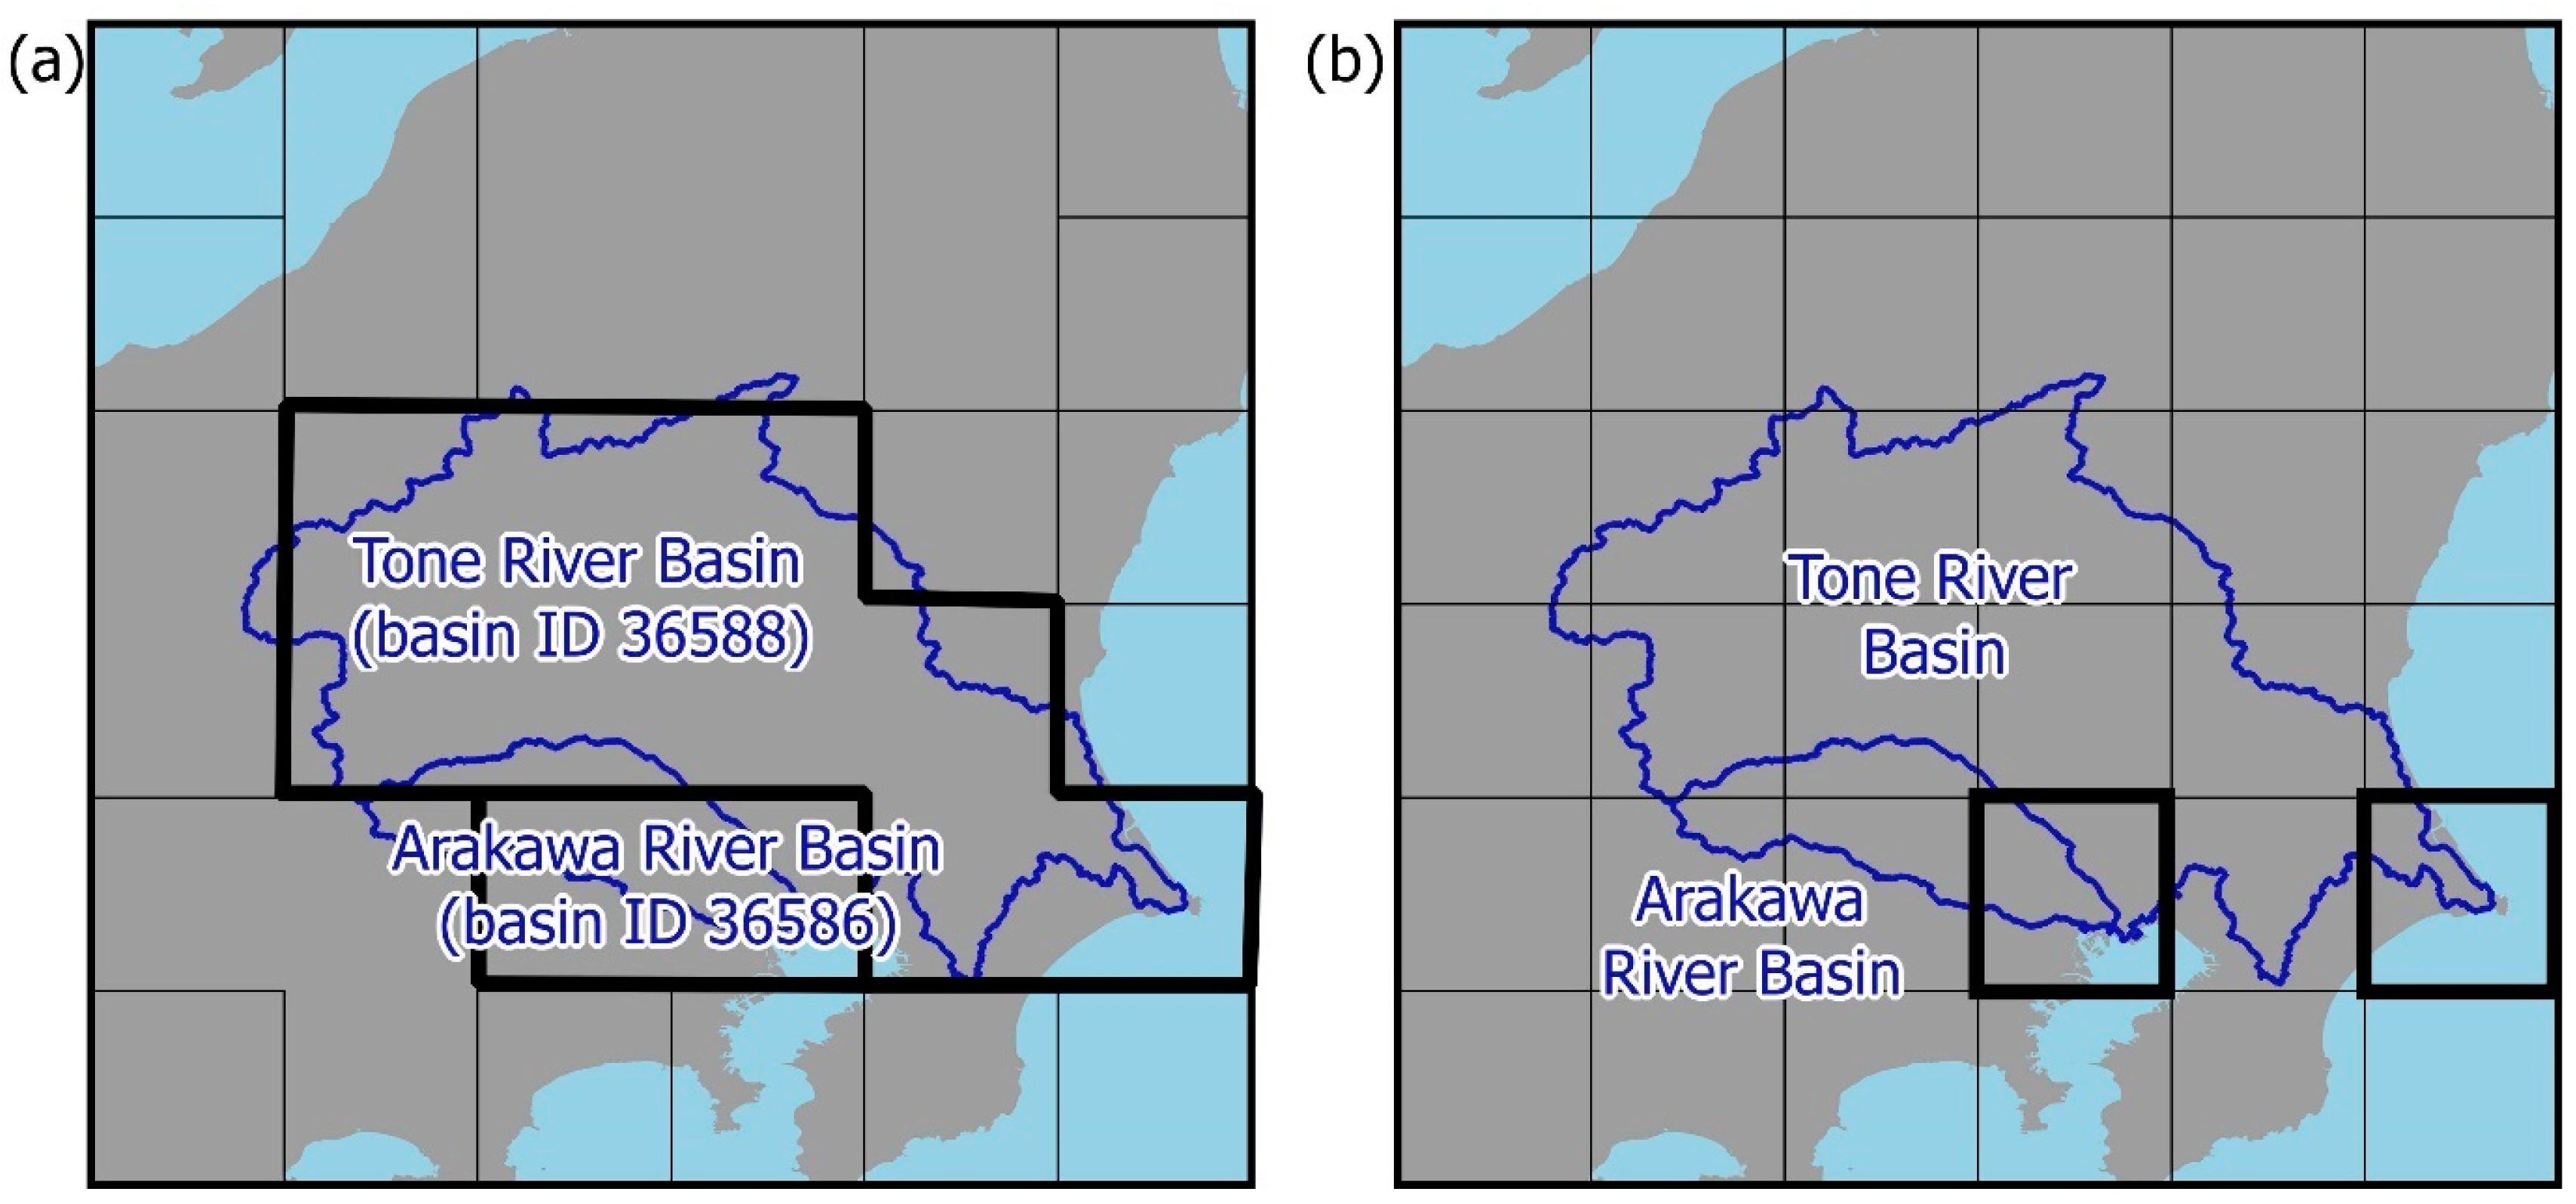
2.1. Study Area

We chose the Tone and Arakawa rivers to conduct our study. These two rivers are extremely important as they supply freshwater to the capital region of Japan (Figure 1). The Tokyo metropolitan area has concentrated assets that lead to higher potential economic risk raised by water issues. For this reason, the local authorities have invested heavily in flood control measures and a managed water supply system [28].
The selected rivers are connected by the Musashi-suiro and Minumadai-yosui canals constructed from 1964 to cope with the industrial, domestic and irrigation demands in the Arakawa river basin, which transport water from the Tone river basin [29].

2.2. Description of Characterization Factors

Considering the definition given in Section 1, in which a sound water cycle implies having a low risk of water stress, in this study we test if the existing characterization factors for water footprint can be utilized to assess the soundness of the water cycle. Herein, BWS of the Aqueduct framework [15,30], WSI [19], fwua of surface water [20], and CFAWARE [21] were chosen to conduct the local validation. These characterization factors have been well adopted by various water footprint and water risk assessment studies [18,31,32,33]. The mathematical expression, the variable range and the horizontal resolution of the publicly available global datasets of the selected characterization factors are shown in Table 1. The values of the characterization factors extracted from the global datasets are henceforth denominated global estimates. The global estimate of BWS for the Tone river basin is divided in three parts, corresponding to the smaller basins of the Tone, Nakagawa, and Ayase rivers. Thus, the area-weighted average of the three smaller basins is used. WSI, fwua, and CFAWARE are available as gridded datasets or gridded basin-units with a spatial resolution of 0.5° × 0.5°. The global estimates of WSI and CFAWARE of the Tone and Arakawa river basins correspond respectively to the basin-unit identification numbers (basin ID) 36588 and 36586 of the global datasets. The global estimates of fwua correspond to the grids in which the river mouth of the Tone and Arakawa rivers are located (Figure 2).
The characterization factors computed with local data are hereafter denominated local estimates. The quantities needed for calculating the local estimates of the selected characterization factors were collected or computed using locally available information. For calculating BWS, total water withdrawals were assumed to be equal to the sum of withdrawals for municipal, industrial, and irrigation use. Available blue water is the total water volume that is available to a catchment minus the upstream consumptive water use, where consumptive use is the water withdrawn that was not returned to its natural course. Because we were computing for the whole basin, we estimated available blue water as the sum of observed discharge accumulated in the period in which withdrawals are available and the difference of total withdrawals and non-consumptive use (i.e., withdrawn water returned to the natural stream). The estimation of available blue water also considered flow changes caused by reservoir control and IBT where applicable.
As detailed in Table 1, WSI is a function of the ratio of annual water withdrawals to availability. Because this demand-to-availability quantity is defined in a similar fashion as BWS, to calculate water withdrawals to availability, we proceeded in the same way as described above for BWS. Water withdrawals to availability need to be adjusted to consider annual and seasonal variations, as well as the effect of regulations of flow. The Tone and the Arakawa river basins were both recognized as “not strongly regulated” rivers [34].
Besides considering the variations in space and time, fwua evaluates the impacts of water use separately for three types of water sources: precipitation, surface water, and groundwater [20]. Because in this analysis we only consider surface water, the acronym fwua henceforth refers to surface water only. The estimation of fwua depends on the annual renewability rate of surface water, the consumptive water use and the environmental flow. We assumed the annual renewability rate, which is the sum of surface and subsurface runoff, equal to the annual river flow at the river mouth. For the consumptive water use, we considered that half of the irrigation withdrawals are returned to the river. The environmental flow was assumed as maintenance flow rate needed to maintain an adequate river environment considering the potential use in activities such as shipping, fishery, setup of rivers scenery, mitigation of salt damage, and others undertaken at maintenance facilities. Lastly, fwua expresses the potential impacts relatively to a reference volume of water. We adopted the conditions and reference volume proposed in previous studies, 1000 mm y−1 over 1.0 m2 of land (1 m3 y−1) [35].
CFAWARE is a measure of water availability-minus-demand relative to a global average. As available water, we used the monthly values of available blue water that were calculated earlier for BWS. Water demand is the monthly available water remaining after subtracting human water consumption and environmental water requirements, which we assumed to be equal to the consumptive water use and environmental flow, respectively, that were used in the estimation of fwua. The global average of availability-minus-demand was set equal to 0.0136 m3 m−2-month [21].

2.3. Sources of Local Data for Computation of Local Estimates

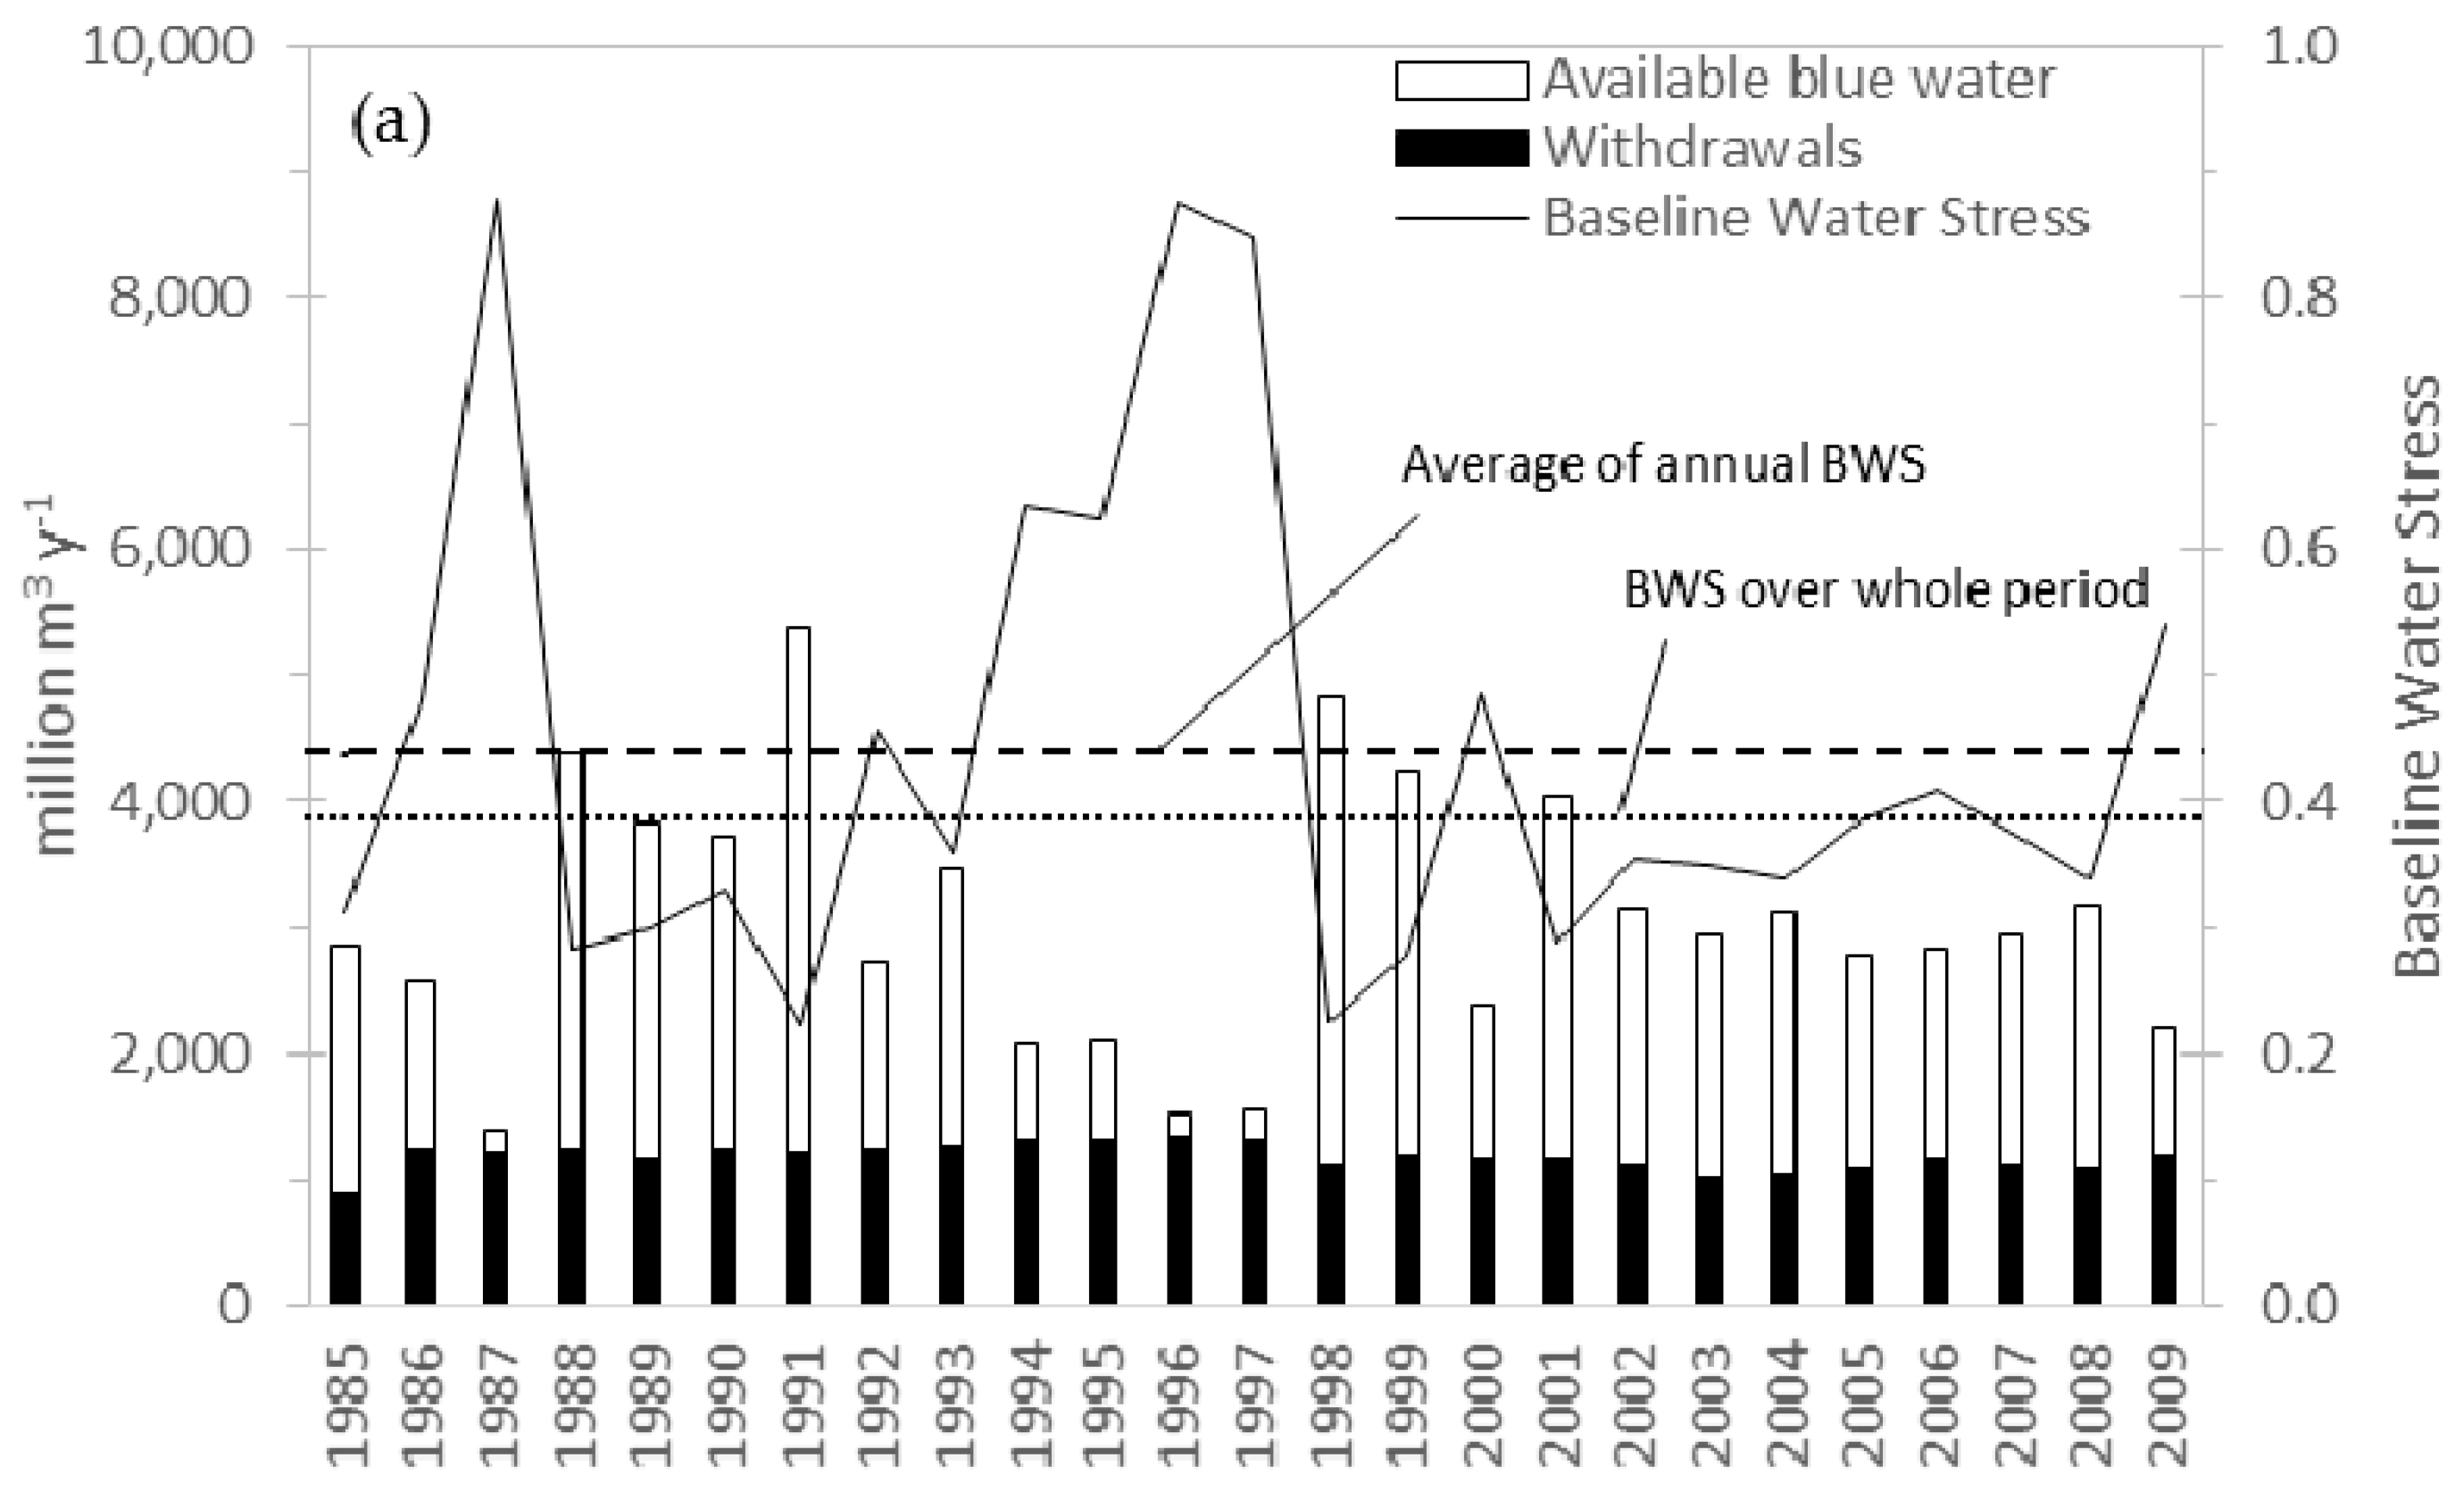
2.3.1. Tone River Basin

To estimate the annual water withdrawals across the Tone river basin, we collected the water withdrawals correspond to the records of municipal, industrial and agricultural consumption in the period 1985–2013 at 28, 9 and 45 sites, respectively. Observed discharge corresponds to records of river discharge at the Fukawa station (Figure 1). This station is located at 76.47 km from the river mouth and has a drainage area equal to 12,458 km2. Approximately 50 km upstream of the Fukawa station, the Tone river basin has a bifurcation near the Sekiyado district of the Chiba prefecture. The bifurcation is the origin of the Edo River. We adjusted the observed discharge of the Fukawa station by adding the observed discharge at the Sekiyado district and considering the changes of flow due to reservoir operation.
Changes of flow due to reservoir operation were calculated using inlet and outlet flows of the Yagisawa, Naramata, Fujisawa, Aimata, Sonohara, Shimokubo, Kusaki, Watarase, Kawaji, Kawamata, Ikari, and Yunishigawa dams [36,37]. The location of the dams is also shown in Figure 1.
The available blue water for the whole basin, which has a drainage area of 16,840 km2, was estimated multiplying the ratio of drainage areas (i.e., 16,840 km2 divided by 12,458 km2) and the adjusted observed discharge.
We calculated basin-average monthly (Pm) and annual precipitation (Pa) using the records of the Japan’s Automated Meteorological Data Acquisition System dense network of meteorological stations [38]. The records of the stations were previously spatially interpolated to have a gridded dataset with a horizontal resolution of 0.05° × 0.05°.
The water withdrawals and the available blue water were calculated for two scenarios, one with IBT from the Tone river basin to the Arakawa river basin and another without.

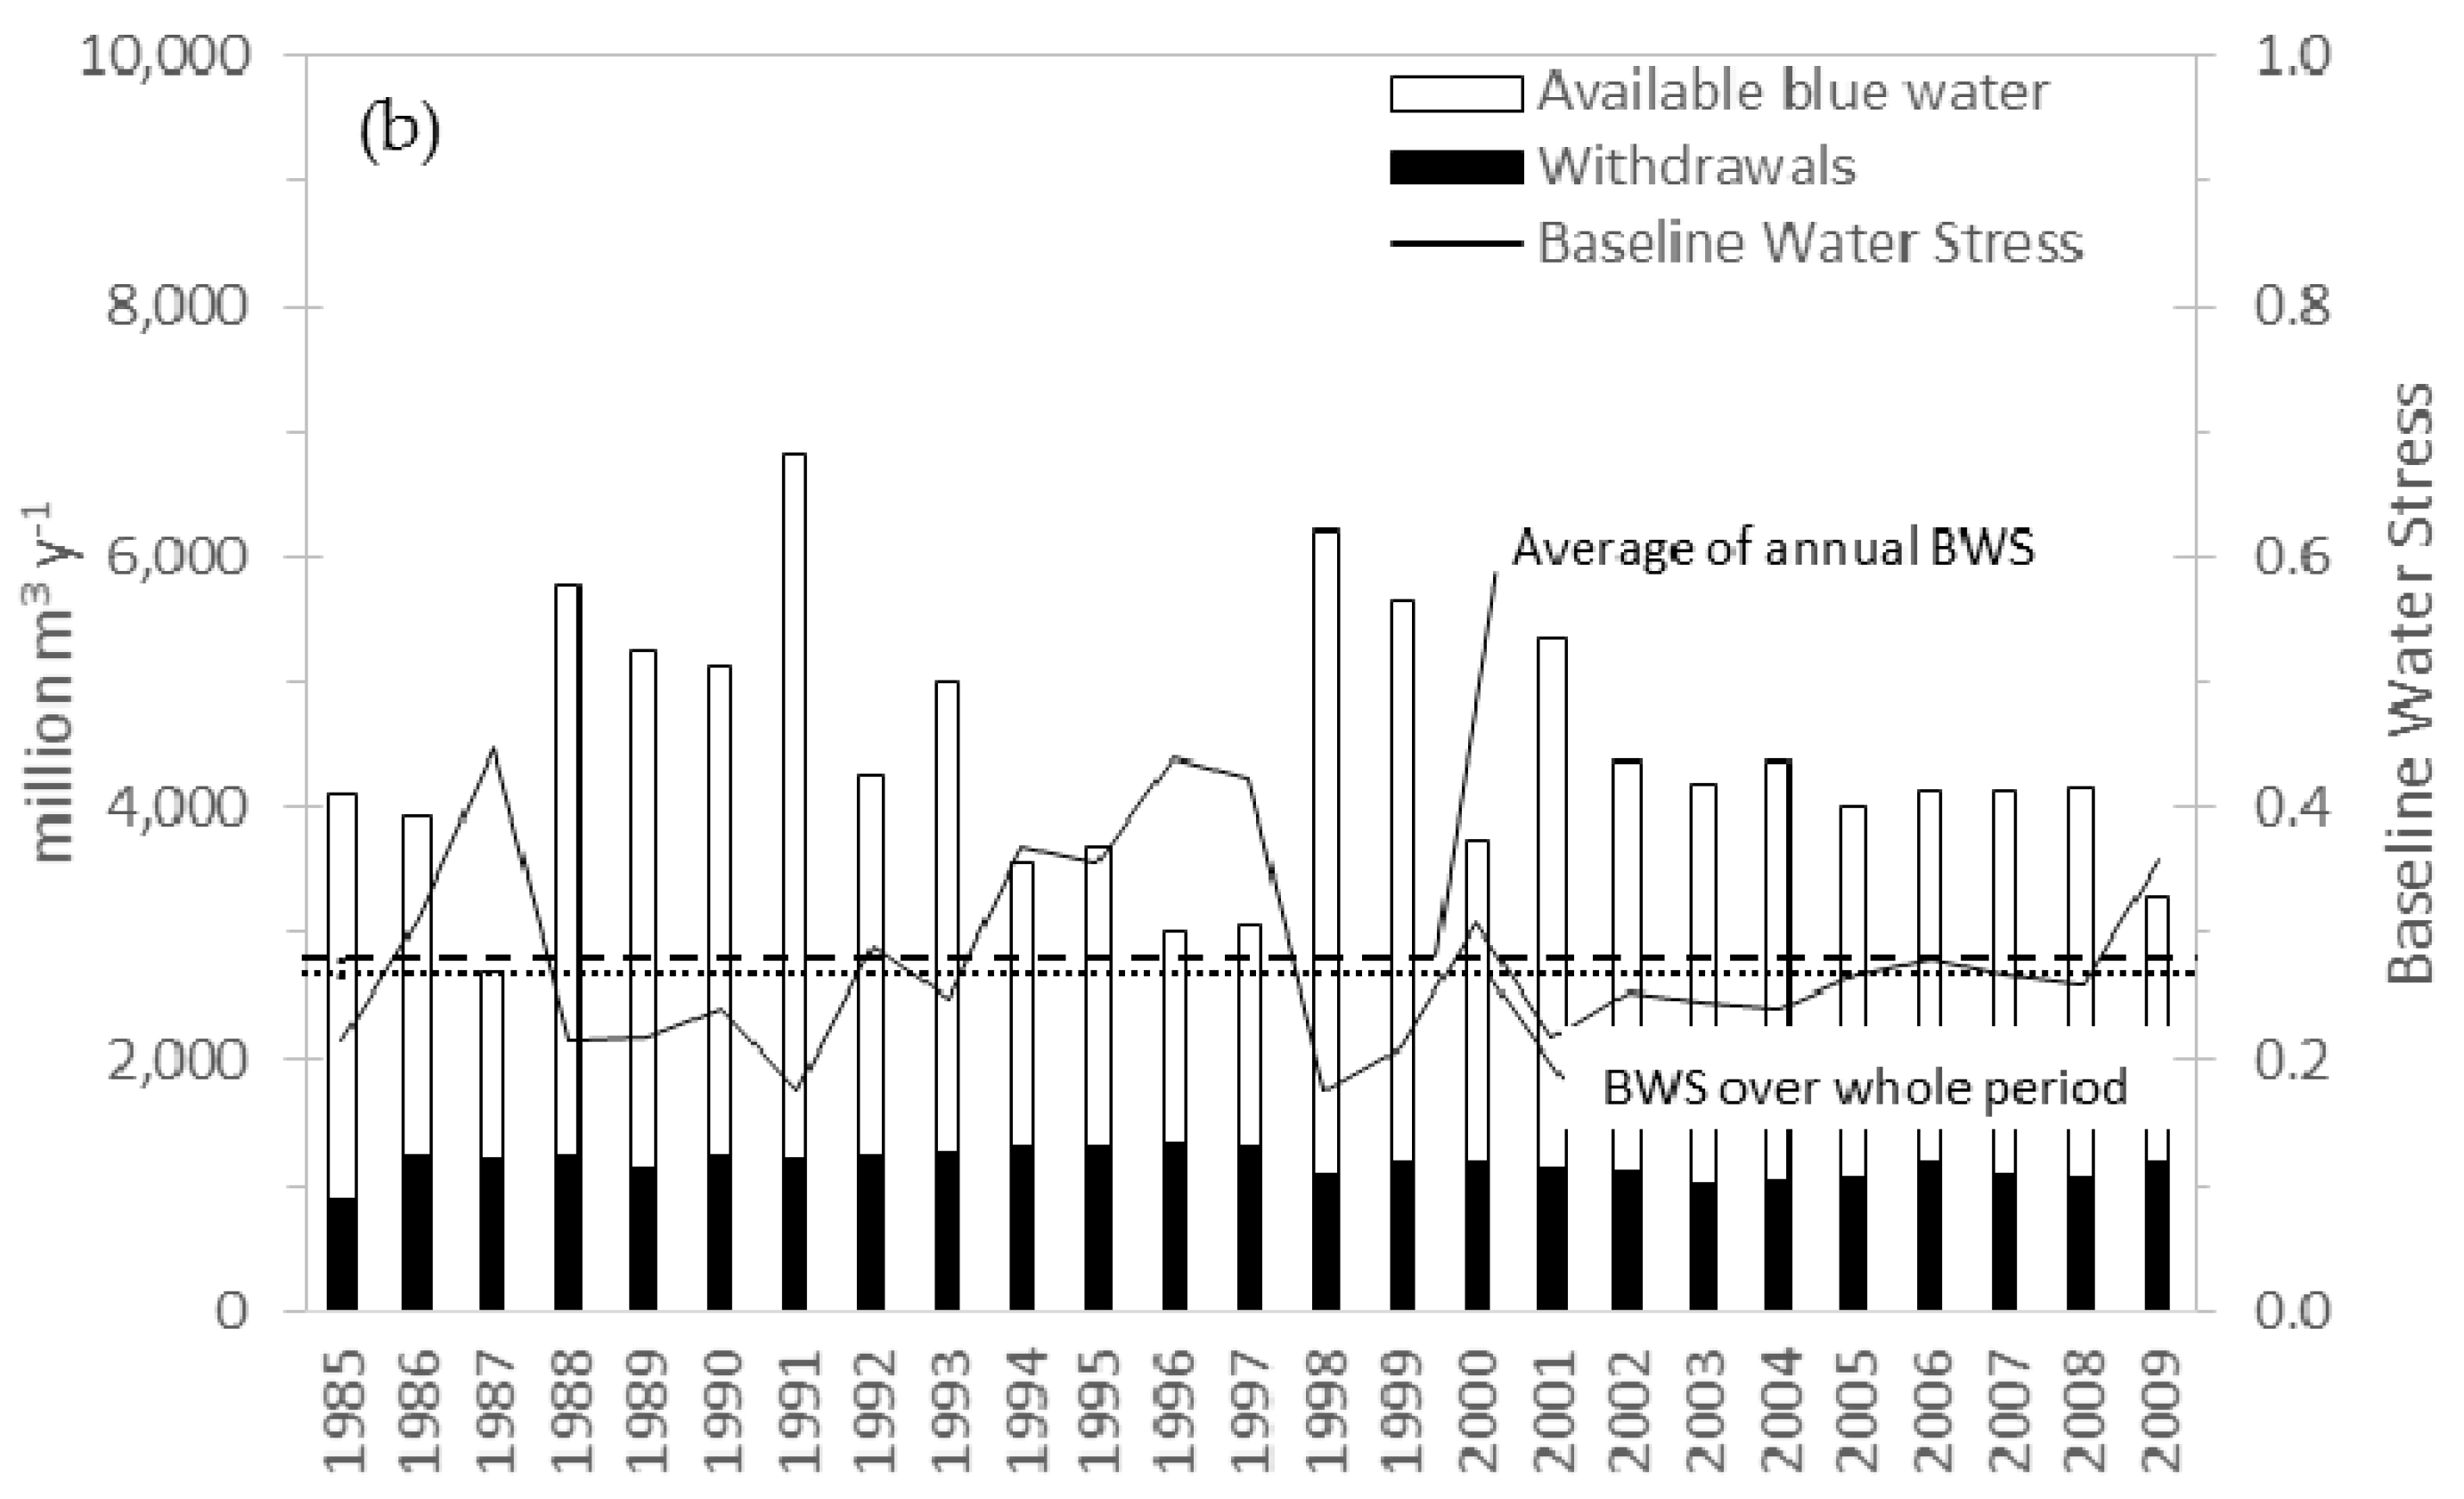
2.3.2. Arakawa River Basin

To estimate the annual water withdrawals across the Arakawa river basin, we collected the water withdrawals correspond to the records of municipal, industrial and agricultural consumption in the period 1985–2009 at 29, 7 and 8 sites, respectively.
Observed discharge corresponds to records of river discharge at the Yorii station for the Arakawa River and the Sugama station for one of its afluents. The point where the affluent meets the river has a drainage area equal to 2018 km2. We adjusted the total observed discharge by considering the changes of flow due to reservoir operation. Changes of flow due to reservoir operation were calculated using inlet and outlet flows of the Urayama, Takizawa, Futase, Kakkaku, and Arima dams [36]. The location of the dams is shown in Figure 1.
The available blue water for the whole basin, which has a drainage area of 2940 km2, was estimated multiplying the ratio of drainage areas (i.e., 2940 km2 divided by 2018 km2) and the adjusted observed discharge. We calculated basin-average monthly (Pm) and annual precipitation (Pa) as it was done for the Tone river basin. As it was done for the Tone river basin, the water withdrawals and the available blue water were calculated for two scenarios, one with IBT and another without.

2.4. The Inclusion of Inter-Basin Transfer in the Definition of the Characterization Factors

The inclusion of the volume of transferred water in the selected water-stress characterization factors depends on whether water stress is being assessed for the sending-basin or for the receiving-basin.
For the Tone river basin (i.e., sending basin), the transferred water can be considered either as water withdrawn that does not return to the original course (consumptive use) or as a reduction of the available water. Thus, one possibility is to add the volume of transferred water (T) to the volume of total withdrawals (W), in which case the expression of BWS is modified as shown in Equation (1), the other possibility is to subtract the transferred water from the available blue water (Q), in which case the expression of BWS is modified as shown in Equation (2). For the Arakawa river basin (i.e., receiving basin), the transferred water is an increase of the available blue water (Q), in which case the expression of BWS is modified as shown in Equation (3).
B W S s = W s Q s = W + T Q
B W S s = W s Q s = W Q T
where BWSs is BWS of the sending-basin, Ws is the volume of water withdrawals of the sending-basin (m3 y−1), and Qs is the available blue water of the sending-basin (m3 y−1).
B W S r = W r Q r = W Q + T
where BWSr is BWS of the receiving-basin, Wr is the volume of water withdrawals of the receiving-basin (m3 y−1), and Qr is the available blue water of the receiving basin (m3 y−1).
The quantities of water availability and demand for the other characterization factors in the cases with and without IBT were modified accordingly.

3. Results

For the Tone river basin, Table 2 shows the computed local estimates and their standard deviations (SD) for the calculation of characterization factors, including the case with IBT (using the possibilities of computation shown in Equations (1) and (2) and the case without). The average annual precipitation of the Tone river basin from 1985 to 2013 was 1458 mm y−1. The average available blue water was estimated as 16,397 million m3 y−1, while it decreased a 8% to 15,082 million m3 y−1 considering IBT by the Equation (2). The annual water withdrawals increased by IBT with the Equation (1), from 4509 to 5824 million m3 y−1, respectively. The human water consumption of the Tone river basin was estimated to be 1384 million m3 y−1 without IBT and 2695 million m3 y−1 with IBT. The environmental water requirements of the Tone river basin were 946 million m3 y−1.
Figure 3a shows the result of local characterization factors with and without IBT, comparing with the global estimates. The average value of BWS without IBT was 0.275, while the cases with IBT estimated by the Equations (1) and (2) had BWSs values of 0.355 and 0.299, respectively. The global estimate of BWS by Aqueduct resulted in 0.356 and ranked “medium to high” on a five-grade evaluation [15]. This value gave close agreement with the local estimate by Equation (1) in this study. The local estimates of characterization factors varied from 0.207 to 1.116 for the cases with IBT and 0.245 to 1.027 for cases without IBT, while the global estimates varied from 0.284 to 1.267. On average, the computed characterization factors increased a 28% by IBT.
For the characterization factors of the Arakawa river basin, Table 3 shows the local estimates of variables with their SD, including the case with IBT (using the reasoning of Equation (3)) and the case without. The average annual precipitation was 1447 mm y−1. The IBT increased the available blue water from 3052 million m3 y−1 to 4412 million m3 y−1. The computed characterization factors as local estimates comparing with the global estimates were shown in Figure 3b. The BWS was 0.387 without IBT, while it decreased to 0.268, “medium to high” considering IBT, because of increase of available blue water. According to the global estimate by Aqueduct, the BWS of this area is 0.529, “high” in the five categories. Unlike the case of the Tone river basin, the values of characterization factors with IBT had lower values without IBT. The global estimates of BWS, WSI, and fwua had higher values compared with the results of local estimates in this study. CFAWARE had a value between the local estimates with and without IBT. Although the global estimate of WSI resulted in the Arakawa river basin having the maximum level of water stress (1.000) using a global hydrological model, the local estimates both with and without IBT had lower values than the global estimates.

4. Discussion

4.1. Impact of Inter-Basin Transfer on Characterization Factors

If the global datasets of water availability and demand are a good approximation of the observed data, the global estimates and the local estimates of the case without IBT should be close. In the case of the Tone river basin, considering the ranges in which each characterization factor can vary, the global estimates of all 4 characterization factors can be considered close to the local estimates, and therefore seem good approximations. However, the mathematical formulations proposed in the assessment frameworks, we can derive that because the Tone river basin is the largest catchment area in Japan, some global estimates of the characterization factors may be misleading. For example, in the Aqueduct assessment framework, the estimation of water withdrawals adopted for calculating BWS utilizes the total volume of the country and by means of regression determines the volume of each basin based on population-density-weights [15]. Due to this procedure, the volumes of water withdrawals tend to be larger than the real ones, and consequently, the global estimate of BWS show a more “water-stressed” condition than reality. CFAWARE is another good example of the influence of the size of the basin in the characterization factors [21], where the availability-minus-demand relationship is normalized by the area of each unit-basin and the volumes of human water consumption (i.e., water demand) come from a model that employs national scale estimations of water use. Both circumstances may produce overestimated global estimates of CFAWARE in the Tone river basin.
The two possibilities for including IBT in the computation of the characterization factors yielded similar results. If we consider that IBT should modify the water withdrawals (Ws) as shown in Equation (1), which is equivalent to an increase of 29%, all characterization factors except for fwua depict a more “water-stressed” basin, which is an expected result. Because fwua is not directly a function of water withdrawals, calculating with Equation (1) does not alter the result. Alternatively, if we consider that IBT should modify the available water (Qs), which is equivalent to a reduction of 8%, all four characterization factors show a more “water-stressed” basin. Notably, computing CFAWARE with either equation yields the same result. Because availability-minus-demand is an absolute measure and not a relative measure as it happened to be for BWS and WSI, having to choose between Equations (1) or (2) is not source of uncertainty.
Even though the selected characterization factors changed when considering changes of water supply and demand as a consequence of IBT, the impact in the result of the evaluations is not substantial for the Tone river basin. For example, the categorization of the local estimates of BWS without IBT is “medium to high” (between 0.2 and 0.4) in the five-grade evaluation defined by the Aqueduct framework, which does not change when any of the two with-IBT equations used for calculating the local estimates of BWS. However, it should be noted that the impact on water footprint characterization might be more significant if the catchment area of the sending-basin is relatively small or if the volume of transferred water is substantial.
In the case of the Arakawa river basin, the global and local estimates for the case without IBT of fwua and CFAWARE are not significantly different, while the global estimates of BWS and WSI denote a much more “water-stressed” basin. Possible reasons for these outcomes are the fact that the water availability-to-demand relationship is a relative measure in BWS and WSI and the Arakawa river basin encompasses one of the most densely populated and industrialized regions of the world (Tokyo Metropolitan). Considering that IBT modifies the available water (Qr), which is equivalent to a substantial increase of 45%, all four characterization factors showed a less “water-stressed” basin. The average percentage in which all characterization factors are reduced is about 44%. This result shows how local efforts aimed at alleviating water scarcity have a great impact on the soundness of water cycle and how global estimates tend to overlook these local efforts. As it was highlighted in the discussion of the results of the Tone River Basin about the relevance of the catchment area, the fact that the diverted water into the basin is almost half (45%) of the natural available water (which is a function of the catchment area) explains the degree of impact that IBT has on the characterization factors.
While IBT impacted on the Arakawa river basin to increase the available blue water and decrease the characterization factors, which means decrease water risk and improve the water cycle soundness, it looks that the Tone river basin increased its water risk and decreased soundness of water cycle by IBT. Looking at the quantified effect of IBT, the Arakawa river basin decreased the characterization factors a 44% on average, while the Tone river basin increased them a 28%. The availability-minus-demand (AMD) of the Tone river basin without IBT was 0.070 m3 m−2 month−1, while it decreased a 9% to 0.063 m3 m−2 month−1. Considering that both rivers kept AMD considering environmental water requirements through IBT and that the positive impact of IBT for Arakawa river basin was larger than the negative impact for the Tone river basin, the IBT between the two river basins can be assessed as decreasing water risk and improving the soundness of water cycle in a comprehensive manner.

4.2. Sensibility of the Characterization Factors to Different Sources of Uncertainty

BWS is a measure that was designed to evaluate the long-term ratio of water withdrawals to available water (after upstream consumption), reducing the effect of interannual climate cycles and short-time variations of flow caused by dams or floodplains. However, since evaluation of water-related risks requires the consideration of temporal variability, BWS is usually complemented with other metrics [16]. To have a single parameter that evaluates water availability-to-demand and temporal variability as well, other assessment frameworks have included the effect of climate cycles in the characterization factors, e.g., WSI. To show the effect of temporal variability in BWS we make the exercise of computing the mean of annual BWS and compare them to the original BWS (corresponding to long-term means of availability and demand). Figure 4 shows the annual values of available blue water, withdrawals and BWS for cases with IBT and without. In the case without IBT, for which BWS is equal to 0.387, the mean of annual BWS is 0.439. Looking at the variation of available blue water in the analyzed period and considering the definition of BWS the result is coherent. In the case with IBT, for which BWS is equal to 0.268, the mean of annual BWS is 0.281. This result shows that the increase of available blue water in a (45%) almost cancels out the effect of interannual variability if BWS would be calculated annually and misleadingly does not reflect the potential risk of climate variability.

4.3. Suggestions for Assessing Soundness of the Water Cycle

The development of water footprint assessment has had the intention of designing a single characterization factor that is able to represent the risk of water consumption and the effects of additional midpoint impacts. The following observations are made by comparing the merits and weaknesses of the different assessment frameworks.
  • The Aqueduct framework proposed a set of indicators, which can be aggregated into a composite factor. However, because the end-user is able to decide which indicator has more or less importance in the assessment of risk, the process is subject to conflict. Thus, it was necessary to create a composite factor that can be accepted UNANIMOUSLY.
  • The four selected characterization factors are able to show the degree of water stress and hence are useful for stablishing a TARGET in which consumption of water does not represent a risk.
  • In this paper, we were able to REPLICATE the process of calculation of the characterization factors to validate the global estimates using local data.
  • WSI includes the effect of climate variability and to some extent the effect of regulations of river flow. However, the relative measure of demand-to-availability used in its formulation may cause quite disparate results between two basins with similar levels of water consumption and similar climate variability. Therefore, the developers of fwua and CFAWARE sought to create a characterization factor that would be easy to COMPARE.
  • The selected characterization factors were not able to reflect the effect of IBT in reducing the stressed state of the water cycle in the Arakawa river basin. To motivate local actions improving a sound water cycle, the assessment frameworks should allow local authorities and other stakeholders to AMELIORATE the state.
  • Finally, the water footprint assessment process should be based on information that can be measured and stablishes ENGAGEMENTS of the involved stakeholders based on adequate motivations, continuity and sustainability.
We conclude that the process and results of regional water footprint characterizations should have five fundamental requirements (uTRACE).
Unanimous. A result that encourages planning based on mutual consent of stakeholders.
Targetable. A value that reflects sound water cycle and can be set as target.
Replicable. A transparent evaluation based on scientific knowledge that can be validated.
Ameliorable. A concise evaluation of the water cycle state encourages practical solutions.
Comparable. A result that can be fairly compared in spite of climatological or spatial differences.
Engageable. A value that reflects the level of compromise towards achieving the target.

5. Concluding Remarks

The effect of IBT on the soundness of the water cycles (i.e., water footprint characterization) in two major river basins in Japan was evaluated using four characterization factors and observed data: BWS, WSI, fwua, and CFAWARE. The following is a summary of the contents and results of the evaluation:
Due to approximations and assumptions about small-scale variability of water supply and demand, global estimates of characterization factors fail to represent the actual local conditions that might have been changed to improve the soundness of water cycles.
In large basins with no surface water conveyances or other changes of freshwater sources, the global estimates of characterization factors can be a good approximation of the estimates calculated with local data and observations.
Changes in the existing water stores and natural freshwater courses such as meltwater from glaciers, desalination in coastal regions, and IBT need to be included in the characterization of water-related risk assessments. When the change in supply is substantial, such as the Arakawa river basin receiving a volume equal to 45% of its natural supply from the Tone River, the global estimates of the selected characterization factors depicted a more “water-stressed” condition.
We resulted that the IBT between the Tone and Arakawa river basins decreased water risk and improve the soundness of water cycle from averaged results of characterization factors in a comprehensive manner.
The existing characterization factors were designed to evaluate the water-related risks for specific simplified conditions. However, appropriate risk assessments need to consider spatiotemporal variations of the availability-to-demand relation. With current ambiguity in the definition of some characterization factors, it is difficult to include local water surface conveyances such as IBT. Moreover, with a simple exercise we show how the effect of temporal variability can be ameliorated with changes of supply producing misleading results of the potential risk of climate variability.
Good practices towards a sound water cycle should be based on assessments that provide uTRACE results.

Author Contributions

Conceived and designed the experiments, S.Y. and T.O. (Taikan Oki); Contributed data collection and analysis design, T.O. (Toshio Okazumi), Y.I. and M.Y.; Performed the experiments and analysed the data, K.N., T.K., D.O., A.M., and M.G.-G.; Wrote the paper, S.Y. and M.G.-G.

Funding

This research received no external funding.

Acknowledgements

This research is a part of the activities by the Secretariat of Water Cycle Policy Headquarters in Cabinet Secretariat, Japan.

Conflicts of Interest

The authors declare no conflicts of interest.

References

  1. Sustainable Development Goals. Available online: https://www.un.org/sustainabledevelopment/ (accessed on 8 May 2018).
  2. Sustainable Development Goal 6. Available online: https://sustainabledevelopment.un.org/sdg6 (accessed on 8 May 2018).
  3. Postel, S.L.; Daily, G.C.; Ehrlich, P.R. Human appropriation of renewable fresh water. Science 1996, 271, 785–788. [Google Scholar] [CrossRef]
  4. Oki, T.; Kanae, S. Global hydrological cycles and world water resources. Science 2006, 313, 1068–1072. [Google Scholar] [CrossRef] [PubMed]
  5. WWAP (United Nations World Water Assessment Programme)/UN-Water the United Nations World Water Development Report 2018: Nature-Based Solutions for Water; UNESCO: Paris, France, 2018.
  6. Brutsaert, W. Hydrology: An Introduction; Cambridge University Press: Cambridge, UK, 2005. [Google Scholar]
  7. Responding Properly to Issues on Water Resources. Available online: http://www.mlit.go.jp/tochimizushigen/mizsei/water_resources/contents/responding_properly.html (accessed on 8 May 2018).
  8. Taniguchi, M. The Basic act on the water cycle with groundwater. J. Groundwater Hydrol. 2015, 57, 83–90. [Google Scholar] [CrossRef]
  9. Hoekstra, A.Y.; Chapagain, A.K.; Aldaya, M.M.; Mekonnen, M.M. The Water Footprint Assessment Manual: Setting the Global Standard; Earthscan: London, UK, 2011. [Google Scholar]
  10. Water Footprint Network Website. Available online: http://waterfootprint.org/en/ (accessed on 10 May 2018).
  11. ISO. ISO 14040:2006 Environmental Management-Life Cycle Assessment-Principles and Framework; International Organization for Standardization: Geneva, Switzerland, 2006. [Google Scholar]
  12. ISO. ISO 14046 Environmental Management, Water Footprint—Principles, Requirements and Guidelines; International Organization for Standardization: Geneva, Switzerland, 2014. [Google Scholar]
  13. Shiklomanov, I.A. Appraisal and assessment of world water resources. Water Int. 2000, 25, 11–32. [Google Scholar] [CrossRef]
  14. Oki, T.; Yano, S.; Hanasaki, N. Economic aspects of virtual water trade. Environ. Res. Lett. 2017, 12, 044002. [Google Scholar] [CrossRef] [Green Version]
  15. World Resources Institute AQUEDUCT Water Risk Framework; WRI: Washington, DC, USA, 2013.
  16. The Water Risk Filter. Available online: http://waterriskfilter.panda.org/ (accessed on 11 May 2018).
  17. Global Water Tool. Available online: https://www.wbcsd.org/Clusters/Water/Resources/Global-Water-Tool (accessed on 11 May 2018).
  18. Water Risk Monetizer. Available online: https://www.waterriskmonetizer.com (accessed on 11 May 2018).
  19. Pfister, S.; Koehler, A.; Hellweg, S. Assessing the environmental impacts of freshwater consumption in LCA. Environ. Sci. Technol. 2009, 43, 4098–4104. [Google Scholar] [CrossRef] [PubMed]
  20. Yano, S.; Hanasaki, N.; Itsubo, N.; Oki, T. Water scarcity footprints by considering the differences in water sources. Sustainability 2015, 7, 9753–9772. [Google Scholar] [CrossRef]
  21. Boulay, A.; Bare, J.; Benini, L.; Berger, M.; Lathuillière, M.J.; Manzardo, A.; Margni, M.; Motoshita, M.; Núñez, M.; Pastor, A.V.; et al. The WULCA consensus characterization model for water scarcity footprints: Assessing impacts of water consumption based on available water remaining (AWARE). Int. J. Life Cycle Assess. 2018, 23, 368–378. [Google Scholar] [CrossRef]
  22. Gassert, F.; Shiao, T.; Luck, M. Colorado River Basin Study; Working Paper; World Resources Institute: Washington, DC, USA, 2013. [Google Scholar]
  23. Gassert, F.; Luo, T.; Shiao, T.; Luck, M. Yellow River Basin Study; Working Paper; World Resources Institute: Washington, DC, USA, 2013. [Google Scholar]
  24. Gassert, F.; Luo, T.; Shiao, T.; Luck, M. Yangtze River Basin Study; Working Paper; World Resources Institute: Washington, DC, USA, 2013. [Google Scholar]
  25. Gassert, F.; Rai, P.; Reig, P.; Luck, M. Mekong River Basin Study; Working Paper; World Resources Institute: Washington, DC, USA, 2012. [Google Scholar]
  26. Reig, P.; Gassert, F.; Luck, M. Orange-Senqu River Basin Study; Working Paper; World Resources Institute: Washington, DC, USA, 2013. [Google Scholar]
  27. Luo, T.; Krishnan, D.; Sen, S. Parched Power, Water Demands, Risks, and Opportunities for India’s Power Sector; Working Paper; World Resources Institute: Washington, DC, USA, 2018. [Google Scholar]
  28. Long-Term Plans for Water Resources. Available online: http://www.mlit.go.jp/tochimizushigen/mizsei/water_resources/contents/long-term_plans.html (accessed on 17 May 2018).
  29. Musashi Suiro. Available online: https://www.water.go.jp/kanto/musasi/summary/index2.html (accessed on 3 September 2018).
  30. AQUEDUCT Measuring and Mapping Water Risk. Available online: http://www.wri.org/our-work/project/aqueduct (accessed on 11 May 2018).
  31. Brown, A.; Matlock, M.D. A Review of Water Scarcity Indices and Methodologies; White Paper #106; The Sustainability Consortium: Arkansas, AR, USA, 2011. [Google Scholar]
  32. ISO Environmental Management—Water Footprint—Illustrative Examples on How to Apply ISO 14046; International Organization for Standardization: Geneva, Switzerland, 2017.
  33. Rosenbaum, R.K.; Hauschild, M.Z.; Boulay, A.M.; Fantke, P.; Laurent, A.; Núñez, M.; Vieira, M. Life cycle impact assessment. In Life Cycle Assessment: Theory and Practice; Hauschild, M., Rosenbaum, R., Olsen, S., Eds.; Springer: Cham, Switzerland, 2018. [Google Scholar]
  34. Nilsson, C.; Reidy, C.A.; Dynesius, M.; Revenga, C. Fragmentation and flow regulation of the world’s large river systems. Science 2005, 308, 405–408. [Google Scholar] [CrossRef] [PubMed]
  35. Yano, S.; Hanasaki, N.; Itsubo, N.; Oki, T. Potential impacts of food production on freshwater availability considering water sources. Water 2016, 8, 163. [Google Scholar] [CrossRef]
  36. Database of Dams. Available online: http://mudam.nilim.go.jp/home (accessed on 7 June 2018).
  37. Basin Development Plan of Tone River System. Available online: http://www.ktr.mlit.go.jp/river/shihon/index00000038.html (accessed on 7 June 2018).
  38. AMeDAS. Available online: https://www.jma.go.jp/jma/en/Activities/amedas/amedas.html (accessed on 31 July 2018).
Figure 1. Location of the Tone and the Arakawa River Basins.
Environments 05 00105 g001
Figure 2. Location of the Tone and Arakawa River Basins in the global datasets of the selected characterization factors. (a) Basin ID of the global estimates of WSI (Water Stress Index) and CFAWARE; (b) Grid of the fwua dataset in which the river mouths are located.
Environments 05 00105 g002
Figure 3. Estimated local and global results of each characterization factor with and without IBT for (a) the Tone river basin, (b) the Arakawa river basin.
Environments 05 00105 g003
Figure 4. Annual volumes of available blue water and withdrawals, and annual BWS (Baseline Water Stress) for the Arakawa river basin. (a) without IBT and (b) with IBT.
Environments 05 00105 g004aEnvironments 05 00105 g004b
Table 1. Description of characterization factors.
IndicatorExpressionRangeResolution
Baseline Water Stress
(BWS) [15]
W a t e r   w i t h d r a w a l s A v a i l a b l e   b l u e   w a t e r 0~∞Basin
Water Stress Index
(WSI) [19]
1 1 + e 6.4 · WTA ( 1 0.01 1 )
WTA*: adjusted WTA
(WTA: withdrawal to availability)
0.01~1Basin,
0.5° × 0.5°
Water unavailability factor
(fwua) [20]
A x , l A r e f
A: required land area to obtain the reference volume of water
0~∞
(99 percentile)
0.5° × 0.5°
CFAWARE [21] AMD world   avg AMD i
AMD: availability-minus-demand
0.1~100Basin,
0.5° × 0.5°
WTA*: adjusted WTA.
Table 2. Computed local estimates of variables with and without IBT (inter-basin transfer) for the Tone river basin (1985–2013).
VariableWith IBT (Equation (1))SD (StanDard DeviatIons)With IBT (Equation (2))SDWithout IBTSD
Annual Precipitation, Pa (mm y−1)145817814581781458178
Annual Withdrawals, Ws(Mm3 y−1)5824278.94509238.74509238.7
Available Blue Water, Qs (Mm3 y−1)16,3973195.415,0823220.816,3973195.4
Transferred Water, T (Mm3 y−1)1315 1315 0
Human Water Consumption (Mm3 y−1)2695 2695 1384
Environmental Water Requirements (Mm3 y−1)946 946 946
Table 3. Computed local estimates of variables with and without IBT for the Arakawa river basin (1985–2009).
VariableWith IBT
(Equation (3))
SDWithout
IBT
SD
Annual Precipitation,
Pa (mm y−1)
14472291447229
Annual Withdrawals,
Ws (Mm3 y−1)
118185.2118185.2
Available Blue Water,
Qs (Mm3 y−1)
44121024.730521020.9
Transferred Water,
T (Mm3 y−1)
1360 0
Human Water Consumption
(Mm3 y−1)
79 79
Environmental Water Requirements
(Mm3 y−1)
158 158

