Life Cycle Assessment and Water Footprint of Hydrogen Production Methods: From Conventional to Emerging Technologies

 ,
,  , ,
, , 

Abstract
1. Introduction
2. Materials and Methods
2.1. Life-Cycle Assessment (LCA) Methodology
- (1)
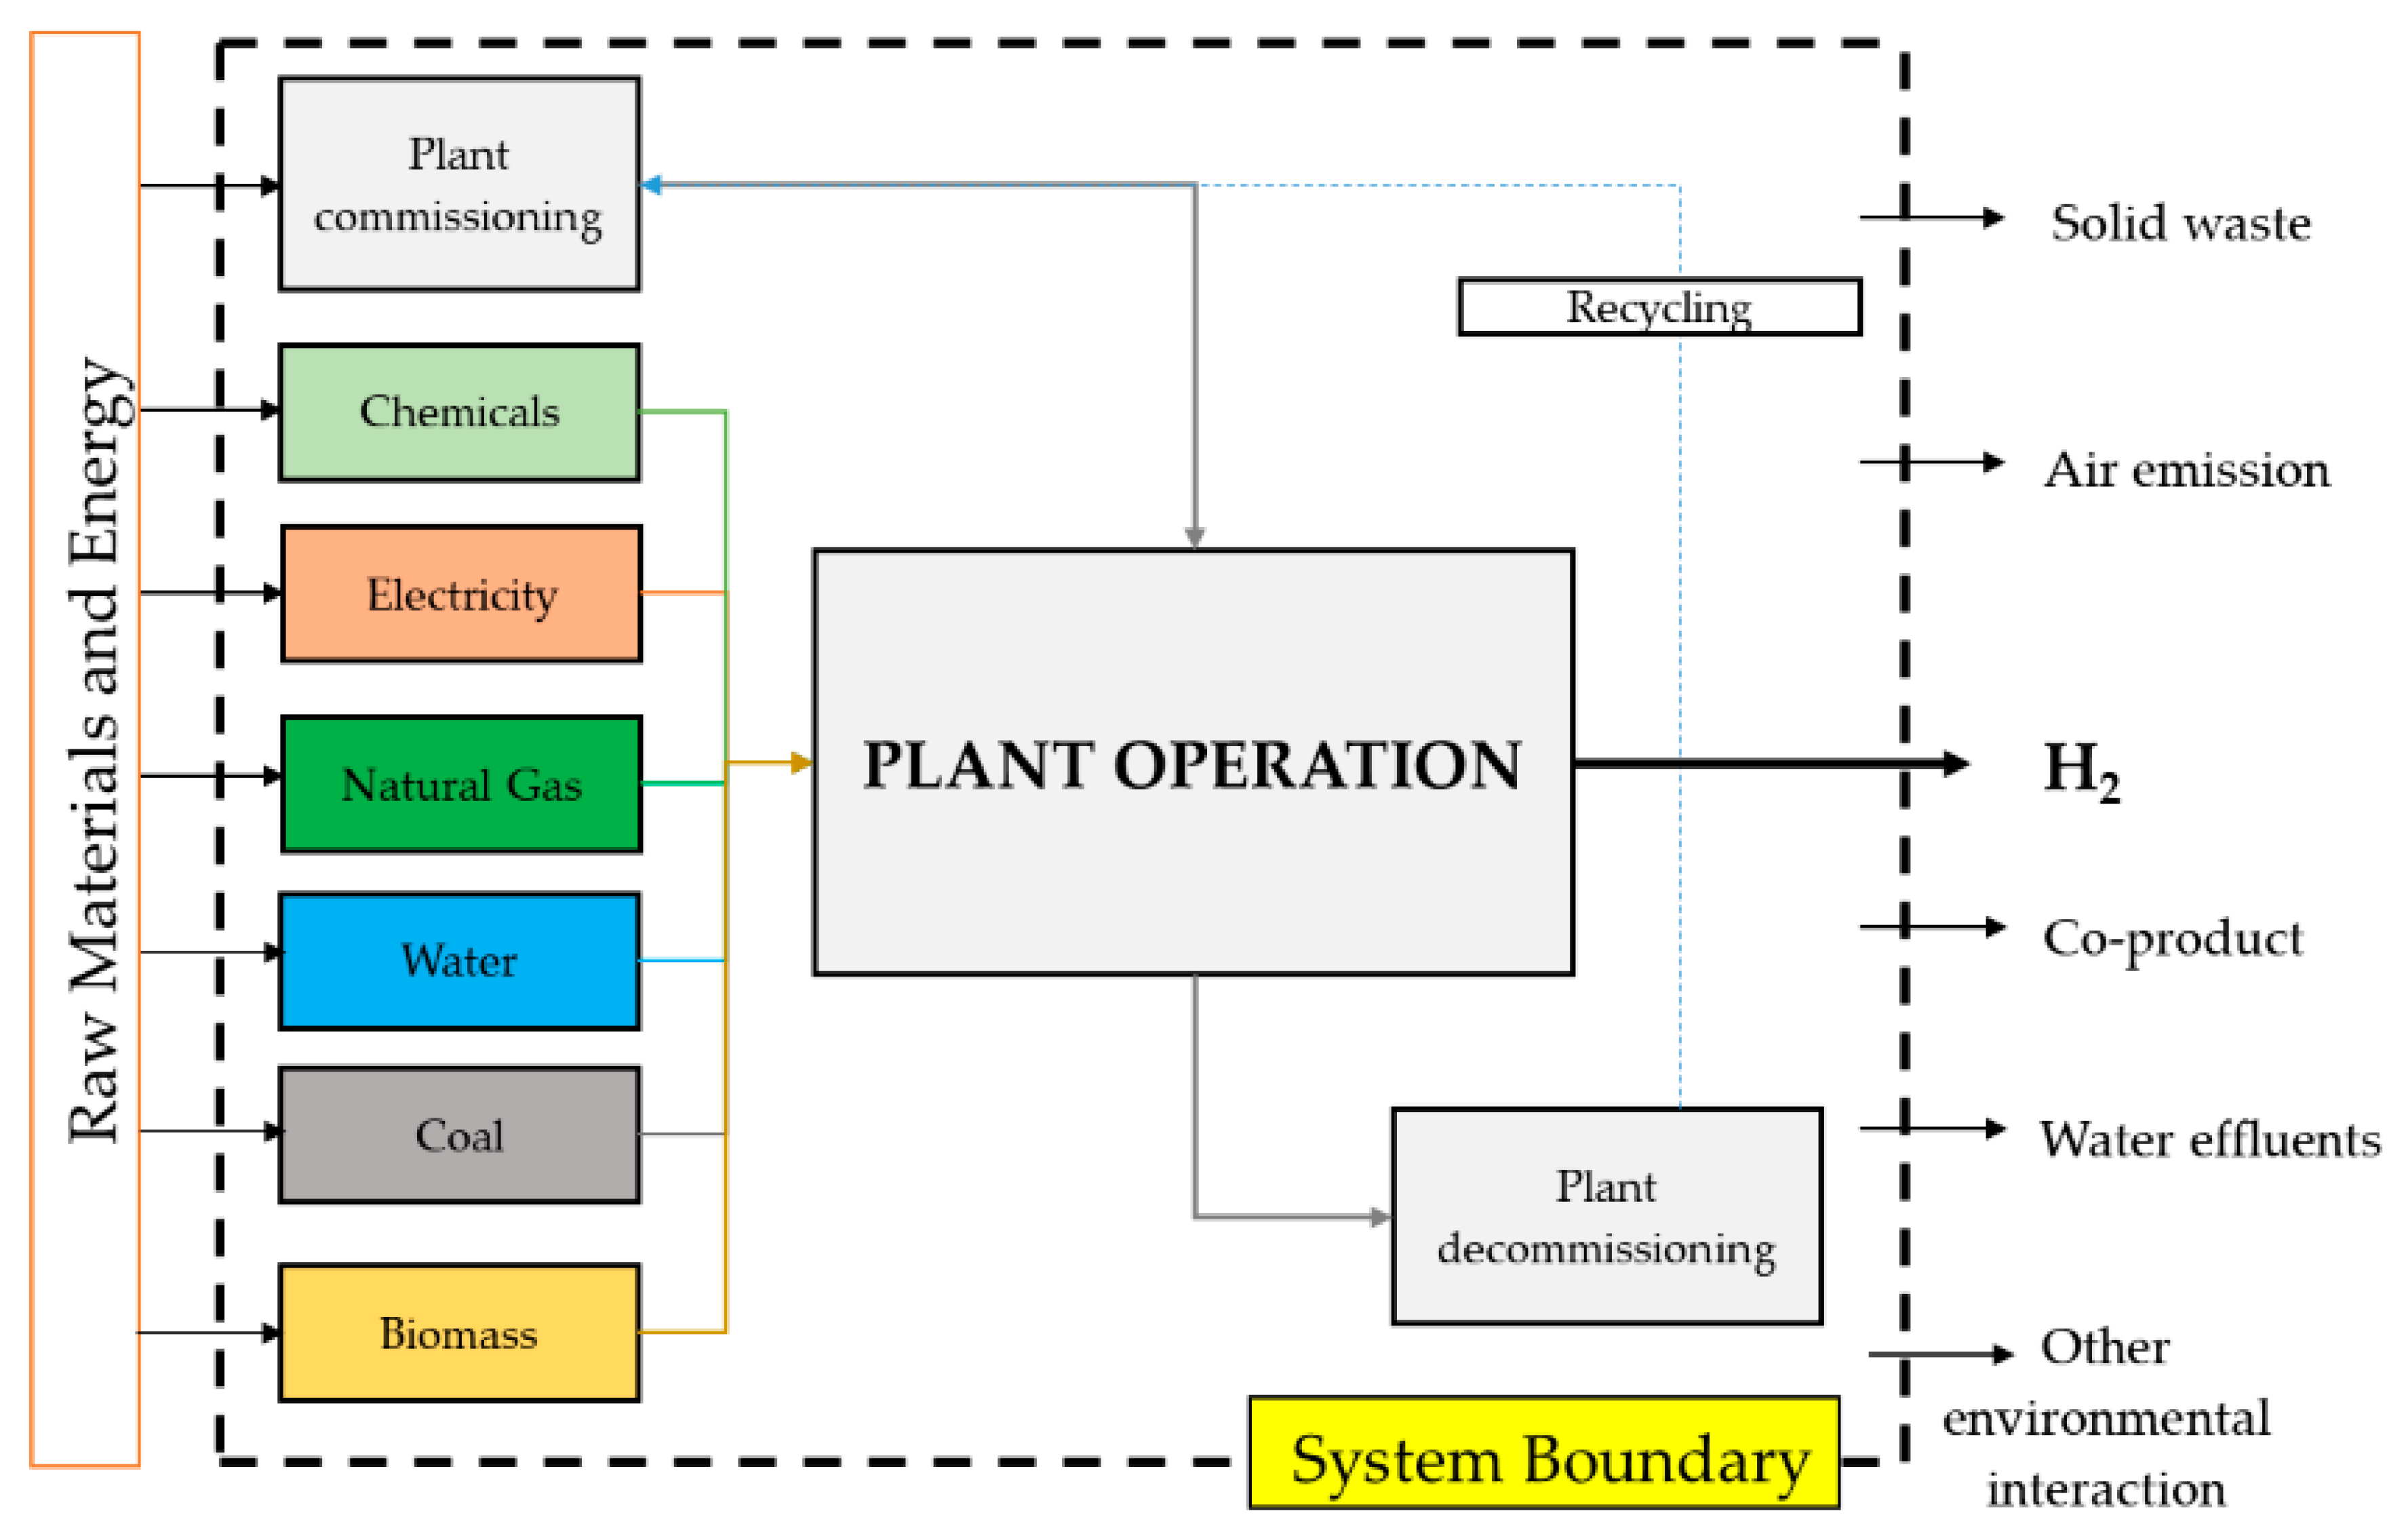
- Goal and scope definition: The goal definition defines the purpose of the analysis. Scope definition determines the functional unit to be analyzed and system boundaries regarding spatial and temporal characteristics and methods used for impact assessment.
- (2)
- Life Cycle Inventory Analysis (LCI): In the LCI relevant data about energy and material inputs, emissions, wastes, and other outputs are collected and quantified.
- (3)
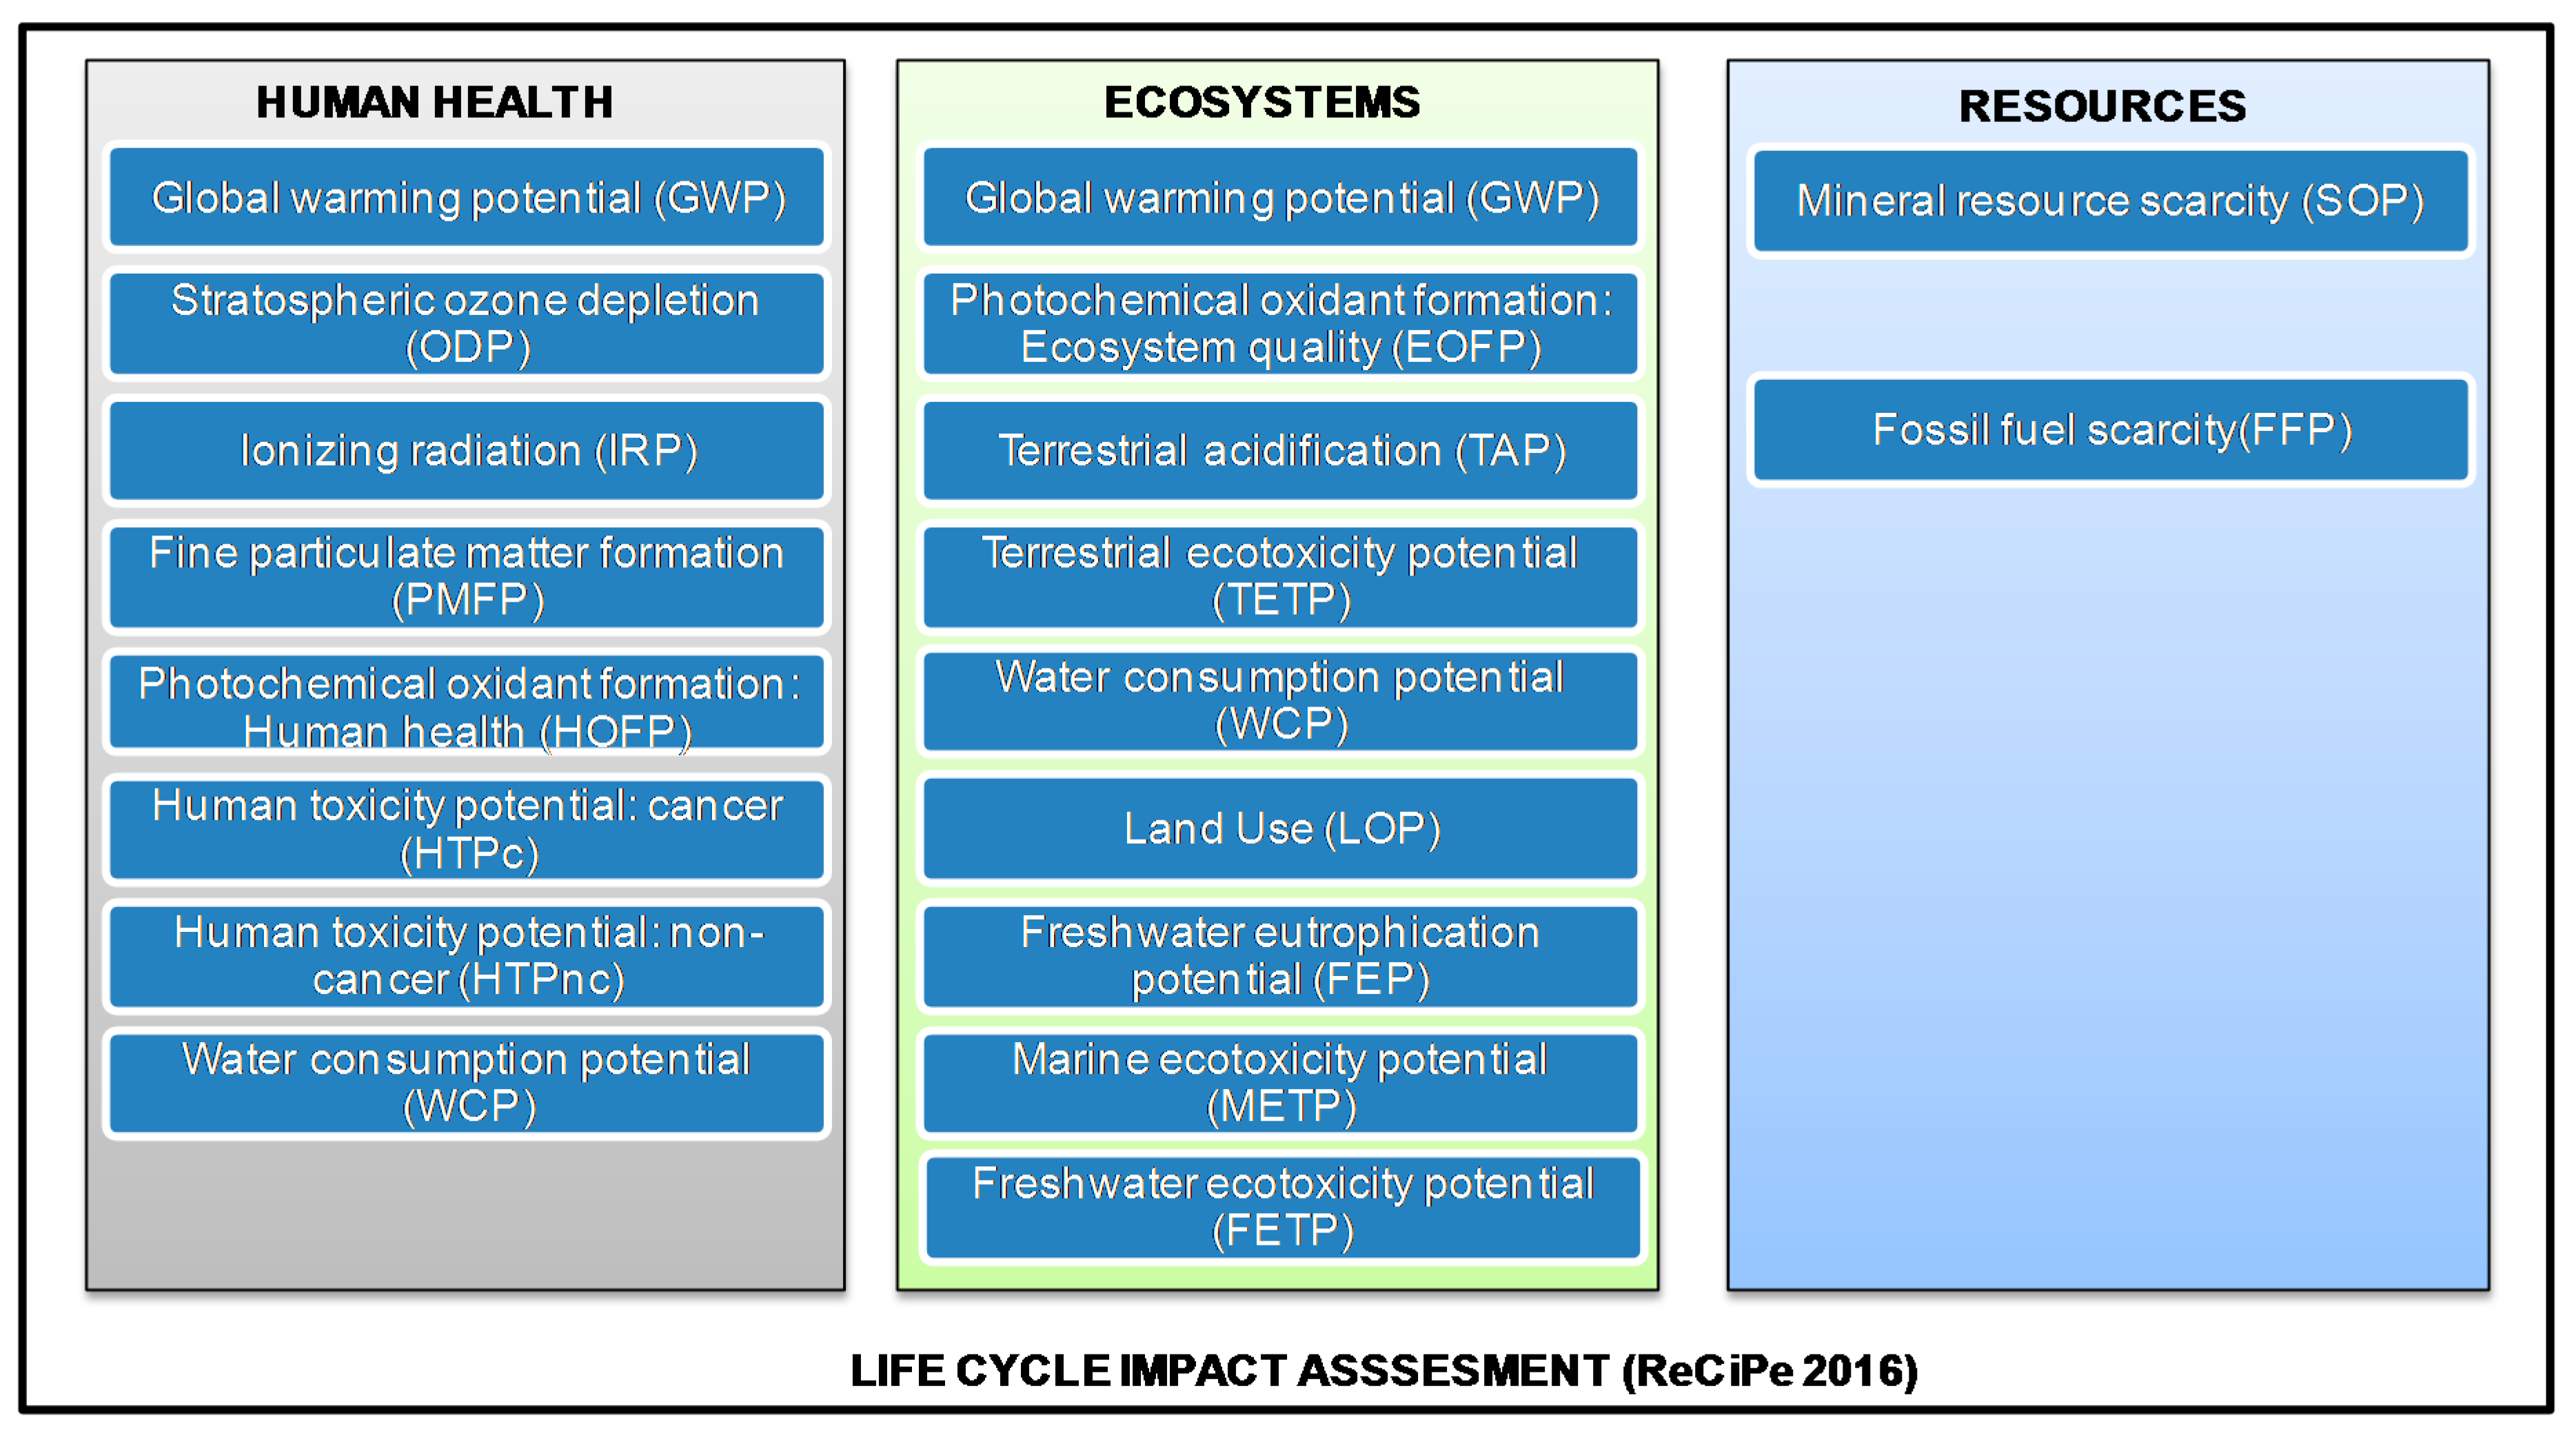
- Life Cycle Impact Assessment (LCIA): The compiled system inputs and outputs are characterized and aggregated to better understand their environmental significance.
- (4)
- Interpretation: This last LCA step summarizes the LCI and LCIA results and their quality. Conclusions and recommendations are drawn.
2.1.1. LCA Goal and Scope Definition
2.1.2. Hydrogen Production Technologies and Inventory
Natural Gas Reforming
Coal Gasification
Biomass Gasification
Ethanol Reforming
Electrolytic Production Process
Dark Fermentation and Microbial Electrolysis Cell (MEC)
2.1.3. Impact Assessment
3. Results and Discussion
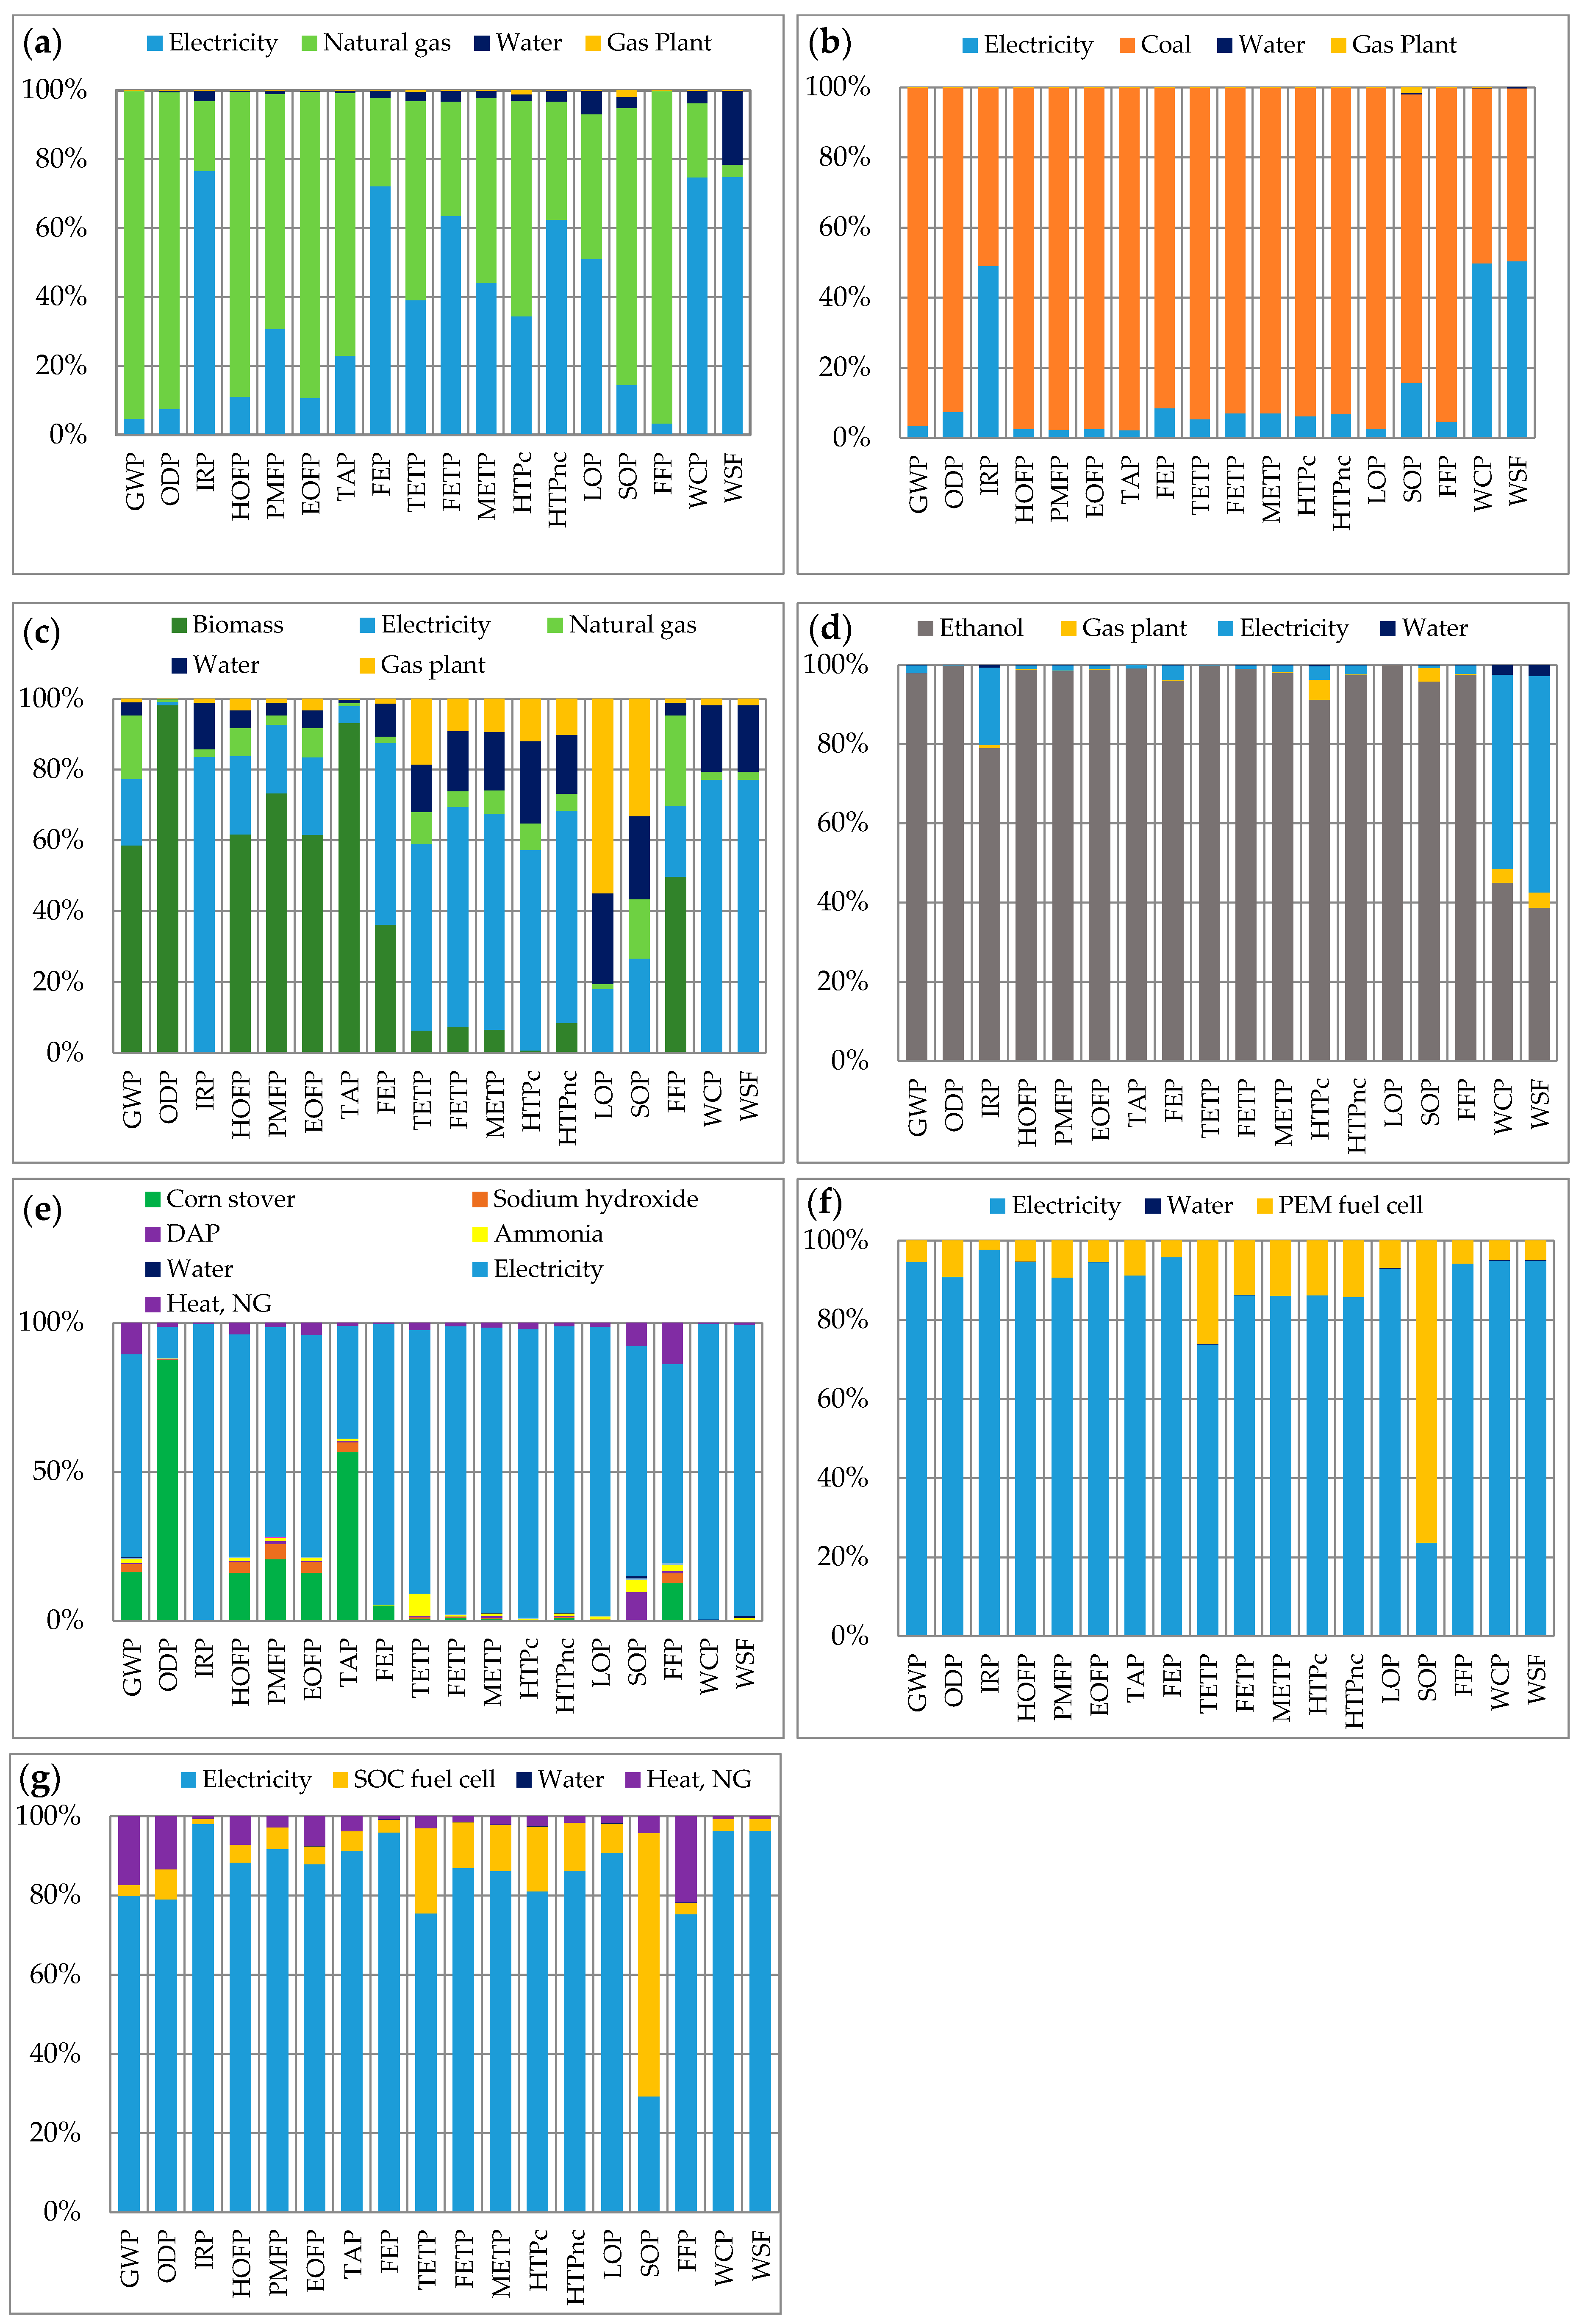
3.1. Midpoint Environmental Performance
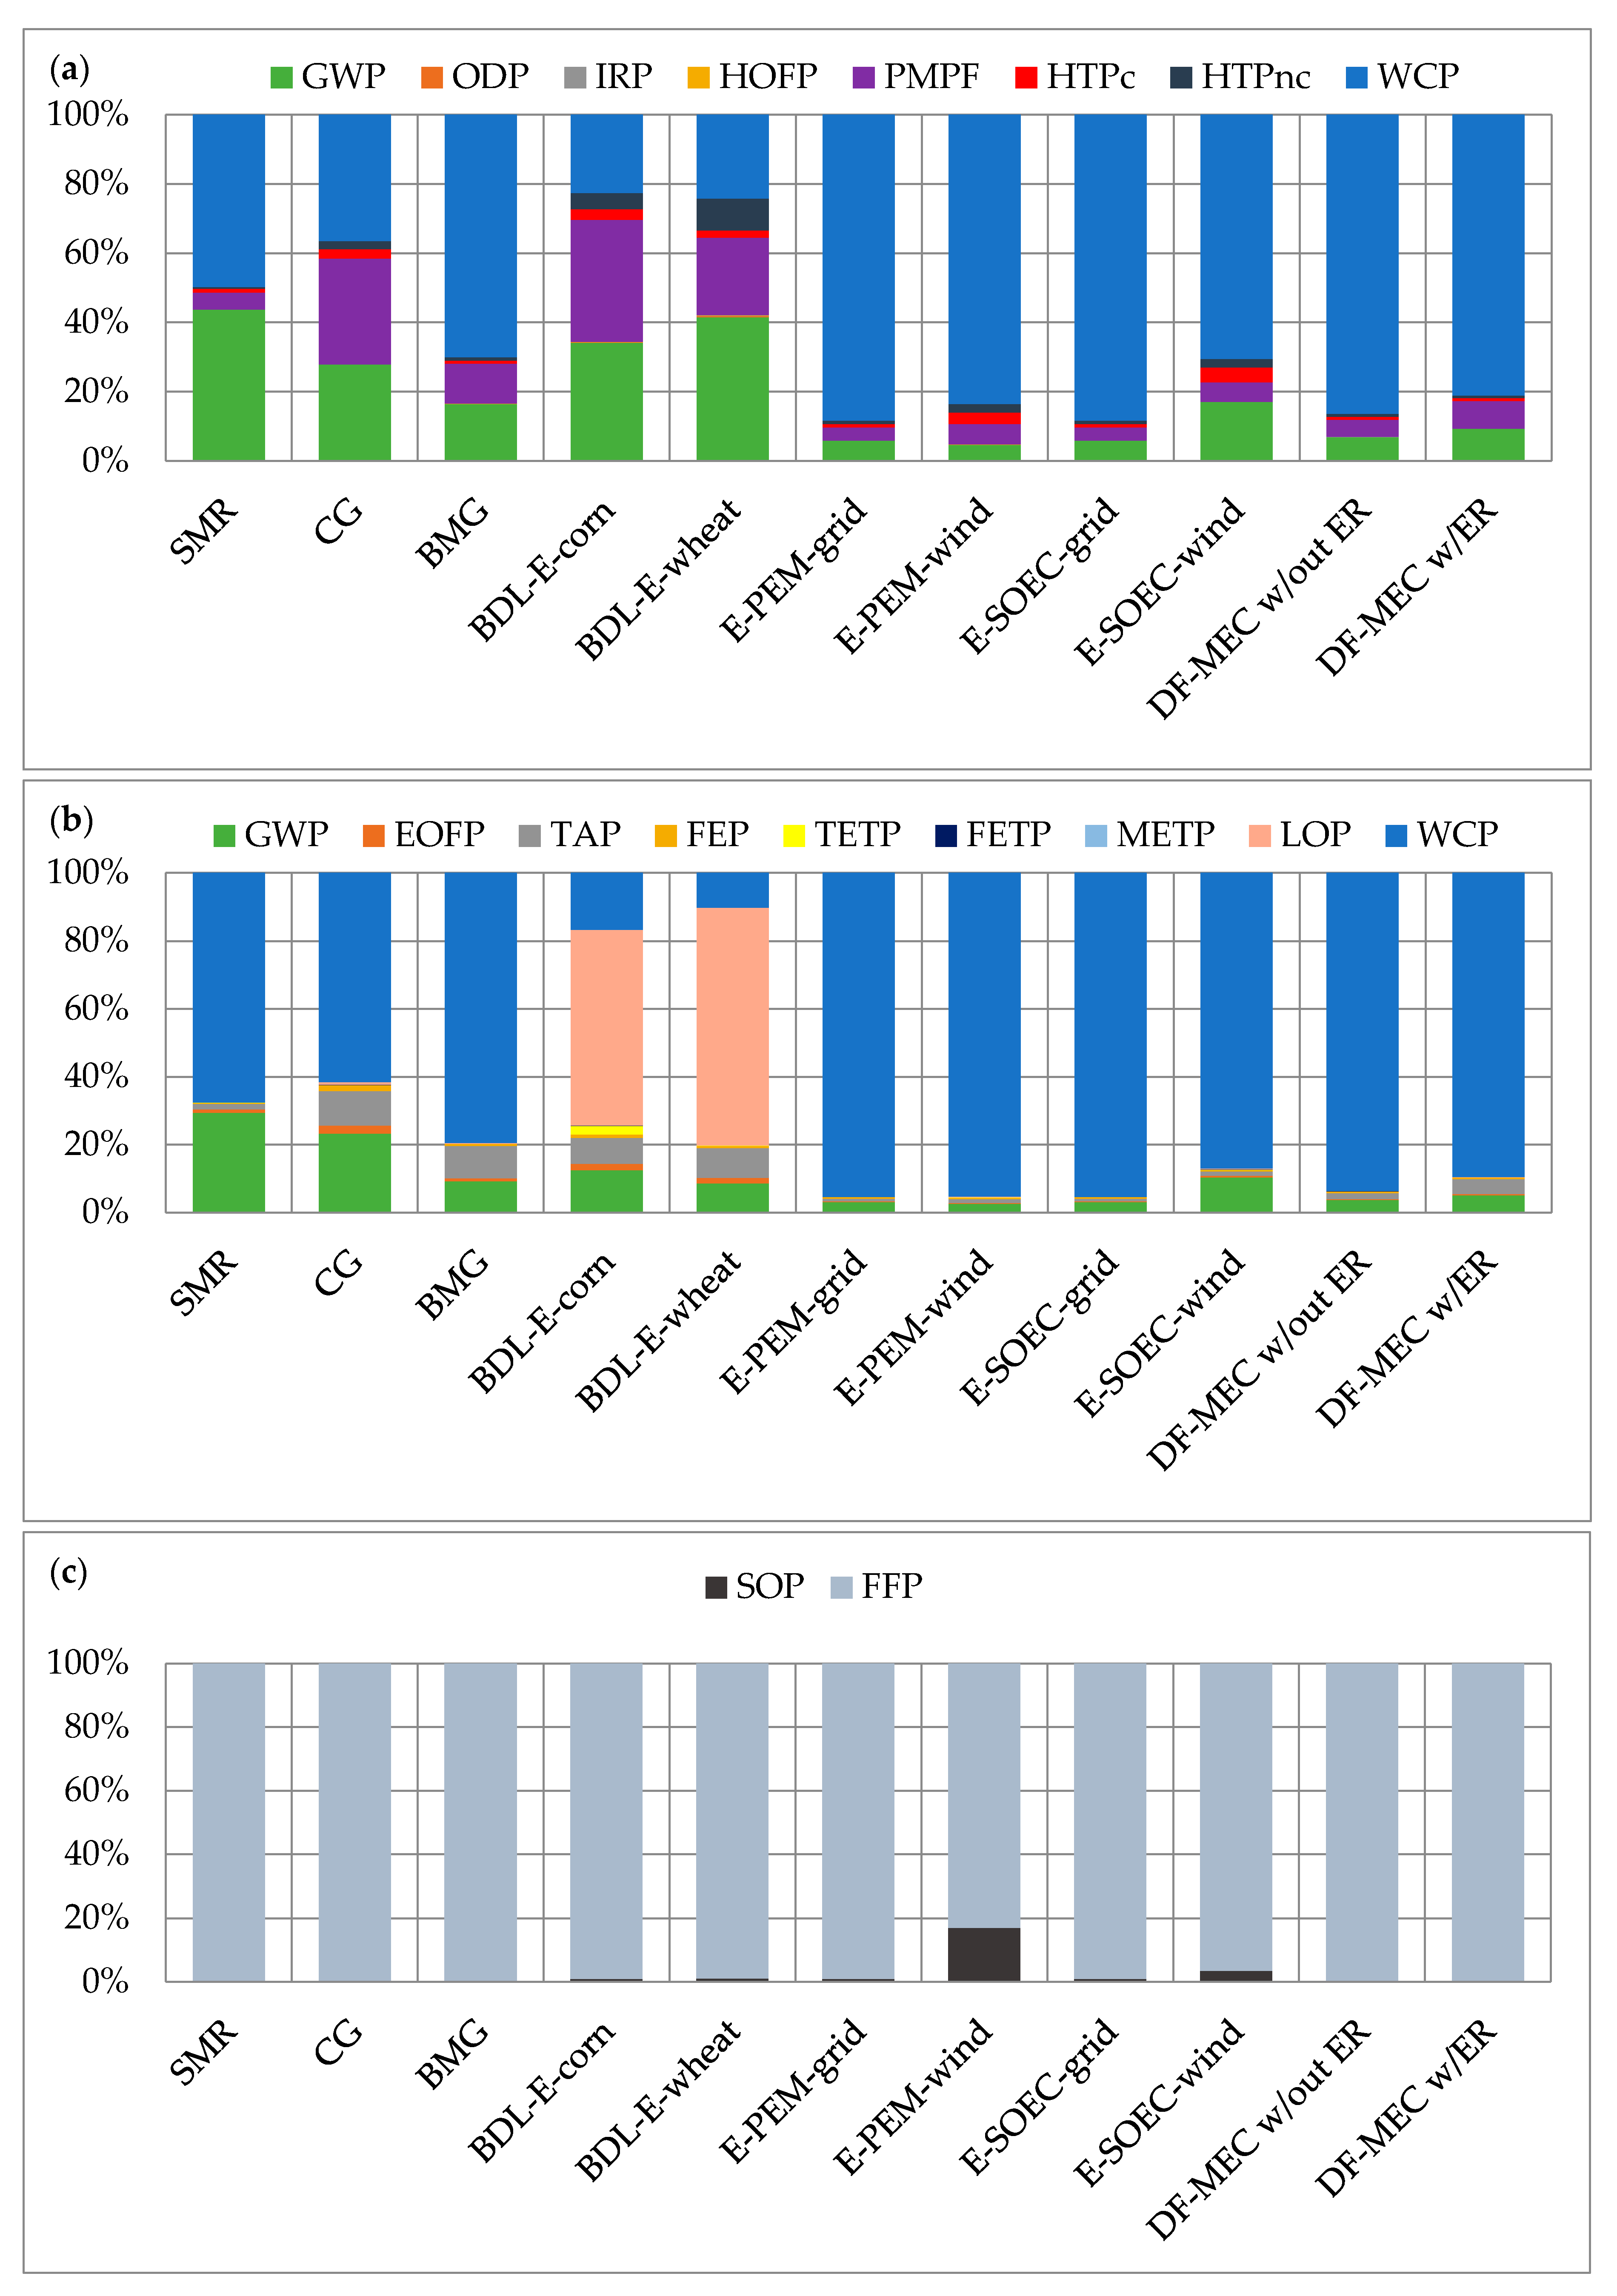
3.2. Endpoint Environmental Performance
4. Conclusions
Author Contributions
Conflicts of Interest
References
- Marban, G.; Valdes-Soleis, T. Towards the hydrogen economy? Int. J. Hydrogen Energy 2007, 32, 1625–1637. [Google Scholar] [CrossRef]
- Masoni, P.; Zamagni, A. Guidance Document for Performing LCAs on Fuel Cells and H2 Technologies. FC-HyGuide: Deliverable D3.3. 2011. Available online: http://www.fc-hyguide.eu/documents/10156/FC_Guidance_Document.pdf (accessed on 30 September 2011).
- International Organization for Standardization (ISO). ISO 14040 Environmental Management-Life Cycle Assessment-Principles and Framework; ISO: Geneva, Switzerland, 2006. [Google Scholar]
- McManus, M.C.; Taylor, C.M. The changing nature of life cycle assessment. Biomass Bioenergy 2015, 82, 13–26. [Google Scholar] [CrossRef] [PubMed]
- Spath, P.L.; Mann, M.K. Life Cycle Assessment of Hydrogen Production via Natural Gas Steam Reforming; National Renewable Energy Laboratory: Golden, CO, USA, 2001; NREL/TP-570-27637.
- Utgikar, V.; Thiesen, T. Life cycle assessment of high temperature electrolysis for hydrogen production via nuclear energy. Int. J. Hydrogen Energy 2006, 31, 939–944. [Google Scholar] [CrossRef]
- Koroneos, C.; Dompros, A.; Roumbas, G. Hydrogen production via biomass gasification-A life cycle assessment approach. Chem. Eng. Process. Process Intensif. 2008, 47, 1267–1274. [Google Scholar] [CrossRef]
- Cetinkaya, E.; Dincer, I.; Naterer, G.F. Life cycle assessment of various hydrogen production methods. Int. J. Hydrogen Energy 2012, 37, 2071–2080. [Google Scholar] [CrossRef]
- Acar, C.; Dincer, I. Comparative assessment of hydrogen production methods from renewable and non-renewable sources. Int. J. Hydrogen Energy 2014, 39, 1–12. [Google Scholar] [CrossRef]
- Bhandari, R.; Trudewind, C.A.; Zapp, P. Life cycle assessment of hydrogen production via electrolysis—A review. J. Clean. Prod. 2014, 85, 151–163. [Google Scholar] [CrossRef]
- Valente, A.; Iribarren, D.; Dufour, J. Life cycle assessment of hydrogen energy systems: A review of methodological choices. Int. J. Life Cycle Assess. 2016, 1–18. [Google Scholar] [CrossRef]
- Huijbregts, M.A.J.; Steinmann, Z.J.N.; Elshout, P.M.F.; Stam, G.; Verones, F.; Vieira, M.; Zijp, M.; Hollander, A.; van Zelm, R. ReCiPe2016: A harmonised life cycle impact assessment method at midpoint and endpoint level. Int. J. Life Cycle Assess. 2017, 22, 138–147. [Google Scholar] [CrossRef]
- Pfister, S.; Boulay, A.M.; Berger, M.; Hadjikakou, M.; Motoshita, M.; Hess, T.; Ridoutt, B.; Weinzettel, J.; Scherer, L.; Döll, P.; et al. Understanding the LCA and ISO water footprint: A response to Hoekstra (2016) “A critique on the water-scarcity weighted water footprint in LCA”. Ecol. Indic. 2017, 72, 352–359. [Google Scholar] [CrossRef]
- Elgowainy, A.; Gaines, L.; Wang, M. Fuel-Cycle Analysis of Hydrogen-Powered Fuel-Cell Systems with the GREET Model; Argonne National Laboratory: Lemont, IL, USA, 2008; pp. 1252–1256.
- Berger, M.; Finkbeiner, M. Water footprinting: How to address water use in life cycle assessment? Sustainability 2010, 2, 919–944. [Google Scholar] [CrossRef]
- Alvarenga, R.; Lins, I.; Almeida Neto, J. Evaluation of Abiotic Resource LCIA Methods. Resources 2016, 5, 13. [Google Scholar] [CrossRef]
- Boulay, A.-M.M.; Hoekstra, A.Y.; Vionnet, S. Complementarities of Water-Focused Life Cycle Assessment and Water Footprint Assessment. Environ. Sci. Technol. 2013, 47, 11926–11927. [Google Scholar] [CrossRef] [PubMed]
- Kounina, A.; Margni, M.; Bayart, J.-B.; Boulay, A.-M.; Berger, M.; Bulle, C.; Frischknecht, R.; Koehler, A.; Milà i Canals, L.; Motoshita, M.; et al. Review of methods addressing freshwater use in life cycle inventory and impact assessment. Int. J. Life Cycle Assess. 2012, 18, 707–721. [Google Scholar] [CrossRef]
- Boulay, A.M.; Bare, J.; Benini, L.; Berger, M.; Lathuillière, M.J.; Manzardo, A.; Margni, M.; Motoshita, M.; Núñez, M.; Pastor, A.V.; et al. The WULCA consensus characterization model for water scarcity footprints: Assessing impacts of water consumption based on available water remaining (AWARE). Int. J. Life Cycle Assess. 2017, 1–11. [Google Scholar] [CrossRef]
- Angelis-Dimakis, A.; Arampatzis, G.; Assimacopoulos, D. Systemic eco-efficiency assessment of meso-level water use systems. J. Clean. Prod. 2016, 138, 195–207. [Google Scholar] [CrossRef]
- Steward, D.; Ramsden, T.; Zuboy, J. H2A Central Hydrogen Production Model, Version 3 User Guide; National Renewable Energy Laboratory: Lakewood, CO, USA, 2012.
- GREET Model 2017. Available online: http://greet.es.anl.gov/ (accessed on 3 November 2017).
- Dufour, J.; Serrano, D.P.; Gálvez, J.L.; Moreno, J.; González, A. Hydrogen Production from Fossil Fuels: Life Cycle Assessment of Technologies with Low Greenhouse Gas Emissions. Energy Fuels 2011, 25, 2194–2202. [Google Scholar] [CrossRef]
- Lampert, D.; Cai, H.; Wang, Z.; Wu, M.; Han, J.; Dunn, J.; Sullivan, J.; Elgowainy, A.; Wang, M. Development of a Life Cycle Inventory of Water Consumption Associated with the Production of Transportation Fuels; Argonne National Laboratory: Lemont, IL, USA, 2015.
- Dai, Q.; Elgowainy, A.; Kelly, J.; Han, J.; Wang, M.; Group, S.A.; Division, E.S. Life Cycle Analysis of Hydrogen Production from Non-Fossil Sources; Argonne National Laboratory: Lemont, IL, USA, 2016.
- Bargigli, S.; Raugei, M.; Ulgiati, S. Comparison of thermodynamic and environmental indexes of natural gas, syngas, and hydrogen production processes. Energy 2004, 29, 2145–2159. [Google Scholar] [CrossRef]
- James, B. Current (2010) Steam Methane Reformer (SMR) at Forecourt 1500 kg/day, v3.101. Available online: https://www.hydrogen.energy.gov/h2a_prod_studies.html (accessed on 3 September 2017).
- Steward, D. Current (2005) Hydrogen from Coal without CO2 Capture and Sequestration, v3.101. Available online: https://www.hydrogen.energy.gov/h2a_prod_studies.html (accessed on 3 September 2017).
- Mann, M.; Steward, D.M. Current (2010) Hydrogen from Biomass via Gasification and Catalytic Steam Reforming, v3.101. Available online: http://www.hydrogen.energy.gov/h2a_production.html (accessed on 3 September 2017).
- James, B. Current (2010) Ethanol Steam Reformer (SR) at Forecourt 1500 kg/day, Version 3.0. Strategic Analysis, Inc.: Arlington, VA, USA. Available online: https://www.hydrogen.energy.gov/h2a_prod_studies.html (accessed on 3 September 2017).
- Saur, G.; Ramsden, T.; James, B.; Collella, W. Current (2010) Hydrogen Production from Distributed Grid PEM Electrolysis, v3.101. Available online: https://www.hydrogen.energy.gov/h2a_prod_studies.html (accessed on 3 September 2017).
- James, B.D.; Moton, J.M. Techno-Economic Analysis of PEM Electrolysis for Hydrogen Production; Electrolytic Hydrogen Production Workshop, National Renewable Energy Laboratory: Golden, CO, USA, 2014.
- Harvego, E.A.; O’Brien, J.E.; McKellar, M.G. System evaluation and life-cycle cost analysis of a commercial scale high-temperature electrolysis hydrogen production plant. In Proceedings of the ASME 2012 International Mechanical Engineering Congress and Exposition, Houston, TX, USA, 9–15 November 2012; Volume 6, pp. 875–884. [Google Scholar] [CrossRef]
- Kirtay, E. Recent advances in production of hydrogen from biomass. Energy Convers. Manag. 2011, 52, 1778–1789. [Google Scholar] [CrossRef]
- Iribarren, D.; Susmozas, A.; Petrakopoulou, F.; Dufour, J. Environmental and exergetic evaluation of hydrogen production via lignocellulosic biomass gasification. J. Clean. Prod. 2014, 69, 165–175. [Google Scholar] [CrossRef]
- Albertazzi, S.; Basile, F.; Brandin, J.; Einvall, J.; Hulteberg, C.; Fornasari, G.; Rosetti, V.; Sanati, M.; Trifirò, F.; Vaccari, A. The technical feasibility of biomass gasification for hydrogen production. Catal. Today 2005, 106, 297–300. [Google Scholar] [CrossRef]
- King, D.L.; Contact, P.; Wang, Y.; Cao, J.; Xia, G.; Roh, H.; Platon, A. IV. A. 6 Production of Hydrogen by Biomass Reforming; Pacific Northwest National Laboratory: Richland, WA, USA, 2005; pp. 98–105.
- Dufour, J.; Serrano, D.P.; Moreno, J.; Gálvez, J.L.; Dufour, J.; Technology, E.; Rey, U.; Carlos, J.; Carlos, R.J.; Energía, I. Life Cycle Assessment of Hydrogen Production Processes: Steam Reforming of Natural Gas, Ethanol and Bioethanol; Zentralbibliothek: Jülich, Germany, 2010; Volume 78. [Google Scholar]
- Carmo, M.; Fritz, D.L.; Mergel, J.; Stolten, D. A comprehensive review on PEM water electrolysis. Int. J. Hydrogen Energy 2013, 38, 4901–4934. [Google Scholar] [CrossRef]
- Götz, M.; Lefebvre, J.; Mörs, F.; McDaniel Koch, A.; Graf, F.; Bajohr, S.; Reimert, R.; Kolb, T. Renewable Power-to-Gas: A technological and economic review. Renew. Energy 2016, 85, 1371–1390. [Google Scholar] [CrossRef]
- Lampert, D.J.; Cai, H.; Elgowainy, A. Wells to wheels: Water consumption for transportation fuels in the United States. Energy Environ. Sci. 2016, 9, 787–802. [Google Scholar] [CrossRef]
- Guo, X.M.; Trably, E.; Latrille, E.; Carrre, H.; Steyer, J.P. Hydrogen production from agricultural waste by dark fermentation: A review. Int. J. Hydrogen Energy 2010, 35, 10660–10673. [Google Scholar] [CrossRef]
- Jaseena, K.A.; Sosamony, K.J. Practical Aspects of Hydrogen Production by Dark Fermentation—A Review. IRACST Eng. Sci. Technol. Int. J. 2016, 6, 2250–3498. [Google Scholar]
- Cardoso, V.; Romão, B.B.; Silva, F.T.M.; Santos, J.G.; Batista, F.R.X.; Ferreira, J.S. Hydrogen Production by Dark Fermentation. Chem. Eng. Trans. 2014, 38, 481–486. [Google Scholar] [CrossRef]
- Goedkoop, M.; Heijungs, R.; De Schryver, A.; Struijs, J.; van Zelm, R. ReCiPe 2008. A Life Cycle Impact Assessment Method Which Comprises Harmonised Category Indicators at the Midpoint and the Endpoint Level. Report I: Characterisation. 2013. Available online: http://www.rivm.nl/en/Topics/L/Life_Cycle_Assessment_LCA/Downloads (accessed on 20 September 2017).
- Huijbregts, M.A.J.; Steinmann, Z.J.; Elshout, P.M.F.; Stam, G.; Verones, F.; Vieira, M.D.M.; Zijp, M.; van Zelm, R. ReCiPe 2016: A Harmonized Life Cycle Impact Assessment Method at Midpoint and Enpoint Level—Report 1: Characterization; National Institute for Public Health and the Environment: Bilthoven, The Netherlands, 2016.
- Boulay, A.-M.M.; Lathuillière, M.J. Water Use in LCA-Methodology. In Encyclopedia of Sustainable Technologies; Abraham, M., Ed.; Elsevier: Amsterdam, The Netherlands, 2017; pp. 293–301. [Google Scholar]
- International Organization for Standardization (ISO). Environmental Management—Water Footprint—Principles, Requirements and Guidelines; ISO: Geneva, Switzerland, 2014. [Google Scholar]
- Simons, A.; Bauer, C. Life Cycle Assessment of Hydrogen Production. In Transition to Hydrogen: Pathways toward Clean Transportation; Wokaun, A., Wilhelm, E., Eds.; Cambridge University Press: Cambridge, UK, 2011; pp. 13–57. [Google Scholar]
- Fischer, M.; Fltenbacher, M.; Schuller, O. Life Cycle Impact Assessment; Ecological City Transport System-ECTOS Report 16; Institut für Kunststoffprüfung und Kunststoffkunde: Stuttgart, Germany, 2005. [Google Scholar]
- Verma, A.; Kumar, A. Life cycle assessment of hydrogen production from underground coal gasification. Appl. Energy 2015, 147, 556–568. [Google Scholar] [CrossRef]
- Susmozas, A.; Iribarren, D.; Dufour, J. Life-cycle performance of indirect biomass gasification as a green alternative to steam methane reforming for hydrogen production. Int. J. Hydrogen Energy 2013, 38, 9961–9972. [Google Scholar] [CrossRef]
- Muresan, M.; Cormos, C.C.; Agachi, P.S. Comparative life cycle analysis for gasification-based hydrogen production systems. J. Renew. Sustain. Energy 2014, 6, 013131. [Google Scholar] [CrossRef]
- Sara, H.R.; Enrico, B.; Mauro, V.; Andrea, D.C.; Vincenzo, N. Techno-economic Analysis of Hydrogen Production Using Biomass Gasification—A Small Scale Power Plant Study. Energy Procedia 2016, 101, 806–813. [Google Scholar] [CrossRef]
- Pi, A.E.; Dai, Q.; Han, J.; Wang, M. Life Cycle Analysis of Emerging Hydrogen Production Technologies; Argonne National Laboratory: Lemont, IL, USA, 2016; pp. 1–5.
- Spang, E.S.; Moomaw, W.R.; Gallagher, K.S.; Kirshen, P.H.; Marks, D.H. The water consumption of energy production: An international comparison. Environ. Res. Lett. 2014, 9. [Google Scholar] [CrossRef]
- Curran, M.A. Overview of Goal and Scope Definition in Life Cycle Assessment. In Goal and Scope Definition in Life Cycle Assessment; Springer: Dordrecht, The Netherlands, 2017; pp. 1–62. ISBN 940240855X. [Google Scholar]
- Elgowainy, A.; Han, J.; Lee, U.; Li, J.; Dunn, J.; Wang, M. IX. 2 Life-Cycle Analysis of Water Consumption for Hydrogen Production Contribution to Achievement of DOE; Argonne National Laboratory: Lemont, IL, USA, 2016; pp. 1–4.


| Type | Thermo-Chemical | Electrolysis | Biological | ||||||
|---|---|---|---|---|---|---|---|---|---|
| Conversion pathway | Steam methane reforming | Coal Gasification | Biomass Gasification | Biomass Reformation | Proton exchange membrane (PEM) | Solid oxide electrolysis cells (SOEC) | Dark fermentation + microbial electrolysis cell (MEC), w/out ER | Dark fermentation + microbial electrolysis cell (MEC), w/ER | Dark fermentation + microbial electrolysis cell (MEC), w/H2 recovery |
| Abbreviation | SMR | CG | BMG | BDL-E | E-PEM | E-SOEC | DF-MEC w/out ER | DF-MEC w/ER | DF-MEC w/H2 recovery |
| Feedstock | Natural gas | Coal | Corn Stover | Ethanol | Electricity | Electricity | Corn Stover | Corn Stover | Corn Stover |
| Natural gas (MJ/kg H2) | 165 | - | 6.228 | - | - | 50.76 | 22.9 | - | - |
| Coal (kg/kg H2) | - | 7.8 | - | - | - | - | - | - | - |
| Biomass (kg/kg H2) | - | - | 13.5 | 6.54 | - | - | 23.0 | 23.0 | 23.0 |
| Electricity (kWh/kg H2) | 1.11 | 1.72 | 0.98 | 0.49 | 54.6 | 36.14 | 21.6 | 6.03 | 21.6 |
| Water (kg/kg H2) 1 | 21.869 | 2.91 | 305.5 | 30.96 | 18.04 | 9.1 | 104.225 | 104.225 | 104.225 |
| Ammonia (kg/kg H2) | - | - | - | - | - | - | 0.102 | 0.102 | 0.102 |
| Sodium hydroxide (kg/kg H2) | - | - | - | - | - | - | 0.389 | 0.389 | 0.389 |
| Sulfuric acid (kg/kg H2) | - | - | - | - | - | - | 0.207 | 0.207 | 0.207 |
| Glucose (kg/kg H2) | - | - | - | - | - | - | 0.335 | 0.335 | 0.335 |
| Corn liquor (kg/kg H2) | - | - | - | - | - | - | 0.008 | 0.008 | 0.008 |
| Diammonium phosphate (kg/kg H2) | - | - | - | - | - | - | 0.015 | 0.015 | 0.015 |
| Reference | [27] | [28] | [29] | [30] | [31,32] | [25,33] | [25] | ||
| Impact Category 2 | Unit | H2 Production Pathways 1 | |||||||||||
|---|---|---|---|---|---|---|---|---|---|---|---|---|---|
| SMR | CG | BMG | BDL-E-Corn | BDL-E-Wheat | E-PEM | E-PEM-R | E-SOEC | E-SOEC-R | DF-MEC w/out ER | DF-MEC w/ER | DF-MEC w/H2 Recovery | ||
| GWP | kg CO2-eq | 12.13 | 24.2 | 2.67 | 9.193 | 14.02 | 29.54 | 2.21 | 23.32 | 5.10 | 16.29 | 6.60 | 14.57 |
| ODP | kg CFC-11-eq | 2.99 × 10⁻⁶ | 3.35 × 10⁻⁶ | 2.18 × 10⁻⁵ | 1.70 × 10⁻⁴ | 1.23 × 10⁻⁴ | 1.22 × 10⁻⁵ | 1.40 × 10⁻⁶ | 9.36 × 10⁻⁶ | 2.16 × 10⁻⁶ | 4.16 × 10⁻⁵ | 3.79 × 10⁻⁵ | 4.11 × 10⁻⁵ |
| IRP | kBq Co-60-eq | 0.501 | 1.188 | 0.406 | 0.835 | 0.87 | 19.33 | 0.52 | 12.8505 | 0.3142 | 7.53 | 2.11 | 7.50 |
| EOFP | kg NOx-eq | 0.0085 | 0.055 | 0.00375 | 0.037 | 0.0424 | 0.0487 | 0.0039 | 0.0349 | 0.0050 | 0.0247 | 0.01055 | 0.024 |
| PMFP | kg PM2.5-eq | 0.002 | 0.039 | 0.00284 | 0.007 | 0.021 | 0.0337 | 0.0041 | 0.0222 | 0.0025 | 0.0172 | 0.008266 | 0.016989 |
| HOFP | kg NOx-eq | 0.0089 | 0.055 | 0.00382 | 0.037 | 0.043 | 0.0492 | 0.0041 | 0.0353 | 0.0052 | 0.025 | 0.010696 | 0.023983 |
| TAP | kg SO2-eq | 0.0087 | 0.139 | 0.03706 | 0.124 | 0.112 | 0.1087 | 0.0118 | 0.0724 | 0.0078 | 0.104 | 0.074636 | 0.103 |
| FEP | kg P-eq | 0.0007 | 0.008 | 0.00081 | 0.003 | 0.00568 | 0.0242 | 0.0014 | 0.0162 | 0.0009 | 0.0098 | 0.00312 | 0.009749 |
| TETP | kg 1,4-DCB-eq | 0.0005 | 0.003 | 0.0003 | 0.007 | 0.142 | 0.012 | 0.0048 | 0.0078 | 0.0030 | 0.0041 | 0.001442 | 0.003977 |
| FETP | kg 1,4-DCB-eq | 0.0208 | 0.268 | 0.01875 | 0.162 | 0.646 | 0.7519 | 0.15 | 0.4974 | 0.097 | 0.268 | 0.080308 | 0.27 |
| METP | kg 1,4-DCB-eq | 0.0423 | 0.377 | 0.02706 | 0.227 | 0.483 | 1.07 | 0.22 | 0.7111 | 0.145 | 0.384 | 0.12 | 0.38 |
| HTPc | kg 1,4-DCB-eq | 0.0803 | 0.64 | 0.0433 | 0.128 | 0.357 | 1.58 | 0.43 | 1.1213 | 0.356 | 0.565 | 0.16 | 0.55 |
| HTPnc | kg 1,4-DCB-eq | 21.36 | 277.6 | 19.69 | 284.129 | 268.94 | 764.98 | 157.25 | 507.42 | 102.26 | 272.6 | 82.10 | 269.3 |
| LOP | m2a crop-eq | 0.008272 | 0.235 | 0.02062 | 23.518 | 20.2 | 0.22 | 0.05 | 0.1525 | 0.04 | 0.104 | 0.043 | 0.102467 |
| SOP | kg Cu-eq | 0.00389 | 0.004 | 0.00186 | 0.028 | 0.04 | 0.12 | 0.16 | 0.0632 | 0.09 | 0.0153 | 0.006 | 0.014159 |
| FFP | kg oil-eq | 4.45 | 4.914 | 0.655 | 1.524 | 3.042 | 7.81 | 0.62 | 6.5058 | 1.72 | 4.38 | 1.68 | 3.78 |
| WCP | m3 consumed | 5.77 | 13.1 | 4.94 | 2.246 | 3.875 | 223.39 | 16.40 | 146.82 | 8.82 | 84.9 | 23.98 | 84.50 |
| WSF | m3 | 247.5 | 570.2 | 212.4 | 94.61 | 149.4 | 9604.3 | 629.8 | 6312.3 | 379.3 | 3650.2 | 1030.8 | 3632.9 |
| Production Pathways | Human Health (DALY/kg H2) | Ecosystems (Species × year/kg H2) | Resources (USD2013/kg H2) |
|---|---|---|---|
| Steam methane reforming (SMR) | 2.57 × 10⁻⁵ | 1.15 × 10⁻⁷ | 1.560 |
| Coal gasification (CG) | 8.06 × 10⁻⁵ | 2.91 × 10⁻⁷ | 0.495 |
| Biomass Gasification (BMG) | 1.55 × 10⁻⁵ | 8.32 × 10⁻⁸ | 0.160 |
| Biomass Reformation (BDL)-corn | 3.81 × 10⁻⁵ | 3.12 × 10⁻⁷ | 0.899 |
| Biomass Reformation (BDL)-wheat | 2.06 × 10⁻⁵ | 2.98 × 10⁻⁷ | 0.587 |
| Electrolysis with Proton exchange membrane (PEM)-Grid | 5.55 × 10⁻⁴ | 3.15 × 10⁻⁶ | 1.514 |
| Electrolysis with Proton exchange membrane (PEM)-Wind | 4.35 × 10⁻⁵ | 2.32 × 10⁻⁷ | 0.219 |
| Electrolysis with Solid oxide electrolysis cells (SOEC)-Grid | 3.69 × 10⁻⁴ | 2.08 × 10⁻⁶ | 1.465 |
| Electrolysis with Solid oxide electrolysis cells (SOEC)-Wind | 2.78 × 10⁻⁵ | 1.37 × 10⁻⁷ | 0.602 |
| Dark fermentation + microbial electrolysis cell (MEC) w/out energy recovery | 2.18 × 10⁻⁴ | 1.22 × 10⁻⁶ | 0.971 |
| Dark fermentation + microbial electrolysis cell (MEC) w/energy recovery | 6.57 × 10⁻⁵ | 3.62 × 10⁻⁷ | 0.371 |
| Dark fermentation + microbial electrolysis cell (MEC) w/H2 recovery | 2.16 × 10⁻⁴ | 1.21 × 10⁻⁶ | 0.757 |
© 2018 by the authors. Licensee MDPI, Basel, Switzerland. This article is an open access article distributed under the terms and conditions of the Creative Commons Attribution (CC BY) license (http://creativecommons.org/licenses/by/4.0/).
Share and Cite
Mehmeti, A.; Angelis-Dimakis, A.; Arampatzis, G.; McPhail, S.J.; Ulgiati, S. Life Cycle Assessment and Water Footprint of Hydrogen Production Methods: From Conventional to Emerging Technologies. Environments 2018, 5, 24. https://doi.org/10.3390/environments5020024
Mehmeti A, Angelis-Dimakis A, Arampatzis G, McPhail SJ, Ulgiati S. Life Cycle Assessment and Water Footprint of Hydrogen Production Methods: From Conventional to Emerging Technologies. Environments. 2018; 5(2):24. https://doi.org/10.3390/environments5020024
Chicago/Turabian StyleMehmeti, Andi, Athanasios Angelis-Dimakis, George Arampatzis, Stephen J. McPhail, and Sergio Ulgiati. 2018. "Life Cycle Assessment and Water Footprint of Hydrogen Production Methods: From Conventional to Emerging Technologies" Environments 5, no. 2: 24. https://doi.org/10.3390/environments5020024
APA StyleMehmeti, A., Angelis-Dimakis, A., Arampatzis, G., McPhail, S. J., & Ulgiati, S. (2018). Life Cycle Assessment and Water Footprint of Hydrogen Production Methods: From Conventional to Emerging Technologies. Environments, 5(2), 24. https://doi.org/10.3390/environments5020024