Article

Preferences for Urban Green Space Characteristics: A Comparative Study in Three Portuguese Cities

by
Helena Madureira
1,*,
Fernando Nunes
2,
José Vidal Oliveira
3 and
Teresa Madureira
4
1
Departamento de Geografia, Universidade do Porto/CEGOT, Via Panorâmica s/n, 4150-564 Porto, Portugal
2
Escola Superior Agrária-Instituto Politécnico de Viana do Castelo, Convento de Refóios, Refóios do Lima, 4990-706 Ponte de Lima, Portugal
3
Escola Superior de Comunicação Social, Instituto Politécnico de Lisboa, Campus de Benfica, 1549-014 Lisboa, Portugal
4
Escola Superior Agrária-Instituto Politécnico de Viana do Castelo, Convento de Refóios, Refóios do Lima, 4990-706 Ponte de Lima, Portugal
*
Author to whom correspondence should be addressed.
Environments 2018, 5(2), 23; https://doi.org/10.3390/environments5020023
Submission received: 28 December 2017 / Revised: 26 January 2018 / Accepted: 29 January 2018 / Published: 1 February 2018

Abstract

:
Many studies have argued that a better understanding of people’s preferences about public urban green spaces may inform urban planners to effectively provide and manage urban green spaces to meet users’ needs. The aim of this study is to examine urban residents preferred public green space characteristics and investigate whether similarities and differences can be highlighted in three different Portuguese cities. Through a web-based questionnaire based on the best-worst scaling (BWS) method, residents of Lisbon, Porto and Évora (n = 750) were asked to select the most and least important public green space characteristic among thirteen attributes. The results suggest a consensus about some green space characteristics across cities but also the existence of some local variations in city residents’ preferences. Overall, this study can support public authorities and urban planners as they strive to effectively design and manage urban green spaces to meet users’ needs.

1. Introduction

Urban green spaces are increasingly acclaimed as central elements in the promotion of environmental sustainability and quality of life in cities, following a long history of gradual recognition of its various hygienist, social, cultural, aesthetic, functional, economic or ecological functions. Green spaces provide environmental benefits, such as the mitigation of heat island effects, the reduction of pollutants in the air, promotion of biodiversity and noise reduction. They are also important in cities due to social benefits, by providing ample recreational opportunities, by supporting social interaction and integration and by contributing to the improvement of mental and physical health [1,2,3,4].
Public urban green spaces, such as urban parks, are traditionally the most valuable elements of urban green infrastructures [5]. They are primarily managed by government agencies and accomplished for public use, and so they are central elements in the promotion of quality of life in cities, namely owing to their contribution to the liveability of the dwelling environment, to the experience of nature [6] and to the increasing demand for nature-based recreation facilities [7].
Public urban green spaces comprise different types of green spaces, namely in degrees of naturalness, types of vegetation, recreational infrastructures or social uses they can offer [8]. Because public urban green spaces have different characteristics and social uses within cities, it is furthermore important to assess people’s preferences about public urban green spaces. In fact, a better understanding of the preferences of a given city’s residents for their public green spaces may inform policy makers and city planners to effectively provide and manage urban green spaces to meet users’ needs [9,10,11].
In recent years, there have been many studies focusing on population preferences in relation to various dimensions of urban green spaces. These studies, which are very diverse in scope, objectives and methodologies, may be systematized into three main groups.
In the first group, we may include the research studies involving the assessment of the motivations for visiting urban green spaces, in particular, public gardens and parks. The results obtained in different cities have shown that the visitation of public gardens and parks is anchored in a very wide range of reasons or motivations. For example, in a study conducted in Amsterdam, ‘to relax’ was found to be the most important motivation, followed by ‘to be in nature’, and ‘to escape from the city’ [12]. In Guangzhou, ‘to enjoy fresh air and beautiful scenery’ and ‘to relax’ were identified as the main motivations [13]. Lo & Jim [14] found that urban green space visits in Hong Kong were mainly motivated by the possibility of practising physical exercise and contact with fresh air. The considerable variability in the results from the diverse studies suggests the need for more research to achieve a more comprehensive understanding of the motivation patterns [13].
In the second group, we may embrace studies that have investigated how residents evaluate the benefits associated with urban green spaces. While using different methodologies, this set of studies provides information on how the values associated with green spaces are evaluated in worldwide urban contexts. For example, studies conducted in Bari [15], Helsinki [16], Hong Kong [17], Guangzhou [18] and in cities in the United States [19], New Zealand [20] or Portugal and France [21] used questionnaire surveys to assess the benefits related to urban green spaces. A comparative review of these studies’ results reveals some inconsistencies between the rated benefits, also suggesting the need for further research into values associated with urban green spaces.
A third group aggregates studies that have explored the preferred features and characteristics of urban parks. It includes the research studies focused on the general identification of the population preferences for certain attributes of green spaces and those focused specifically on the identification of the attributes more significantly related to use frequency. These studies have identified a wide range of people’s preferences on urban park attributes, such as cleanliness, tranquility, naturalness, or the presence of adequate facilities [22,23,24,25,26]. For instance, in a recent publication, Bertram & Rehdanz [23] summarized visitors’ perception of park characteristics in four main groups: naturalness, relating to all characteristics associated with the biodiversity of the urban parks; neatness, including the characteristics that make a park convenient and safe for visits; sociability, relating to the characteristics that are important to meet other people; and spaciousness, which refers to structural characteristics, namely the park size. Lindholst et al. [9] also recently suggested a schema to address the question ‘What makes for a good urban green space?’ in the Nordic context, which derives from three main factors: ‘structure and general aspects’, ‘functionality and experience’, and ‘management and organization’.
These research studies have been conducted for varying purposes, but they all seek to identify people’s preferences on certain aspects related to urban green spaces. In addition, a common achievement is the variability in the results among the diverse studies. A possible explanation for the observed disparities may reside in the great diversity of methodologies employed in these research studies, which may include, for instance, ‘in situ observations’, ‘focus groups’, interviews or surveys by questionnaires [2]. Furthermore, these discrepancies may suggest the influence of the different social and territorial contexts where the studies were conducted [27,28]. In fact, cities are becoming more diverse in a globalizing world, and therefore, culture-specific motivations may be useful for local decision making [2], so more research remains to be done to achieve a better comprehensive understanding of people’s preferences about public urban green spaces that can influence local decision making.
The present research explores urban residents preferred public urban green space characteristics and investigates whether similarities and differences can be highlighted in three different Portuguese cities. Two research questions guided the study: (1) How do urban residents rate the different public green space characteristics? (2) Are public green space characteristics equally rated among the three cities, or are they differently rated according to the city dimension? We used the Best-Worst Scaling (BWS) method to compare the samples from three Portuguese urban areas with different dimensions: Lisbon, Porto and Évora (Table 1). Lisbon is the capital and the largest city in Portugal, with a population of 552,700 within its administrative limits of approximately 2.8 million people in its metropolitan area. Porto is the second largest city in Portugal, with a population of 237,591 within its administrative limits of approximately 1.8 million people in its metropolitan area. Évora is the smallest selected city with a population of 41,898 inhabitants [29]. Moreover, these three cities were chosen as case studies because, in addition to having different degrees of urban development, they have different characteristics in the structure of their green spaces. In the European context, both Lisbon and Porto show below-average green space availability values [30]. But according to European Environment Agency, the share of green urban areas inside the core cities is higher in Lisbon (24.1%) than in Porto (17.9%) [31]. On the other hand, Évora is a small-sized and compact city with an easy access to the surrounding countryside.

2. Materials and Methods

2.1. Questionnaire Design

For the purposes of this study, a three-part questionnaire was developed. The first part of the survey was prefaced by an explanation of the purpose of the study and included questions about socio-demographics (age, gender, education and place of residence). The second part focused on respondents’ perceptions and aspirations for their city’s public green spaces. It included questions about overall satisfaction with the city’s public green spaces, the frequency of visiting public parks and their desires regarding future investments in public green spaces. The third and main part of the survey measured the importance the respondents attributed to public green space characteristics. The BWS method, described below, was used for this purpose. Thirteen public urban green space attributes were selected based on an analysis of the literature in which the importance of park characteristics has been assessed.

2.2. Best-Worst Scaling Methodology

Best-worst scaling (BWS) is a survey-based technique that allows survey respondents to choose the ‘best’ and ‘worst’ attributes across a number of repeated choice sets. Rather than asking respondents to rate items one at a time, respondents are shown a predefined number of candidate items and are asked to choose the two items within each set that they consider to be the ‘best’ and ‘worst’ [32]. The frequency with which an attribute is selected best (or worst) indicates the strength of the preference for that attribute [33].
Two main groups of advantages have been identified in adopting a BWS methodology: first, it involves a fairly simple task for respondents, and it is less cognitively demanding to select only a best and worst option from a set than ranking all items simultaneously [33,34,35]; second, it provides rich information to the researcher by allowing for sufficient information to calculate even individual-level scales and by providing precise and comparable scales [33,34,36,37].
BWS was introduced by Finn & Louviere [32], who used it to measure public concern about food safety, and it has since been used in various contexts, including consumer behaviour, health policies and environmental and planning studies [21,33,34,36,38,39,40,41,42,43].
In this study, the thirteen attributes were combined into thirteen choice sets of three items each, and respondents were asked to select the best and worst attribute in each set, i.e., the most and least important public green space characteristic. The question sets were balanced in factor frequency, positional frequency and orthogonality and therefore satisfy optimal design characteristics. This means that each attribute appears the same number of times across all choice sets and that each pair of attributes appears only once within each set [44].

2.3. Survey Administration and Sample

The survey was pre-tested with a subset of volunteers. Their suggestions allowed us to revise the instructions for completing the BWS sets so as to be easier to interpret and also to identify the time needed to complete the survey. Three independent online surveys, one for each city in the study, were constructed. The survey links were distributed first through mail and then social media and websites. Our invitation to participate in the survey also asked participants to share it through mail or social media to family members, friends or colleagues aged 15 years or older and living in the selected city. Data were collected between February and October 2015.
Only respondents who completed all the survey sections in full were included in this study. We took advantage of online survey programming options to eliminate missing or ambiguous data, by not allowing missing responses and, in the case of the best-worst choice sets, by not permitting an item to be chosen simultaneously as best and worst.
A total of 750 respondents took part in this study, 250 for each city. The profile of the respondents in each city in the study is denoted by three socioeconomic variables (Table 2). In all three samples, female respondents from the 35–54 age group and holding a university or higher degree were overrepresented compared with census data. Given the disadvantages associated with non-probabilistic online surveys in relation to sample representativeness, emphasis was placed on keeping a balanced distribution by applying a weighting factor to adjust the sample to age, gender and educational level population characteristics. Table 2 shows the weighted sample according to census data. All of the subsequent results reflect the applied weighting factors.

2.4. Data Analysis

The data analysis was organized into two main sections. The first focused on global perceptions of the city’s public green spaces, where categorical variables were expressed as frequencies and percentages. The second section focused on the preferred characteristics of public green spaces. We began by computing Best-Worst Raw Scores for each respondent (individual B-W) for each green space characteristic. The number of times each item is chosen as most important (best) and least important (worst) is summed up across all choices and the worst are subtracted from the best, resulting in Best-Worst Raw Scores. Because Best-Worst Raw Scores are often perceived as difficult to understand, they are often rescaled to allow for an easier and more intuitive interpretation [45]. Thus, the Best-Worst Raw Scores were rescaled or transformed into Rescaled Scores (0–100) so that the scale presents ratio-scaled probability properties with the sum of all items being 100. This assumes that an item is chosen a particular percentage of times when presented with other items [44].
To test differences in attributes’ ratings between the different cities, an analysis of Kruskal-Wallis test for the mean of the rescaled scores among the three cities was performed.

3. Results and Discussion

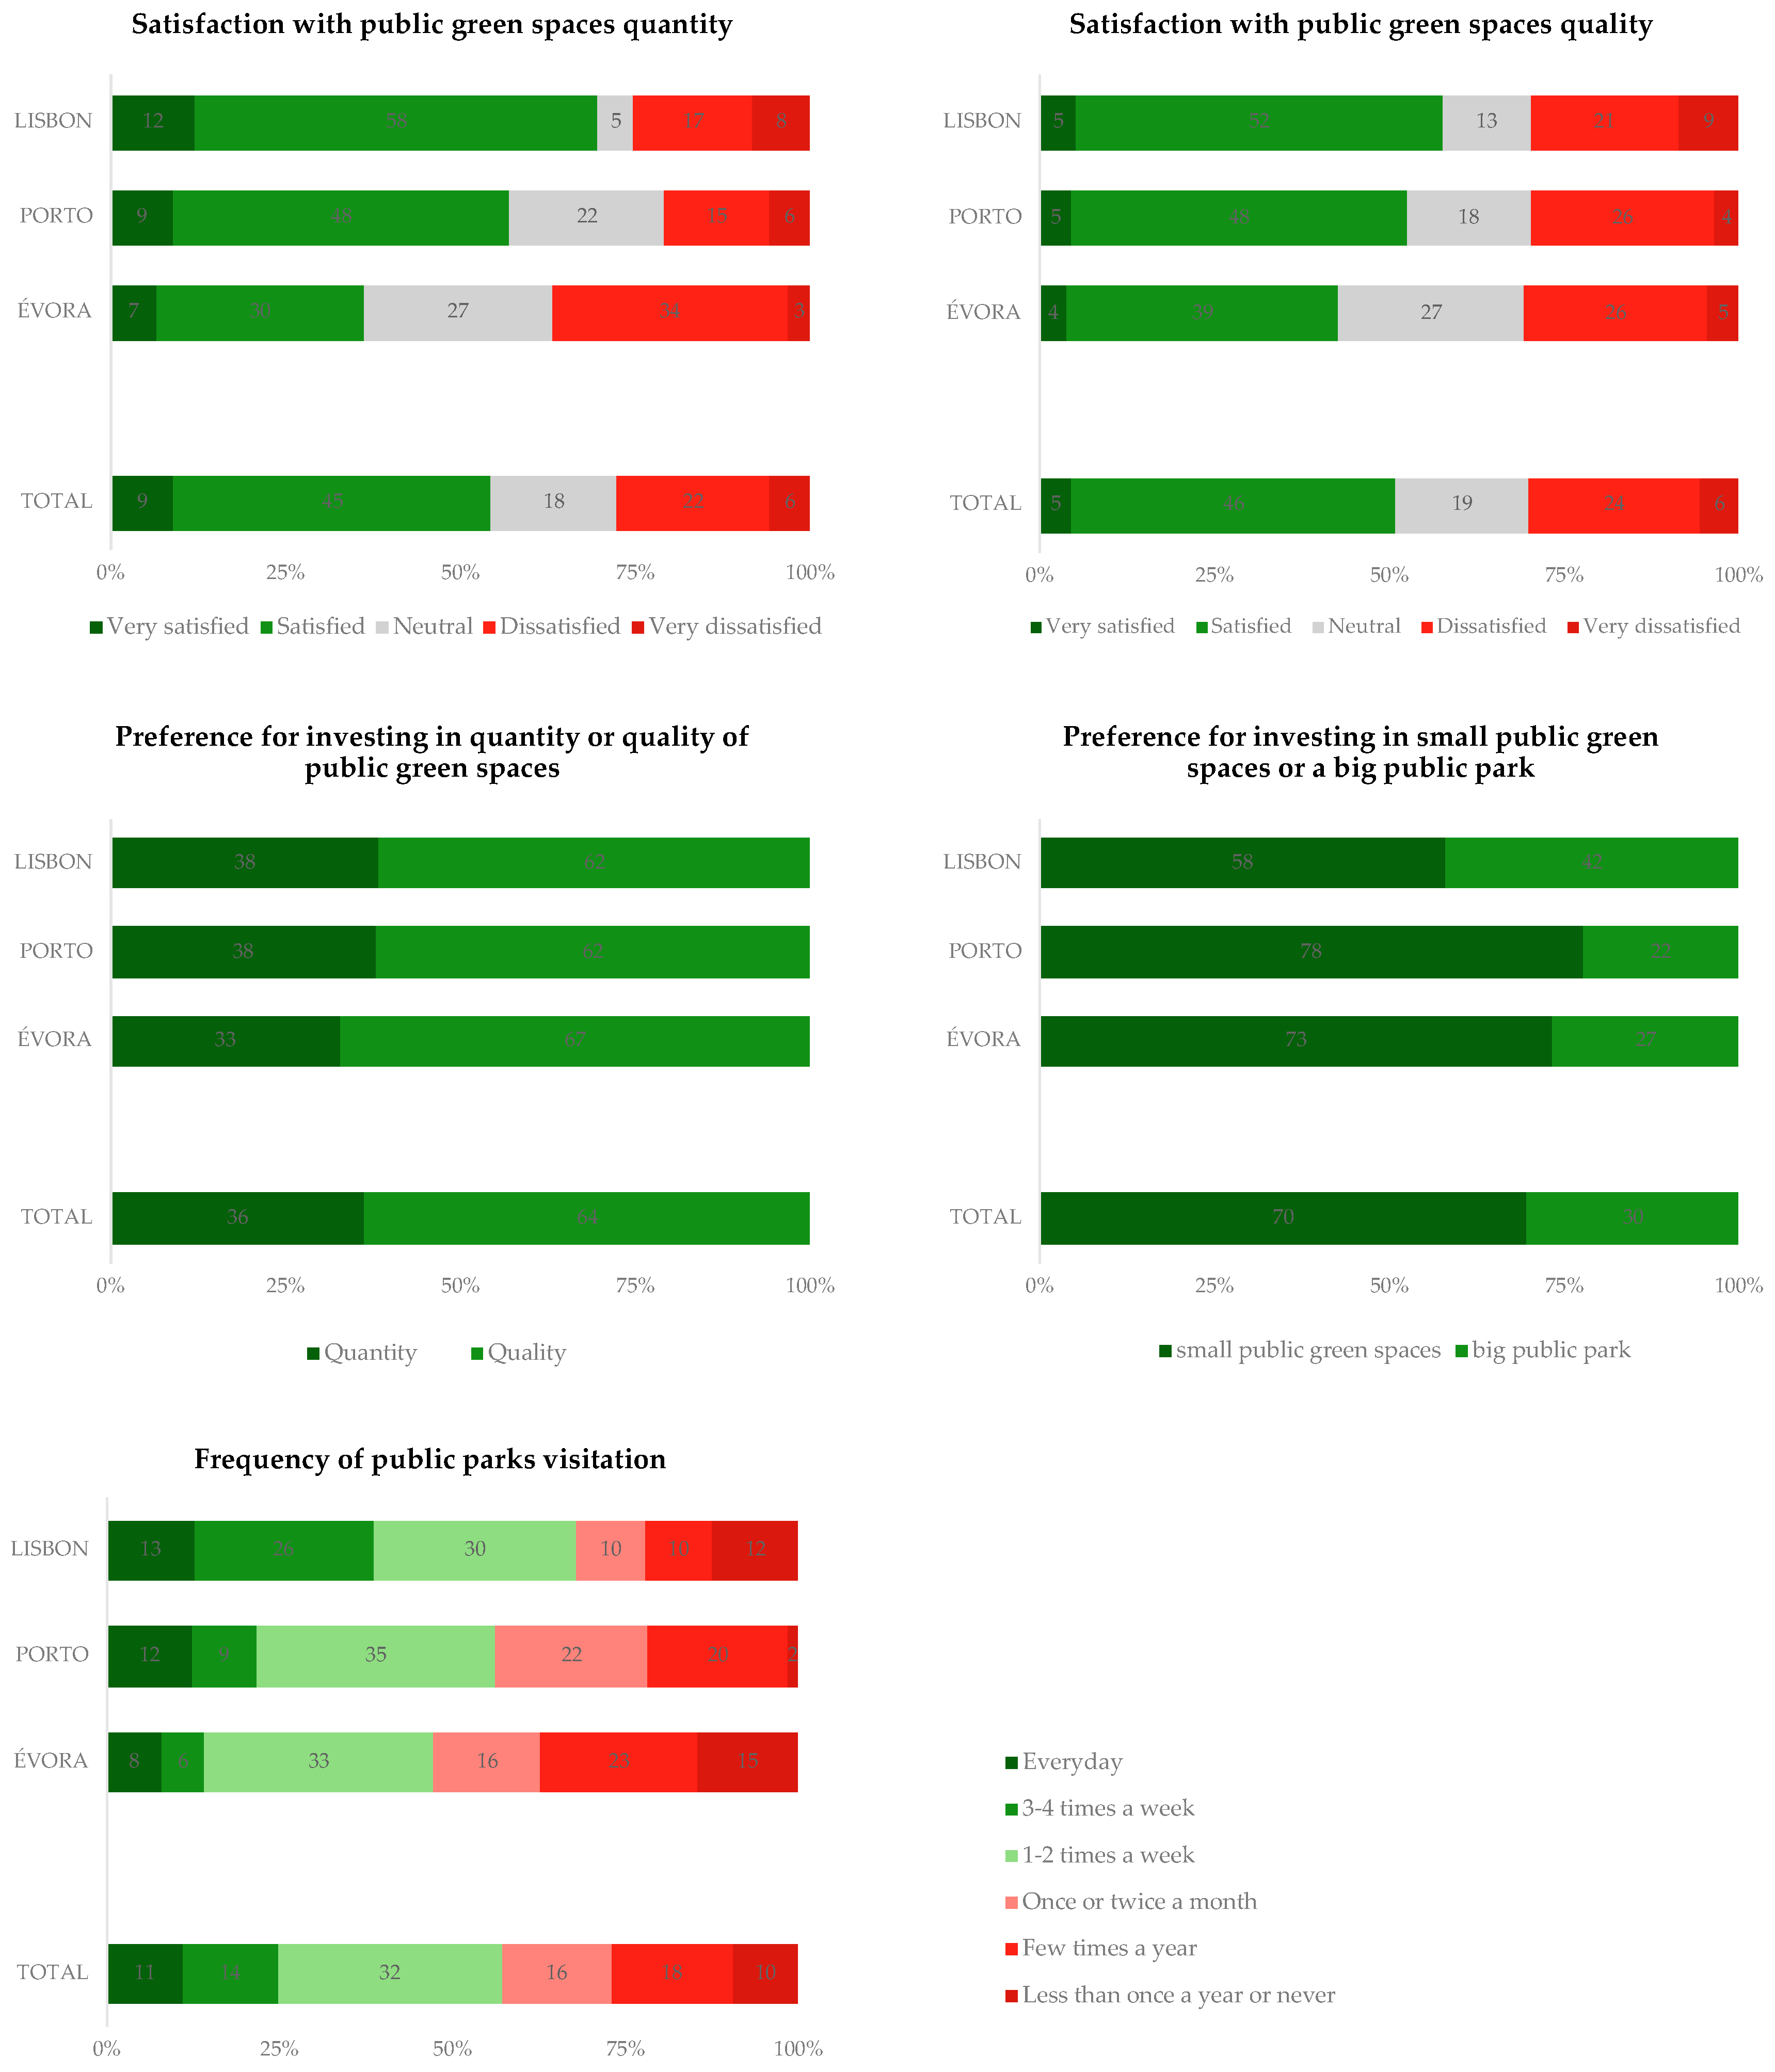
3.1. Global Perceptions and Desires for Public Urban Green Spaces

Satisfaction with public green spaces was assessed by two questions: the first one focused on public green space quantity, and the second one focused on public green space quality (Figure 1). For both cases, respondents selected answers from a five-point scale from ‘very satisfied’ to ‘very dissatisfied’.
Three main results may be drawn from these two questions. First, respondents are moderately satisfied with public green spaces. In fact, approximately half of the respondents are satisfied or very satisfied with both the quantity (54%) and quality (51%) of the public green spaces. These results deserve to be framed in the study conducted by the European Union [46], where EU residents living in cities rated their satisfaction with green areas on a scale from 0 (‘not satisfied at all’) to 10 (‘fully satisfied’). Although urban populations living in Portugal revealed a moderate satisfaction with their green areas (6.0), it must be noted that Portuguese respondents were among the five countries with the lowest rated satisfaction. Second, the general results achieved by these two questions are very similar, with the only evident difference being a slightly worse evaluation of the public green space quality. Third, the results show important differences between cities. The city dimension seems to influence the evaluation of both the quantity and quality of public green spaces, since the evaluation tends to be more positive with the increase in the city’s size. In fact, respondents from Lisbon are the most satisfied with both the quantity (70%) and quality (57%). Respondents from Porto are also rather satisfied, even more moderately, with the quantity of public green spaces (57%) and with its quality (53%). Respondents from Évora are the least satisfied with their city’s public green spaces, and particularly with their quantity, with a clear division between respondents who reveal being rather satisfied (37%) and those who are rather dissatisfied (37%).
The city dimension also seems to influence the frequency of visiting urban parks. In fact, respondents from Lisbon frequent public parks more often, with 69% of respondents reporting going to a public park at least once a week. The majority of respondents from Porto (56%) also report visiting urban parks at least once a week. Respondents from Évora show the lowest frequency of park visits, with only 47% of them reporting going to a park at least once a week.
The desire for future investments in public green spaces was assessed by two dichotomous questions. The first one focused on preferences for investing in the quantity or quality of their city’s public green spaces. In all three cities, respondents show a preference for investing in the quality of public green spaces (range by city, 62–67%), which seems to echo the criticisms that have been expressed in recent years against an emphasis on the provision of green space quantities and a reorientation of urban planning priorities towards urban green space quality [47,48,49,50]. The second question focused on preferences for investments in small public green spaces or in a large public park. More than two-thirds of the respondents show a preference for small public green spaces (70%, range by city, 58–78%). Similar preferences were found in studies conducted in the UK [51] and also in the Netherlands, suggesting that most people understand that a large urban park cannot satisfy all the needs of a varied and complex community [6].

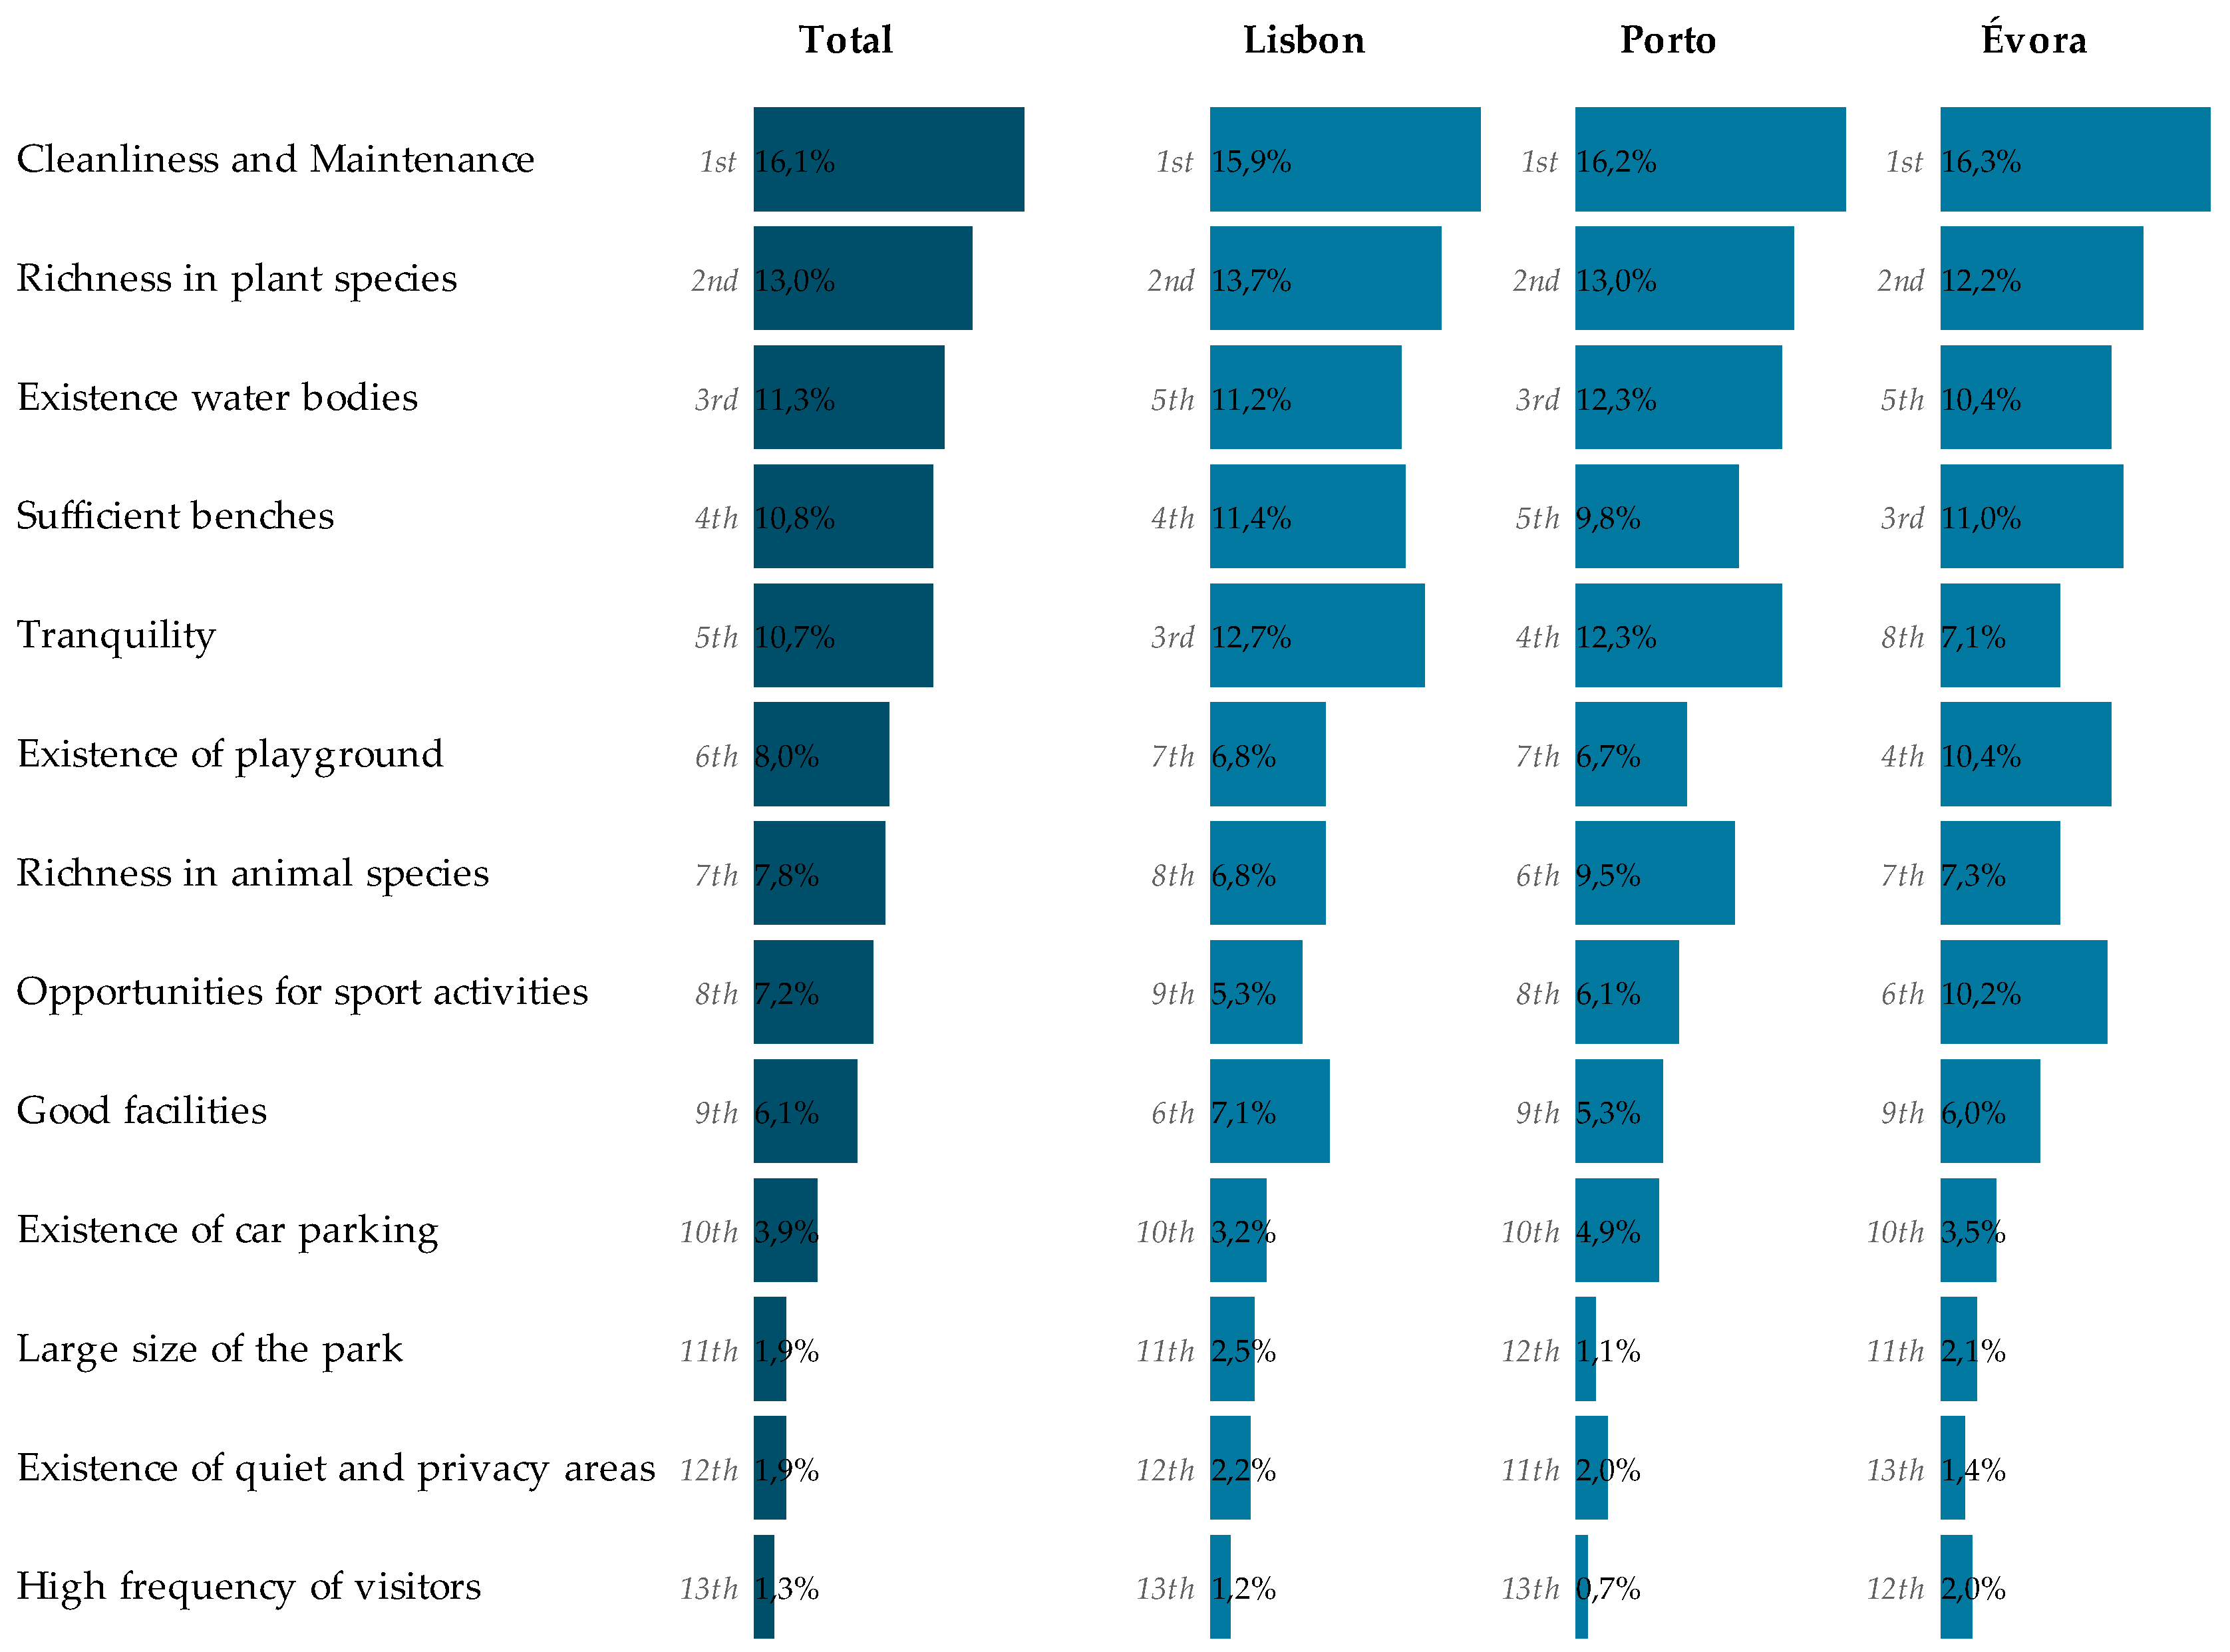
3.2. The Most and Least Preferred Public Green Space Characteristics

The best-worst scores relating to the thirteen green space characteristics evaluated by respondents from Lisbon, Porto and Évora are listed in Table 3. For convenience, the scores have been sorted and rescaled and are graphically displayed in Figure 2. The rescaled scores can be interpreted in the following manner: globally, the attribute ‘cleanliness and maintenance’ was chosen as the most important, on average, and when compared with the other attributes, 16% of the time; it is approximately twice as important as the attribute ‘existence of playground’ (8%).
Taking into account the overall results, ‘cleanliness and maintenance’ is rated as the most important public green space characteristic (16.1%, range by city, 15.9–16.3%). The high priority given to this attribute matches several studies conducted worldwide. For instance, in a comparative study conducted in four European cities, (Berlin, Stockholm, Rotterdam and Salzburg), cleanliness was rated as the most important park characteristic for park visitors [23]. Similar results were found in Vienna (Austria) [8], in Guangzhou (China) [52] and Karachi (Pakistan) [53]. In a review paper on qualitative research about the influence of urban parks in park use and physical activity, McCormack et al. [54] also found that cleanliness and maintenance within parks were regularly identified as important factors.
Respondents from all three cities also attach great importance to plant species richness (13.0%, range by city, 12.2–13.7%). The stated preference for public green spaces with plant species richness contrasts with the moderate emphasis given to animal species richness (7.8%, range by city, 6.8–9.5%). These results seem to echo the complex relationships between people’s preferences and perceived biodiversity values [55,56], under an apparent ‘people–biodiversity paradox’ [57]. In fact, the results for this paper echo other similar studies in which vegetation diversity was found to be moderately to very important [17,23,26] but contrasts with other studies that have identified negative preferences related to habitats of high plant species richness [56,58,59]. However, a moderate emphasis is given to animal species richness (7.8%, range by city, 6.8–9.5%), but even so, deserving a greater importance than in other studies [23,52,53].
The presence of water in the environment (lakes, rivers and coasts) has been identified as playing an important role for people’s well-being, and some evidence is emerging that blue space is associated with landscape preferences [26,60,61]. Respondents from the three Portuguese cities also attach great importance to the existence of water bodies in public green spaces (11.3%, range by city, 12.4–12.3%), being the third most preferred attribute in this study.
Park amenities such as benches, playgrounds, sport facilities and other amenities such as coffee shops or restaurants are moderately appreciated by the respondents who took part in this study. The opportunity of green spaces offering conditions of tranquility is also a characteristic that is moderately valued by the respondents (10.7%, range by city, 7.1–12.7%). This result seems to be in agreement with the devaluation of spaces that are frequented by many people, precisely the attribute that is less valued in this study, but in apparent contradiction with the devaluation of the existence of quiet and private areas. In fact, this study seems to corroborate previous results that have noted some complexity in this domain, namely by the preference for spaces that offer conditions of tranquility but at the same time are moderately frequented by other people [23,62].
Other studies have suggested a preference for large parks, namely by its usually higher structural and functional diversity. However, the large size of the park was one of the attributes that was less valued by the respondents from all three Portuguese cities (1.9%, range by city, 1.1–2.5%), and thus, the importance of park size was not confirmed by the present study.

3.3. Similarities and Disparities in Public Green Space Characteristics Ranking among Cities

In the present research, we hypothesized that the evaluation of public green space characteristics could not be generically widespread and that specific contexts, namely, city size, could influence the way respondents rated the various public green space characteristics. The denoted similarities and differences in the rated characteristics of public green spaces between the three cities were supported by using the Kruskal-Wallis nonparametric test for variables measured in ordinal scale (Table 4).
One of the most interesting results of this study is that there are some green space characteristics that are equally ranked among the different cities. This is the case for the most preferred public green space characteristics that have already been discussed in the last section, in particular, the ‘cleanliness and maintenance’ and ‘richness in plant species’ attributes.
However, despite these interesting matching results, we must also underscore important variations in urban green space characteristics evaluation among the three cities in this study. In fact, for example, ‘cleanliness and maintenance’ is rated as the most important public green space characteristic in all three cities, but there are significant differences between the mean scores among Porto and the other two cities in the study.
In spite of the difficulty of establishing causal associations, these results may reinforce the hypothesis that city size is an important factor in explaining the valuation of some green space characteristics. In fact, respondents from more populated cities seem to appreciate more the offer of conditions of tranquility and also to devalue more green spaces that are frequented by many people (Table 3 and Table 4 and Figure 2). This high valuation in Lisbon and Porto of public green spaces offering conditions of tranquility is accompanied by a relative devaluation of public green spaces containing facilities for children or sport activities. In fact, ‘existence of playgrounds’ and ‘opportunities for sport activities’ are considered important green space characteristics in Évora but are only moderately rated in Porto and Lisbon.

5. Conclusions

This study contributes to a new understanding about urban residents’ preferences for public green spaces. By examining relevant public green space characteristics among three different cities by placing those characteristics on a ‘best-worst scale’, the present study extends the understanding of urban residents’ preferences regarding public green spaces. The results offer two main insights for researchers and practitioners interested in green space planning.
First, the results from this study reveal that some green space characteristics are valued in a similar way among the three studied urban areas. Based on these findings, it is suggested that urban policies aimed at increasing residents’ satisfaction with public green spaces in all three cities should, for instance, consider the following: focusing urban planning priorities more on green space quality than quantity; investing on small public green spaces rather than on a big park; investing in cleanliness and maintenance within public green spaces; and improving plant species richness.
Second, the results also reveal some local variations in beliefs about urban green space characteristics. The range of preference results observed in this study indicates that urban green spaces need to perform multiple roles depending on the local context. Because preferences about urban green spaces differ among cities, there is a need to avoid generic assumptions and to encourage local assessments. For instance, according to our findings, urban green space policies focused on park amenities such as playgrounds or sport facilities are expected to be more easily accepted by residents of Évora than those of Porto or Lisbon. Therefore, local assessments of residents’ preferences about urban green spaces should be encouraged. In fact, a ‘one size fits all’ approach to green space planning may never meet the general public’s desires [63,64].
The present study has some limitations that provide directions for future research. First, the present samples were attained through convenience sampling techniques, and they are not representative samples of the populations being studied. Although this limitation is somewhat mitigated in this study by a weighting adjustment for age, gender and educational level, replication is necessary in more representative samples to establish generalizability. Second, the selection of our thirteen public green space attributes could be extended, or possibly some different benefits could be used. Future research could adopt qualitative methods such as focus groups or interviews to gain more insight into urban residents’ views concerning public green space characteristics. Third, the results from this study suggest simultaneously a consensus about some green space characteristics and also the existence of local variations about other urban green space characteristics. Despite the insights into possible factors that could explain this observed variation, additional studies should be conducted in other cities and countries in order to provide evidence of people’s preferences about urban green spaces. Moreover, it has to be noted that the observed variations in green space evaluation may be conditional on the given availability and qualities of urban parks, which differ between cities. Future research should therefore focus on how to operationalize specific measures derived from the park characteristics listed above and the most efficient and accurate methodologies for collecting these data. Follow-up studies should then test the associations between green space characteristics evaluations and specific urban park characteristics. Finally, in spite of the robustness and efficacy of the Best-Worst method, the authors are aware of the need to strengthen statistical analysis in future works, namely through the use of methods to decrease data redundancy and variability such as Principal Components Analysis.
The results of this study can support public authorities and urban planners as they strive to effectively design and manage urban green spaces to meet users' needs. In fact, the development of a wider and tailored range of public green space that considers different residents’ preferences would increase people’s satisfaction and therefore may increase recognition of the unique contribution that urban green spaces can make for environmental sustainability and quality of life in cities.

Acknowledgments

This work was co-financed by the European Regional Development Fund (ERDF) through the COMPETE 2020-Operational Programme Competitiveness and Internationalization (POCI) and national funds by FCT under the POCI-01-0145-FEDER-006891 project (FCT Ref: UID/GEO 04084/2013).

Author Contributions

Helena Madureira and Fernando Nunes conceived and designed the experiments; Fernando Nunes and Teresa Madureira performed the experiments; José Vidal Oliveira and Teresa Madureira analyzed the data; Helena Madureira wrote the paper.

Conflicts of Interest

The authors declare no conflict of interest.

References

  1. James, P.; Tzoulas, K.; Adams, M.D.; Barber, A.; Box, J.; Breuste, J.; Elmqvist, T.; Frith, M.; Gordon, C.; Greening, K.L.; et al. Towards an integrated understanding of green space in the European built environment. Urban For. Urban Green. 2009, 8, 65–75. [Google Scholar] [CrossRef]
  2. Kabisch, N.; Qureshi, S.; Haase, D. Human-Environment interactions in urban green spaces—A systematic review of contemporary issues and prospects for future research. Environ. Impact Assess. Rev. 2015, 50, 25–34. [Google Scholar] [CrossRef]
  3. Tzoulas, K.; Korpela, K.; Venn, S.; Yli-Pelkonen, V.; Kaźmierczak, A.; Niemela, J.; James, P. Promoting ecosystem and human health in urban areas using Green Infrastructure: A literature review. Landsc. Urban Plan. 2007, 81, 167–178. [Google Scholar] [CrossRef]
  4. Van den Berg, M.; Wendel-Vos, W.; van Poppel, M.; Kemper, H.; van Mechelen, W.; Maas, J. Health benefits of green spaces in the living environment: A systematic review of epidemiological studies. Urban For. Urban Green. 2015, 14, 806–816. [Google Scholar] [CrossRef]
  5. Bolund, P.; Hunhammar, S. Ecosystem services in urban areas. Ecol. Econ. 1999, 29, 293–301. [Google Scholar] [CrossRef]
  6. Coolen, H.; Meesters, J. Private and public green spaces: Meaningful but different settings. J. Hous. Built Environ. 2011, 27, 49–67. [Google Scholar] [CrossRef]
  7. Madureira, H.; Andresen, T.; Monteiro, A. Green structure and planning evolution in Porto. Urban For. Urban Green. 2011, 10, 141–149. [Google Scholar] [CrossRef]
  8. Arnberger, A.; Eder, R. Are urban visitors’ general preferences for green-spaces similar to their preferences when seeking stress relief? Urban For. Urban Green. 2015, 14, 872–882. [Google Scholar] [CrossRef]
  9. Lindholst, A.C.; Konijnendijk van den Bosch, C.C.; Kjøller, C.P.; Sullivan, S.; Kristoffersson, A.; Fors, H.; Nilsson, K. Urban green space qualities reframed toward a public value management paradigm: The case of the Nordic Green Space Award. Urban For. Urban Green. 2016, 17, 166–176. [Google Scholar] [CrossRef]
  10. Schipperijn, J.; Ekholm, O.; Stigsdotter, U.K.; Toftager, M.; Bentsen, P.; Kamper-Jørgensen, F.; Randrup, T.B. Factors influencing the use of green space: Results from a Danish national representative survey. Landsc. Urban Plan. 2010, 95, 130–137. [Google Scholar] [CrossRef]
  11. Wan, C.; Shen, G.Q. Salient attributes of urban green spaces in high density cities: The case of Hong Kong. Habitat Int. 2015, 49, 92–99. [Google Scholar] [CrossRef]
  12. Chiesura, A. The role of urban parks for the sustainable city. Landsc. Urban Plan. 2004, 68, 129–138. [Google Scholar] [CrossRef]
  13. Shan, X.-Z. Socio-demographic variation in motives for visiting urban green spaces in a large Chinese city. Habitat Int. 2014, 41, 114–120. [Google Scholar] [CrossRef]
  14. Lo, A.Y.; Jim, C.Y. Willingness of residents to pay and motives for conservation of urban green spaces in the compact city of Hong Kong. Urban For. Urban Green. 2010, 9, 113–120. [Google Scholar] [CrossRef]
  15. Sanesi, G.; Lafortezza, R.; Bonnes, M.; Carrus, G. Comparison of two different approaches for assessing the psychological and social dimensions of green spaces. Urban For. Urban Green. 2006, 5, 121–129. [Google Scholar] [CrossRef]
  16. Tyrväinen, L.; Mäkinen, K.; Schipperijn, J. Tools for mapping social values of urban woodlands and other green areas. Landsc. Urban Plan. 2007, 79, 5–19. [Google Scholar] [CrossRef]
  17. Lo, A.Y.H.; Jim, C.Y. Citizen attitude and expectation towards greenspace provision in compact urban milieu. Land Use Policy 2012, 29, 577–586. [Google Scholar] [CrossRef]
  18. Jim, C.Y.; Shan, X. Socioeconomic effect on perception of urban green spaces in Guangzhou, China. Cities 2013, 31, 123–131. [Google Scholar] [CrossRef]
  19. Lohr, V.I.; Pearson-Mims, C.H.; Tarnai, J.; Dillman, D.A. How urban residents rate and rank the benefits and problems associated with trees in cities. J. Arboric. 2004, 30, 28–35. [Google Scholar]
  20. Vesely, É.-T. Green for green: The perceived value of a quantitative change in the urban tree estate of New Zealand. Ecol. Econ. 2007, 63, 605–615. [Google Scholar] [CrossRef]
  21. Madureira, H.; Nunes, F.; Oliveira, J.V.; Cormier, L.; Madureira, T. Urban residents’ beliefs concerning green space benefits in four cities in France and Portugal. Urban For. Urban Green. 2015, 14, 56–64. [Google Scholar] [CrossRef]
  22. Adinolfi, C.; Suárez-Cáceres, G.P.; Cariñanos, P. Relation between visitors’ behaviour and characteristics of green spaces in the city of Granada, south-eastern Spain. Urban For. Urban Green. 2014, 13, 534–542. [Google Scholar] [CrossRef]
  23. Bertram, C.; Rehdanz, K. Preferences for cultural urban ecosystem services. Comparing attitudes, perception, and use. Ecosyst. Serv. 2015, 187–199. [Google Scholar] [CrossRef]
  24. Bullock, C.H. Valuing urban green space: Hypothetical alternatives and the status quo. J. Environ. Plan. Manag. 2008, 51, 15–35. [Google Scholar] [CrossRef]
  25. Giles-Corti, B.; Broomhall, M.H.; Knuiman, M.; Collins, C.; Douglas, K.; Ng, K.; Lange, A.; Donovan, R.J. Increasing walking: How important is distance to, attractiveness, and size of public open space? Am. J. Prev. Med. 2005, 28, 169–176. [Google Scholar] [CrossRef] [PubMed]
  26. Voigt, A.; Kabisch, N.; Wurster, D.; Haase, D.; Breuste, J. Structural diversity: A multi-dimensional approach to assess recreational services in urban parks. AMBIO 2014, 43, 480–491. [Google Scholar] [CrossRef] [PubMed]
  27. Schipperijn, J.; Stigsdotter, U.K.; Randrup, T.B.; Troelsen, J. Influences on the use of urban green space—A case study in Odense, Denmark. Urban For. Urban Green. 2009, 9, 25–32. [Google Scholar] [CrossRef]
  28. Wan, C.; Shen, G.Q. Encouraging the use of urban green space: The mediating role of attitude, perceived usefulness and perceived behavioural control. Habitat Int. 2015, 50, 130–139. [Google Scholar] [CrossRef]
  29. INE. Censos 2011: XV Recenseamento Geral da População/V Recenseamento Geral da Habitação; INE: Lisboa, Portugal, 2011. [Google Scholar]
  30. Kabisch, N.; Strohbach, M.; Haase, D.; Kronenberg, J. Urban green space availability in European cities. Ecol. Indic. 2016, 70, 586–596. [Google Scholar] [CrossRef]
  31. European Environment Agency. Indicators for Urban Green Infrastructure; European Environment Agency: Copenhagen, Denmark, 2018. [Google Scholar]
  32. Finn, A.; Louviere, J.J. Determining the appropriate response to evidence of public concern: The case of food safety. J. Public Policy Mark. 1992, 11, 12–25. [Google Scholar]
  33. Burke, P.F.; Schuck, S.; Aubusson, P.; Buchanan, J.; Louviere, J.J.; Prescott, A. Why do early career teachers choose to remain in the profession? The use of best-worst scaling to quantify key factors. Int. J. Educ. Res. 2013, 62, 259–268. [Google Scholar] [CrossRef]
  34. Jones, A.K.; Jones, D.L.; Edwards-Jones, G.; Cross, P. Informing decision making in agricultural greenhouse gas mitigation policy: A Best-Worst Scaling survey of expert and farmer opinion in the sheep industry. Environ. Sci. Policy 2013, 29, 46–56. [Google Scholar] [CrossRef]
  35. Erdem, S.; Rigby, D.; Wossink, A. Using best-worst scaling to explore perceptions of relative responsibility for ensuring food safety. Food Policy 2012, 37, 661–670. [Google Scholar] [CrossRef]
  36. Marti, J. A best worst scaling survey of adolescents’ level of concern for health and non-health consequences of smoking. Soc. Sci. Med. 2012, 75, 87–97. [Google Scholar] [CrossRef] [PubMed]
  37. Louviere, J.J.; Islam, T. A comparison of importance weights and willingness-to-pay measures derived from choice-based conjoint, constant sum scales and best-worst scaling. J. Bus. Res. 2008, 61, 903–911. [Google Scholar] [CrossRef]
  38. Dekhili, S.; Sirieix, L.; Cohen, E. How consumers choose olive oil: The importance of origin cues. Food Qual. Preference 2011, 22, 757–762. [Google Scholar] [CrossRef]
  39. Flynn, T.N.; Louviere, J.J.; Peters, T.J.; Coast, J. Using discrete choice experiments to understand preferences for quality of life. Variance-scale heterogeneity matters. Soc. Sci. Med. 2010, 70, 1957–1965. [Google Scholar] [CrossRef] [PubMed]
  40. Cohen, E. Applying best-worst scaling to wine marketing. Int. J. Wine Bus. Res. 2009, 21, 8–23. [Google Scholar] [CrossRef]
  41. Dumbrell, N.P.; Kragt, M.E.; Gibson, F.L. What carbon farming activities are farmers likely to adopt? A best-worst scaling survey. Land Use Policy 2016, 54, 29–37. [Google Scholar] [CrossRef]
  42. Beck, M.J.; Rose, J.M. The best of times and the worst of times: A new best-worst measure of attitudes toward public transport experiences. Transp. Res. Part A Policy Pract. 2016, 86, 108–123. [Google Scholar] [CrossRef]
  43. Nunes, F.; Madureira, T.; Oliveira, J.V.; Madureira, H. The consumer trail: Applying best-worst scaling to classical wine attributes. Wine Econ. Policy 2016, 5, 78–86. [Google Scholar] [CrossRef]
  44. Sawtooth Software Inc. Sawtooth Software: The MaxDiff SystemTechnical Paper; Sawtooth Software, Inc.: Orem, Utah, 2013. [Google Scholar]
  45. Loose, S.M.; Lockshin, L. Testing the robustness of best worst scaling for cross-national segmentation with different numbers of choice sets. Food Qual. Preference 2013, 27, 230–242. [Google Scholar] [CrossRef]
  46. European Union. Quality of Life; Publications Office of the European Union: Luxembourg, 2015. [Google Scholar]
  47. Swanwick, C.; Dunnett, N.; Woolley, H. Nature, Role and Value of Green Space in Towns and Cities: An Overview. Built Environ. 2003, 29, 94–106. [Google Scholar] [CrossRef]
  48. Francis, J.; Wood, L.J.; Knuiman, M.; Giles-Corti, B. Quality or quantity? Exploring the relationship between Public Open Space attributes and mental health in Perth, Western Australia. Soc. Sci. Med. 2012, 74, 1570–1577. [Google Scholar] [CrossRef] [PubMed]
  49. Lindholst, A.C.; Sullivan, S.G.; van den Bosch, C.C.K.; Fors, H. The Inherent Politics of Managing the Quality of Urban Green Spaces. Plan. Pract. Res. 2015, 30, 376–392. [Google Scholar] [CrossRef]
  50. Van Dillen, S.M.E.; de Vries, S.; Groenewegen, P.P.; Spreeuwenberg, P. Greenspace in urban neighbourhoods and residents’ health: Adding quality to quantity. J. Epidemiol. Community Health 2012, 66, e8. [Google Scholar] [CrossRef] [PubMed]
  51. Bernardini, C.; Irvine, K.N. The “nature” of urban sustainability: Private or public greenspaces? In Sustainable Development and Planning III; Kungolas, A., Brebbia, C.A., Beriatos, E., Eds.; WIT Press: Southampton, UK, 2007; Volume II, pp. 661–674. ISBN 9781845640699. [Google Scholar]
  52. Jim, C.Y.; Chen, W.Y. Recreation-amenity use and contingent valuation of urban greenspaces in Guangzhou, China. Landsc. Urban Plan. 2006, 75, 81–96. [Google Scholar] [CrossRef]
  53. Qureshi, S.; Breuste, J.H.; Jim, C.Y. Differential community and the perception of urban green spaces and their contents in the megacity of Karachi, Pakistan. Urban Ecosyst. 2013, 16, 853–870. [Google Scholar] [CrossRef]
  54. McCormack, G.R.; Rock, M.; Toohey, A.M.; Hignell, D. Characteristics of urban parks associated with park use and physical activity: A review of qualitative research. Health Place 2010, 16, 712–726. [Google Scholar] [CrossRef] [PubMed]
  55. Ives, C.D.; Kelly, A.H. The coexistence of amenity and biodiversity in urban landscapes. Landsc. Res. 2015, 41, 495–509. [Google Scholar] [CrossRef]
  56. Qiu, L.; Lindberg, S.; Nielsen, A.B. Is biodiversity attractive?—On-site perception of recreational and biodiversity values in urban green space. Landsc. Urban Plan. 2013, 119, 136–146. [Google Scholar] [CrossRef]
  57. Pett, T.J.; Shwartz, A.; Irvine, K.N.; Dallimer, M.; Davies, Z.G. Unpacking the People-Biodiversity Paradox: A Conceptual Framework. BioScience 2016, 66, 576–583. [Google Scholar] [CrossRef]
  58. Tyrväinen, L.; Silvennoinen, H.; Kolehmainen, O. Ecological and aesthetic values in urban forest management. Urban For. Urban Green. 2003, 1, 135–149. [Google Scholar] [CrossRef]
  59. Shanahan, D.F.; Lin, B.B.; Gaston, K.J.; Bush, R.; Fuller, R.A. What is the role of trees and remnant vegetation in attracting people to urban parks? Landsc. Ecol. 2014, 30, 153–165. [Google Scholar] [CrossRef]
  60. Völker, S.; Kistemann, T. Developing the urban blue: Comparative health responses to blue and green urban open spaces in Germany. Health Place 2015, 35, 196–205. [Google Scholar] [CrossRef] [PubMed]
  61. Völker, S.; Kistemann, T. The impact of blue space on human health and well-being—Salutogenetic health effects of inland surface waters: A review. Int. J. Hyg. Environ. Health 2011, 214, 449–460. [Google Scholar] [CrossRef] [PubMed]
  62. Nordh, H.; Alalouch, C.; Hartig, T. Assessing restorative components of small urban parks using conjoint methodology. Urban For. Urban Green. 2011, 10, 95–103. [Google Scholar] [CrossRef]
  63. Harris, V.; Kendal, D.; Hahs, A.K.; Threlfall, C.G. Green space context and vegetation complexity shape people’s preferences for urban public parks and residential gardens. Landsc. Res. 2017, 1–13. [Google Scholar] [CrossRef]
  64. Howley, P. Landscape aesthetics: Assessing the general publics’ preferences towards rural landscapes. Ecol. Econ. 2011, 72, 161–169. [Google Scholar] [CrossRef]
Figure 1. Global perceptions and aspirations for urban green spaces in Lisbon, Porto and Évora.
Environments 05 00023 g001
Figure 2. Rescaled Scores for the green spaces characteristics evaluated by respondents from Lisbon, Porto and Évora. Scores are ordered according to global results.
Environments 05 00023 g002
Table 1. Resident population in Lisbon, Porto and Évora [29].
Urban AreasPopulation
CityMetropolitan Area
Lisbon552,7002,821,876
Porto237,5911,759,524
Évora41,898-
Table 2. Socioeconomic characteristics of respondents and the weighted sample according to census data.
GenderAgeEducationLisbonPortoÉvora
RealWeightedRealWeightedRealWeighted
Male15–34<University3 (1.2%)19 (7.6%)8 (3.2%)20 (8%)7 (2.8%)25 (10%)
≥University24 (9.6%)16 (6.4%)15 (6%)13 (5.2%)11 (4.4%)11 (4.4%)
35–54<University4 (1.6%)21 (8.4%)2 (0.8%)24 (9.6%)16 (6.4%)31 (12.4%)
≥University54 (21.6%)16 (6.4%)30 (12%)12 (4.8%)36 (14.4%)10 (4%)
≥55<University1 (0.4%)30 (12%)15 (6%)33 (13.2%)16 (6.4%)36 (14.4%)
≥University19 (7.6%)11 (4.4%)25 (10%)10 (4%)12 (4.8%)4 (1.6%)
Female15–34<University1 (0.4%)16 (6.4%)11 (4.4%)16 (6.4%)3 (1.2%)20 (8%)
≥University29 (11.6%)19 (7.6%)24 (9.6%)16 (6.4%)12 (4.8%)15 (6%)
35–54<University4 (1.6%)20 (8%)12 (4.8%)26 (10.4%)17 (6.8%)28 (11.2%)
≥University65 (26%)19 (7.6%)65 (26%)17 (6.8%)82 (32.8%)15 (6%)
≥55<University4 (1.6%)51 (20.4%)13 (5.2%)54 (21.6%)21 (8.4%)50 (20%)
≥University42 (16.8%)12 (4.8%)30 (12%)9 (3.6%)17 (6.8%)5 (2%)
Total 250 (100%)250 (100%)250 (100%)250 (100%)250 (100%)250 (100%)
Table 3. Raw Scores (RS) and Rescaled scores (RsS) relating to the thirteen attributes.
AttributeLisbonPortoÉvoraTotal
RSRsSRSRsSRSRsSRsS
Cleanliness and Maintenance4.2115.933.9716.193.8716.3116.14
Richness in plant species1.8913.672.3713.031.8912.2412.98
Existence of water bodies1.2911.201.9212.321.2810.3911.30
Sufficient benches1.4211.411.089.841.3211.0110.75
Tranquility2.1012.692.3512.320.027.1410.72
Existence of playground0.476.78−0.146.721.4410.437.98
Richness in animal species0.226.761.039.470.117.267.83
Opportunities for sport activities−1.455.34−0.346.131.2510.187.22
Good facilities0.237.09−0.935.27−0.526.006.12
Existence of car parking−1.533.20−1.454.93−1.983.463.86
Large size of the park−2.602.50−2.971.09−2.722.151.91
Existence of quiet and privacy areas−2.532.24−2.792.00−3.291.441.89
High frequency of visitors−3.711.20−4.110.70−2.682.001.30
Table 4. Analysis of Kruskal-Wallis test for the mean of the rescaled scores among the three cities. The grey shade indicates significant differences between the mean scores among urban areas for a significance level = 0.05.
AttributeLisbon-PortoPorto-ÉvoraLisbon-Évora
Asymptotic Significances
Cleanliness and Maintenance0.0000.0000.226
Richness in plant species0.0060.0140.720
Existence of water bodies0.0080.0080.799
Sufficient benches0.2000.8110.415
Tranquillity0.0350.0000.000
Existence of playground0.0670.0000.000
Richness in animal species0.0040.0150.808
Opportunities for sport activities0.0000.0230.000
Good facilities0.7510.0750.051
Existence of car parking0.0000.0070.019
Large size of the park0.1370.4630.481
Existence of quiet and privacy areas0.2050.0000.000
High frequency of visitors0.2060.0000.000

