Article

Assessment of Residents’ Exposure to Leisure Noise in Málaga (Spain)

Grupo de Investigación en Instrumentación y Acústica Aplicada, Universidad Politécnica de Madrid, 28031 Madrid, Spain
*
Authors to whom correspondence should be addressed.
Environments 2018, 5(12), 134; https://doi.org/10.3390/environments5120134
Submission received: 25 October 2018 / Revised: 3 December 2018 / Accepted: 5 December 2018 / Published: 7 December 2018
(This article belongs to the Special Issue New Solutions Mitigating Environmental Noise Pollution)

Abstract

:
Leisure noise is a continual source of complaints from residents of affected areas, and its management poses a difficult challenge for local authorities, especially in tourist destinations, such as Málaga. The city council of this city has set a goal of mitigating the noise produced by leisure activities. In 2015, it began mitigation actions, starting with the assessment of the noise through a temporal monitoring campaign in two specific areas of the city where leisure activities are prevalent. Beyond the objective assessment of the noise levels through measurements, the research team programmed several communication actions (a) to improve the trust, visibility, and reliability of the noise-monitoring process through press and social networks and (b) to gather the subjective response to noise from residents in the affected areas. The results obtained were very helpful to raise awareness among stakeholders and to support the planning and prioritization of further noise mitigation actions. Furthermore, the research team aimed to analyze the long-term noise indicators and the time-based patterns of noise in different areas, trying to establish conclusions that can be helpful for other areas of the city and testing the applicability of previous leisure noise models for the city of Málaga. The results showed that the noise levels in the leisure areas in Málaga are quite high at night (Ln over 60 dBA in almost every location), especially during weekend nights, where we observed locations with noise levels over 75–80 dBA until late hours of the night. We also made an analysis of the leisure noise models proposed in previous investigations and their performance in the case of Málaga.

1. Introduction

Environmental noise is a source of pollution that has been broadly studied. It is widely recognized that environmental noise harms human health and interferes with people’s activities [1,2,3,4]. In the last two decades, environmental authorities and researchers have focused their efforts on the study and management of transportation and industrial noise because these are the most extended sources and affect a huge number of people all over the world [5,6,7,8]. For example, in 2002, the European Union issued an Environmental Noise Directive whose main goal was to reduce noise pollution in the EU [9].
However, this initiative did not include recreational and leisure noise, largely because—in comparison to the previously mentioned noise pollution sources—these noise sources are spatially constrained polluters that usually affect only specific areas of a city or town. Leisure noise comprises mainly the uproar produced by agglomerations of people around bars, pubs, terraces, and parks, but it can also be related to tourism activities or special events such as festivals, celebrations, or sports competitions. Moreover, it can be a mix of voices, music, shouts, and other antisocial activities that cause noise. Sources of leisure noise cause continual complaints from area citizens because they have evident effects, such as annoyance and sleep disturbance that residents experience firsthand. Even in the case of singular noisy events, recreational noise can have an effect on the long-term noise assessment at one point [10], and it poses a difficult challenge for local authorities, especially in Mediterranean European countries. Therefore, research in this area has expanded in recent years as cities have increasingly been forced to diagnose the problem and implement mitigation measures. In fact, the World Health Organization recently published specific environmental noise guidelines for Europe, where leisure noise is for the first time considered a health threat for European citizens that should be reduced [11].
Some of the published research related to leisure noise has focused on the effects of noise on people participating directly in the leisure activity or on workers [12,13,14,15,16,17,18,19,20], but little published research focuses on leisure noise from the perspectives of environmental pollution, residents’ health, welfare, risks, and housing prices.
Fimiani [21] describes the problem of leisure noise in the city center of Bologna (Italy) and a low-cost monitoring system implemented to diagnose the noise levels. Also in Italy, an investigation by Ottoz [22,23,24] details the situation in Milan and Turin, where web surveys were performed to analyze the welfare of the residents in the study areas. A noise-monitoring campaign was also conducted that showed the high noise levels to which residents were exposed in those areas. Vinci [25] decided to place noise sensors in private houses in the center of Pisa (Italy) to show that public strategy maps usually do not work in some Mediterranean cities, due to leisure noise.
Ballesteros [26,27] took a different approach, suggesting an analytical model to predict street noise levels based on variables such as the number of leisure venues, street width, and the mean height of buildings. The “soundwalker” method for data acquisition described in this paper was applied to assess noise emissions produced by individual leisure activities in [28]. As opposed to traditional noise monitoring, the main advantage of the soundwalker method is that it can be easily tailored to fit specific purposes, to assess specific activities, or to make assessments during specific time periods. However, a technician must conduct the soundwalker measurement process, which is a major economic drawback when the goal is to monitor noise pollution over long periods or to determine the typical periods of noise in an area.
Unattended continuous noise monitoring has been used in the past to assess noise levels from festivals, for instance, in References [29,30,31], and has been used in several Spanish cities to assess noise levels in specific locations in nighttime leisure areas such as Madrid, Barcelona, and Palma de Mallorca, mainly over the short term. In this paper, we describe the methodology applied in Málaga, which has been used for leisure noise assessment in the long and short term according to the regulation in Spain and set the basis for a long-term study conceived to analyze the influence of awareness on the perceived annoyance.

The Case of Málaga

As shown in the latest Spanish Ombudsman reports, noise pollution linked to bars and discos is an important environmental issue in Spain [32]. In Málaga, leisure noise has become a major problem in recent years, as can be inferred from noise surveys carried out in 2012 [33] and the approximately 10,000 complaints per year reported by residents since 2011 [34].
Málaga is a warm city on the Mediterranean coast of southern Spain with a population over half a million and a municipality area of 398 km2. Its warm climate and abundance of sunny days have promoted tourism for years and stimulate people’s outdoor activities throughout the year; in fact, it receives more than 1 million tourists every year [35,36]. This leads to large accumulations of people in the streets, who produce high noise levels, damaging the welfare of permanent residents. In response, the Málaga authorities identified leisure noise as one of the most important environmental issues in the city and in 2014 began an initiative to address that problem, starting with a thorough diagnosis in 2015 in two main areas of concern: The city center and Teatinos-Universidad neighborhoods.
The city center is the oldest part of the city. It has an area of 3.17 km2 with a predominance of foot traffic and narrow streets and more than 1000 restaurants, bars, pubs, and terraces [37,38]. This area has experienced a great increase in tourism and recreational activity in recent years. Since the 1960s, the population in this area has been gradually decreasing. To curb depopulation, the Special Plan for the Protection and Interior Reform of the Historic Quarter (PEPRI) was implemented during the 1990s [39]. This plan consisted of improving security problems and mitigating the abandonment of the city center by remodeling historic buildings, increasing the number of green areas, encouraging the rehabilitation of private housing, and stimulating the creation of local businesses to provide services to residents [40]. These measures succeeded in slowing down the city center exodus, but with the arrival of the world economic crisis in 2008, many local businesses were transformed into restaurants and leisure facilities [37], trying to take advantage of the rapid growth of the city as one of the main tourism hubs in southern Spain [35,36]. Tourist destinations and leisure activities have attracted large numbers of both tourists and native citizens from the entire Málaga area; therefore, this is a busy area during the day. Nighttime activity has been focused in some specific locations, especially during the weekends. In the streets analyzed in this study, there are approximately 1600 residents, according to city council statistics.
The Teatinos-Universidad neighborhood, referenced as Teatinos in this paper, is a new residential area created in 1983 and expanded in 1998 by general plans for the expansion of the city of Málaga in those years [41]. This fairly new residential area has an extension of 5.4 km2 with wide streets and avenues [42] and large sidewalks often partially occupied by bar and restaurant outdoor terraces. The campus of the University of Málaga is located in this district, and hence, there are leisure businesses in the area and a large number of young people living there. The hub of nighttime activity is a large trendy pub that attracts young people—and their cars—to the area. The streets analyzed by this study are home to approximately 2200 residents, according to city council statistics.

2. Objectives

Although it was clear from the beginning that both selected locations were rather noisy areas, a noise assessment study was necessary to inform the residents about their noise exposure and to rate the problem in comparison to regulations, gathering information that could be used:
  • To compare different locations and areas with the goal of establishing priorities for action plans;
  • To determine where the noise occurs at each location during workdays and weekends;
  • To raise noise awareness at all levels of society (bar, pub, and restaurant owners and patrons, residents, and authorities);
  • To give support to any mitigation action that could affect owners, users, or residents;
  • To determine the amount of reduction required in each area;
  • To assess the “before condition” to improve the later evaluations of the efficacy of the mitigation measures.
Thus, the objective of this project was to empirically assess the leisure noise in the streets using noise monitoring. This paper describes the methodology we applied to assess the leisure noise in Málaga. This approach could be adapted to any other situation. Consequently, we aimed to evaluate a first step towards an overall procedure that can be implemented in future studies: To simultaneously assess noise levels and people’s perceptions (through web surveys) while modifying the non-acoustic factors related to “awareness” through engagement to improve people’s acceptance of leisure activities and reduce annoyance [43,44]. This way, beyond being a diagnosis tool, noise monitoring could be considered as part of a mitigation action.

3. Methodology

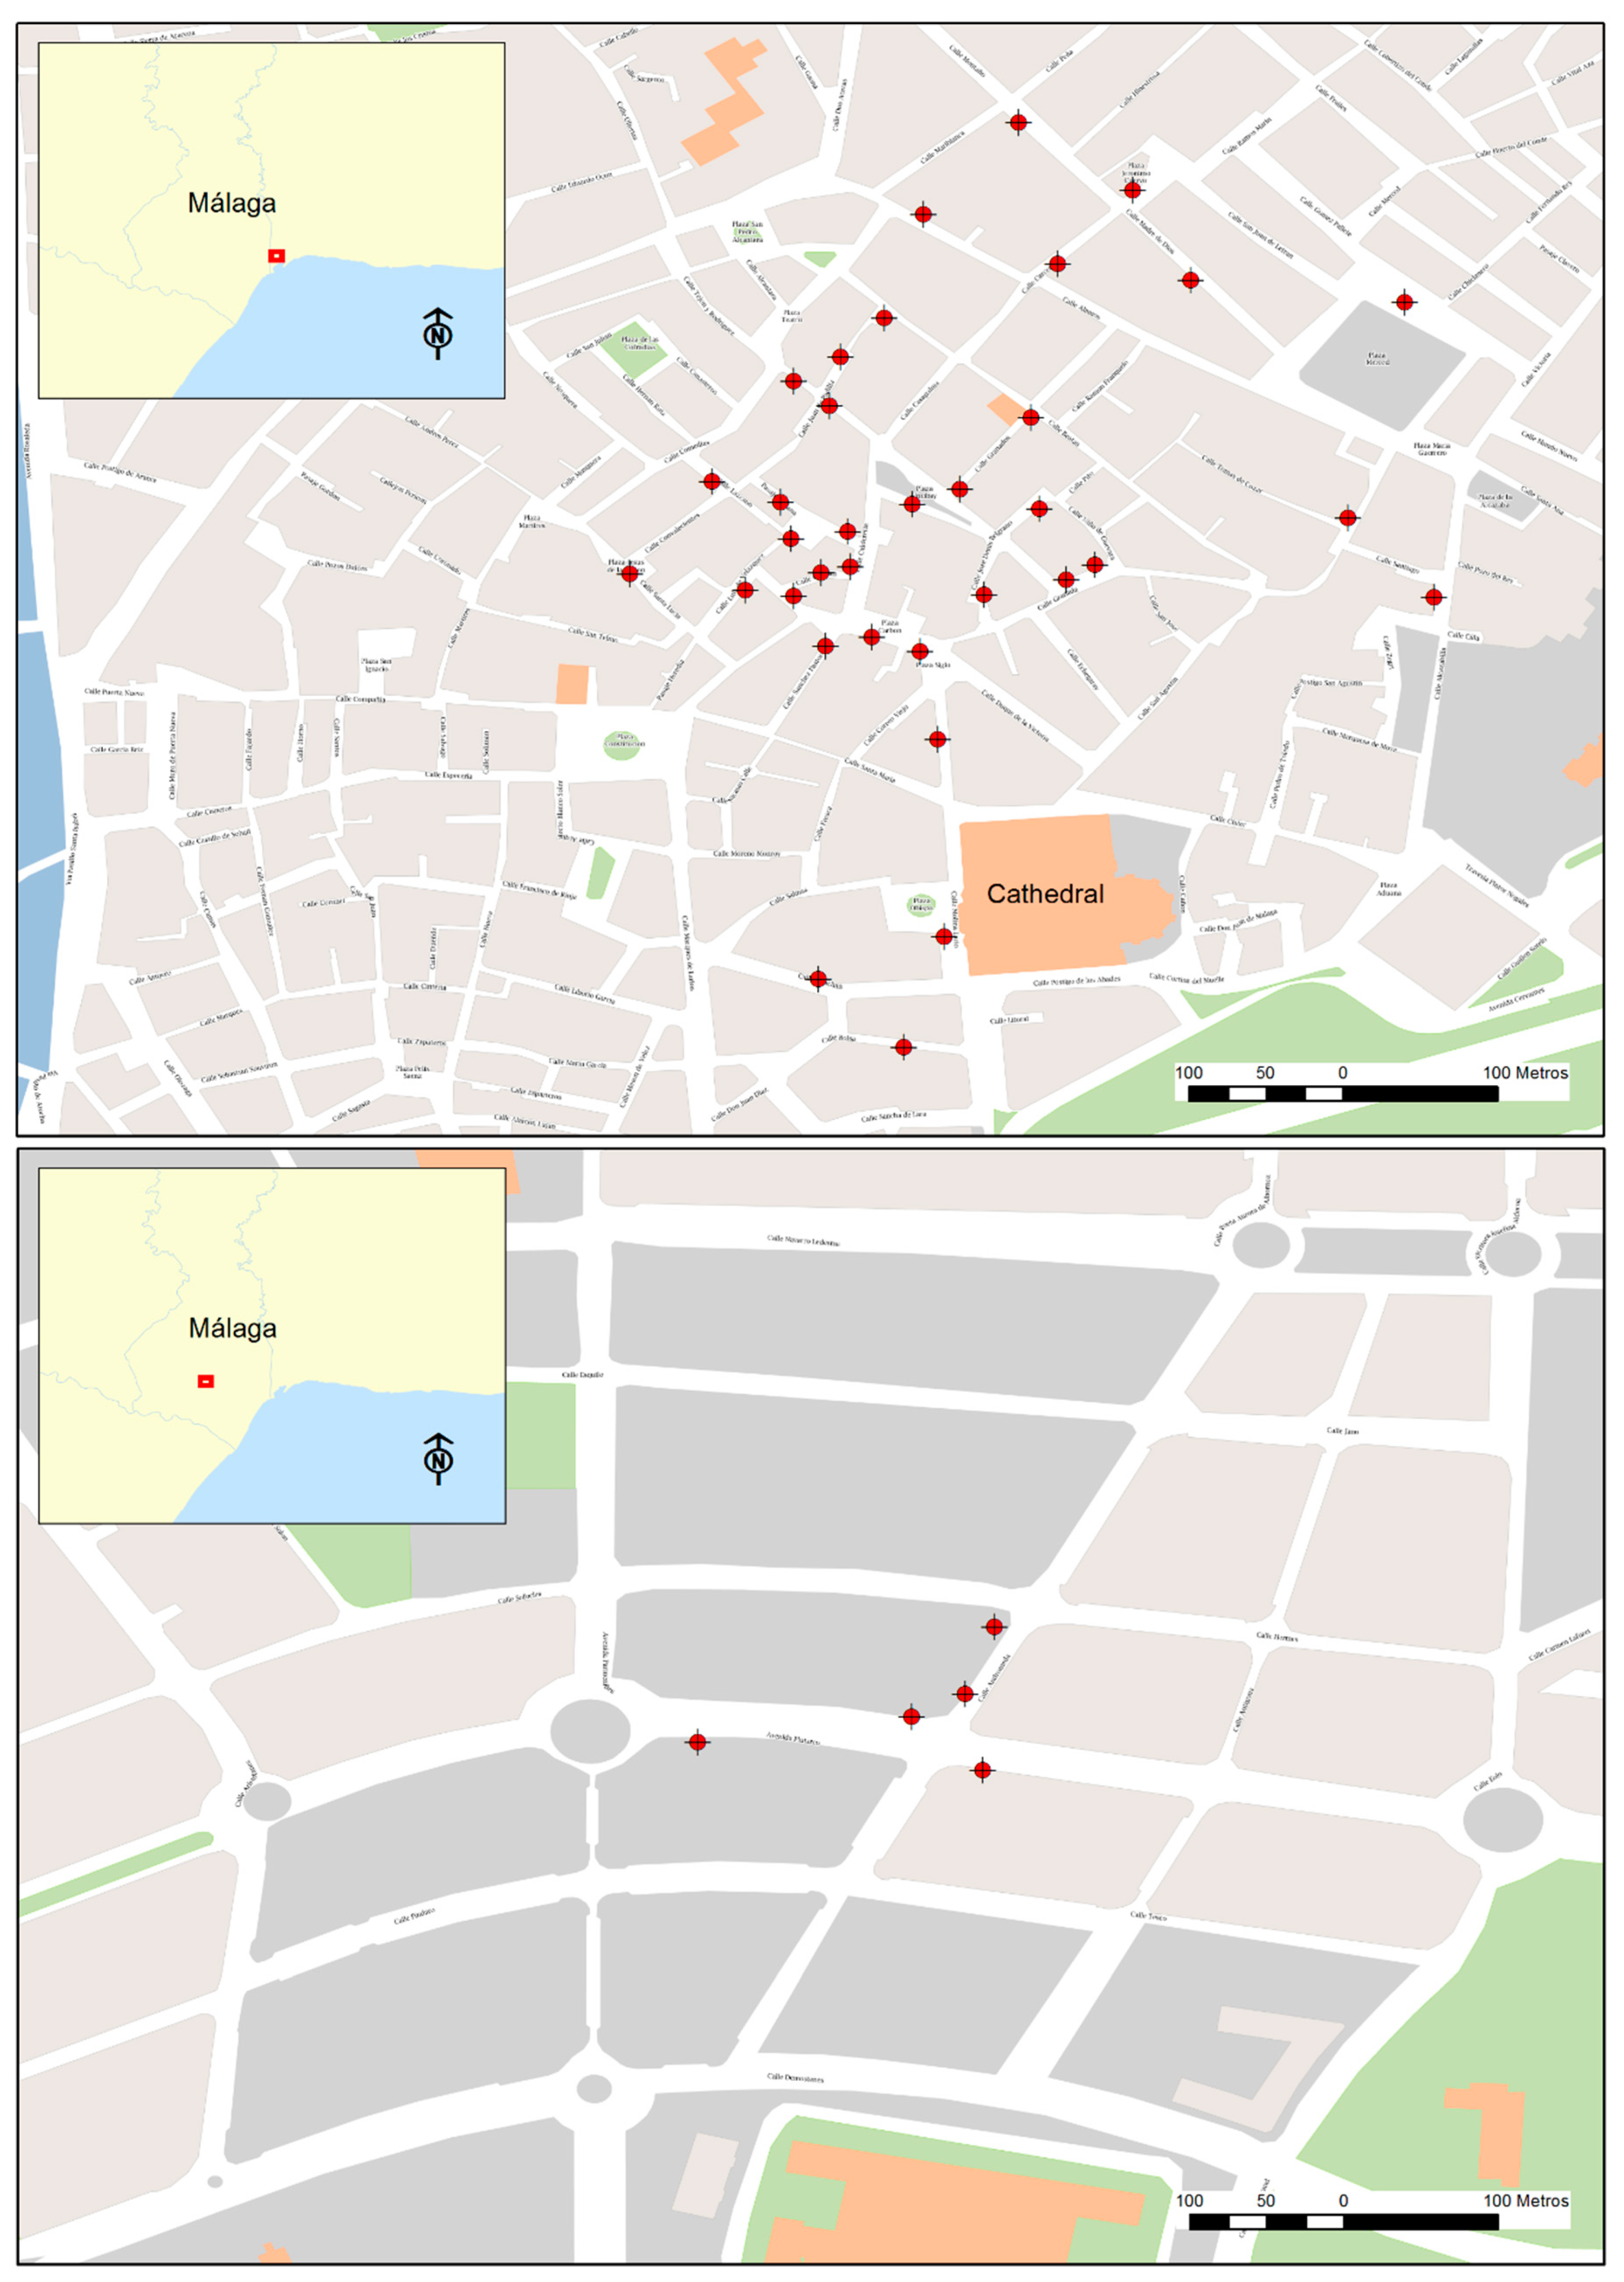
3.1. Planning and Sensor Network

In view of the project goals, both assessment and engagement, it was decided (a) to perform the noise assessment through actual noise monitoring rather than through simulation tools; (b) to measure the noise in a large number of different locations, observing the noise spatial variability within the large study area in such a way that the bulk of the citizens would perceive the noise measurements as representative of the acoustic climate in their homes; and (c) to provision the noise monitors with real-time web access.
Therefore, after a preliminary field study of possible areas, we selected 40 locations at which to install the monitors. Most of the selected locations were in the city center, with 35 monitors installed in this area, while the other five were in Teatinos. We placed the monitors in the subareas that had the highest rates of leisure activities and numbers of noise complaints. The distribution of the monitors is imbalanced, because while in the city center, the leisure activities extend over the entire area, the discos in Teatinos are concentrated over a smaller area, and hence, the number of necessary sound level meters is smaller. Figure 1 shows the position of each unit in the selected areas. All the locations were chosen to be representative of the predominant leisure noise in the area while also keeping basic security, safety, and accessibility constraints in mind. Each noise monitor consisted of a Type 1 certified sound level meter and was installed on a street lamp; hence, they would have a power supply to charge the batteries at night and can be camouflaged to a certain extent. From a technical perspective, the measurement units were equipped with an outdoor kit for both equipment and microphones, a data processing and storage system, a 3G-internet data connection, a rechargeable battery, and a solar panel.
The measurements were adjusted according to the methods specified in ISO 1996-2 [45]; therefore, all the results can be considered to be descriptive of the incident sound, which is the reference condition in ISO 1996-2. For practical reasons, the microphones had to be situated at different heights between 4 and 8 m (to be considered for future analysis). As an example, Figure 2 shows the installation of one of the monitors.
The monitoring unit measurements could be accessed through the web in real time to promote engagement with the public and to improve trust and transparency. We decided that the instruments had to measure the A-weighted equivalent sound pressure levels at 1 s intervals (LAeq,1s), because this is a dynamic indicator that reacts easily to changes in noise levels and because this measurement can be understood effortlessly by nonexperts. Each unit sent these second measurements every 5 min to a server to be preprocessed before displaying them on the visualization platform. The measurements were shown on the web platform with a delay of 20 min to prevent people from deliberately making noises with the intention of seeing changes in real time on the web. In addition to a time–history graph of these results, the webpage contained a map showing the location of the monitor, a brief description of the location, and its noise descriptors (Ld, Le, Ln, Lden). The system could also create reports for these noise descriptors based on user queries.
The monitoring units were installed and left in place at each location for at least 8 weeks between April and November 2015 to ensure that a full 6-month period was assessed. Table 1 shows the measurement periods in which the monitors were installed, as well as the area of the city where they were placed, the number of units, and the number of weeks of measurement. A minimum of 9 monitors continuously made measurements throughout the areas. Measurement efforts were progressively increased to reach 15 monitors operating simultaneously during the summer period (July to September) because the leisure activities increase in number during this period, as does the number of tourists in the city. Subsequently, we kept the additional monitors in place until the end of the assessment period (November).

3.2. Analysis

The analysis of the measurements at each location was performed according to three different criteria, which are described in the following subsections. As opposed to the measurements, which could be accessed in real time, these results were not presented during the monitoring sessions; instead, they were presented in a specific report at the end of the project. The report was formatted for presentation online and designed to optimize the communication of the technical issues to the public. In addition to the measurement results, the following sections provide brief descriptions of the contents and formats used in the report.

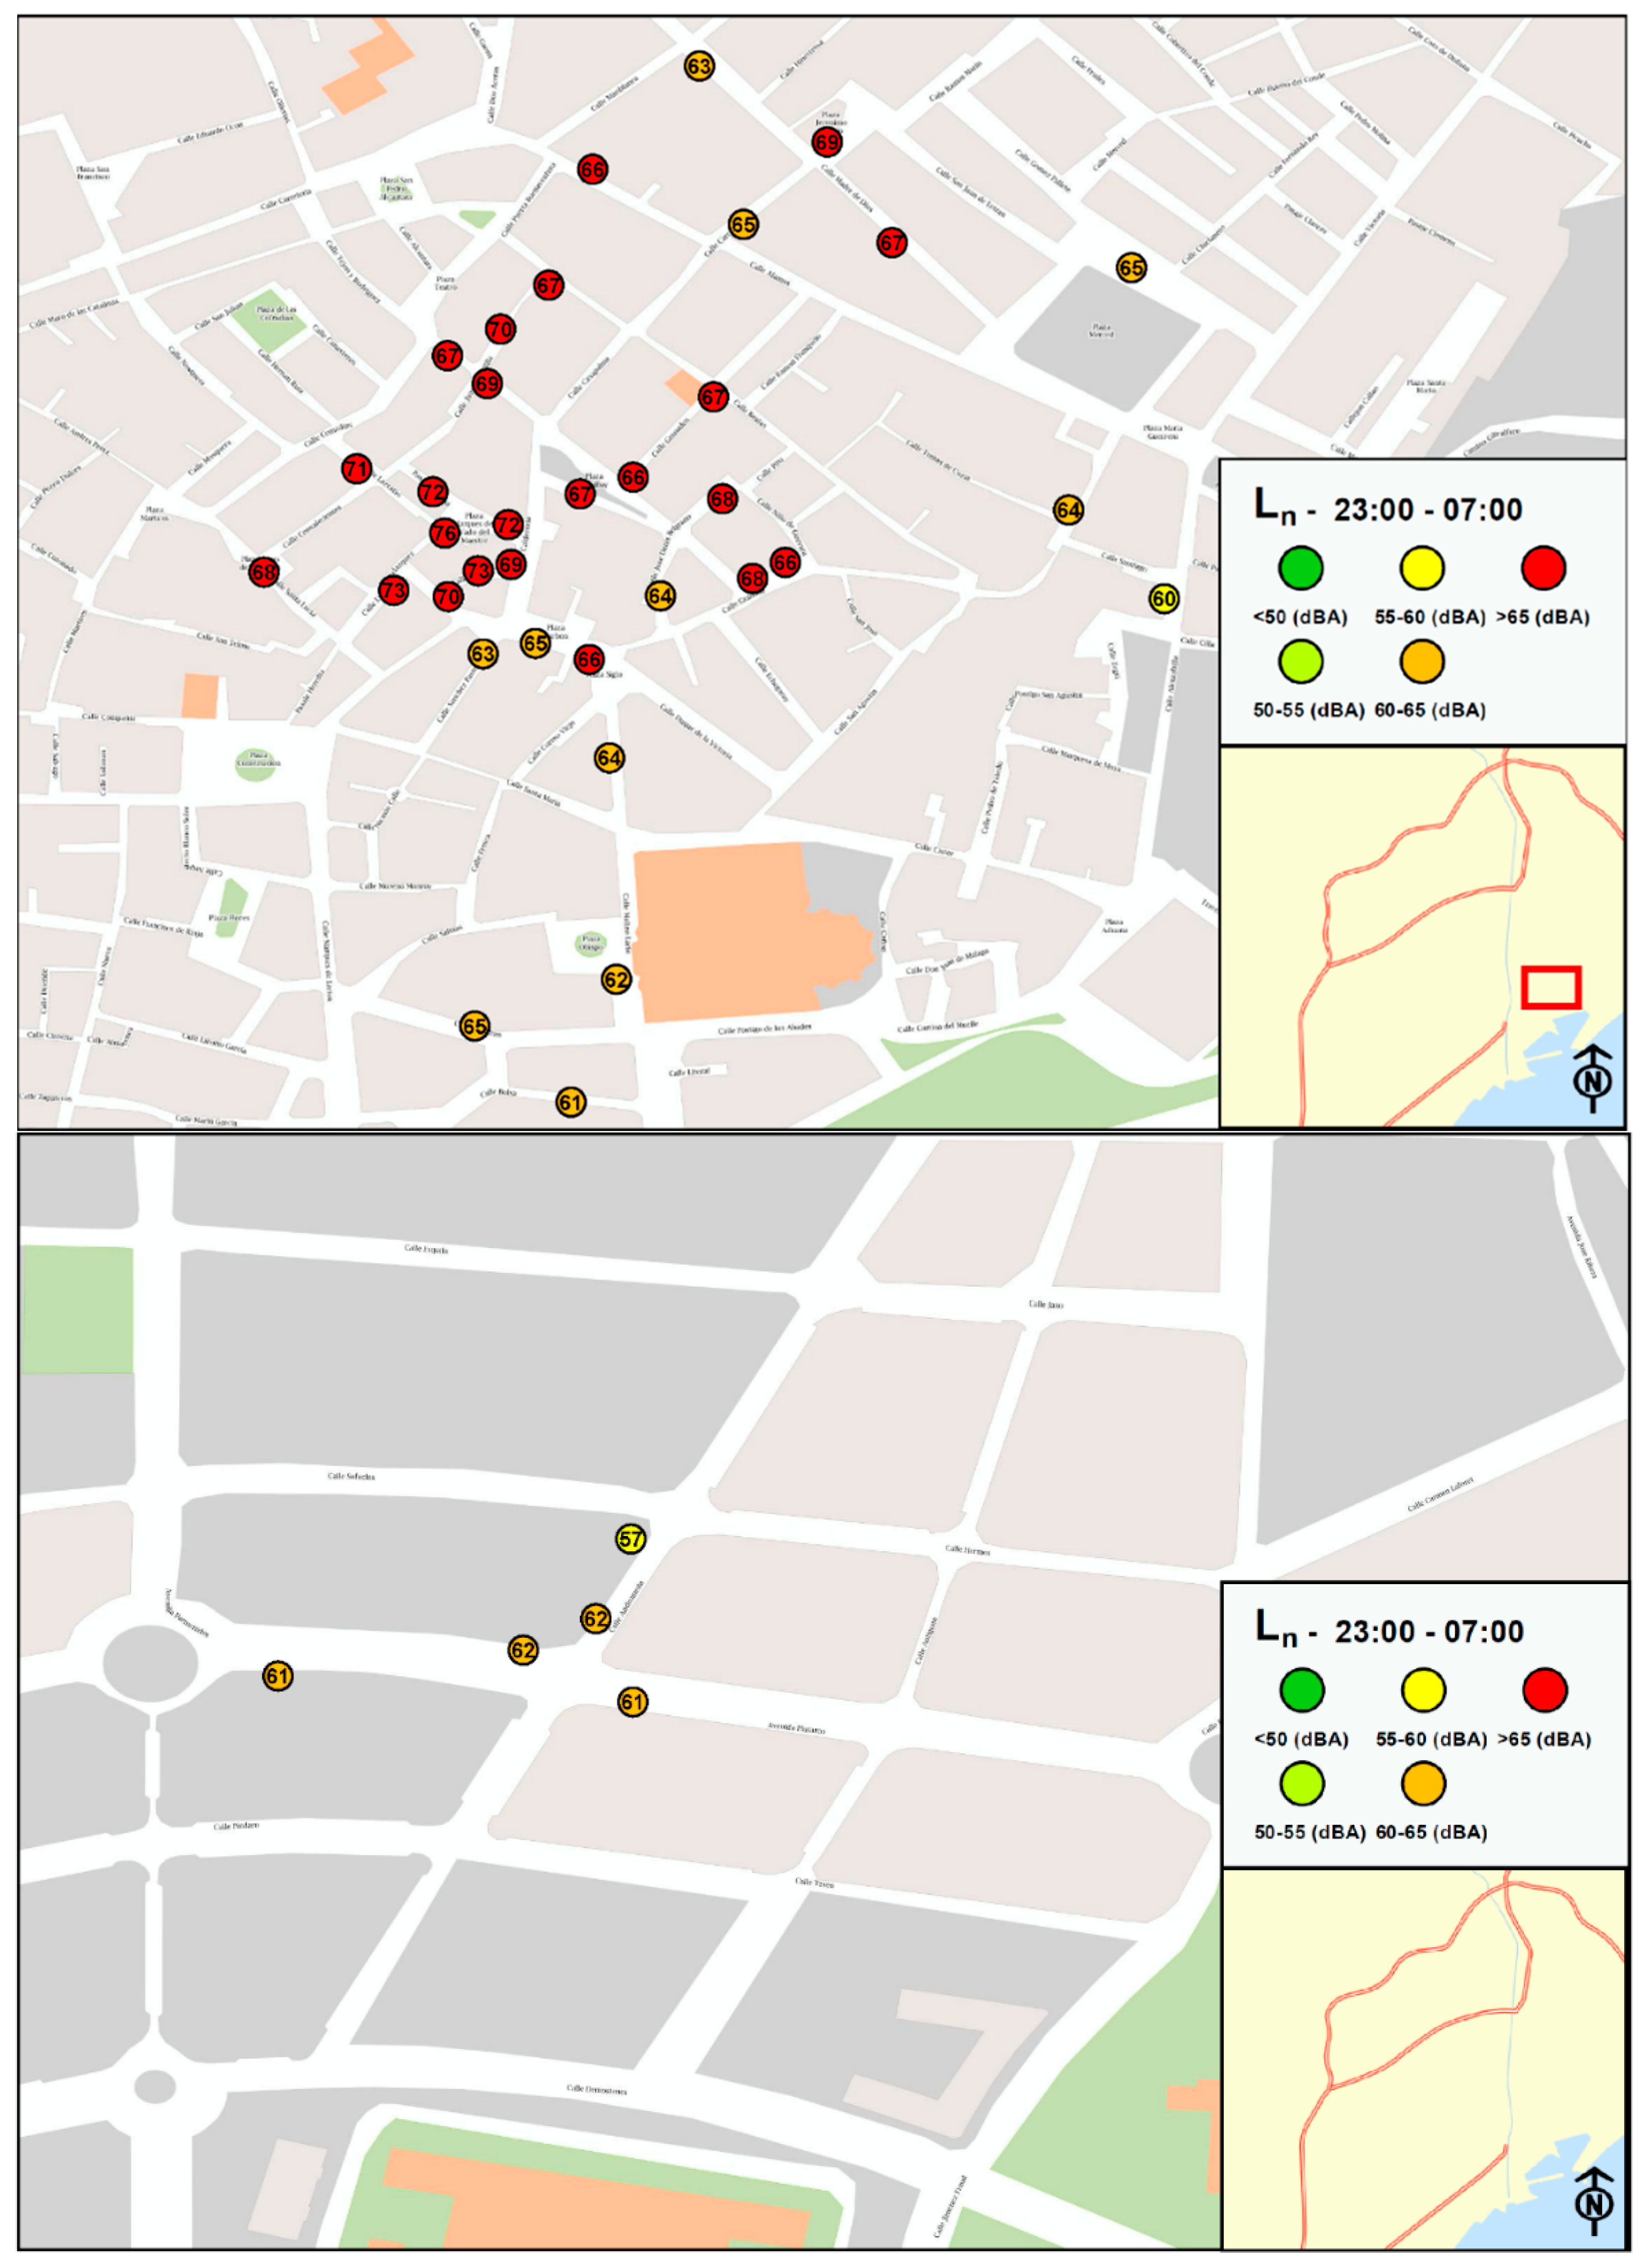
3.2.1. Acoustic Description over the Long Term

Because leisure activities in Málaga are not sporadic, it is important to obtain a full description of the cumulative noise pollution over the long term. This “long term” should be a full year, although in this case, with the assumption that the samples are sufficiently representative, the duration was reduced to the length of the measurement effort at each location (at least 8 weeks at each location; depending on the operative restrictions for the installation or uninstallation of the monitors, the measurement period in some of the locations was extended to over 20 weeks). Long-term equivalent sound pressure levels were assessed in three different reference intervals: Daytime (Ld), from 7 a.m. to 7 p.m.; evening (Le), from 7 p.m. to 11 p.m.; and nighttime (Ln), from 11 p.m. to 7 a.m. These indicators were compared to the acoustic quality targets (AQT) established by Spanish regulations; for residential areas, these targets are 65 dBA during the day and evening periods and 55 dBA at night [46].
In general, the acoustic situation in these areas during the daytime period is similar to that of other leisure areas in the city (noise map). The arithmetic mean value of Ld among the locations was 64.0 dBA, with a standard deviation of 2.9 dBA. In 78% of the locations, the noise levels (Ld) were in the range of 60–65 dBA; only 22% of the locations showed a cumulative level over the target (65 dBA).
The situation degenerated during the evening periods. The mean value in the evenings increased to 65.5 dBA (with a similar standard deviation, 2.8 dBA), and only 39% of the locations had a value lower than 65 dBA (Le). However, during the nighttime period, the situation became even noisier, not only because the noise levels (Ln) are higher in 43% of the locations, but also because the target for this period is 10 dBA lower (55 dBA). During the nighttime period, half the locations had an Ln value ranging between 63 and 68 dBA, and 95% of the locations showed noise levels 5 dBA over the target (55 dBA). Half of those were over 66 dBA. The mean value for Ln was 66.0 dBA, and the standard deviation was 4.0 dBA.
As seen in Figure 3, the variability between locations was greater at night than during the day and evening periods, and 35% of the locations had a higher noise level during this period (both the maximum and the quartiles Q2 and Q3 were higher for the nighttime period).
With the goal of making the results easier for nonexperts to interpret, we reported them in the form of graphs, as seen in Figure 3, using a color gradient background similar to the one used in the Harmonica Project [47]. A horizontal dashed line shows the AQT that applies to each period. Each point in the graph is labeled with the result for that location. A line connects the points to make the presentation clearer, although each result is independent from the others and the connecting line has no real meaning. The idea behind this presentation is to give residents an overall way to see the results at a glance.
Additionally, we presented the results as a map, as shown in Figure 4, where the color labels are linked to the sound levels: Green means below the target and red means 10 dBA above the target. This type of presentation is similar to those used in many other noise-monitoring platforms [48,49,50].

3.2.2. Daily Acoustic Description

Noise levels in an area are not consistent from one day to another. It seems reasonable that—even in a quiet area—some days are especially noisy. However, when these noisy episodes become too frequent or too loud, the health and welfare of the residents in that area may be compromised. Moreover, using only long-term descriptors could mask these episodes in otherwise quiet areas. Therefore, it is necessary to identify noisy episodes on a daily basis.
To be in compliance with the daily AQT (D-AQT) regulations [46], the daily noise level (for any reference interval: Day, evening, or night) may exceed the targets by more than 3 dBA only in less than 3% of the days assessed.
The histograms of the daily indicators confirmed that the noise levels frequently exceed the targets. We presented this information for each location as cumulative bar graphs, such as those shown in Figure 5.
In Figure 5, a fully green bar means that the sound level remained below the AQT every day. When a yellow section is present, it means that some days tolerably exceeded the target (by up to 3 dBA and in up to 3% of the days assessed). The red sections signify that the D-AQT was not met, either because the noise levels were over the target by more than 3 dBA or because the tolerable exceedance occurred on more than 3% of the days assessed.
According to the described criteria, the D-AQT were met at none of the monitoring locations during the nighttime period, at only 6 monitoring sites during the daytime period, and at only 2 locations during the evening period. In addition, during the night period, 100% of the days did not meet the D-AQT criteria in 38 of the 40 locations, which shows the severe problem of night noise present in the measurement locations.

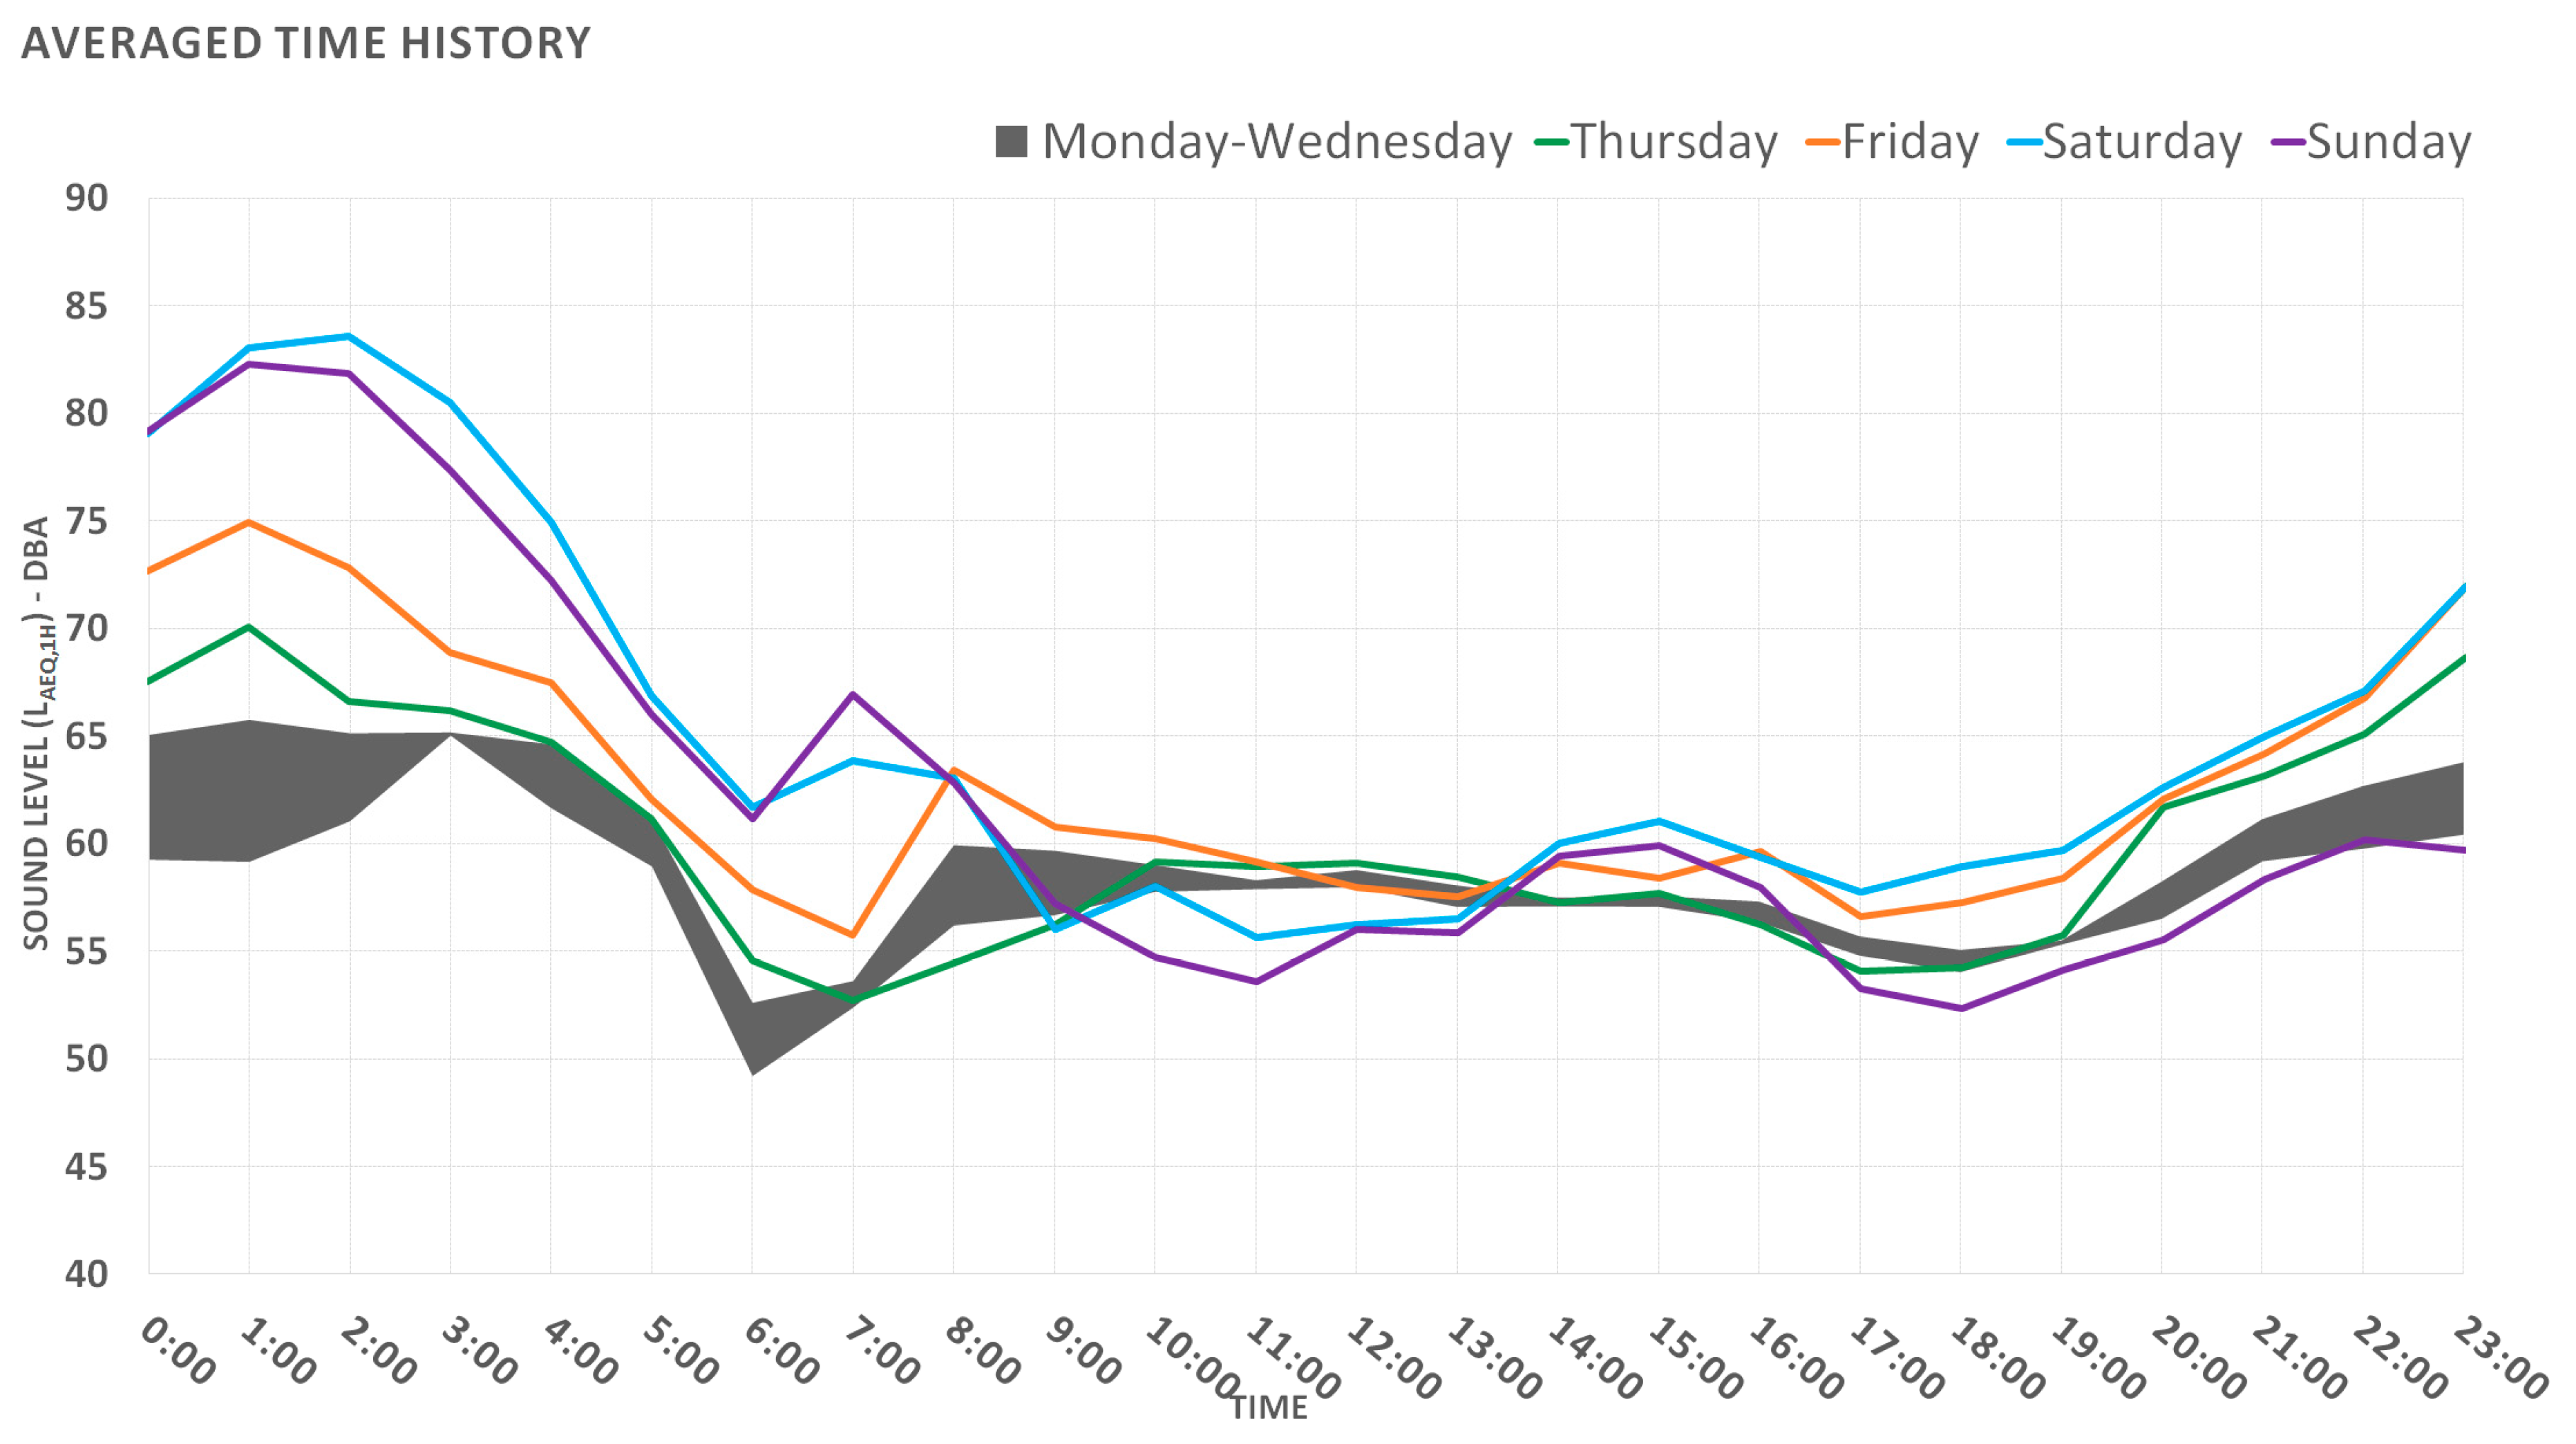
3.2.3. Weekly and Daily Noise Patterns

We processed the noise levels at one-hour intervals (LAeq,1h) from the collected measurements to obtain noise patterns over both a full day and a full week. The goal was to gather information related to the typical periods of activity, identify noisy days, and assess the duration of the quiet periods at night.
In general, the noise levels started to increase in the late hours on Thursdays and remained high during weekend evenings and nights. The maximum noise levels were observed during the evening and nighttime periods on Saturdays. The noise level (LAeq,1h) was quite high throughout the night in most of the locations. The noise level exceeded 70 dBA for several hours on weekend nights at 83% of the locations, 75 dBA at 15%, and 80 dBA at 10%. During weekdays, 88% of the locations had a quiet period (below 55 dBA) for 2–5 h, but this period decreased to 1–3 h during the weekends or even disappeared in 75% of the locations. An example of this hourly noise-level evolution can be seen in Figure 6 for one of the units in the city center, but all of them followed the same pattern with a time displacement of between 1 and 3 h.
These types of results can be very useful for both noise managers and authorities, allowing them to analyze data and extract conclusions, but they are not intended for communication to the public because they do not provide a proper description of the noise level at any given instant, and they cannot be compared easily with the AQT regulation levels. Therefore, we used simple line graphs in the public reports, with one line for each day of the week.

3.3. Discussion of the Measurement Results and Prediction Models

We collected a large number of measurements in this project and processed them to determine to what extent the models proposed by Ballesteros [26] may be valid for the wide range of leisure activities present in Málaga. These models try to describe the noise levels in an area using the number of leisure venues in it. The conclusions may be useful for future noise assessment not only in this city, but also in many other cities throughout southern Europe.
The independent variable in the basic Ballesteros model is the number of leisure venues (N) within a distance of 40 m—within a 20 m radius from the monitor in our case. An optimized version of this model splits the independent variable by considering the type of leisure venue (B for bars, P for pubs, D for discotheques, and R for restaurants). A third model adds the width (W) of the street and the mean height (H) of the surrounding buildings. There is also a fourth model that considers the number of people present, but we were unable to accurately determine a value for this variable in the monitoring areas; therefore, only the first three models were tested.
The three models proposed by Ballesteros describe the equivalent sound pressure levels spatially averaged over a “soundwalk” with a length of 40 m (LAeq,40m) measured by a microphone at a 1.5 m height. Our monitors were placed higher and in fixed locations, and they recorded the variability in noise levels at each area all day long. In an attempt to find a value that could be compared to the soundwalk (LAeq,40m), we decided to use the mean LAeq,1h of the measurements made during the noisiest hour on Saturdays (Lsaturday; each Saturday night, we consider the maximum LAeq,1h and calculate the mean value for each location). Although these indicators are obviously not equivalent, we consider the comparison acceptable because the noise levels during this period are quite steady. Moreover, we assume that spatial averaging is not performed in the monitoring case.
As mentioned by Ballesteros, the behavior of noise is different in squares and wide avenues; therefore, we have excluded data recorded in both types of locations from the analysis. We also excluded some locations where the noise from nighttime leisure activities was not clearly dominant. Consequently, only 28 of the 40 locations were included in this analysis.
In general terms, we can conclude that the models proposed by Ballesteros fit the noise levels observed in the leisure streets of Málaga, as Table 2 shows. The noise measurements were, on average, about one decibel higher than the predictions, and the standard error values in this case were similar to those reported by the authors along with the measurements used to create the model. However, we must conclude that the results are quite uncertain because the coverage interval extends up to 14 dBA. Similar results could have been obtained in Málaga with a simple Gaussian model in which the number of leisure venues was not considered at all, but in this case, the model was created after a long economic and technical effort of monitoring. Therefore, these models could be useful depending on the goals intended to be achieved. For instance, they could be very useful in a planning stage, since no further information is available, and some assessment could be necessary to establish noise limits, land use, or restrictions to activities. By contrast, to prioritize an action plan to reduce noise levels, the results provided have a very large uncertainty, and a measurement-based assessment could be more reliable.
The main disadvantage of the previous models is that they do not consider the temporal patterns of noisy activity, nor do they predict indicators that can be compared to regulations (Ld, Le and Ln). We can create an unbiased Gaussian model for these long-term indicators (Table 3), but, although the mean error is 0 dB, the resulting coverage intervals are still similar to those presented in Table 1, and they can be too uncertain for any practical use.
We also analyzed the differences between the operating noise levels (Lsaturday) and the long-term Ln indicators. This correction factor is, on average, 5.1 dBA, but its variability is too high (standard error, 4.8 dBA); therefore, it is not sufficiently precise and cannot be used to infer long-term indicators from the Ballesteros models because the new variability contribution must be added to that derived from the initial model.
In consequence, although the discussed models can be useful tools during the planning stages, the uncertainty derived from each model is quite high. This limits their application in prioritizing or action planning because those activities involve regulations, and such a large uncertainty factor could lead to incorrect decisions. Moreover, these models have some additional drawbacks:
  • The levels of noisy activities change throughout the evening and nighttime periods, but the variables in the models remain fixed. This is an issue that we cannot fix using a correction factor;
  • The models do not envisage the effect of the duration of noisy activities or their variability; therefore, it is not possible to estimate the reference indicators Ld, Le, and Ln (over either the short or long term);
  • The noise levels during a leisure period in a location can fluctuate by more than 6 dBA (LAeq,1h). This variability may be even higher when estimating the duration to calculate Ld, Le or Ln;
  • A simulation, even if accurate and precise, is difficult for residents to relate to, and using one would likely cause complaints. Instead, a web-accessible noise-monitoring system will comply much better with the engagement objectives.

3.4. Public Engagement
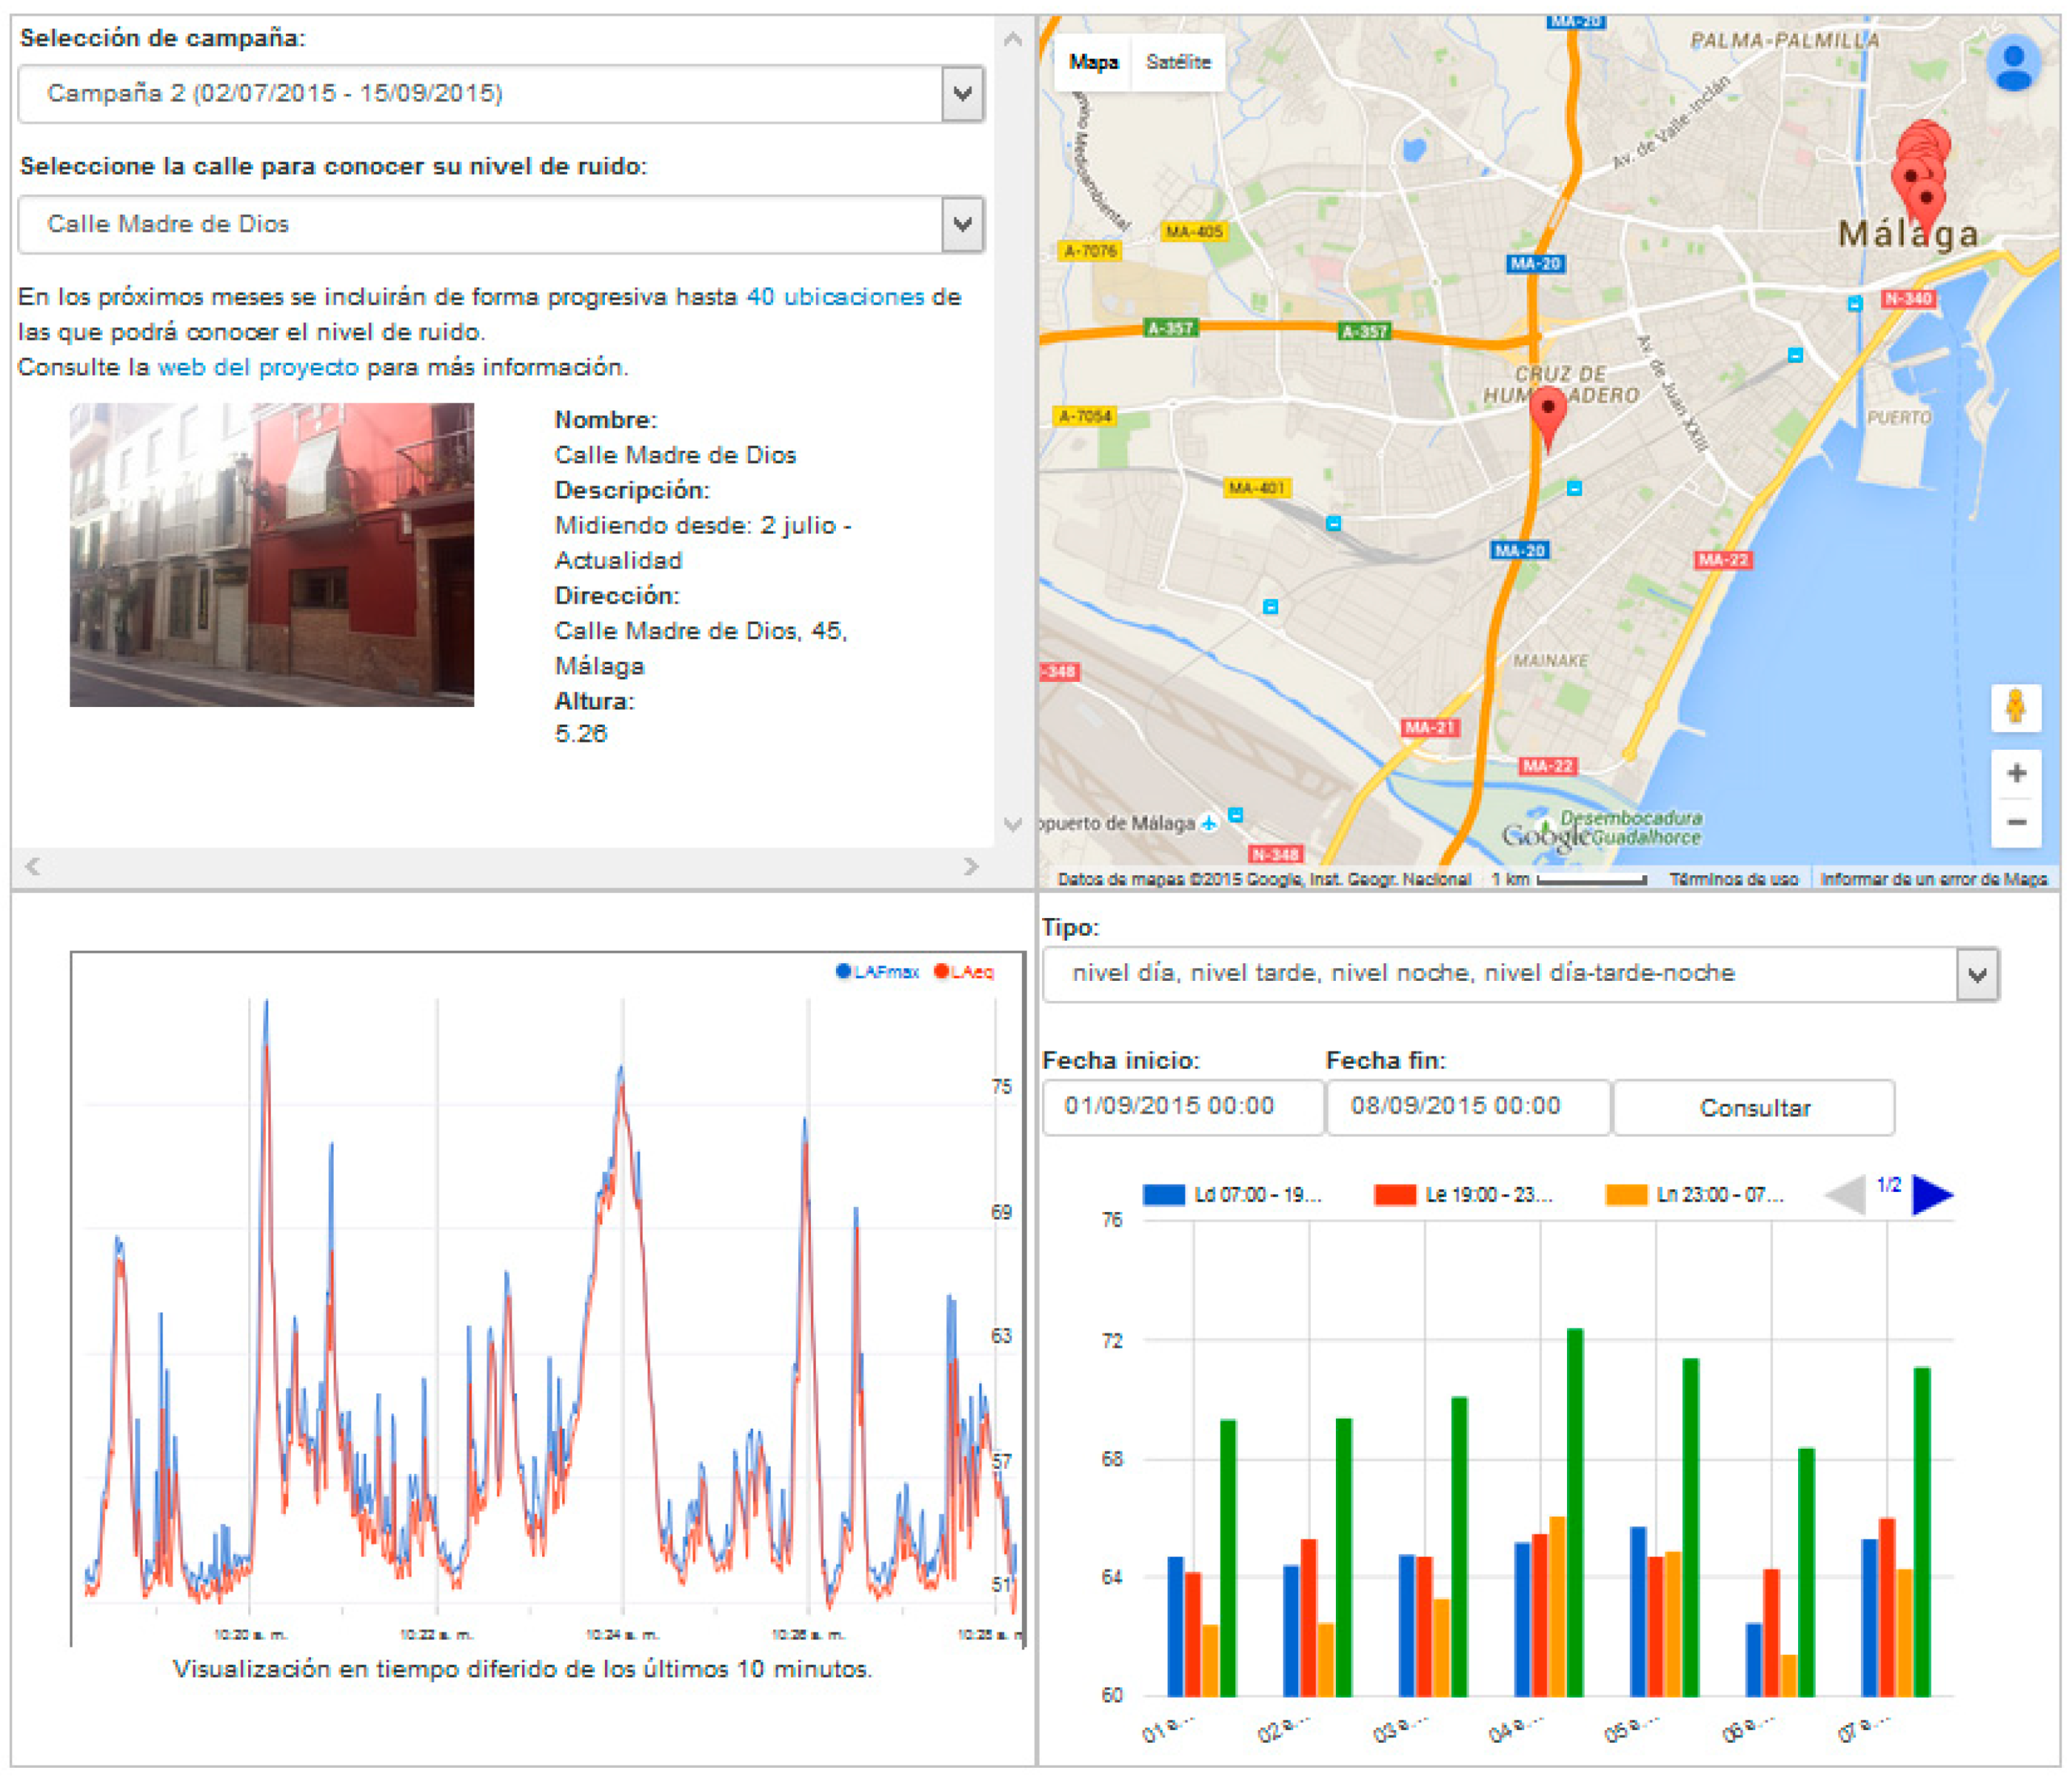
One of the objectives of this project was to engage citizens, both those who feel affected by noise pollution and those responsible for generating such high noise levels. To achieve this objective, with the deployment of the noise-monitoring network, we launched a website and some public activities, such as online surveys and polls.

3.4.1. Website

We developed a website where users were able to find the description of the project, its goals, and environmental noise concepts explained for the nontechnical public, such as “decibels” and “LAeqT”. Furthermore, we implemented a web form that visitors could use to report complaints or inform authorities about noisy events, providing some subjective information about the type of noise and their perceptions of the people involved. Because noise was known to be a complicated issue that created tensions between citizens and city managers in the past, we tried to show transparency about the processes followed during the project by creating a blog section where we explained each milestone of the project and the preliminary results.
From this website, it was possible to access the public measurement platform, where the following information was available:
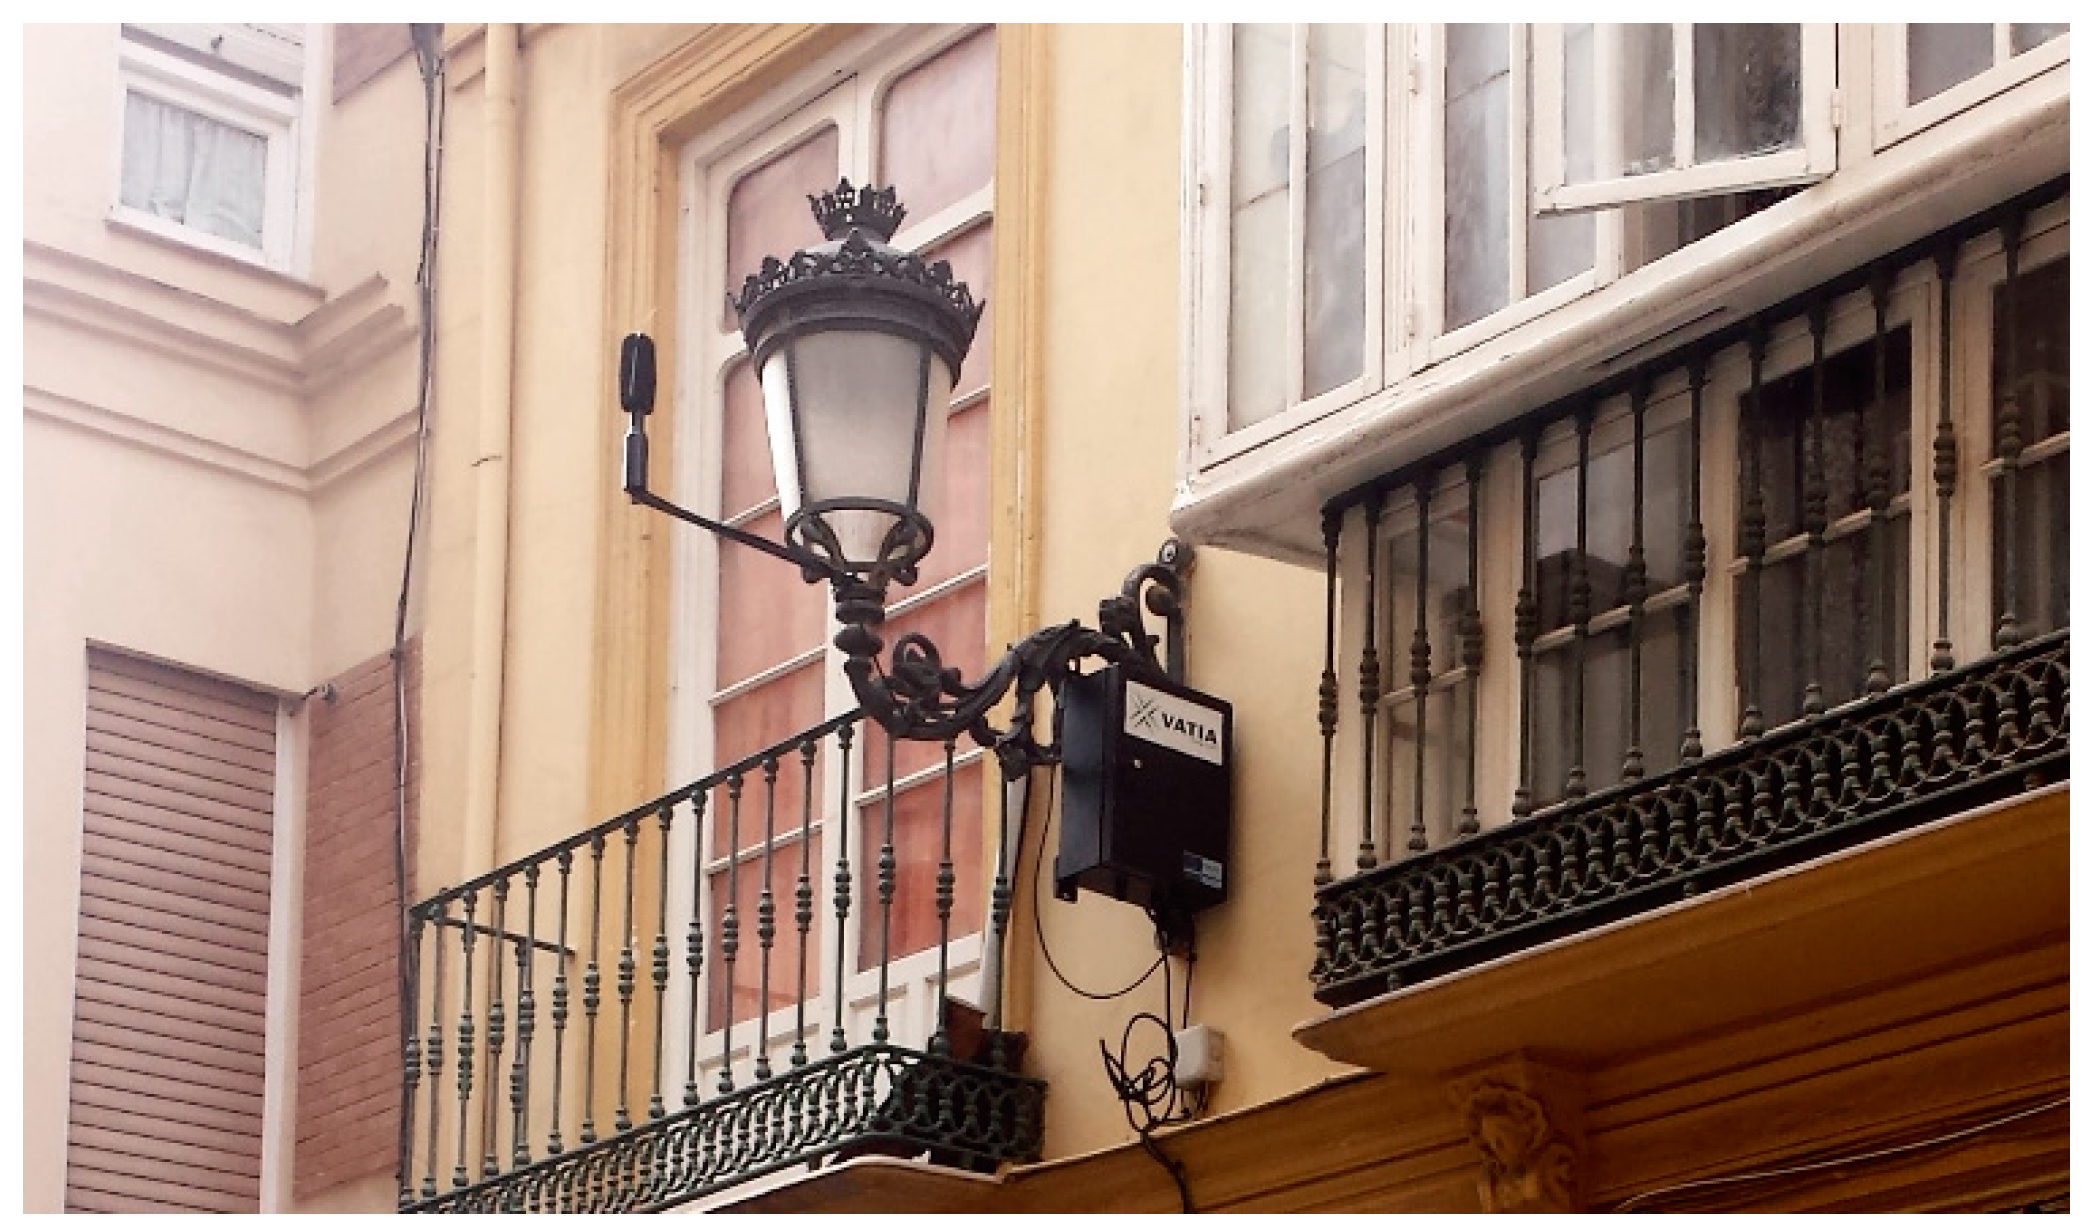
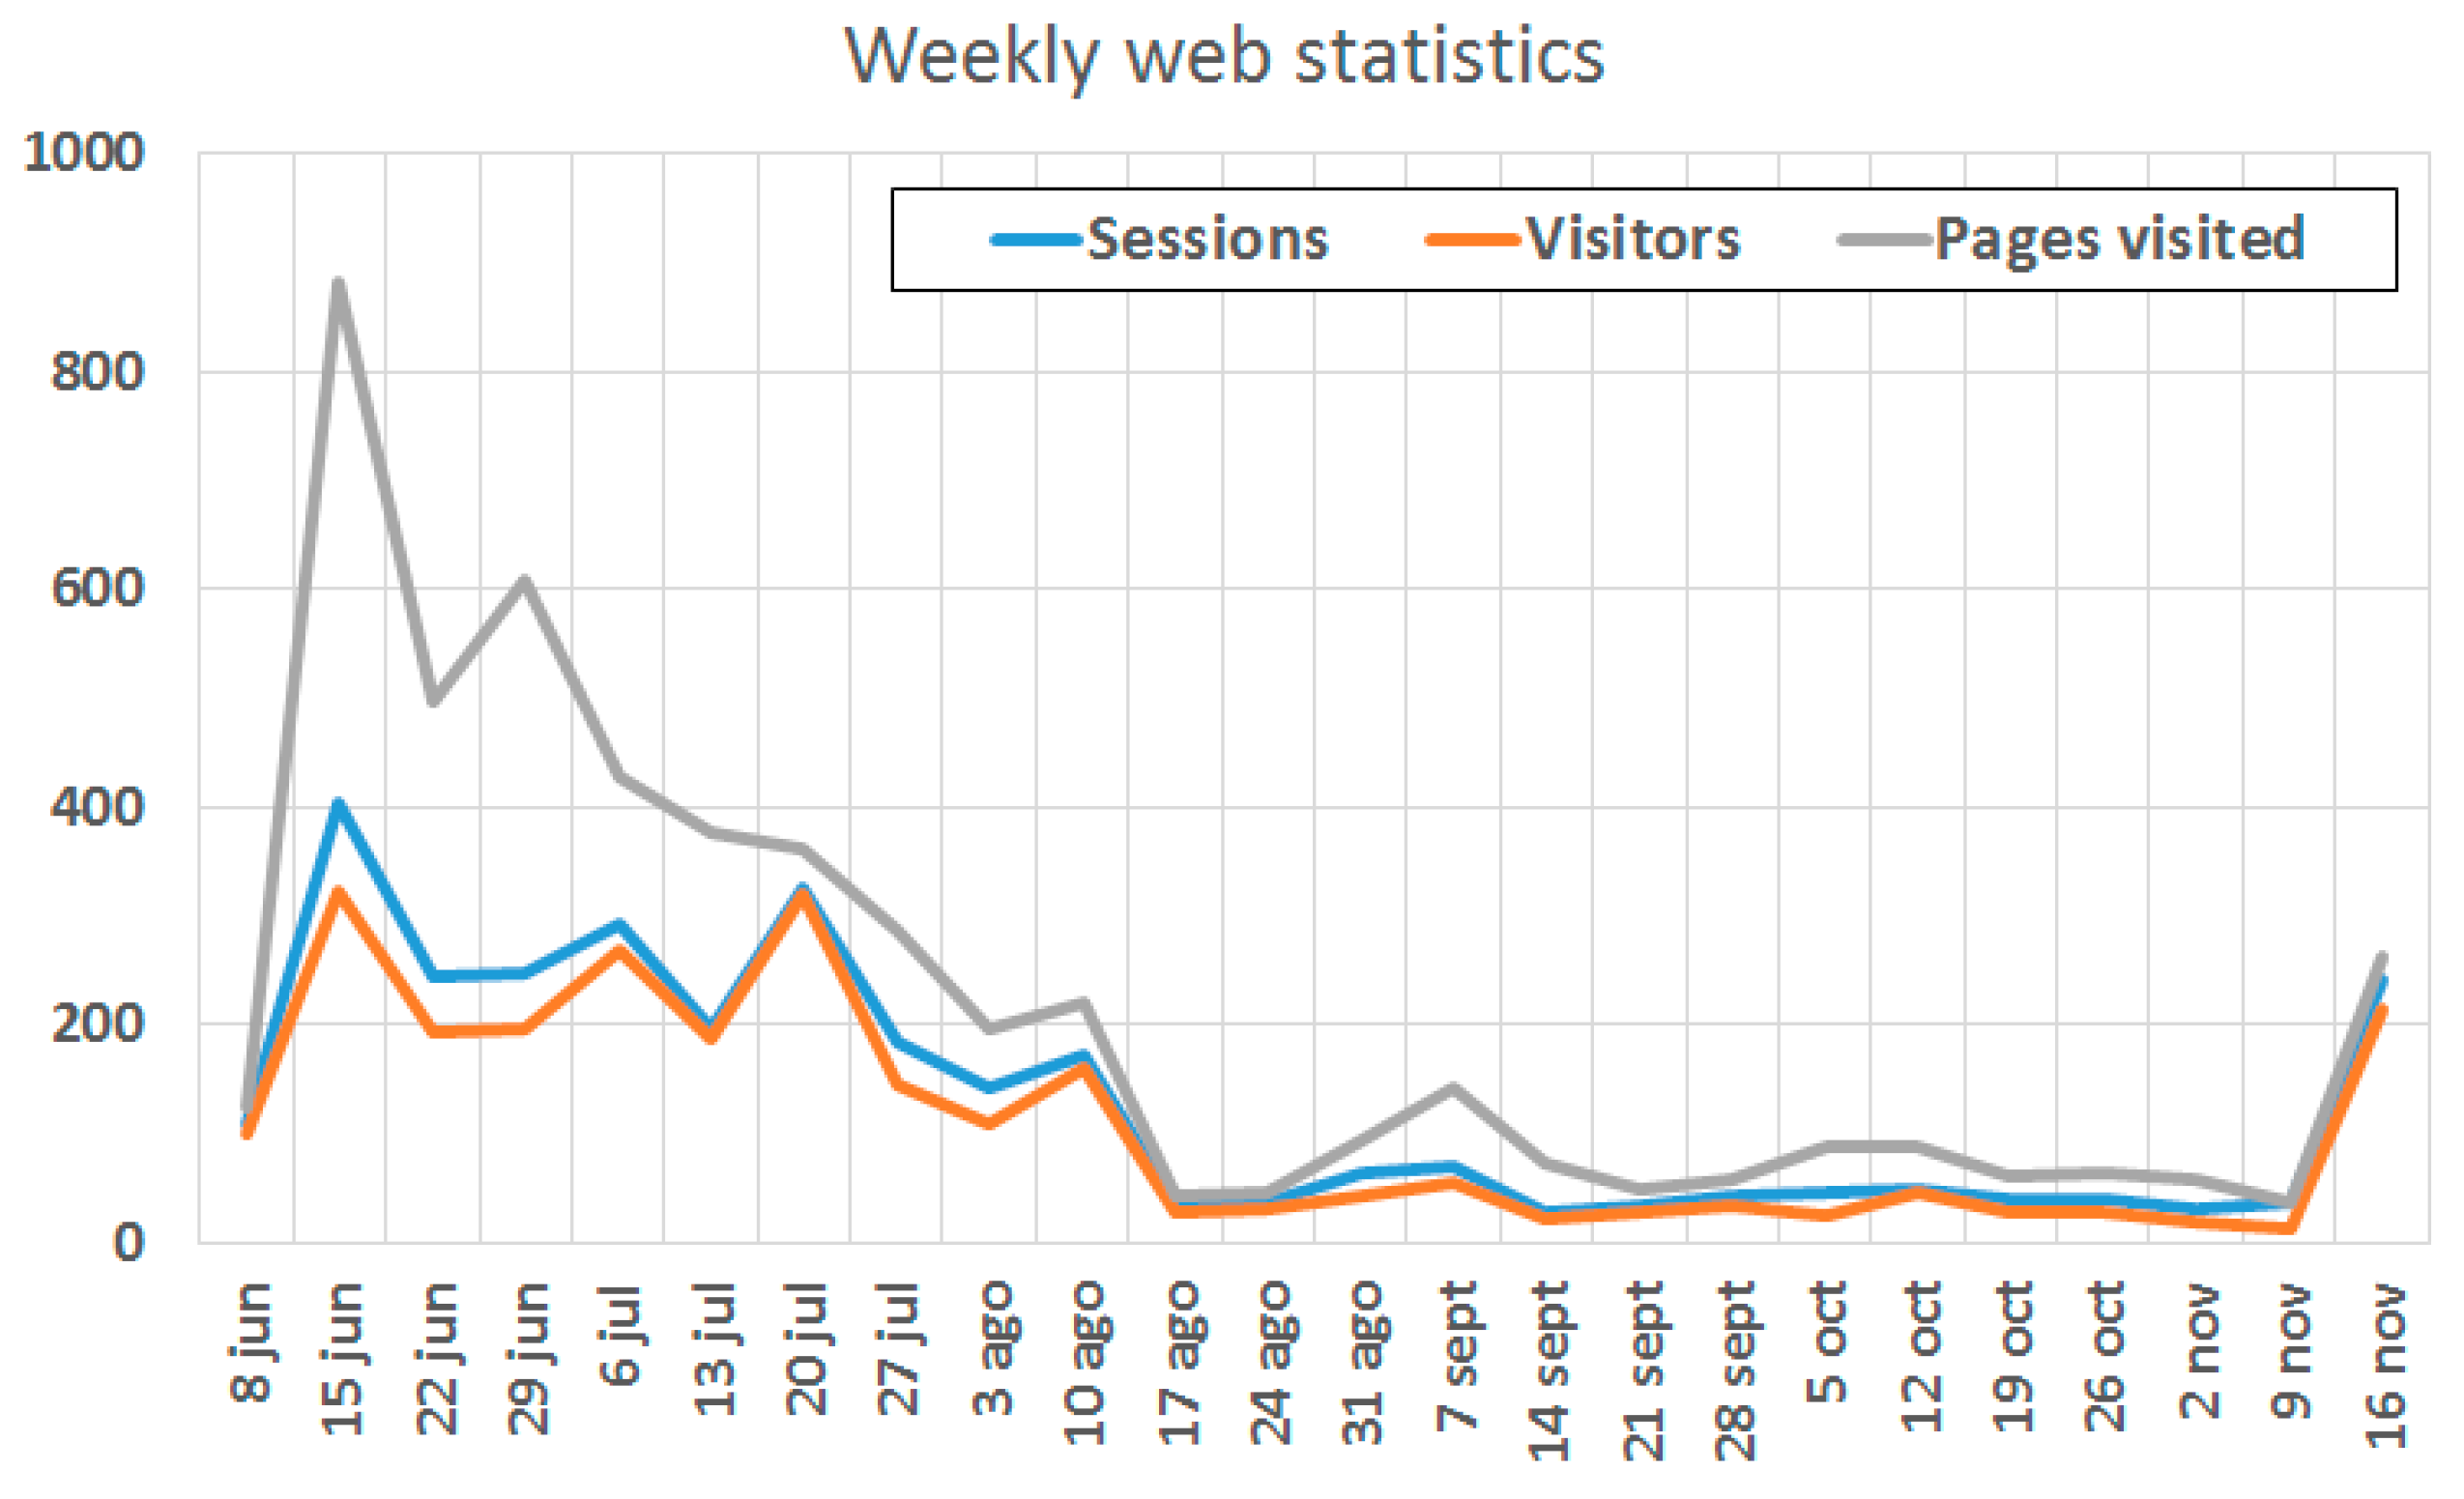
  • Real-time web access to the measurements. To better engage with visitors, the measurement data were published in a line chart and updated each second. Additionally, the page contained the geolocation of each noise monitor, information about the installation, and information about noise indicators for the daytime (Ld), evening (Le), nighttime (Ln), and day–evening–night (Lden) periods. The structure of the webpage can be seen in Figure 7;
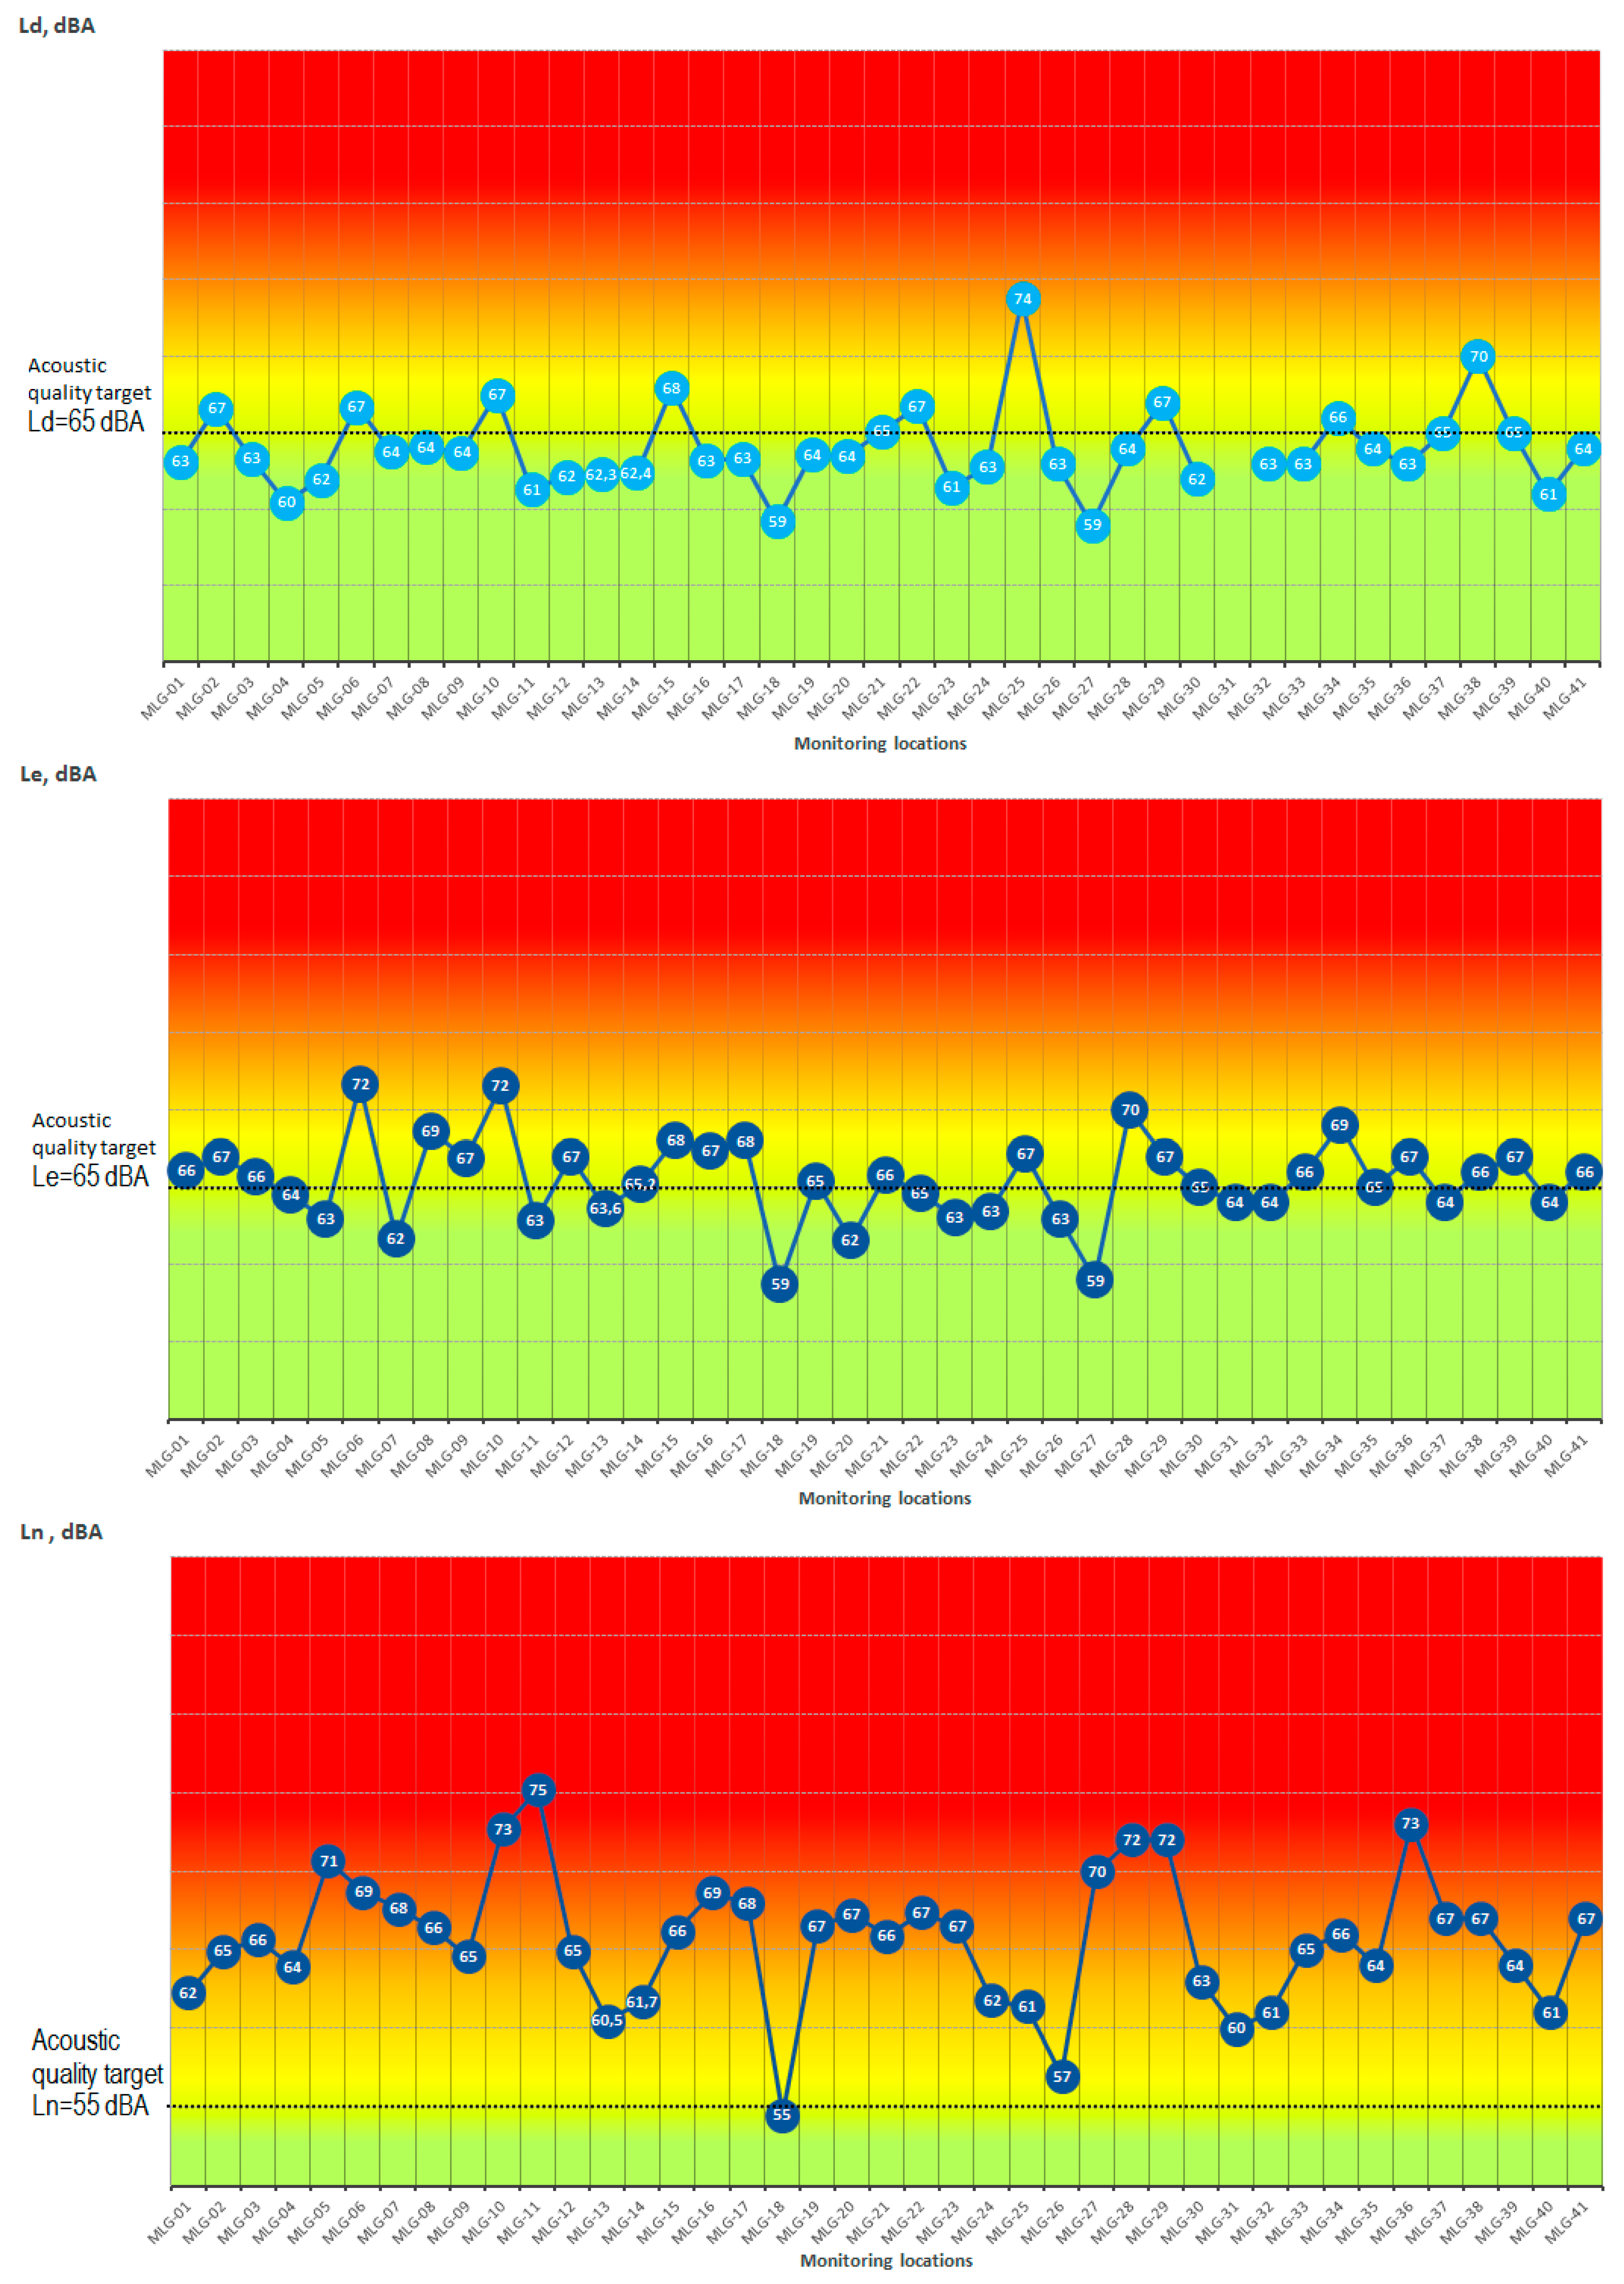
  • Noise indicators. The noise indicators for the daytime (Ld), evening (Le), and nighttime (Ln) periods appeared in reports generated in response to users’ queries and could be compared to regulation noise levels.

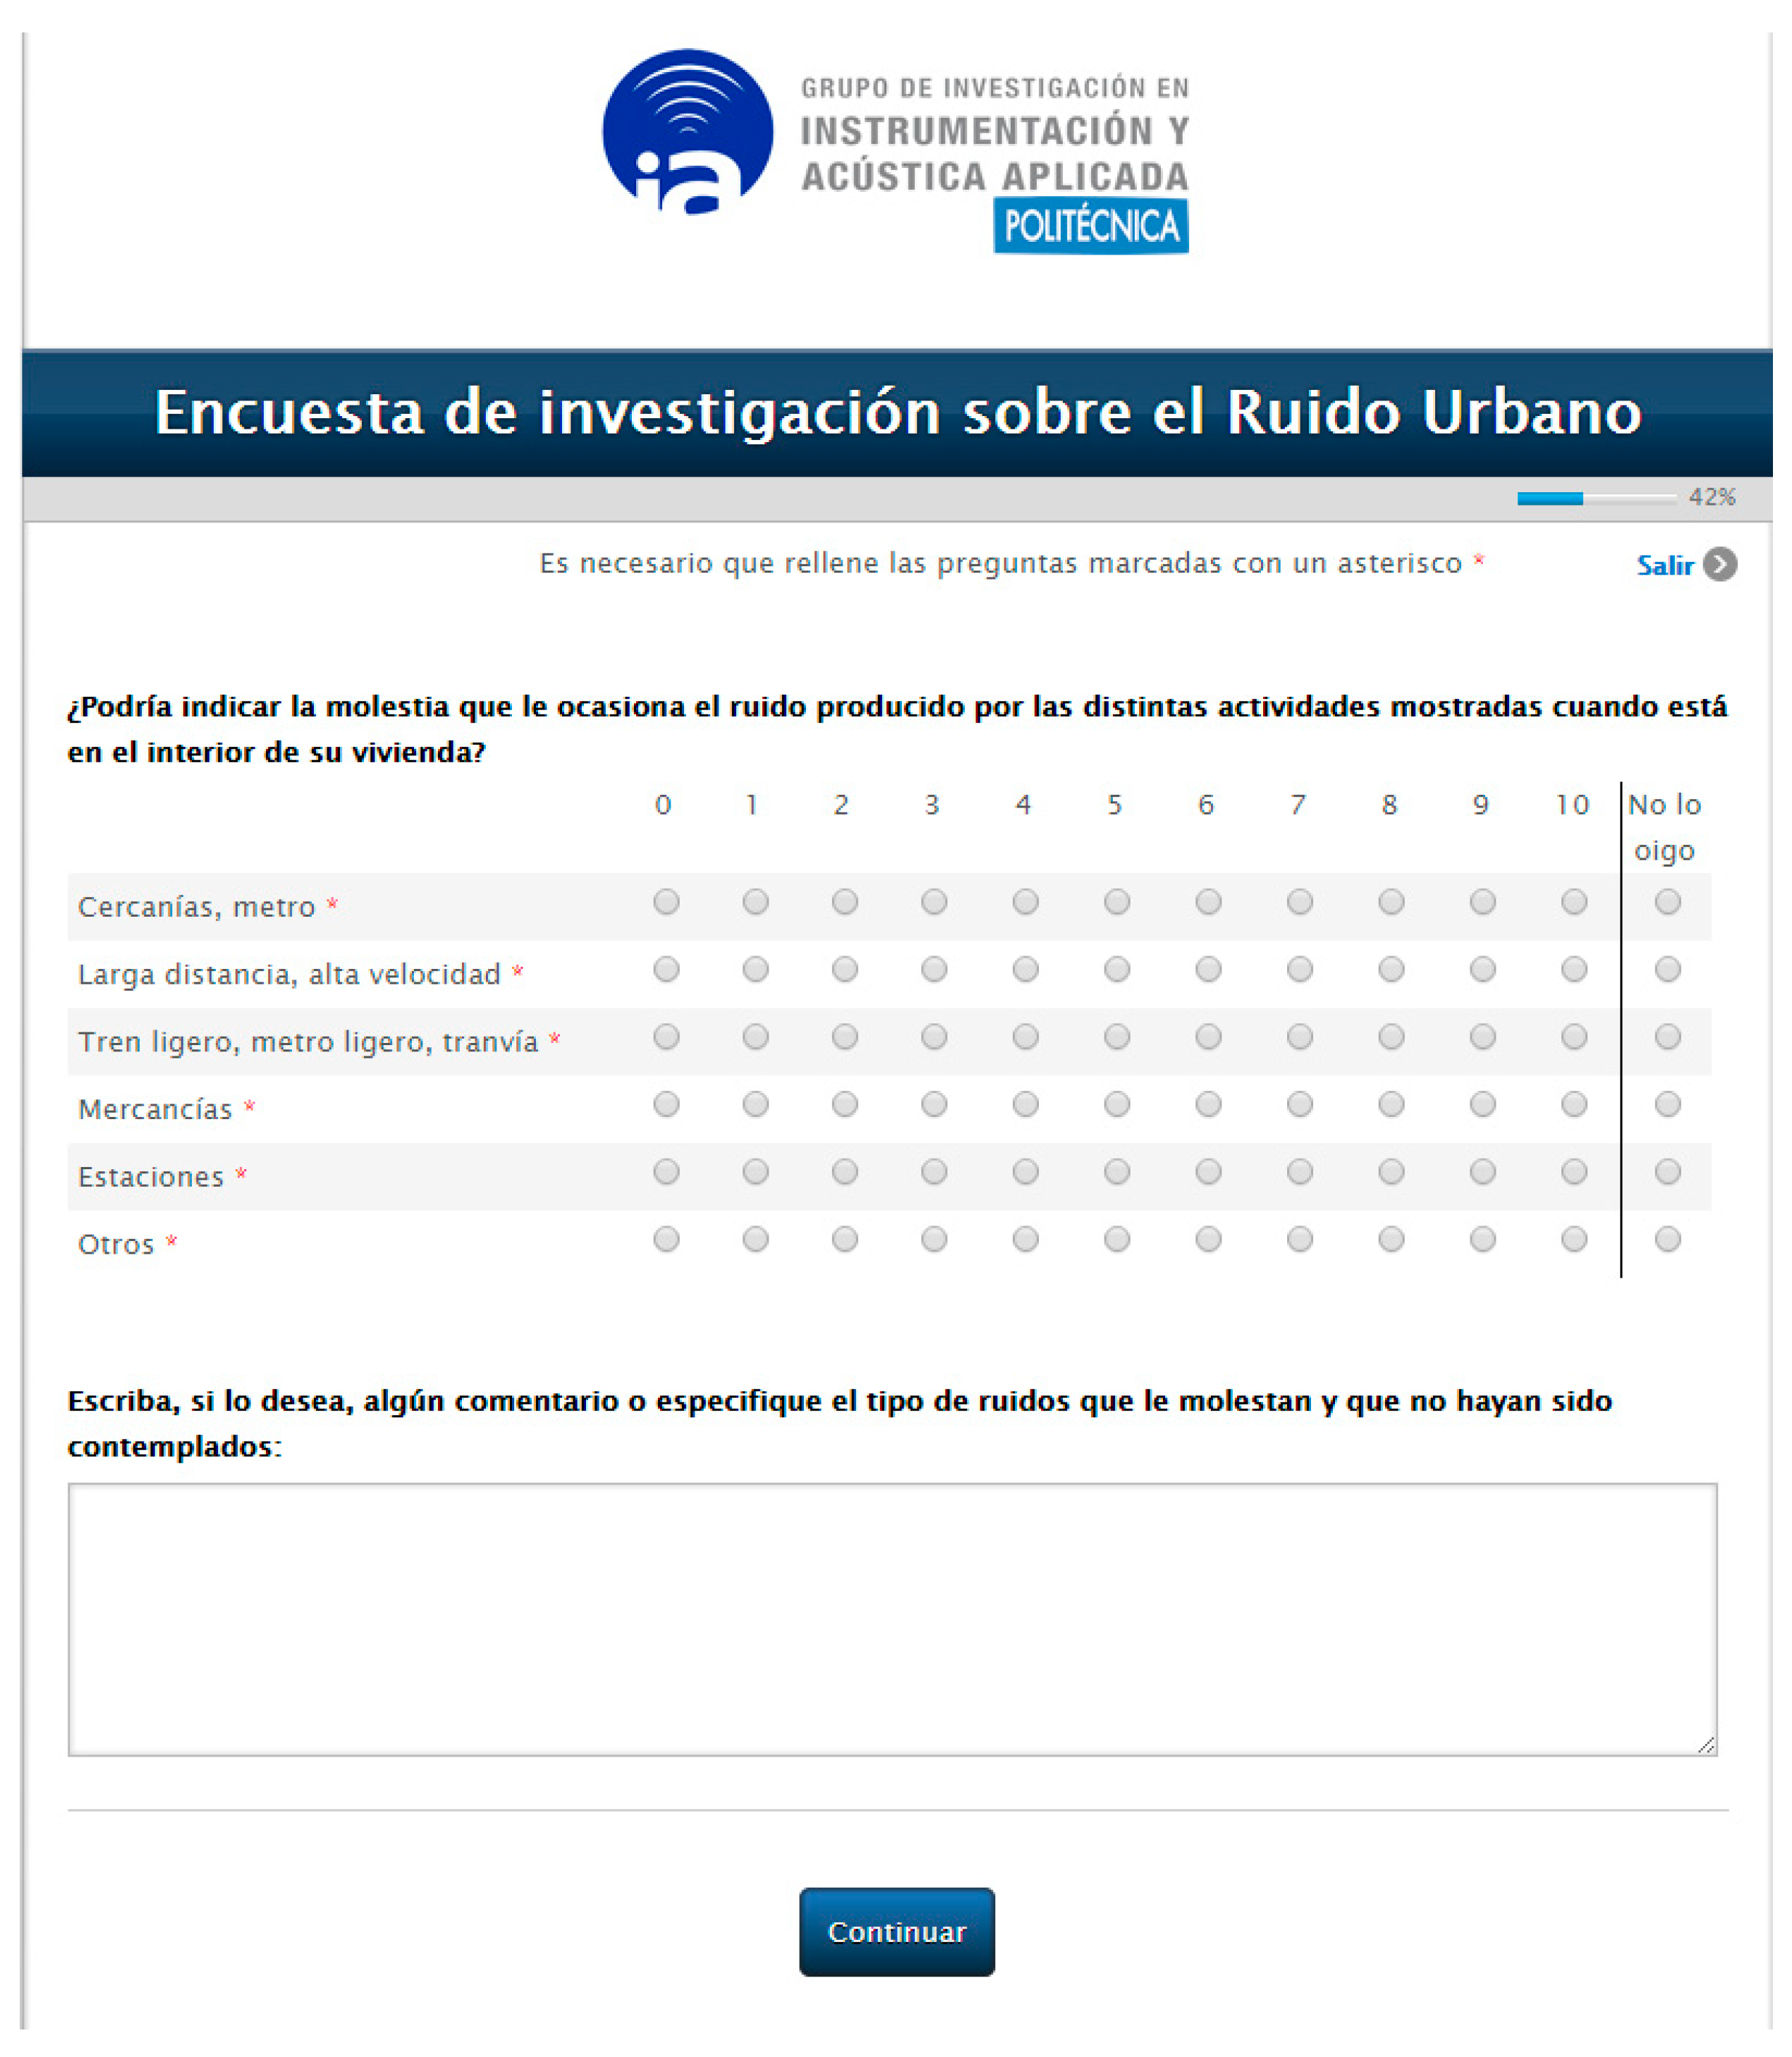
3.4.2. Online Survey and Polls

In parallel to the assessment of the noise levels in the areas, we implemented both polls and a web survey. We launched a weekly poll related to noise topics, trying to involve the citizens and get information from visitors about their experience with noise. We provided, as an example, some of these short questions:
  • Do you exhibit noisy behavior?
  • What time do you go to sleep on a workday?
  • Have you ever used earplugs to sleep?
Additionally, as mentioned above, we decided to use surveys, since it is the modality that best suits our need to measure the citizens’ engagement, as well as their noise perception. Although this research focuses on leisure noise, we decided to extend the scope of the survey to gain participation from citizens concerned about other noise sources, such as aircraft and road traffic. This is the same reason that led us to make the survey open not only to residents of the studied areas, but also to the whole city and the whole country.
After a compilation of the state of the art of previous noise surveys, we decided to design the questionnaire on the basis of the Noise Attitude Survey promoted by Defra in the United Kingdom [51] while also considering previous studies undertaken in other Spanish cities [52,53]. We translated the questionnaire into Spanish and adapted it to a web format; since Defra’s survey was carried out by interviewers, we made some simplifications to shorten it to increase participation. As opposed to Defra’s survey, which asked participants about all types of noise sources, the proposed questionnaire implemented different paths, depending on the noise source chosen by the participant as being most disturbing. With this decision, we tried to set the focus on leisure noise, while keeping the involvement of the rest of participants.
The logic in the questionnaire also defines a specific path for the participants from Málaga to detect which of the participants live in the studied area. Those participants have some specific questions regarding the monitoring system implemented in the city to obtain feedback and establish a link between the participants and the measurement results.
The survey questionnaire was assembled in QuestionPro [54], which is a multiplatform survey service that implements the required security protocols and includes many different question formats and logic. This tool allows the implementation of a powerful user interface, for instance, integrating in a single question the ratings of multiple instances. As an example, in Figure 8, we show the form used to rate the annoyance produced by different railway-related noise sources. Furthermore, this tool allowed us to prevent multiple participation from the same users, using cookies, and optimized the forms to participate through a PC, smartphone, or tablet, either using Windows, OSX, Android, or IOS.
The survey was open between the 1 July 2015 and 31 December 2015. With the support of the Málaga Council and Universidad Politécnica de Madrid communication departments, the survey made a major impact among the citizens of Málaga.
The questionnaire consisted of 4 sections:
  • Social and demographic data: Respondents were asked about their gender, age, and city. The participants from Málaga had to specify their district and neighborhood;
  • Participants’ dwelling: The participants were asked to provide some information about their dwelling, such as time of residence and the acoustic insulation of their house;
  • Participants’ relation with noise: This section described the participants’ perceptions of the noise in their neighborhood and the annoyance produced by different noise sources;
  • All noise sources in the neighborhood: The participants were asked to provide information about the effect of noise in their lives and the actions they have undertaken to mitigate noise;
  • Specific noise sources: The participants were asked to select the noise source (road, rail, air traffic, leisure, neighbors, etc.) that is most disturbing for them when they are at home. The questions in this section were focused on the specific noise source they selected, trying to identify the most disturbing activities and periods;
  • Noise-monitoring system: The participants from Málaga were asked to rate the noise-monitoring system installed in the city.

3.4.3. Result of the Engagement Activities

Survey Results

The survey was not limited to people from Málaga, but it was in Málaga where the study was dependent on the Council’s support and a wider diffusion through media outlets, as the survey was linked to the monitoring initiative. Therefore, almost one-fourth of the participants that initiated the survey were residents of Málaga (180/768 started), which represents an almost 40% increase over the previous survey undertaken by the city council in 2012. Nevertheless, this participation rate is quite poor in a city with over 500,000 inhabitants.
By contrast, over 80% of the participants finished the survey. This completion rate is quite high, given that this survey took more than 20 min for 50% of the participants to complete. Of the participants from Málaga, 64% lived in the districts under study (Teatinos/Universidad and center), and we focused in this group for the analysis; hence, from this point forward, the results will refer to this group of people.
The survey comprised 60.2% male participants, and only 3.5% of the participants were not Spanish citizens. The survey was restricted to people over 18 years old, but we obtained no responses from the group under 20 years old, and just 3.5% of responses were aged 20–24, indicating that these groups of people are likely not very concerned about noise issues. We also observed poor participation (0.9%) in adults over 65, but in this case, the reason may be related to their limited use of internet technologies. In total, 77.4% of the participants declared themselves to be working (71.3% full-time employees, 6.1% part-time employees).
Similar to the results obtained in previous web noise surveys, for instance, those performed in Turin and Milan [22], the education level of the participants was above the average education level: Nearly 69% reported having higher education. This finding may be explained as a consequence of the digital divide caused by the online questionnaire, socioeconomic factors due to the locations of the areas under study, or the high participation of people concerned about noise and the relation between noise annoyance and other non-acoustic factors, such as education [8,55].
As expected, we observed that most of the participants were especially sensitive to noise. Most of them considered their neighborhood extremely noisy, and 54% felt extremely annoyed by the noise. We also confirmed that leisure activities were clearly the main cause of annoyance in the target areas, being the human activity that generates the most disturbing noise in the streets (people in terraces, crowds near bars and pubs, people smoking at the entrance of leisure and entertainment venues, and people arguing).
Almost two-thirds of the participants (63%) already knew about the noise-monitoring initiative commenced by the council, and half of them had already connected to the service. Only 6.7% were not interested in the noise-monitoring system.
Those who had already visited the noise-monitoring service were asked to indicate which goals the initiative meets, in their opinion. Most of them (73.3%) reported that the initiative could be useful to raise authorities’ awareness about the noise levels to which citizens are exposed, 43.3% considered it useful to inform the public about their noise exposure, and 33.3% considered that the system could be useful for complaining about noise. Only 16.7% considered that the initiative could be useful for raising awareness among the people or activities that generate noise. More detailed information about the main results of the survey can be found in Table 4.

Results of the other Engagement Activities

The launch of the project, including information concerning the noise-monitoring efforts and the survey, was announced in press and social media with the participation of the communication departments of the Málaga City Council and the Technical University of Madrid. The city council issued several press releases and held a press conference to communicate information about the project, because it marked the start of a strategic action to fight leisure noise in Málaga. We also organized the structured session “Noise, City, and Citizens” within the scope of the Spanish Congress of Environment (CONAMA LOCAL), held in Málaga, which included specific presentations on the project objectives and outcomes.
Despite the efforts expended on improving the visibility of this initiative, the objective to engage citizens was clearly not met. The number of visits to the website—a mere 5410—was not particularly high during the project, and we observed that this low impact became even more limited after two months, as seen in Figure 9. The bounce rate (people leaving the site quickly) was also very high (80%), which suggests that the web design was not sufficiently attractive or that the visitors were more curious than truly interested in the topic. We found no correlation between any of these statistics and noise levels, which confirms that the initiative did not reach the target demographic (residents exposed to leisure noise in Málaga).
Participation in the weekly polls (the maximum impact was reached in Poll 2, with 32 responses), the number of complaints reported through the web system (11), and the Twitter statistics (75 followers, 9270 impressions) did not meet our expectations: Noise pollution had been expected to be a hot topic in the city of Málaga.
Unlike the response from citizens, the project received considerable coverage in the press (primarily local and online publications). This coverage occurred around the main milestones of the project (11 news articles in the local press, 2 news articles in the regional press, and 4 news articles in the national press).

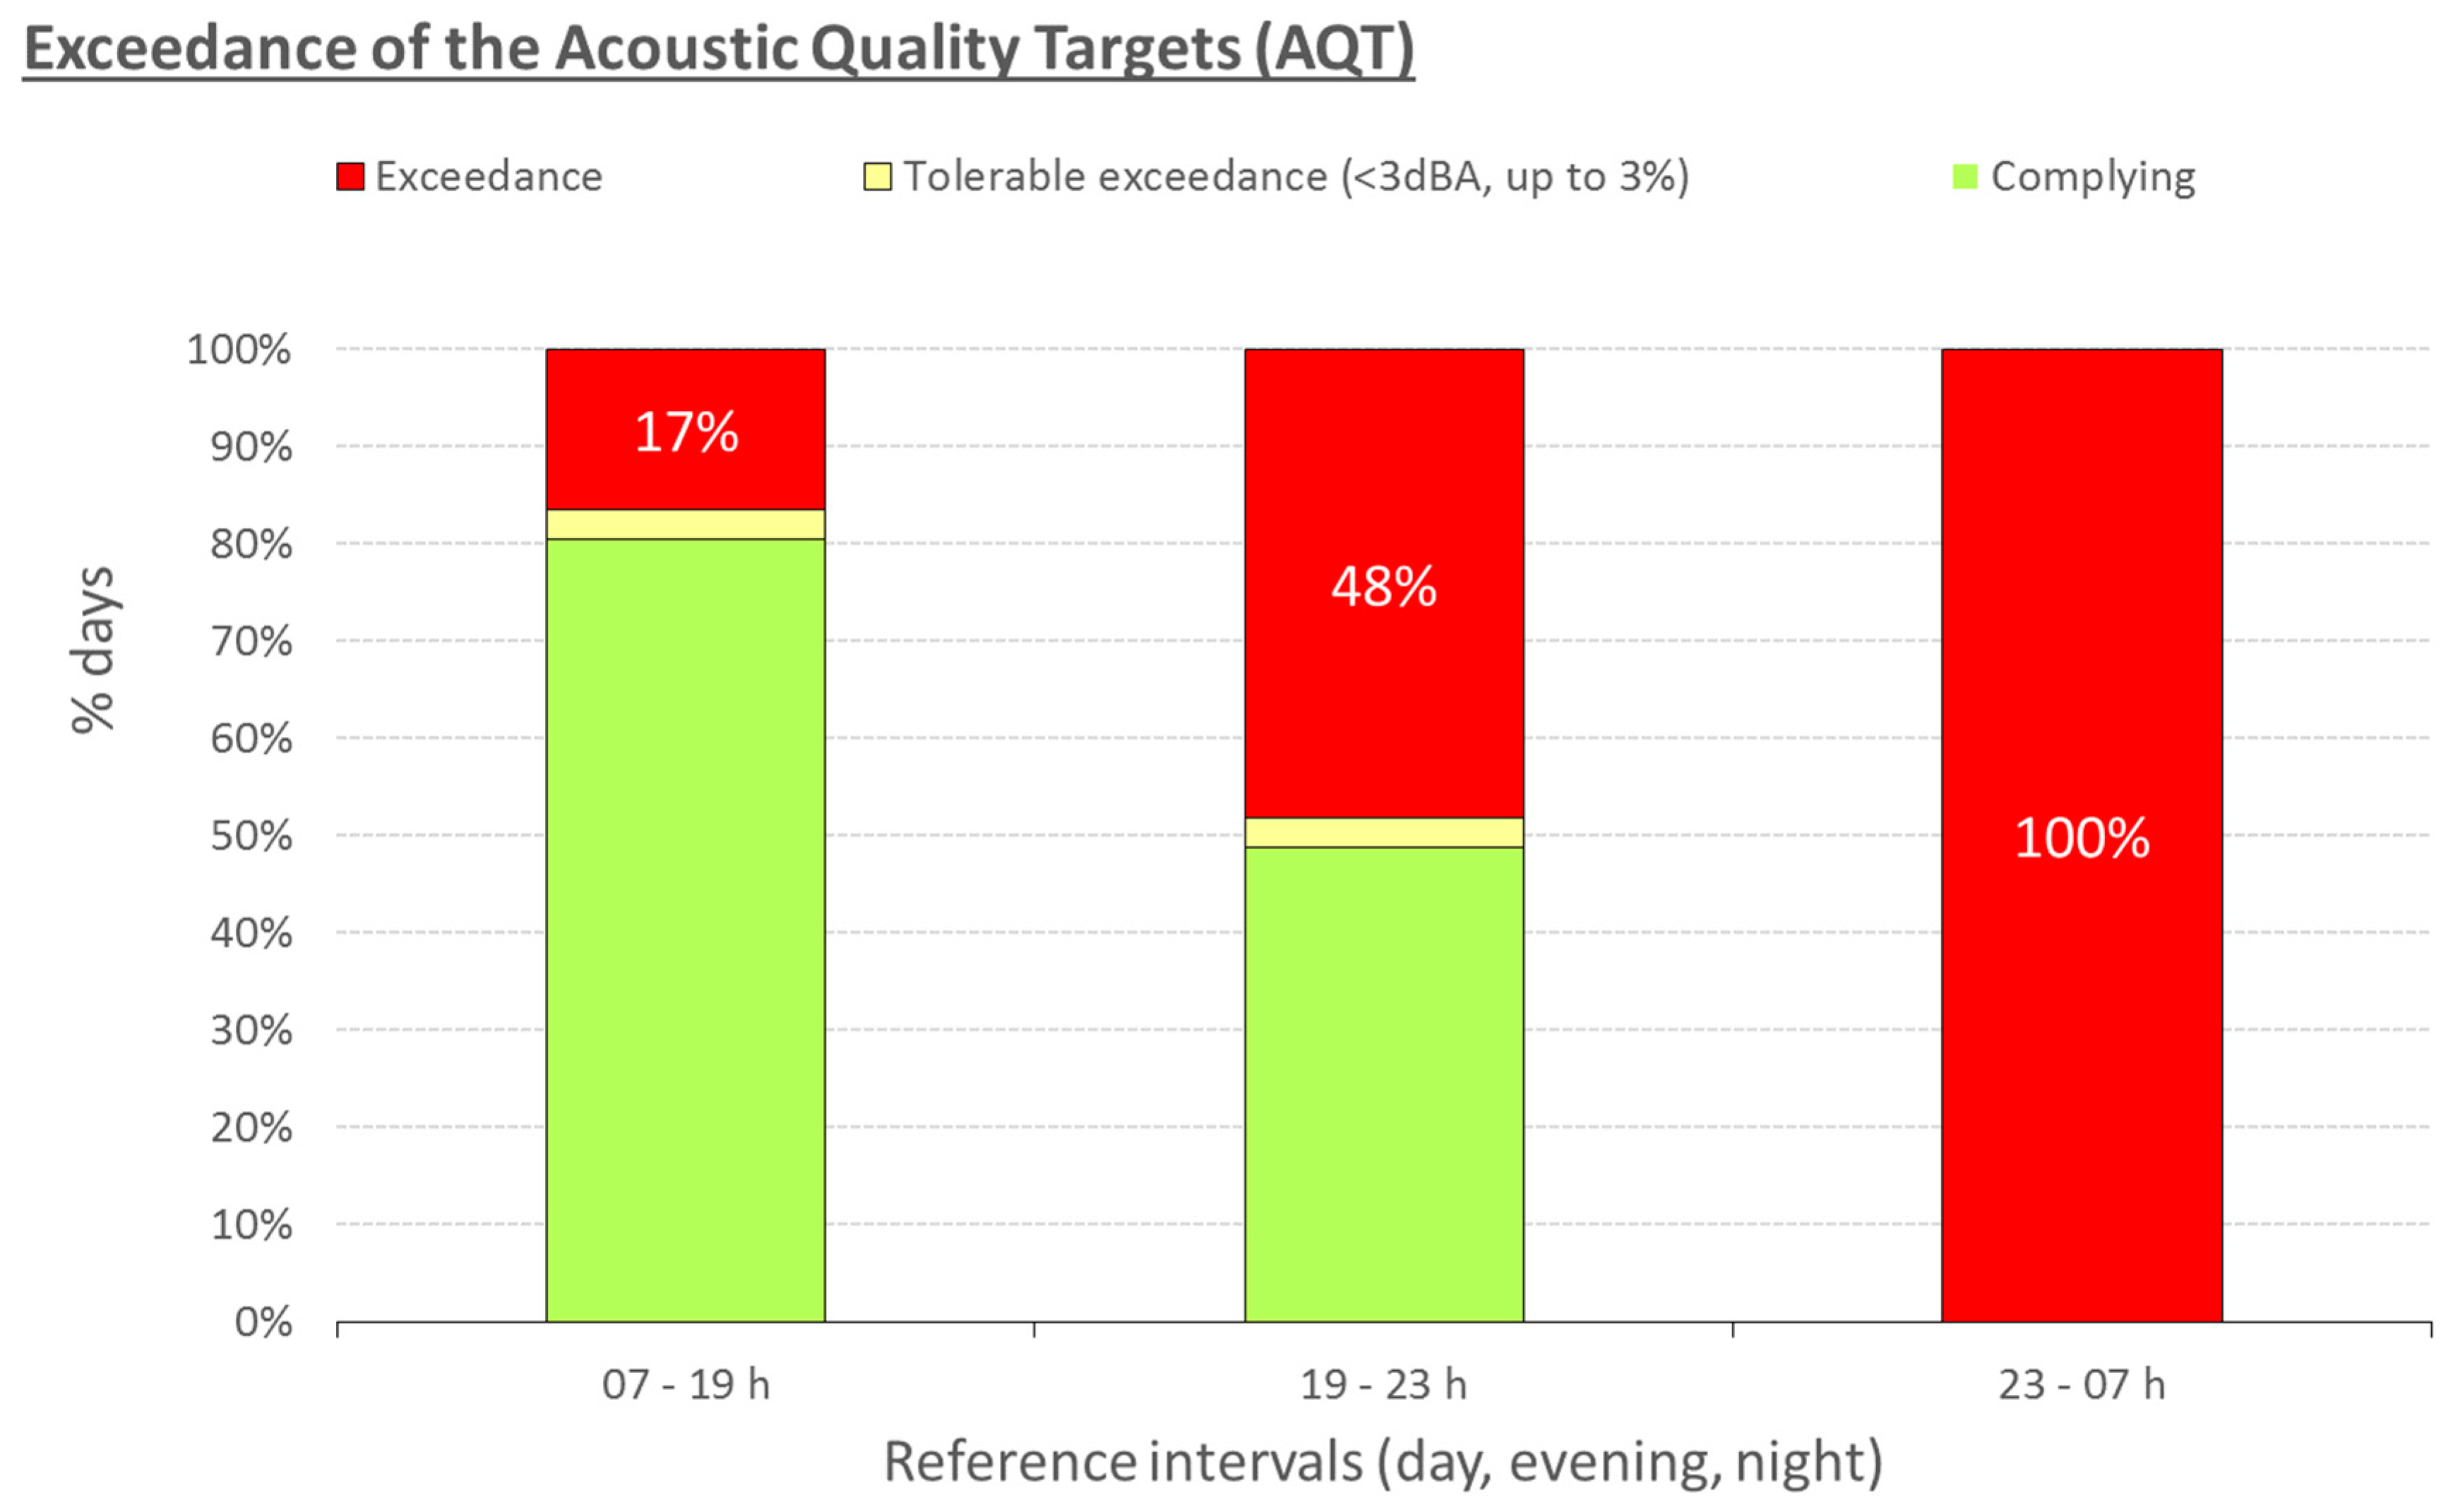
4. Noise Impact Assessment

After completing the project, a report was published along with the detailed results of the Analysis section. Clear acoustic shortcomings in the study areas, namely, that 95% of the locations showed night noise levels above the 55 dBA required in this period, that the daily AQT was not met during the night in 38 of the 40 locations on 100% of days, and that 88% of participants in the survey considered that noise was a problem in their life, provoked a reaction by the Málaga authorities. They were able to comprehend the magnitude of the noise problem; hence, they decided to address this situation as soon as possible, initiating a process to declare these zones highly acoustic polluted areas (HAPAs).
A project was implemented to carry out a study for this purpose. In the study undertaken by the Spanish company Sincosur, a description of noise sources was accomplished, detecting problematic sections of streets and performing specific noise measurements in these areas. Based on the measurement campaign results, the effects of noise were defined for each street, and two HAPAs were defined [56]. Each HAPA comprises those zones in which there is a high concentration of leisure activities and agglomerations of people, which match the areas with the highest number of noise complaints in a previous study carried out in 2014 [57]. In addition, for both HAPAs, a set of noise abatement actions was proposed, including the suspension of the concession of new restaurant licenses and the extension of existing ones; a ban on certain commercial activities on public roads; a requirement limiting nightclubs to nonresidential buildings in nonresidential areas; and the implementation of measures to encourage the population in the fight against noise. Additionally, a set of more specific actions was suggested for each subarea in each HAPA, focused on time restrictions on bars, pubs, and terraces. These specific actions should be implemented in phases, undertaking annual evaluations of the performance in terms of the noise reduction over a 5-year period.
After the HAPA study, the city’s political actors began to elaborate a new municipal regulation that would officially define these zones and the actions to reduce noise pollution there. These areas were finally approved at the local government council on February 2018, including the actions proposed by the previous study and the year-based performance analysis over 5 years [58]. This shows the effectiveness of the noise-monitoring network implemented 3 years earlier that has been shown in this paper.

5. Conclusions

This monitoring exercise allowed in-depth assessments of leisure noise levels in the target areas. We observed that the noise levels were well over the target values during the nighttime period. Leisure noise is mainly related to the accumulation of people on the streets and to the activity of the terraces of bars and pubs. Some specific events, such as “Feria de Málaga” (Málaga Fair), increased the activity and noise pollution during a limited period of time, and they have an impact over the long term. However, even in the absence of these events, the noise levels would have remained above the acoustic targets in the evening and nighttime periods in most of the locations, because leisure activities are not sporadic. The noisy activity increased substantially, by more than 5 dB, during the weekends in 78% of the locations, mainly from the late evening (4–7 p.m.) until the late hours of the nighttime period (3–6 a.m.).
We confirmed that the leisure noise models proposed by Ballesteros will work in Málaga but found that their accuracy have some drawbacks related to their precision. The noise levels at approximately 20% of the locations would have been overestimated or underestimated by 5 to 7.5 dBA. Therefore, these models could be useful in a planning stage, where measurement is not an option, but they are not sufficiently precise to be the basis of an action plan.
We planned and executed a significant number of participation and communication actions, but we did not achieve the goal to engage participants. Despite obtaining better participation rates than previous noise attitude surveys undertaken in the city, the number of respondents in our survey was quite low, with most participants being highly affected by noise. In addition, many of them belonged to neighborhood associations that actively combat noise in the areas of study, which could have biased the results of the survey. We can confirm that a percentage of the population is highly annoyed by noise, but the participation rate was insufficient to determine the true percentage of people disturbed in the study areas.
On the other hand, participation rates in the rest of the planned activities (including polls, the website, and the monitoring system reports) were also quite low. It is important to bear in mind that all the activities were web-based. Perhaps they should have been supplemented with other actions in the field, closer to the citizens, such as information points on the streets, which might have improved the residents’ interest. However, owing to the monitoring campaign and its communication actions, authorities were engaged with the project and were able to verify the major noise problem in Málaga, which led to the implementation of more specific projects that concluded with the definition of new highly acoustic polluted areas.

Author Contributions

Data curation, L.G.; Funding acquisition, G.d.A.; Investigation, C.A. and L.G.; Methodology, C.A.; Project administration, C.A., G.d.A. and J.M.L.; Resources, J.M.L. and J.A.; Software, J.A.; Supervision, C.A. and G.d.A.; Writing—original draft, C.A.; Writing—review & editing, L.G.

Acknowledgments

The authors are grateful to the Málaga City Council for their support during this investigation.

Conflicts of Interest

The authors declare no conflict of interest.

References

  1. World Health Organization. Guidelines for Community Noise; World Health Organization: Geneva, Switzerland, 1999; ISBN 9789971887704. [Google Scholar]
  2. Passchier-Vermeer, W. Noise and Health; Health Council of the Netherlands: The Hague, The Netherlands, 1993; ISBN 90-5549-025-3. [Google Scholar]
  3. Passchier-Vermeer, W.; Passchier, W.F. Noise Exposure and Public Health. Environ. Health Perspect. 2000, 108, 123–131. [Google Scholar] [CrossRef] [PubMed]
  4. World Health Organization. Night Noise Guidelines for Europe; World Health Organization Europe: Copenhagen, Denmark, 2009; ISBN1 9789289041737. ISBN2 9289041730. [Google Scholar]
  5. Miedema, H.M.E.; Vos, H. Exposure-response relationships for transportation noise. J. Acoust. Soc. Am. 1998, 104, 3432–3445. [Google Scholar] [CrossRef] [PubMed]
  6. Paunovic, K.; Belojevic, G.; Jakovljevic, B. Noise annoyance is related to the presence of urban public transport. Sci. Total Environ. 2014, 481, 479–487. [Google Scholar] [CrossRef] [PubMed]
  7. Suau-Sanchez, P.; Pallares-Barbera, M.; Paül, V. Incorporating annoyance in airport environmental policy: Noise, societal response and community participation. J. Transp. Geogr. 2011, 19, 275–284. [Google Scholar] [CrossRef] [Green Version]
  8. Laszlo, H.E.; McRobie, E.S.; Stansfeld, S.A.; Hansell, A.L. Annoyance and other reaction measures to changes in noise exposure—A review. Sci. Total Environ. 2012, 435–436, 551–562. [Google Scholar] [CrossRef] [PubMed]
  9. European Parliament. Directive 2002/49/EC of the European Parliament and of the Council of 25 June 2002 Relating to the Assessment and Management of Environmental Noise; European Parliament: Brussels, Belgium, 2002. [Google Scholar]
  10. Gajardo, C.P.; Morillas, J.M.B.; Escobar, V.G.; Vílchez-Gómez, R.; Gozalo, G.R. Effects of singular noisy events on long-term environmental noise measurements. Pol. J. Environ. Stud. 2014, 23, 2007–2017. [Google Scholar]
  11. World Health Organization. Environmental Noise Guidelines for the European Region; World Health Organization Europe: Copenhagen, Denmark, 2018; ISBN 9789289053563. [Google Scholar]
  12. Tung, C.-Y.; Chao, K.-P. Effect of recreational noise exposure on hearing impairment among teenage students. Res. Dev. Disabil. 2013, 34, 126–132. [Google Scholar] [CrossRef]
  13. Serra, M.R.; Biassoni, E.C.; Skarp, A.H.O.; Serra, M.; Joekes, S. Sound immission during leisure activities and auditory behaviour. Appl. Acoust. 2007, 68, 403–420. [Google Scholar] [CrossRef]
  14. Axelsson, A. Leisure noise exposure in adolescents and young adults. J. Sound Vib. 1991, 151, 447–453. [Google Scholar] [CrossRef]
  15. Butterfield, D. Research Report RR517–Measurement of Noise Levels that Staff are Exposed to at Live Music Events; Health and Safety Executive: London, UK, 2006. [Google Scholar]
  16. Peters, R. The role of hearing protectors in leisure noise. Noise Heal. 2003, 5, 47–55. [Google Scholar]
  17. Dalton, D.S.; Cruickshanks, K.J.; Wiley, T.L.; Klein, B.E.K.; Klein, R.; Tweed, T.S. Association of Leisure-Time Noise Exposure and Hearing Loss. Audiol. J. Audit. Commun. 2001, 40, 1–9. [Google Scholar]
  18. Dehnert, K.; Raab, U.; Perez-Alvarez, C.; Steffens, T.; Bolte, G.; Fromme, H.; Twardella, D. Total leisure noise exposure and its association with hearing loss among adolescents. Int. J. Audiol. 2015, 54, 665–673. [Google Scholar] [CrossRef] [PubMed]
  19. Gilliver, M.; Beach, E.F.; Williams, W. Changing beliefs about leisure noise: Using health promotion models to investigate young people’s engagement with, and attitudes towards, hearing health. Int. J. Audiol. 2015, 54, 211–219. [Google Scholar] [CrossRef] [PubMed]
  20. Beach, E.F. Leisure Noise and Hearing. Semin. Hear. 2017, 38, 263–265. [Google Scholar] [CrossRef] [PubMed]
  21. Fiamini, F.; Luzzi, S. Monitoring and reducing noise related to Movida: Real cases and smart solutions. In Proceedings of the 22nd International Congress on Sound and Vibration 2015 (ICSV 22), Florence, Italy, 12–16 July 2015; pp. 1959–1965. [Google Scholar]
  22. Ottoz, E.; Rizzi, L.; Nastasi, F. Recreational noise in Turin and Milan: Impact and costs of movida for residents. In Proceedings of the 22nd International Congress on Sound and Vibration 2015 (ICSV 22), Florence, Italy, 12–16 July 2015. [Google Scholar]
  23. Ottoz, E.; Rizzi, L.; Nastasi, F. Recreational noise: Impact and costs of movida for disturbed residents in Italy. In Proceedings of the 45th International Congress and Exposition on Noise Control Engineering: Towards a Quieter Future (INTER-NOISE 2016), Hamburg, Germany, 21–24 August 2016; pp. 7284–7293. [Google Scholar]
  24. Ottoz, E.; Rizzi, L.; Nastasi, F. Recreational noise: Impact and costs for annoyed residents in Milan and Turin. Appl. Acoust. 2018, 133, 173–181. [Google Scholar] [CrossRef]
  25. Vinci, B.; Tonacci, A.; Caudai, C.; De Rosa, P.; Nencini, L.; Pratali, L. The SENSEable Pisa Project: Citizen-Participation in Monitoring Acoustic Climate of Mediterranean City Centers. Clean Soil Air Water 2017, 45. [Google Scholar] [CrossRef]
  26. Ballesteros, M.J.; Fernández, M.D.; Flindell, I.; Torija, A.J.; Ballesteros, J.A. Estimating leisure noise in Spanish cities. Appl. Acoust. 2014, 86, 17–24. [Google Scholar] [CrossRef]
  27. Ballesteros, M.J. Análisis del Ruido de Ocio, Propuesta de Procedimientos y Herramientas de Gestión. Ph.D. Thesis, Universidad Politécnica de Madrid, Madrid, Spain, 24 November 2014. [Google Scholar]
  28. Ballesteros, M.J.; Fernández, M.D.; Ballesteros, J.A. Acoustic evaluation of leisure events in two mediterranean cities. Appl. Acoust. 2015, 89, 288–296. [Google Scholar] [CrossRef]
  29. Sound Solution Consultants. The Black Horse Festival Noise Impact Assessment; Sound Solution Consultants: Colchester, UK, 2010. [Google Scholar]
  30. Lakin, C.; Brown, S.; Williams, M. Noise monitoring at Glastonbury Festival. Noise Vib. Worldw. 2001, 32, 12–14. [Google Scholar] [CrossRef]
  31. Garg, N.; Sinha, A.K.; Gandhi, V.; Bhardwaj, R.M.; Akolkar, A.B. A pilot study on the establishment of national ambient noise monitoring network across the major cities of India. Appl. Acoust. 2016, 103, 20–29. [Google Scholar] [CrossRef]
  32. Defensor del Pueblo. Informe Anual 2015 y Debates en las Cortes Generales. 2015. Available online: https://www.defensordelpueblo.es/wp-content/uploads/2016/02/Informe2015.pdf (accessed on 27 November 2018).
  33. Fernández, E. Percepción del Ruido por los Ciudadanos de Málaga. 3a Encuesta. 2012. Available online: http://controlderuido.malaga.eu/opencms/export/sites/ctrlruido/.content/documentos/documentos-general/Memoria-Tecnica-final-Dic2008.pdf (accessed on 27 November 2018).
  34. Sincosur. Documento Información Pública—Servicio de Consultoría y Asistencia Técnica Relativa a la Revisión y Actulización de los Planes de Acción Contra el Ruido en Málaga. 2015. Available online: http://sicaweb.cedex.es/docs/planes/Fase2/Aglomeraciones/PAR_MALAGA.pdf (accessed on 27 November 2018).
  35. Ayuntamiento de Málaga. Observatorio Turístico de la Ciudad de Málaga 2009. 2009. Available online: http://s3.malagaturismo.com/files/96/96/observatorio2009.pdf (accessed on 27 November 2018).
  36. Ayuntamiento de Málaga. Observatorio Turístico de la Ciudad de Málaga Noviembre 2014–Octubre 2015. 2015. Available online: http://s3.malagaturismo.com/files/327/327/noviembre2014-octubre2015.pdf (accessed on 27 November 2018).
  37. DonDeNegocios Geomarketing. Comercio y Hostelería en el Centro de Málaga 2001–2017. 2017. Available online: https://www.dondenegocios.com/single-post/Mapa-Comercio-Hosteleria-Centro-Malaga-2001-2017 (accessed on 27 November 2018).
  38. Ayuntamiento de Málaga. Mapa de Trabajo Social de Málaga 2012. Volumen 1. Distrito Málaga Centro. 2012. Available online: http://www.malaga.eu/recursos/sociales/observatorio/descargas/mapa_trabajo_social/distrito1.pdf (accessed on 27 November 2018).
  39. Gutiérrez, A. El centro histórico de Málaga: Perspectiva de su recuperación. VIVA LA CALLE las actuaciones de revitalización del centro histórico de Málaga desde 1994 a 2005. 2005. Available online: http://www.programaseuropeos-malaga.com/subidas/archivos/arc_2094.pdf (accessed on 27 November 2018).
  40. Ayuntamiento de Málaga. Análisis de la Población en el Ámbito del PEPRI Centro. 2010. Available online: http://www.programaseuropeos-malaga.com/subidas/archivos/arc_2322.pdf (accessed on 27 November 2018).
  41. Marín, P. El Proceso de Urbanicación de la Ciudad, Compactar la Dispersión Urbana. 2015. Available online: http://www.omau-malaga.com/agenda21/subidas/archivos/arc_99.pdf (accessed on 27 November 2018).
  42. Ayuntamiento de Málaga. Mapa de Trabajo Social de Málaga 2012. Volumen 11. Distrito Teatinos-Universidad. 2012. Available online: http://observatoriosocial.malaga.eu/opencms/export/sites/observasocial/.galeria-descargas/Mapa-trabajo-social/volumen11/DISTRITO-11-TEATINOS-UNIVERSIDAD.pdf (accessed on 27 November 2018).
  43. Asensio, C.; De Arcas, G.; López, J.M.; Pavón, I.; Gascó, L. Awareness: A parallel approach against noise. In Proceedings of the 22nd International Congress on Sound and Vibration (ICSV 22), Florence, Italy, 12–16 July 2015; pp. 12–16. [Google Scholar]
  44. Gasco, L.; Asensio, C.; de Arcas, G. Communicating airport noise emission data to the general public. Sci. Total Environ. 2017. [Google Scholar] [CrossRef] [PubMed]
  45. International Organization for Standardization. ISO 1996-2:2007 Acoustics—Description, Measurement and Assessment of Environmental Noise—Part 2: Determination of Environmental Noise Levels; International Organization for Standardization: Geneva, Switzerland, 2007. [Google Scholar]
  46. Boletin Oficial del Estado. Real Decreto 1367/2007, de 19 de Octubre, por el que se Desarrolla la Ley 37/2003, de 17 de Noviembre, del Ruido, en lo Referente a Zonificación Acústica, Objetivos de Calidad y Emisiones Acústicas; Boletin Oficial del Estado: Madrid, Spain, 2007. [Google Scholar]
  47. Mietlicki, C.; Mietlicki, F.; Ribeiro, C.; Gaudibert, P.; Vincent, B. The HARMONICA project, new tools to assess environmental noise and better inform the public. In Proceedings of the Forum Acusticum Conference, Krakow, Poland, 7–12 September 2014. [Google Scholar]
  48. Hamburg Airport Hamburg Airport Noise Monitoring System. Available online: http://travisham.topsonic.aero/ (accessed on 27 November 2018).
  49. EveryAware Widenoise Webpage. Available online: http://cs.everyaware.eu/event/widenoise (accessed on 16 June 2016).
  50. European Environmental Agency. NoiseWatch Page. Available online: https://www.eea.europa.eu/themes/human/noise/noise-story-map (accessed on 16 June2016).
  51. Notley, H.; Grimwood, C.; Raw, G.; Clark, C.; Zepidou, G.; Van de Kerckhove, R.; Moon, N. National Noise Attitude Survey 2012; Department for Environment, Food and Rural Affairs: London, UK, 2014.
  52. Arana, M.; García, A. A social survey on the effects of environmental noise on the residents of Pamplona, Spain. Appl. Acoust. 1998, 53, 245–253. [Google Scholar] [CrossRef]
  53. Martín, M.Á.; Tarrero, A.I.; Machimbarrena, M.; González, J.; de Garibay, V.G. A methodology to study noise annoyance and to perform Action Plans follow up using as input an existing survey and noise map: Application to the city of Málaga (Spain). Appl. Acoust. 2011, 72, 495–504. [Google Scholar] [CrossRef]
  54. QuestionPro Website. Available online: https://www.questionpro.com/es/ (accessed on 20 November 2018).
  55. Bluhm, G.; Nordling, E.; Berglind, N. Road traffic noise and annoyance—An increasing environmental health problem. Noise Health 2004, 6, 43–49. [Google Scholar] [PubMed]
  56. Sincosur. Estudio Técnico para la Declaración de Zonas Acústicas Especiales en Málaga y Plan Zonal Específico. 2016. Available online: http://medioambiente.malaga.eu/opencms/export/sites/sostenibilidad/.content/galerias/Zonas-acusticamente-saturadas/estudio-tecnico-parte1.pdf (accessed on 27 November 2018).
  57. Sincosur. Revisión y Actualización de los Planes de Acción Contra el Ruido en Málaga. 2015. Available online: http://controlderuido.malaga.eu/opencms/export/sites/ctrlruido/.content/documentos/documentos-general/II_PAR_MEMORIA.pdf (accessed on 27 November 2018).
  58. Ayuntamiento de Málaga. Propuesta Relativa a la Declaración de Determinadas Zonas del Centro y Teatinos como zonas de Protección Acústica Especial. 2018. Available online: http://medioambiente.malaga.eu/opencms/export/sites/sostenibilidad/.content/galerias/documentos/ACUERDO-JGL-DE-27-SEPT-2018.pdf (accessed on 27 November 2018).
Figure 1. Monitoring locations in the city center (top map) and Teatinos (bottom map) neighborhoods.
Environments 05 00134 g001
Figure 2. Installation of one of the noise-monitoring units.
Environments 05 00134 g002
Figure 3. Long-term noise assessment at all locations during the day, evening, and night.
Environments 05 00134 g003
Figure 4. Map of long-term noise assessment during the nighttime period for the city center locations (top map) and Teatinos (bottom map).
Environments 05 00134 g004
Figure 5. Daily exceedance of the acoustic quality targets (D-AQT).
Environments 05 00134 g005
Figure 6. Hourly noise-level time history of one of the monitors in the city center.
Environments 05 00134 g006
Figure 7. Real-time web access graphical interface. The system was optimized for friendly access from PC, tablet, and smartphone devices, with the goal of reaching the widest possible audience.
Environments 05 00134 g007
Figure 8. Graphical interface example of the questionnaire.
Environments 05 00134 g008
Figure 9. Evolution of sessions, visitors, and pages visited from the project website.
Environments 05 00134 g009
Table 1. Number of noise monitors placed in each measurement period and duration.
Measurement PeriodAreaNumber of UnitsWeeks of Measurement
April–June 2015City Center910
May–September 2015City Center318
May–November 2015Teatinos224
July–September 2015City Center1011
October–November 2015Teatinos + City Center168
Table 2. Application of leisure noise models to Málaga (operating period).
Model (dBA)Mean Error (dBA)Standard Error (dBA)
Models by BallesterosLsaturday = 62.79 + 7.39 ln (N)−1.34.7
Lsaturday = 64.78 + 6.94 ln (0.8B + P + 2D + 0.6R)−1.24.2
Lsaturday = 65.30 + 6.66 ln (P + 0.8B + 2D + 0.6R) + 25.81/W − 63.19/H−0.33.1
Gaussian modelLsaturday = 72.4 (N = 28 locations)03.6
Lsaturday = 72.4 (N = 40 locations)04.2
Table 3. Application of leisure noise model to Málaga (long-term indicators).
Gaussian Model (dBA)Standard Error (dBA)95% Coverage Interval (dBA)Acoustic Quality Target (dBA)
Ld = 64.02.9[58.2; 69.8]65.0
Le = 65.52.8[59.9; 71.1]65.0
Ln = 66.04.0[58.0; 74.0]55.0
Table 4. Summary of main survey results.
QuestionResults
How noisy do you consider your neighborhood? (0 Absolutely quiet–10 Extremely noisy)Mean score = 8.8
54% of participants scored 10 (extremely)
Thinking of the last 12 months, when you are inside your dwelling, how much are you annoyed or disturbed by the noise from the street?87.9% Much or extremely
How much are you bothered or annoyed by the leisure noise? (0 nothing at all—10 Extremely)
The participant had to rate different noise sources, but in this table, we focus on leisure noise
Mean score = 7.4
54% of participants scored 10 (extremely)
Would you consider noise as a problem in your life?88% of participants answered Yes
Could you rate to which extent noise in this area damages your quality of life? (0 Nothing at all–10 Absolutely)Mean score = 8.1
36% of participants scored 10
Do you consider that the noise situation in your dwelling is better or worse than 5 years ago?64% of the participants considered the situation much worse than 5 years ago
Thinking of approximately the last 12 months, could you indicate which of the following noise sources affects you most while you are in your dwelling?55% Leisure activities (bars, shows, sports)
14% Road traffic
9% City services
22% Other noise sources
Regarding leisure noise, and thinking of approximately the last 12 months, how much do you feel annoyed by the following activities when you are in your dwelling?
(This question was only presented to those selecting leisure activities in the previous question)
Bars, restaurants, terraces. Mean score = 9.6
Crowds linked to bars. Mean score = 9.8
The rest of noise sources scored under 7.0

