Article

Performance of Pd-Based Membranes and Effects of Various Gas Mixtures on H2 Permeation

Department of Chemical Engineering, Worcester Polytechnic Institute, Worcester, MA 01609, USA
*
Author to whom correspondence should be addressed.
Environments 2018, 5(12), 128; https://doi.org/10.3390/environments5120128
Submission received: 3 November 2018 / Revised: 29 November 2018 / Accepted: 30 November 2018 / Published: 4 December 2018
(This article belongs to the Special Issue Environmental Applications of Membrane Technology)

Abstract

:
H2 permeation and separation properties of two Pd-based composite membranes were evaluated and compared at 400 °C and at a pressure range of 150 kPa to 600 kPa. One membrane was characterized by an approximately 8 μm-thick palladium (Pd)-gold (Au) layer deposited on an asymmetric microporous Al2O3 substrate; the other membrane consisted of an approximately 11 μm-thick pure palladium layer deposited on a yttria-stabilized zirconia (YSZ) support. At 400 °C and with a trans-membrane pressure of 50 kPa, the membranes showed a H2 permeance of 8.42 × 10⁻⁴ mol/m2·s·Pa0.5 and 2.54 × 10⁻⁵ mol/m2·s·Pa0.7 for Pd-Au and Pd membranes, respectively. Pd-Au membrane showed infinite ideal selectivity to H2 with respect to He and Ar at 400 °C and a trans-membrane pressure of 50 kPa, while the ideal selectivities for the Pd membrane under the same operating conditions were much lower. Furthermore, the permeation tests for ternary and quaternary mixtures of H2, CO, CO2, CH4, and H2O were conducted on the Pd/YSZ membrane. The H2 permeating flux decreased at the conclusion of the permeation tests for all mixtures. This decline however, was not permanent, i.e., H2 permeation was restored to its initial value after treating the membrane with H2 for a maximum of 7 h. The effects of gas hourly space velocity (GHSV) and the steam-to-carbon (S/C) ratio on H2 permeation were also investigated using simulated steam methane reforming mixtures. It was found that H2 permeation is highest at the greatest GHSV, due to a decline in the concentration polarization effect. Variations in S/C ratio however, showed no significant effect on the H2 permeation. The permeation characteristics for the Pd/YSZ membrane were also investigated at temperatures ranging from 350 to 400 °C. The pre-exponential factor and apparent activation energy were found to be 5.66 × 10⁻⁴ mol/m2·s·Pa0.7 and 12.8 kJ/mol, respectively. Scanning Electron Microscope (SEM) and X-ray diffraction (XRD) analyses were performed on both pristine and used membranes, and no strong evidence of the formation of Pd-O or any other undesirable phases was observed.

1. Introduction

Fossil fuels comprise approximately 80% of the energy portfolio in the U.S. today [1]. The transportation sector accounts for approximately 70% of domestic petroleum consumption [2]. Light-duty vehicles emit significant amounts of CO2, volatile organic compounds (VOC), carbon monoxide (CO), and nitrogen oxides (NOx) [3]. Climate change effects can be mitigated through the development of state-of-the-art carbon capture technologies, utilizing more efficient industrial processes, switching to less carbon-intensive fuels, and through the use of renewable carbon-free energy resources [4]. H2 can be used as a replacement fuel for gasoline to help mitigate greenhouse gas (GHG) effects and improve air quality. Replacing internal combustion engine vehicles with H2 fuel cell vehicles (HFCV) has the potential to reduce the GHG emissions by up to 40% [5]. In order for HFCVs to be commercially viable, the cost of H2, delivered at the pump, should be reduced to USD 2.00–3.00/gge (gallon of gasoline equivalent) for its commercial application in HFCVs [6]. Steam methane reforming (SMR) remains the most widely used industrial process for H2 generation, which accounts for 50% of global H2 production [7]. Conventional reactors produce H2 via two separate reactions: steam methane reforming (1,2) and water gas shift (WGS) (3). Since the products of the SMR reaction contain high concentrations of CO (i.e., 3–10%), two WGS reactors are required to both maximize H2 production and increase the purity of the produced H2 stream [8,9]. SMR is composed of three reversible reactions (i.e., Equations (1)–(3)) that normally take place under very harsh operating conditions (i.e., 800–1000 °C and 1.5–2.0 MPa) due to thermodynamic constraints. Since ultra-pure H2 (99.999%) with less than 50 ppm of CO concentration is required for proton exchange membrane fuel cells (PEMFC), further purification of H2 is required [9,10]. Techniques such as preferential oxidation (PrOx), pressure swing adsorption (PSA), cryogenic distillation, dense Pd-membranes, etc. can be used to achieve this goal [11]. The most commonly-used technique in the industry for H2 purification is PSA. However, approximately 20% of produced H2 is lost in the PSA process [7].
CH4 + H2O ↔ CO + 3H2    ∆H0298K = 206 kJ/mol
CH4 + 2H2O ↔ CO2 + 4H2    ∆H0298K = 165 kJ/mol
CO + H2O ↔ CO2 + H2    ∆H0298K = −41 kJ/mol
Membrane reactor (MR) technology is still the most promising technology for the separation, purification, and production of H2 [12]. MR technology is an alternative method that can be used to perform the SMR reaction at lower operating temperatures and pressures. In particular, Pd-based metallic membranes are the best candidates for the production of high-purity H2 due to their ‘infinite’ selectivity towards H2 permeation [13]. Dense Pd membranes have the potential to produce H2 with purities greater than 99.9999% [10].
However, the fact that the permeation flux of H2 is inversely proportional to the membrane thickness makes dense thick Pd-membranes unattractive for commercial applications due to their very small H2 flux. One way to address the low permeating flux issue is to deposit a thin Pd layer on a porous substrate, i.e., either ceramic or porous stainless steel (PSS). A favorable membrane should maintain high selectivity toward H2, high permeability to operate effectively at high flow rates and restrained surfaces, and good chemical and structural stability to avoid deterioration under exertion [12]. The membrane configurations that provide these characteristics are twofold: thin Pd layer deposited on a ceramic support, and thin Pd layer deposited on metallic support covered with an intermetallic diffusion barrier. The membrane support provides the mechanical stability and usually does not exhibit any selective properties. The main characteristics of an effective membrane support are its high permeability toward gases and interconnected porous network. Such supports are usually composed of a few millimeters of sintered metallic or ceramic materials [14].
The use of ceramic supports in composite membranes is constantly increasing due to their low cost and controllable pore size. Inferior mechanical stability, poor weldability, and differing thermal expansion coefficients from Pd are the main disadvantages of ceramic supports. The prevailing ceramic supports are α-alumina, γ-alumina, and YSZ [15,16,17]. The main advantage of metallic supports such as PSS is that their similar thermal expansion coefficient to that of Pd minimizes disbanding which stems from different thermal expansion coefficients. Furthermore, metallic supports offer better weldability compared with ceramic-based supports [18,19,20]. Some common drawbacks of metallic supports are their rough surface, large pore size, and the intermetallic diffusion of Pd into the metallic support [21,22,23,24]. This problem can be avoided by employing an intermetallic diffusion barrier between the metallic support and the Pd layer [14]. Some of the intermetallic diffusion barriers reported in the literature are TiN, Ti O2, Al2O3, α-Fe2O3, γ-Al2O3, and yttria-stabilized zirconia (YSZ), with TiN being reported as the most promising one.
Nevertheless, the pure Pd membrane is susceptible to poisoning when in contact with impurities such as H2S, CO, and CO2. In order to prevent this problem, Pd is alloyed with transition metals (e.g., Ag, Au, Cu, Mo, Ta, Y). In particular, alloying Pd with metals such as Ag and Cu can significantly decrease the fabrication cost while maintaining the features of the membrane, and improve its resistivity against impurities [25]. Alloyed membranes consisting of Pd-Cu, Pd-Ag, and Pd-Au have gained significant attention, and have been studied intensively due to their high resistance against sulfur poisoning [26,27,28].
Although the permeating flux of H2 is significantly improved and the fabrication cost of the membrane can be considerably lowered by using alloyed Pd membranes, the finished cost of a Pd-based membrane is still too far from the DOE target of < USD 1000/m2 to be considered economically viable on a large scale [12,29]. Nonetheless, Pd-based membranes have been studied and characterized for various purposes over the past decades. Schramm & Seidel compared the mass transfer properties of a dense porous Vycor glass membrane and Pd-based membrane at 20 °C and 200 °C, respectively, and found that permeating fluxes of N2, H2, and Ar are reduced significantly in the Pd-modified membrane [30]. Gallucci et al. [31] and Jørgensen et al. [32] used unsupported dense Pd-Ag membranes with a thickness of 50 µm to investigate the effects of several operating conditions on the MR performance. In both of these studies, the H2 permeating flux was significantly low, which could be attributed to the thickness of the membrane.
Liguori et al. studied the performance of a MR using a 20-µm thick Pd/PSS membrane. They concluded that both ideal selectivity and H2 permeation remain unchanged under the WGS reaction conditions [8]. Chen et al. performed a two-dimensional numerical analysis of concentration polarization in a membrane tube and found that an increase in trans-membrane pressure or membrane permeance will enhance the H2 permeation flux and escalate the concentration polarization effect [33]. Zhang et al. studied, both numerically and experimentally, the influences of pressure, temperature, and feed gas flow rate on the degree of concentration polarization during the ammonia cracking process, and concluded that increasing the trans-membrane pressure aggravates the negative effect of concentration polarization, while increasing the feed gas flow rate decreases the concentration polarization effect [15]. Mori et al. studied the effects of concentration polarization on CH4 conversion and H2 recovery in the SMR reaction, and found that the rate of SMR is reduced due to slower removal of H2, which can be explained by the concentration polarization effect [34]. Caravella et al. investigated the effects of numerous parameters on a newly-defined variable called Concentration Polarization Coefficient (CPC) through numerical simulation, and concluded that the CPC decreases with increasing membrane thickness, downstream total pressure, Reynolds number, and H2 mole fraction in the upstream side, and increasing temperature increases the CPC [35]. In a later simulation study by Caravella and Sun, they found that the Effective Average Concentration Polarization Coefficient (EAC) increases by increasing temperature and total feed pressure, whereas increasing H2 mole fraction on the permeate side and GHSV will lower EAC [36]. Hara et al. studied, both numerically and experimentally, the effects of concentration polarization and CO hindrance on H2 permeation in a Pd-based MR using binary mixtures of Ar-H2 and CO-H2, and found that the presence of CO in the feed mixture causes a stronger decrease of the H2 permeation flux [37]. Peters et al. performed a study on a thin, defect-free Pd-Ag23% membrane at 400 °C and very high pressure of 2600 kPa, and investigated the effects of dilution, depletion, concentration polarization, and competitive adsorption on the H2 permeating flux [28]. Their findings show that the permeating flux of H2 will decrease due to the concentration polarization effect in a binary mixture of H2-N2. The reduction in H2 permeating flux is more pronounced when N2 is substituted with CO2, while a H2-CO binary mixture shows the lowest H2 permeating flux.
Despite the significant research performed in the literature on the Pd-based membranes, there are few works investigating the influence of the several factors affecting the H2 permeating flux: dilution, depletion, concentration polarization, and competitive surface adsorption at conditions satisfying the DOE target requirements (differential pressure of 20 psi, and operating temperature of 400 °C) [6,38] and using the mixtures that represent SMR process in a systematic experimental work. Numerous mathematical models and simulation studies can be found in the open literature that investigate the effects of concentration polarization on the H2 permeating flux; however, the majority of these works lack experimental confirmation [39,40,41,42].
In this work, the effects of numerous gaseous components of the SMR reaction on the H2 permeation flux is studied in detail. The negative effects (concentration polarization, dilution, depletion, and competitive adsorption on the Pd surface) through which each gas can reduce the H2 permeating flux are analyzed by performing permeation tests of binary mixtures of H2 with He, Ar, N2, CH4, CO, CO2, and H2O. Next, the study is extended to ternary and quaternary mixtures to explore the cumulative effects of SMR components on the H2 permeating flux. Finally, the permeation tests are performed on a simulated stream of the SMR reaction, and the aforementioned negative effects are investigated.

2. Materials and Methods

2.1. Pd-Based Membrane
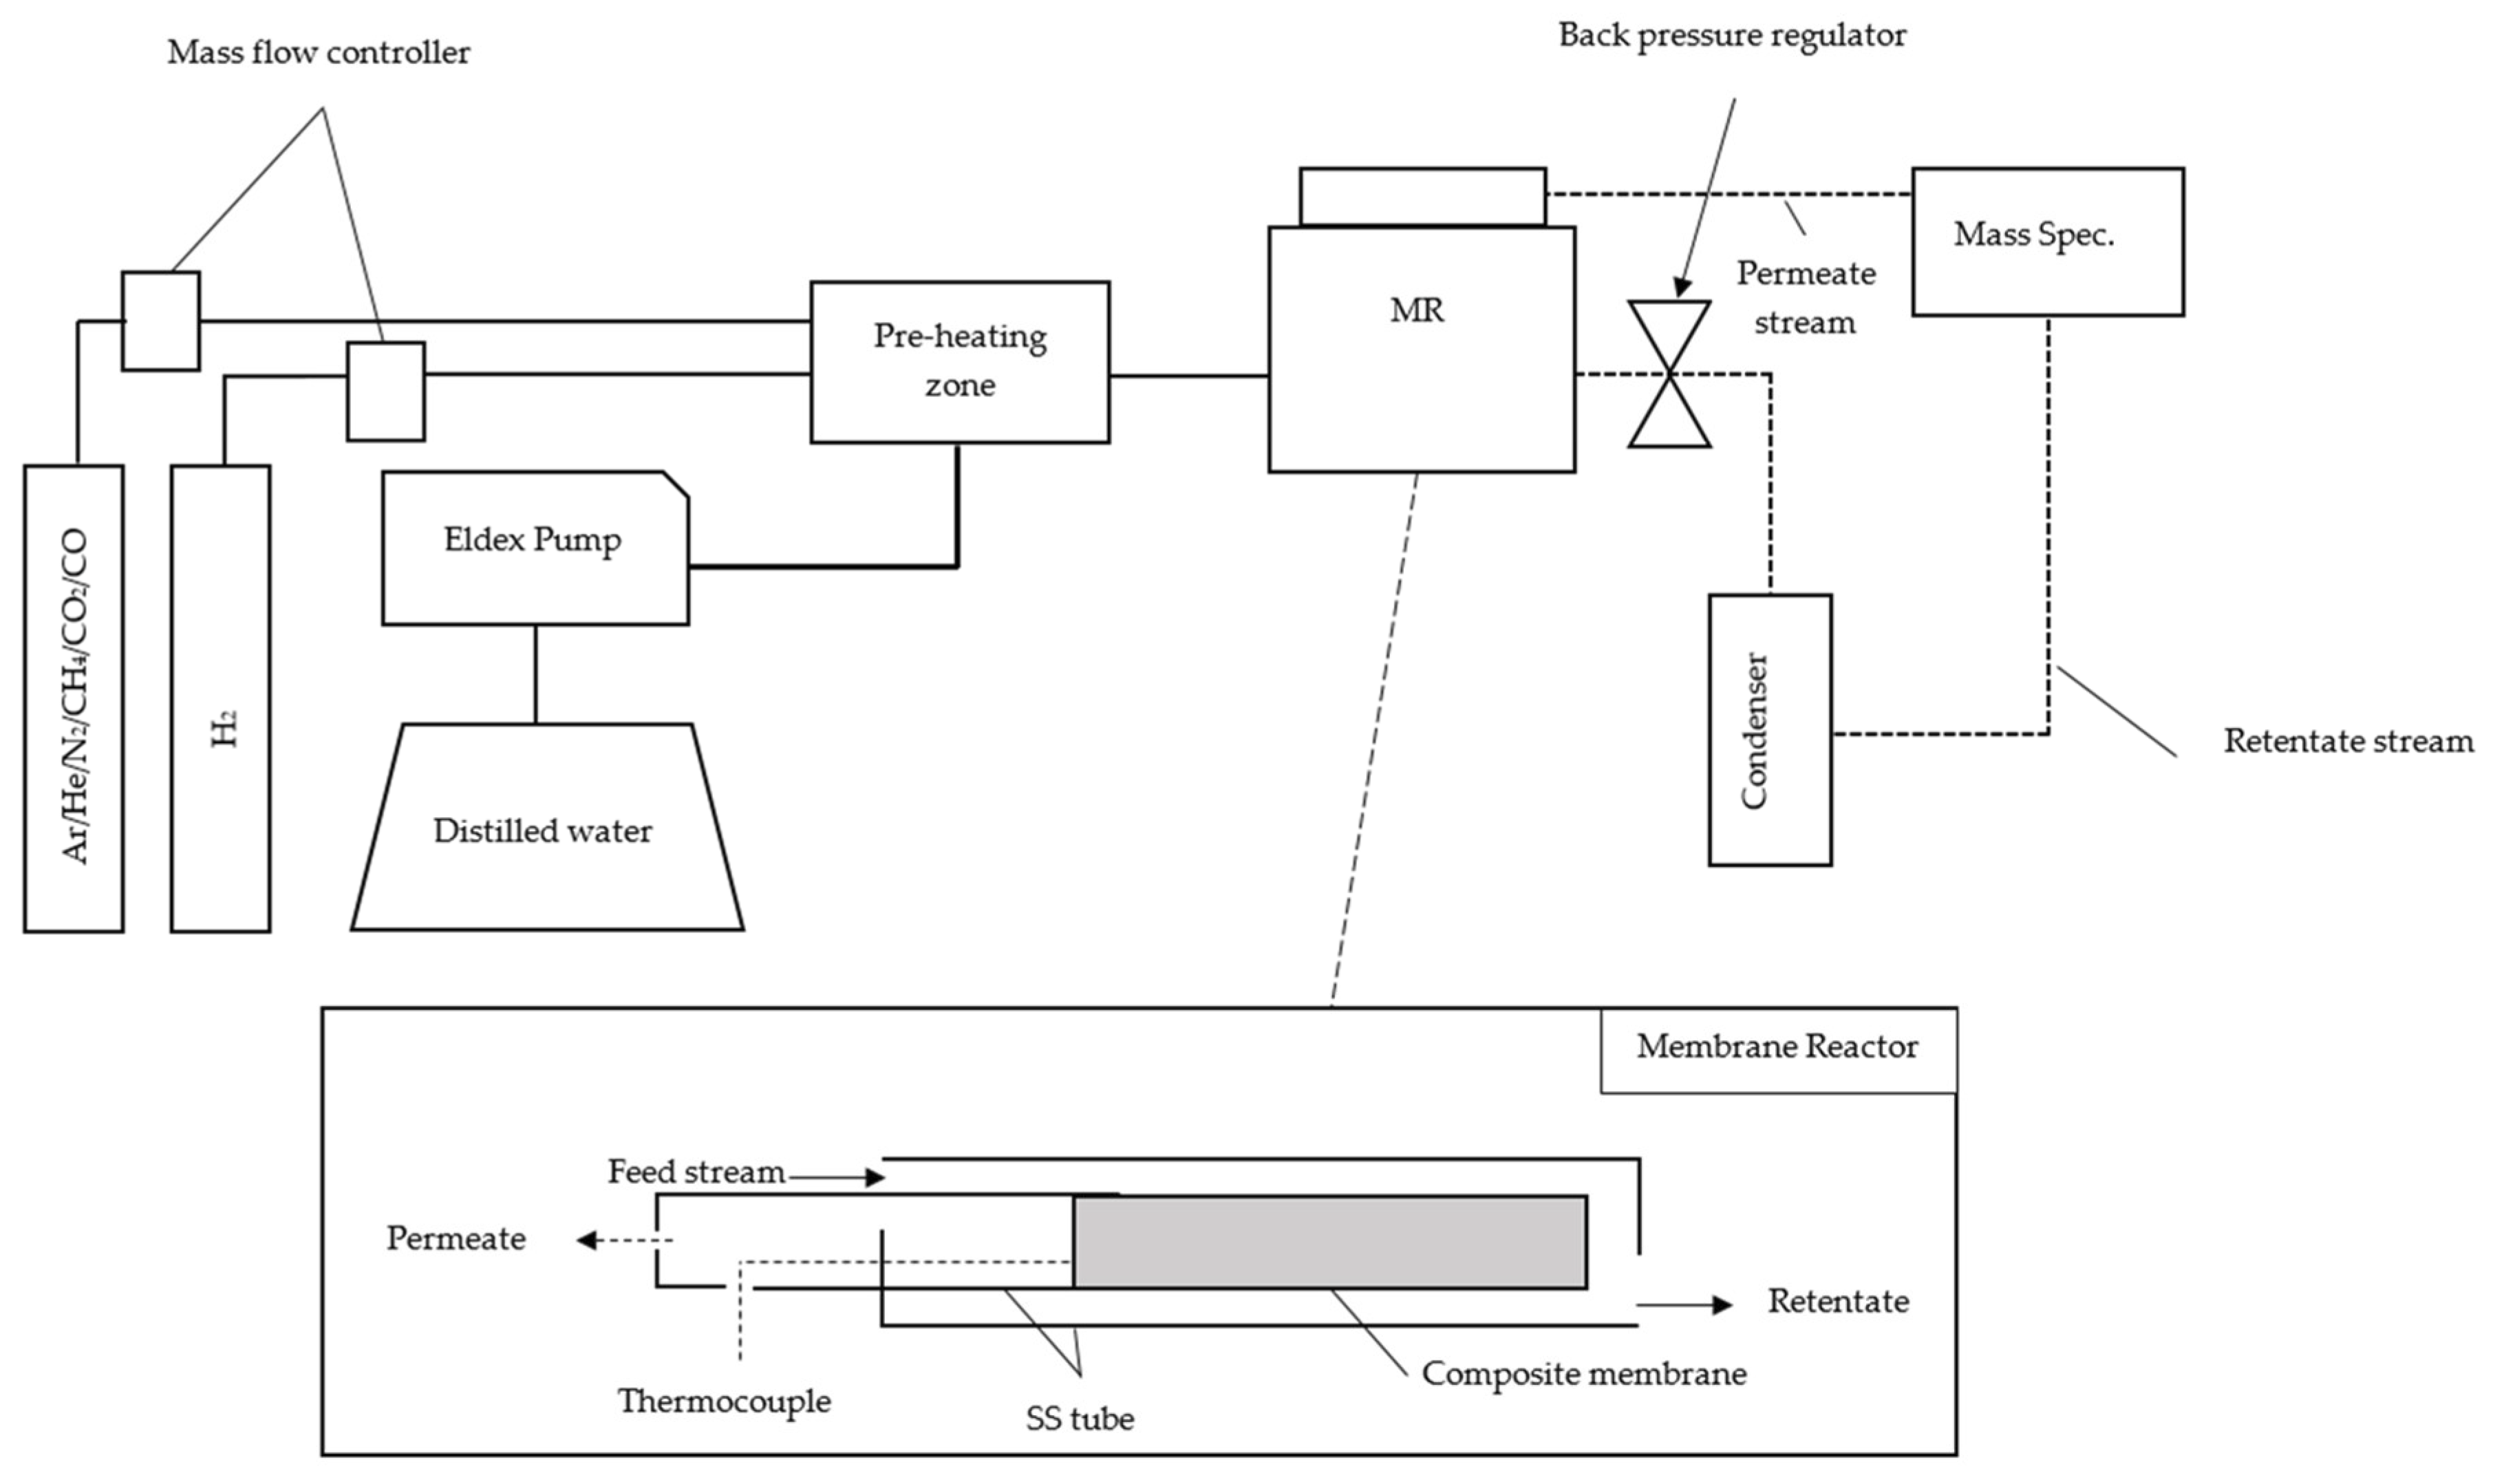
The composite Pd-Au and Pd membranes were prepared by deposition of thin layers of palladium-gold on YSZ and pure Pd on asymmetric microporous Al2O3 substrate supports, respectively, via electroless plating. The Pd/YSZ membrane was manufactured according to the procedure developed by Ma et al. [43,44,45], while the Pd-Au/Al2O3 was manufactured in Nanjing Tech University (Nanjing, China) following the procedure developed by Collins and Way [46]. The thickness of the Pd and Pd-Au layers were determined to be ~11 μm and ~8 μm respectively using the gravimetrical method according to the procedure described by Anzelmo [47].
The ceramic support for preparation of the Pd membrane was provided by Praxair company with an active length of ~7.2 cm and an OD of 9.8 mm. The total active surface area of the Pd membrane was calculated to be ~12 cm2. The Pd-Au membrane was provided by Nanjing Tech University (Nanjing, China), and had an active length of ~4.5 cm and an OD of 12.3 mm. The total active surface area of the Pd-Au membrane was calculated to be ~17.3 cm2. Before initiating the permeation tests, the membrane was activated by flowing ~30 mL/min of pure H2 at 400 °C and a trans-membrane pressure of 50 kPa for 2 h, as recommended by Helmi et al. to remove the organic impurities on the membrane surface [48] Permeation tests with pure gases (H2, He, Ar) and gas mixtures, as presented in Table 1, at 400 °C and pressure range of 150 to 600 kPa, have been performed in this study.

2.2. Procedure

A schematic of the experimental setup is presented in Figure 1. As shown in Figure 1, the reaction gases are fed to the annular space of the MR (retentate side). The MR system was heated using an ultra-high temperature heating tape, model STH051-080. The voltage for heating was controlled by a Thermolyne-type 45,500 input control. The experimental temperature was monitored via a K-type Omega HH801A thermocouple. The accuracy of the thermocouple over a range of −100 °C to 1372 °C is ± (0.1% rdg + 1 °C). The flow rates of the feed gases were controlled using Aalborg GFC17 mass flow controllers (Aalborg Instruments & Controls Inc., Orangeburg, New York, U.S.). Deionized water was supplied to the MR using an Eldex Optos 1LMP pump. Water was vaporized, and superheated steam was formed in a spiral pre-heating zone before entering the MR. The water vapor in the retentate side was condensed using a temperature-regulated water bath (Julabo F25-EH). The pressure on the retentate side was regulated with an Ashcroft Back Pressure Regulator. The pressure on the retentate side was measured with a Swagelok EN 837-1 pressure gauge.
The MR was heated up to 400 °C with a heating ramp of ~1.5 °C/min under Ar gas. In this study, the influences of various gaseous components of SMR reaction (CO2, CO, CH4, H2O) on the H2 permeating flux were investigated in binary, ternary, quaternary, and simulated mixtures of SMR. The negative effects of concentration polarization were investigated using equimolar binary mixtures of H2-Ar at 400 °C and pressures ranging from 150 kPa to 600 kPa. Dilution and depletion effects were investigated using equimolar binary mixtures of H2-N2 and H2-CH4 at 400 °C and pressures ranging from 150 kPa to 600 kPa. The negative effects of competitive adsorption on the Pd surface were investigated using the equimolar binary mixtures of H2-CO and H2-CO2 at 400 °C and pressures ranging from 150 kPa to 600 kPa, according to the procedures followed by Peters et al. [28]. Furthermore, ternary, quaternary and simulated SMR streams were utilized to further investigate the combined effects of the aforementioned four negative factors. In addition, the effects of operating conditions of temperature and pressure, as well as S/C ratio and GHSV on the H2 permeating flux were explored. Trans-membrane pressure, S/C ratio, GHSV were varied between 50 to 500 kPa, 2.0 to 3.5, and 221 to 884 h−1, respectively.
At the beginning of the characterization experiments, the permeation fluxes of pure gases H2, He, and Ar were measured. The permeating flux of each pure gas was measured using a bubble-flow meter. Every experimental point represents an average value of at least 10 measurements at the same operating conditions, with an average error variation lower than 2.3%. All experimental data was recorded 15 min after changing the trans-membrane pressure to ensure a steady state was achieved. For tests involving the gas mixtures, the permeating flux of pure H2 was measured before and after each experiment to evaluate the influence of each mixture on the permeating flux of H2.
The H2 permeation through a composite Pd-based membrane can be explained by the following general equation [49]
JH2 = PH2 (pnH2, retentatepnH2, permeate)
where JH2 is the H2 permeating flux, PH2 is the H2 permeance, and PH2,retentate and PH2,permeate are the partial pressures of H2 in the retentate and permeate sides, respectively. The exponent n in Equation (4) is called the dependence factor, which is an indication of the dependency of H2 permeating flux to the partial pressure of H2, and can vary between 0.5 and 1.0. The value of n can be determined experimentally by plotting H2 permeating flux as a function of transmembrane pressure. A value of 0.5 for n (Sieverts’-Fick’s law) is an indication that the transport of H2 through the dense metallic layer is governed by the solution-diffusion mechanism. The H2 permeance is a function of temperature, and its temperature dependency can be described by an Arrhenius-type equation:
PH2 = P0H2 exp (−Ea/RT)
where P0H2 is called the pre-exponential factor, Ea is the apparent activation energy, R is the universal gas constant, and T is the absolute temperature.
The ideal selectivity was used to describe the permeating characteristic of the membrane and to evaluate the extent of membrane selectivity toward H2:
Ideal Selectivity (αH2/i) = PH2/Pi
where i represents either He or Ar.

2.3. Materials

Ultra-high purity H2 and He (99.999% purity), industrial grade Ar (99.985% purity), CH4 (99.97% purity), CO2 (99.9% purity), and N2 (99.0% purity) were used for the permeation and reaction simulation experiments in this work. CO used in this study was diluted with He due to safety concerns, and had a certified purity of 10.3%. All the gases were obtained from General Air Services & Supplies.

3. Results and Discussion

3.1. Membrane Permeation Tests

In this study, two different membranes, namely Pd and Pd-Au, were used to evaluate the permeation fluxes of H2 at various operating conditions and using different mixtures. The permeation tests with pure gases of H2, He, and Ar were conducted on both membranes to characterize the membranes and find their perm-selective properties. Further permeation tests with binary, ternary, quaternary, and simulated SMR mixtures were carried out for the Pd membrane, while for the Pd-Au membrane, the permeation tests were conducted only with the binary mixtures.

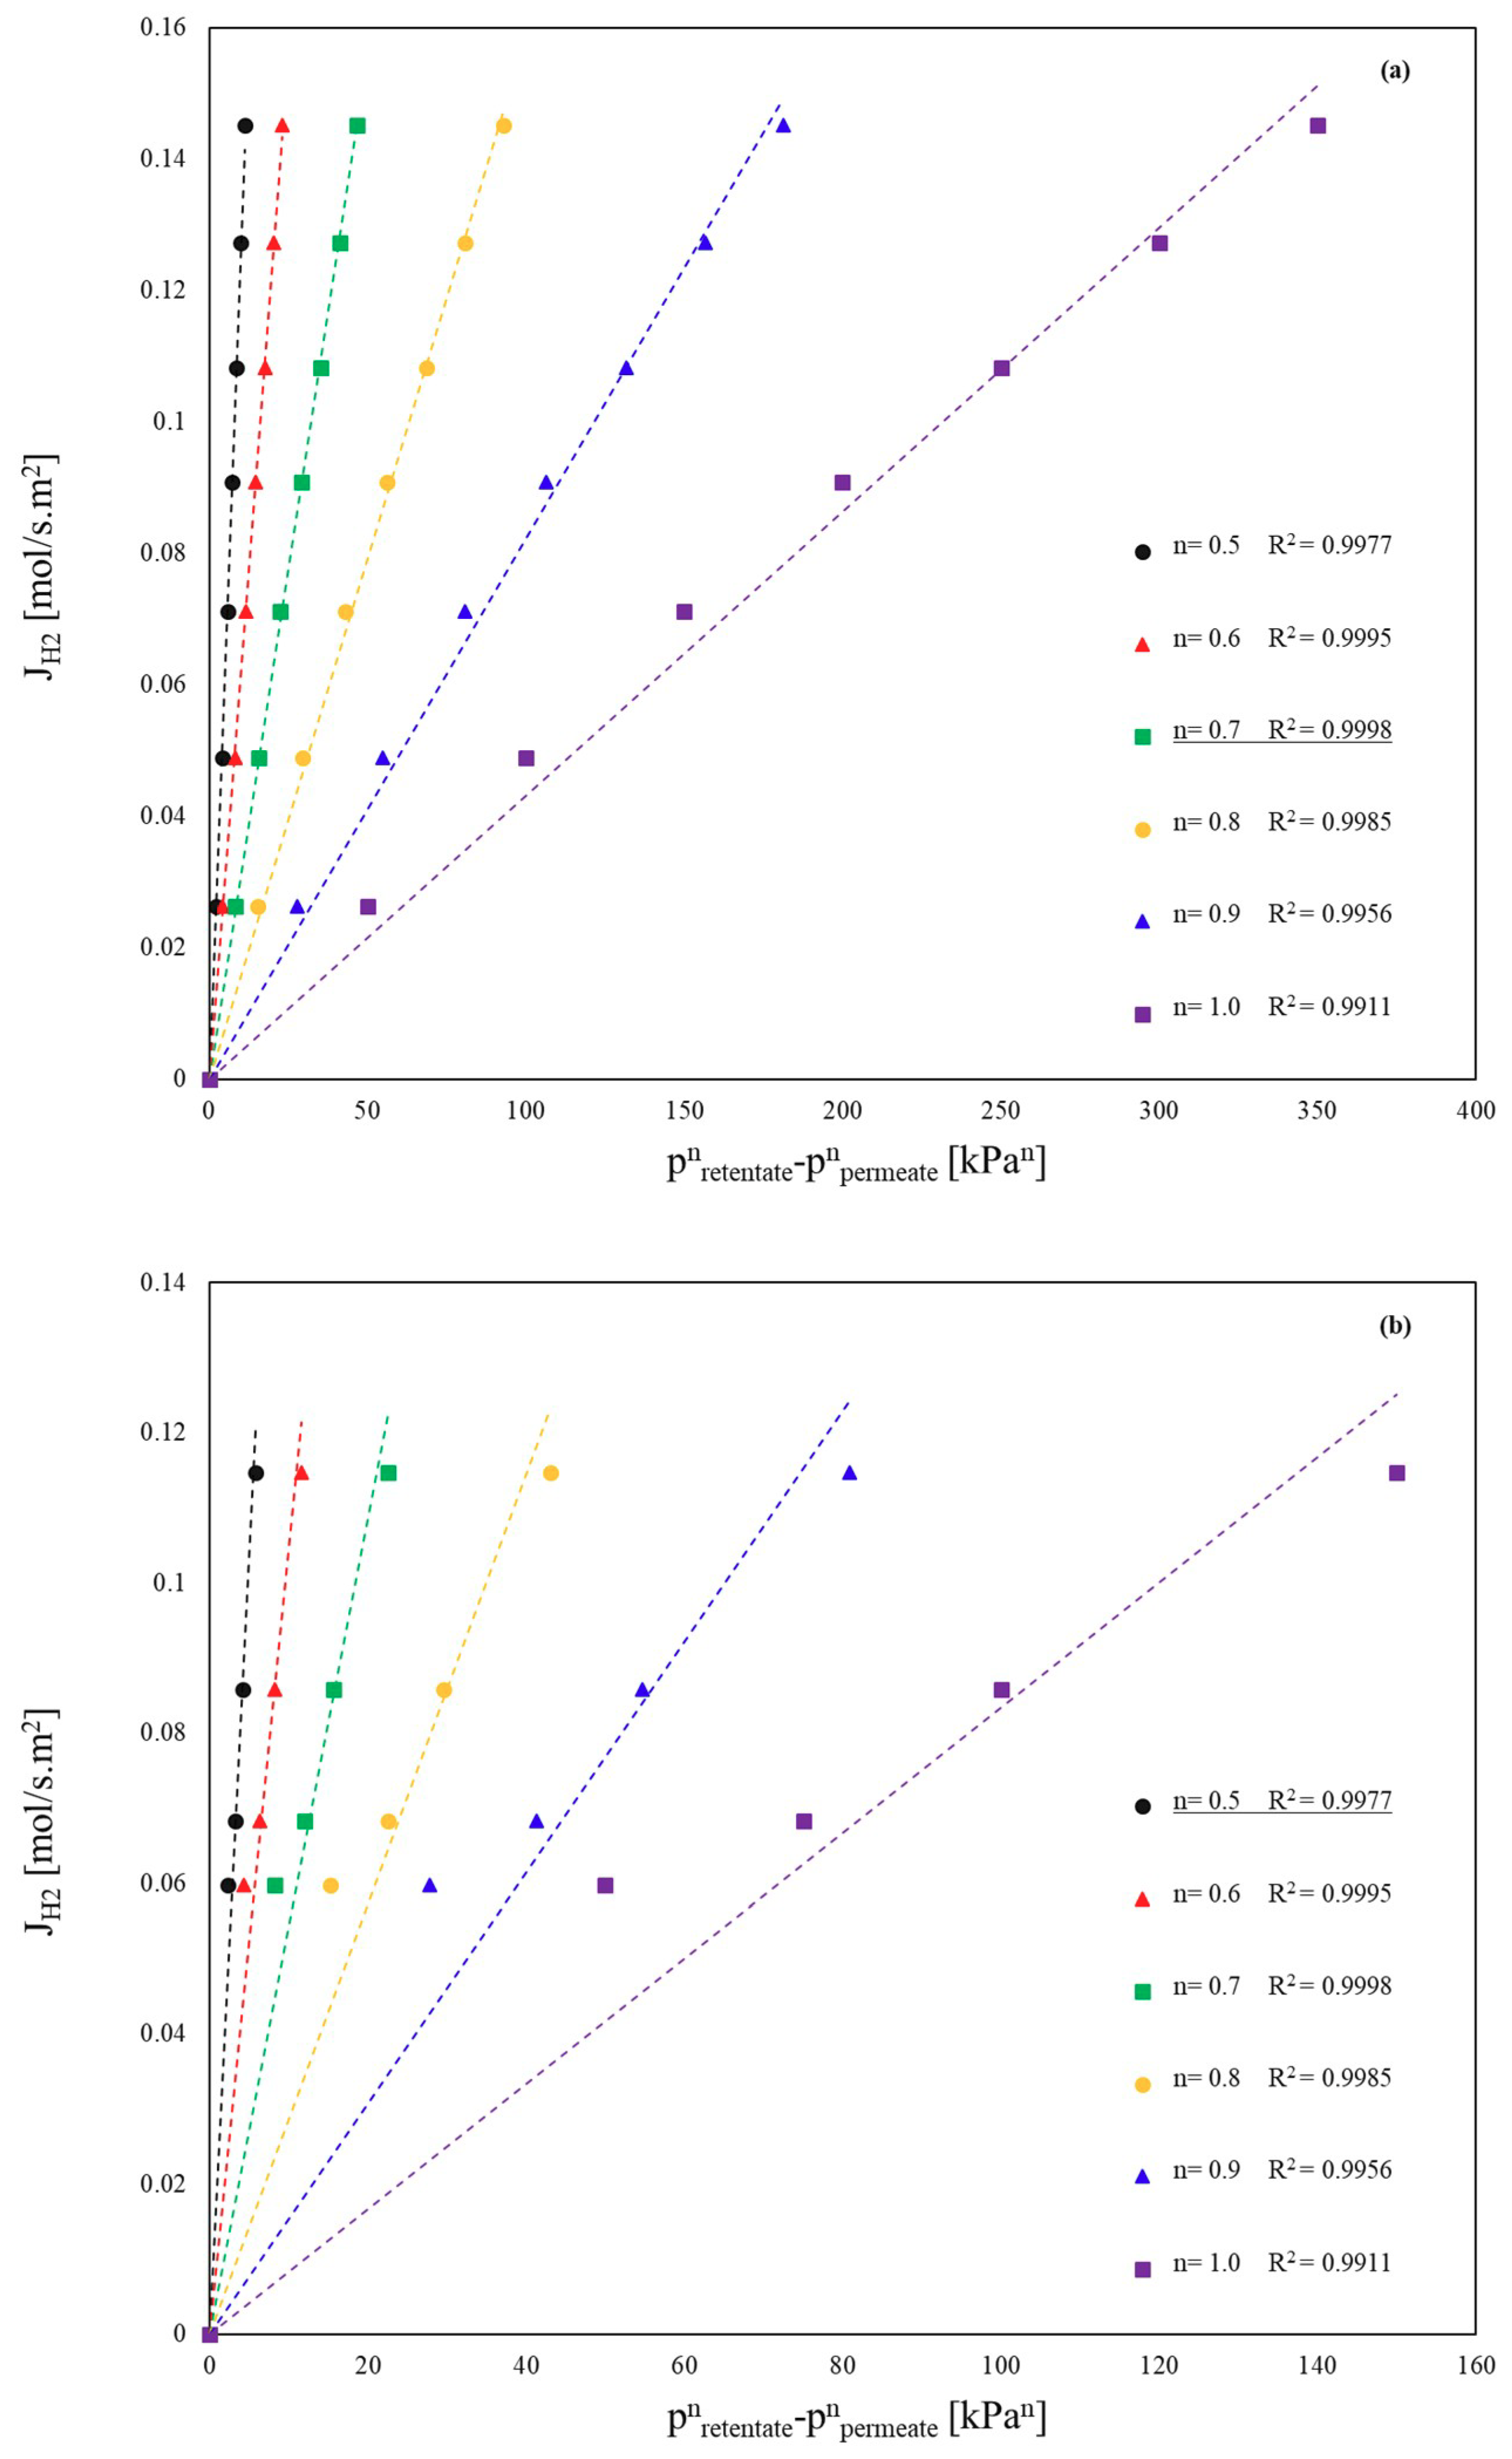
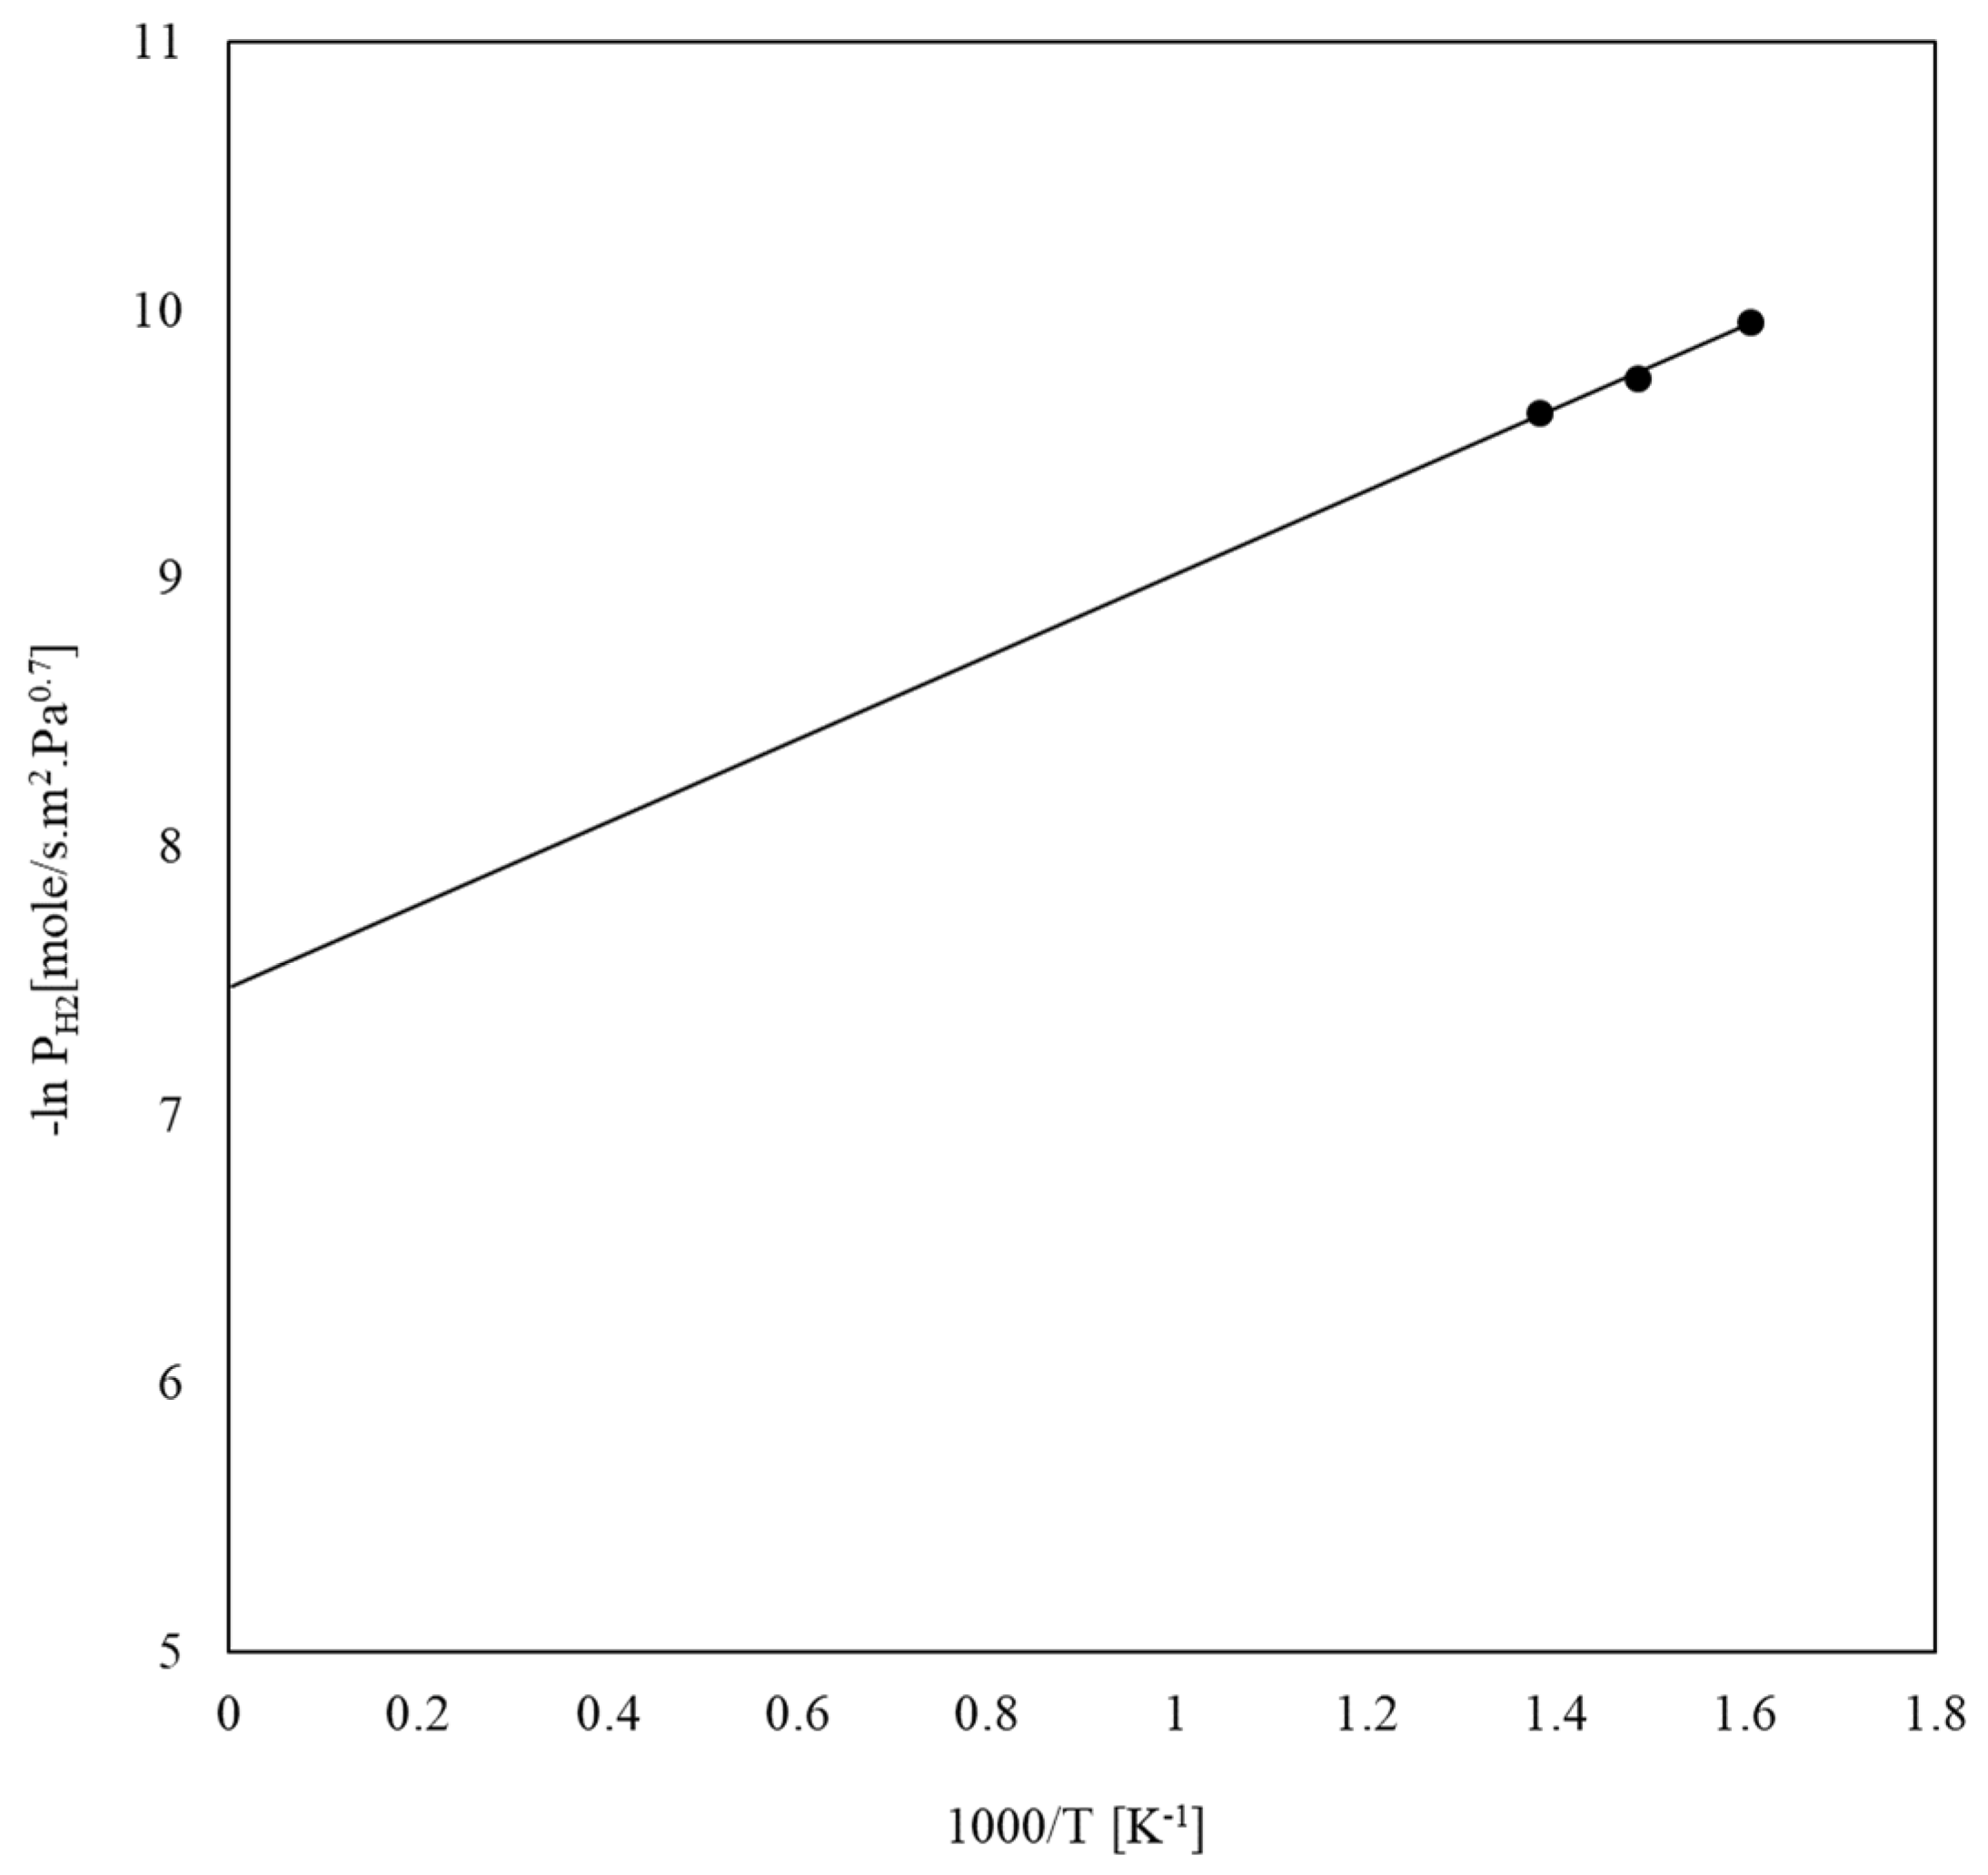
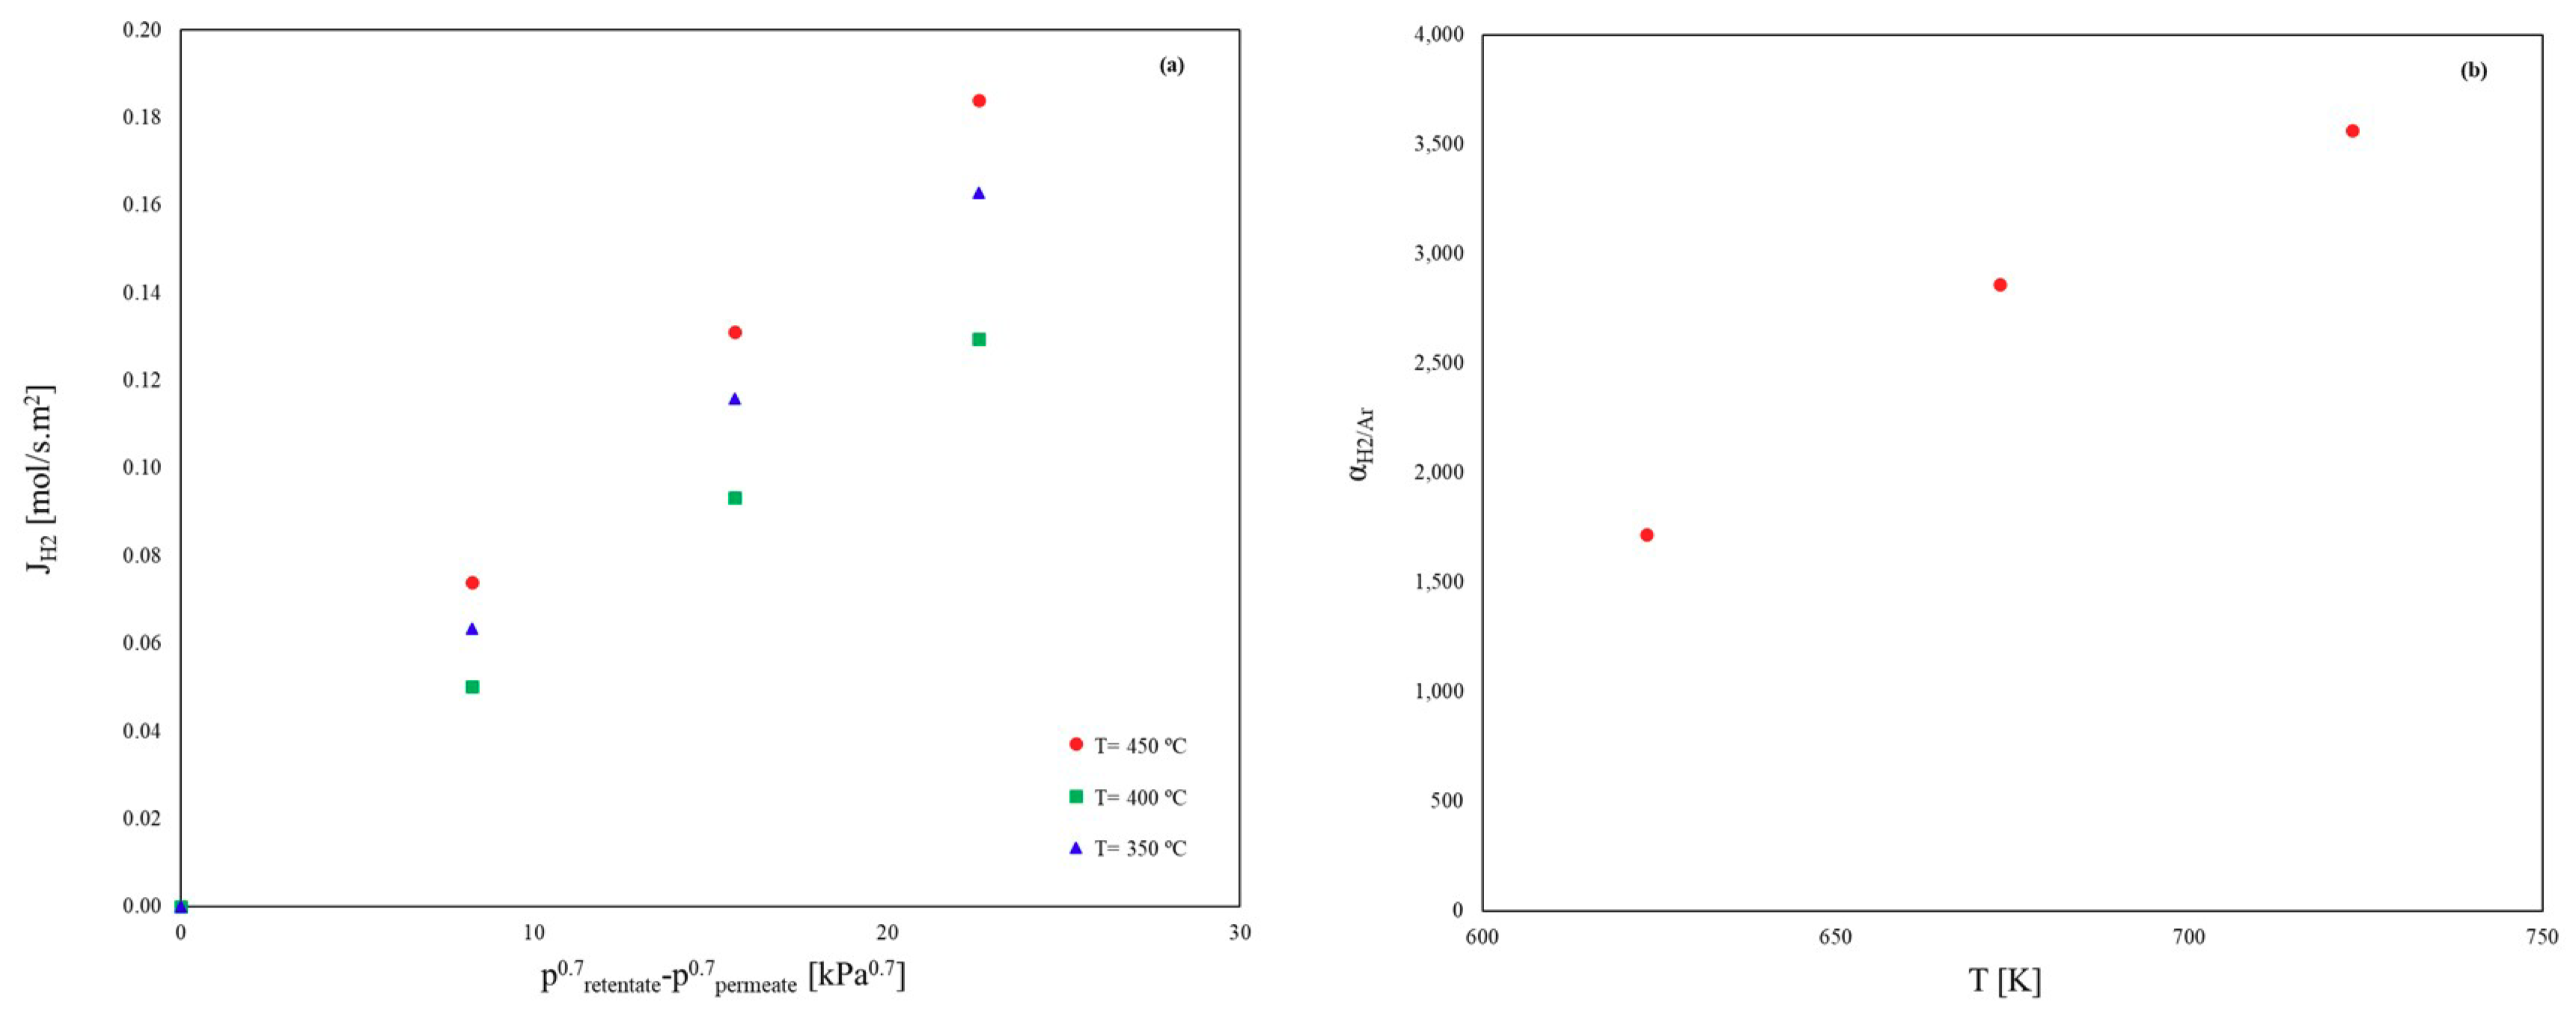
3.1.1. Pure Components

To fully evaluate the permeation characteristics of the membrane, permeation tests with pure gases were performed. In particular, the permeation tests with pure hydrogen were carried out to determine the membrane parameters such as Pe0, Ea, and n, as indicated in Equations (4) and (5). Hence, permeation tests with pure H2 at various temperatures and trans-membrane pressures were carried out for each membrane to estimate these parameters.
In order to find the correct value of n, the H2 permeation flux as at various trans-membrane pressures was measured at 400 °C. Next, the permeating fluxes were plotted against the driving force for each value of n, varying between 0.5–1.0, and a linear regression analysis was performed, as shown in Figure 2. The line with the highest R2 value was selected as the appropriate dependence factor for each membrane. The best linear regressions obtained have values of n = 0.5 and n = 0.7 for Pd-Au and Pd membranes, respectively. These calculations indicate that the H2 transport through the Pd-Au membrane is limited by solution diffusion through the bulk of the Pd layer, while for the Pd membrane, the transport mechanism can be affected by Pd surface or bulk defects or impurities present in the Pd surface stemming from non-perfect fabrication or pinhole developments. Moreover, at 400 °C and a trans-membrane pressure of 50 kPa, the membranes showed a H2 permeance of 8.42 × 10⁻⁴ mol/m2·s·Pa0.5 and 2.54 × 10⁻⁵ mol/m2·s·Pa0.7 for Pd-Au and Pd membranes, respectively.
In order to evaluate values of Pe0, and Ea, permeation tests were performed for the Pd/YSZ membrane with pure H2 at a trans-membrane pressure of 100 kPa and at different temperatures ranging from 350 to 400 °C. Using Equation (5), the H2 permeance vs. reciprocal of absolute temperature was plotted on a logarithmic scale, as shown in Figure 3.
The values for Po and Ea were found to be 5.66 × 10⁻⁴ mol/m2·s·Pa0.7 and 12.8 kJ/mol, respectively. These values are comparable with the results obtained by other authors, as reported in Table 2.
He and Ar gases were further used to inspect the presence of any defects or pinholes in the membranes, and also to calculate the ideal selectivity of H2 with respect to He (αH2/He) and Ar (αH2/Ar). The ideal selectivities of each membrane as a function of trans-membrane pressure are reported in Table 3. As can be seen in Table 3, for both Pd/YSZ and Pd-Au/Al2O3, the ideal selectivity of H2 with respect to both He and Ar decreases as the trans-membrane pressure increases. This behavior can be explained by the transport mechanism of each gas through the membrane. According to Mardilovich et al., at temperatures above 350 °C, the main transport mechanisms for He, Ar, N2, CO2, and CH4 are Knudsen diffusion and viscous or Poiseuille flow, while the main transport mechanism for H2 is solution-diffusion [53]. As indicated in Equation (4), the permeating flux of H2 increases linearly with PH2,retentate0.7PH2,permeate0.7, while for other gases, the permeating flux increases linearly with PretentatePpermeate. Hence, the permeating flux of other gases will increase more than that of H2, with an equal increase in the trans-membrane pressure. This will result in a decrease in the ideal selectivity of H2 at higher pressures. In addition, the existence of defects such as pinholes can exacerbate the reduction in the ideal selectivity values at higher pressures. Although the values of ideal selectivities are high for both membranes, the permeation test results confirm that the Pd membrane is not defect-free and not completely selective toward H2, while the Pd-Au membrane shows infinite selectivity to H2 at 400 °C and a trans-membrane pressure of 50 kPa.
For both Pd and Pd-Au membranes, at each trans-membrane pressure considered, the ideal selectivity of H2 to Ar is greater than that of H2 to He. This behavior can also be described by the prevailing transport mechanism for these gases. As mentioned previously, He and Ar transport through the membrane via Knudsen diffusion and viscous or Poiseuille flow. For these non-absorbing gases, the total permeance can be expressed as the sum of Knudsen and viscous flows, as shown in Equation (7):
Ftotal = Fk + Fv ∙ pavg. = 2/3 √(8/π) (ϵμk r)/(L√RTM) + 1/8 (ϵμv r2)/LηRT∙ pavg.
The Knudsen flux is inversely proportional to the square root of the molecular weight of the gas, while viscous flux is inversely proportional to the gas viscosity at a specific temperature [53]. Since both viscosity and molecular weight of He are smaller than those of Ar, at a given temperature, the permeating flux of He is higher than that of Ar, which, in return, will result in a lower ideal selectivity of H2 to He.
Furthermore, the permeation flux of pure H2 and the ideal selectivity of H2 to Ar for the Pd/YSZ membrane were studied at various temperatures between 350 °C to 450 °C. As can be seen in Figure 4a, at each driving force, the permeation flux of H2 increases as temperature increases, which can be explained by Equation (5). According to Equation (5), the permeance of H2 follows an Arrhenius-type behavior, meaning that the permeance increases at elevated temperatures. Therefore, at a fixed driving force, the permeating flux of H2 is greatest at the highest temperature and smallest at the lowest temperature. Furthermore, it can be seen in Figure 4b that the ideal selectivity of H2 to Ar also increases monotonically as the temperature increases. By increasing the temperature, the permeance of H2 grows according to an Arrhenius-type behavior, while the permeance of Ar decreases due to a different transport mechanism, i.e., Knudsen diffusion [53]. As a result, the ideal selectivity of H2/Ar (αH2/Ar) increases as the temperature increases.

3.1.2. Binary Mixtures

The permeating flux of H2 in a mixture with other gases can be influenced by several mechanisms such as: (1) dilution of H2 in the feed side as a result of the presence of other gases; (2) H2 depletion in the bulk feed due to H2 removal along the membrane module; (3) concentration polarization or build-up of H2-depleted layer adjacent to the membrane surface due to gas-phase mass-transfer limitations; and (4) competitive adsorption of other gases on the membrane surface [8,28,54]. These factors can reduce the H2 permeating flux by either reducing the partial pressure of H2 on the retentate side, or by provoking competitive adsorption on the Pd surface by blocking the active sites [28].

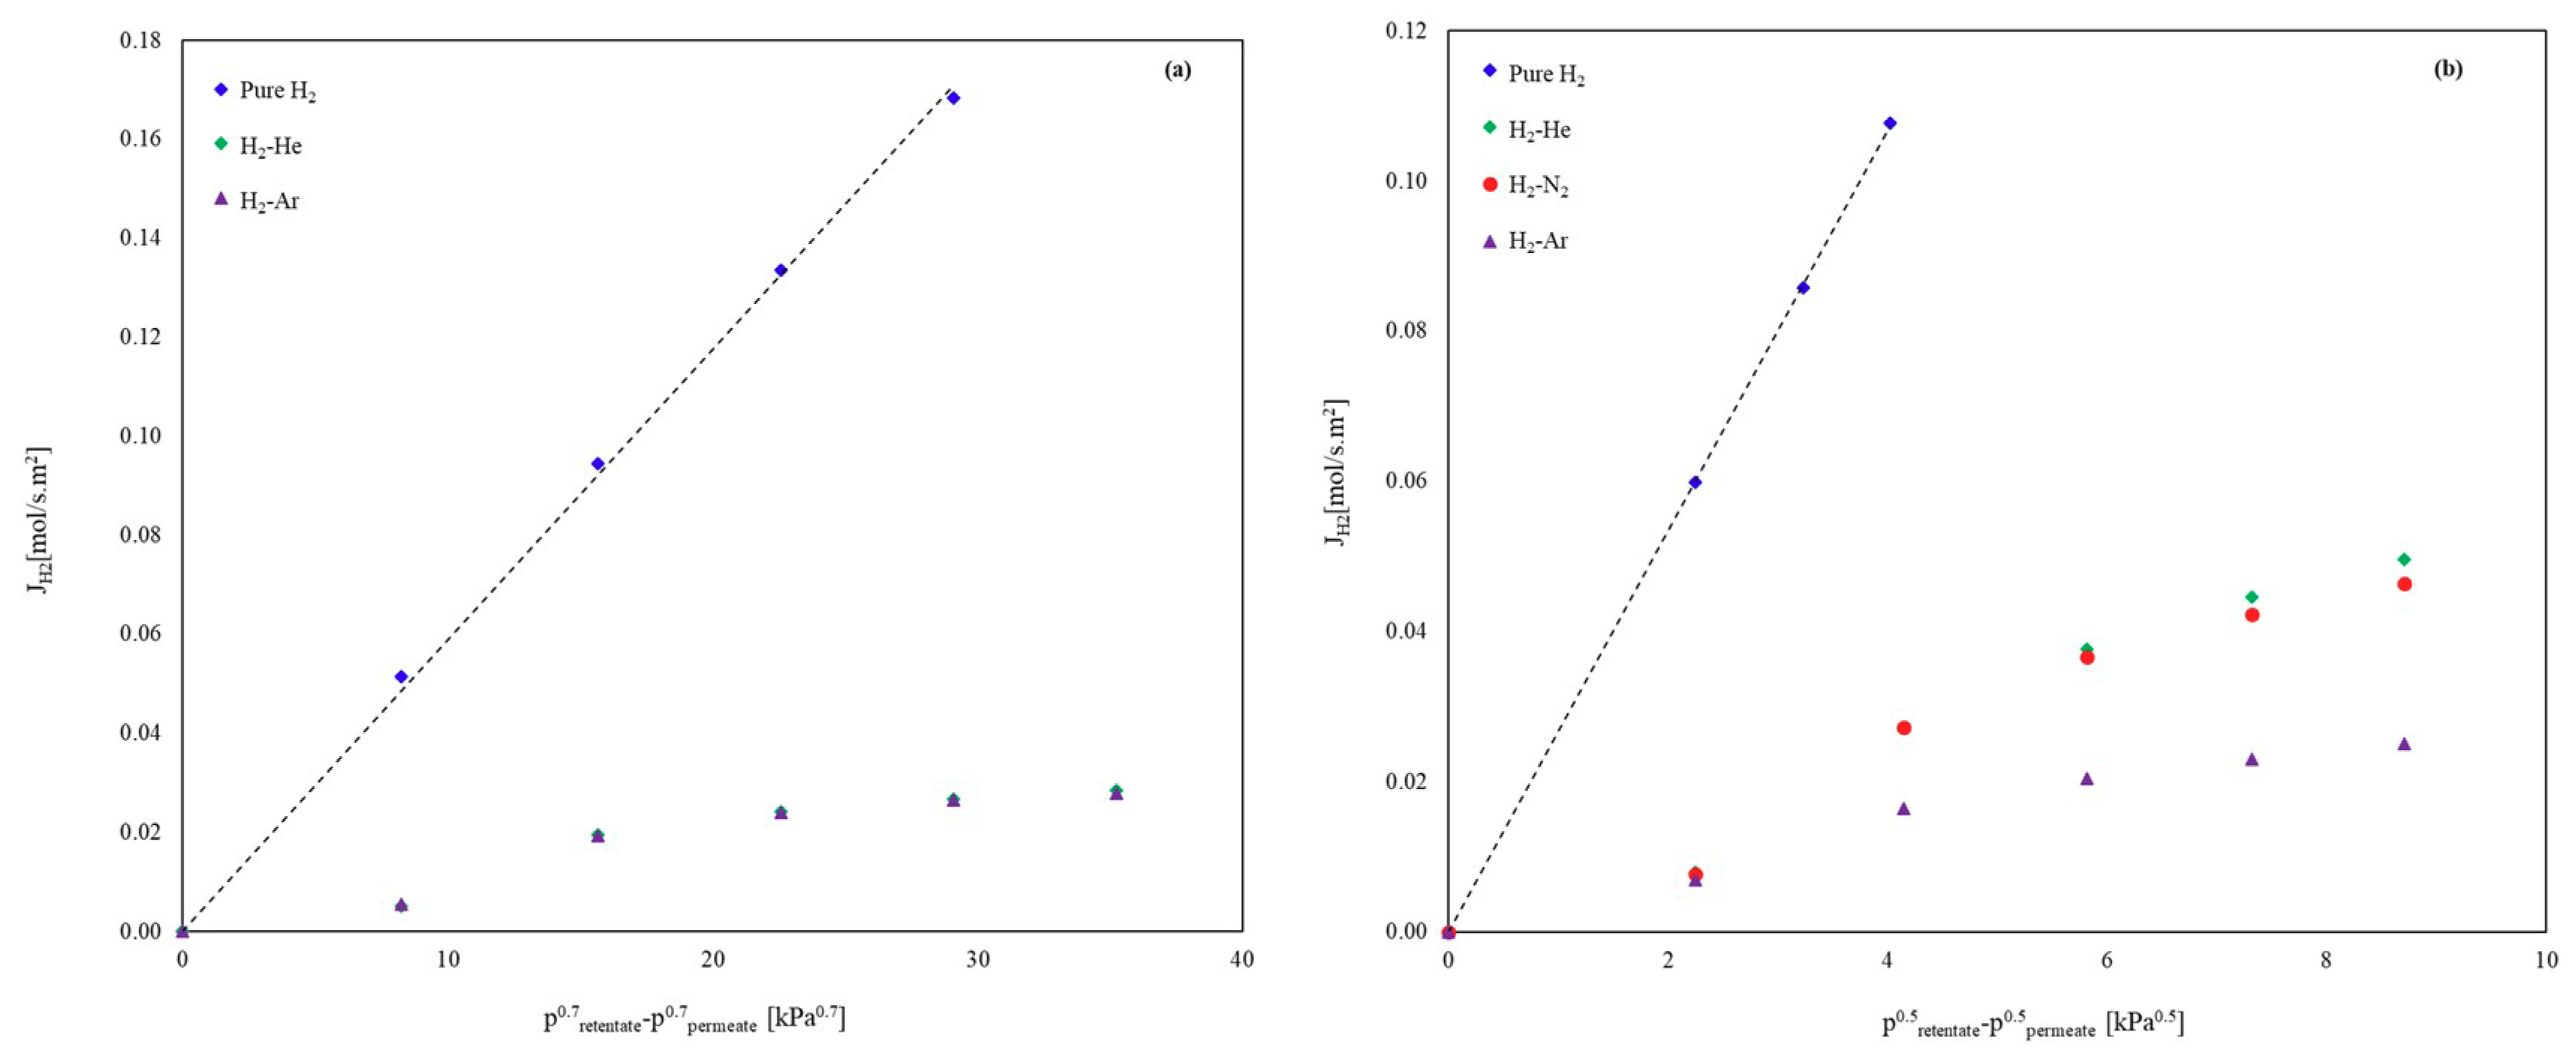
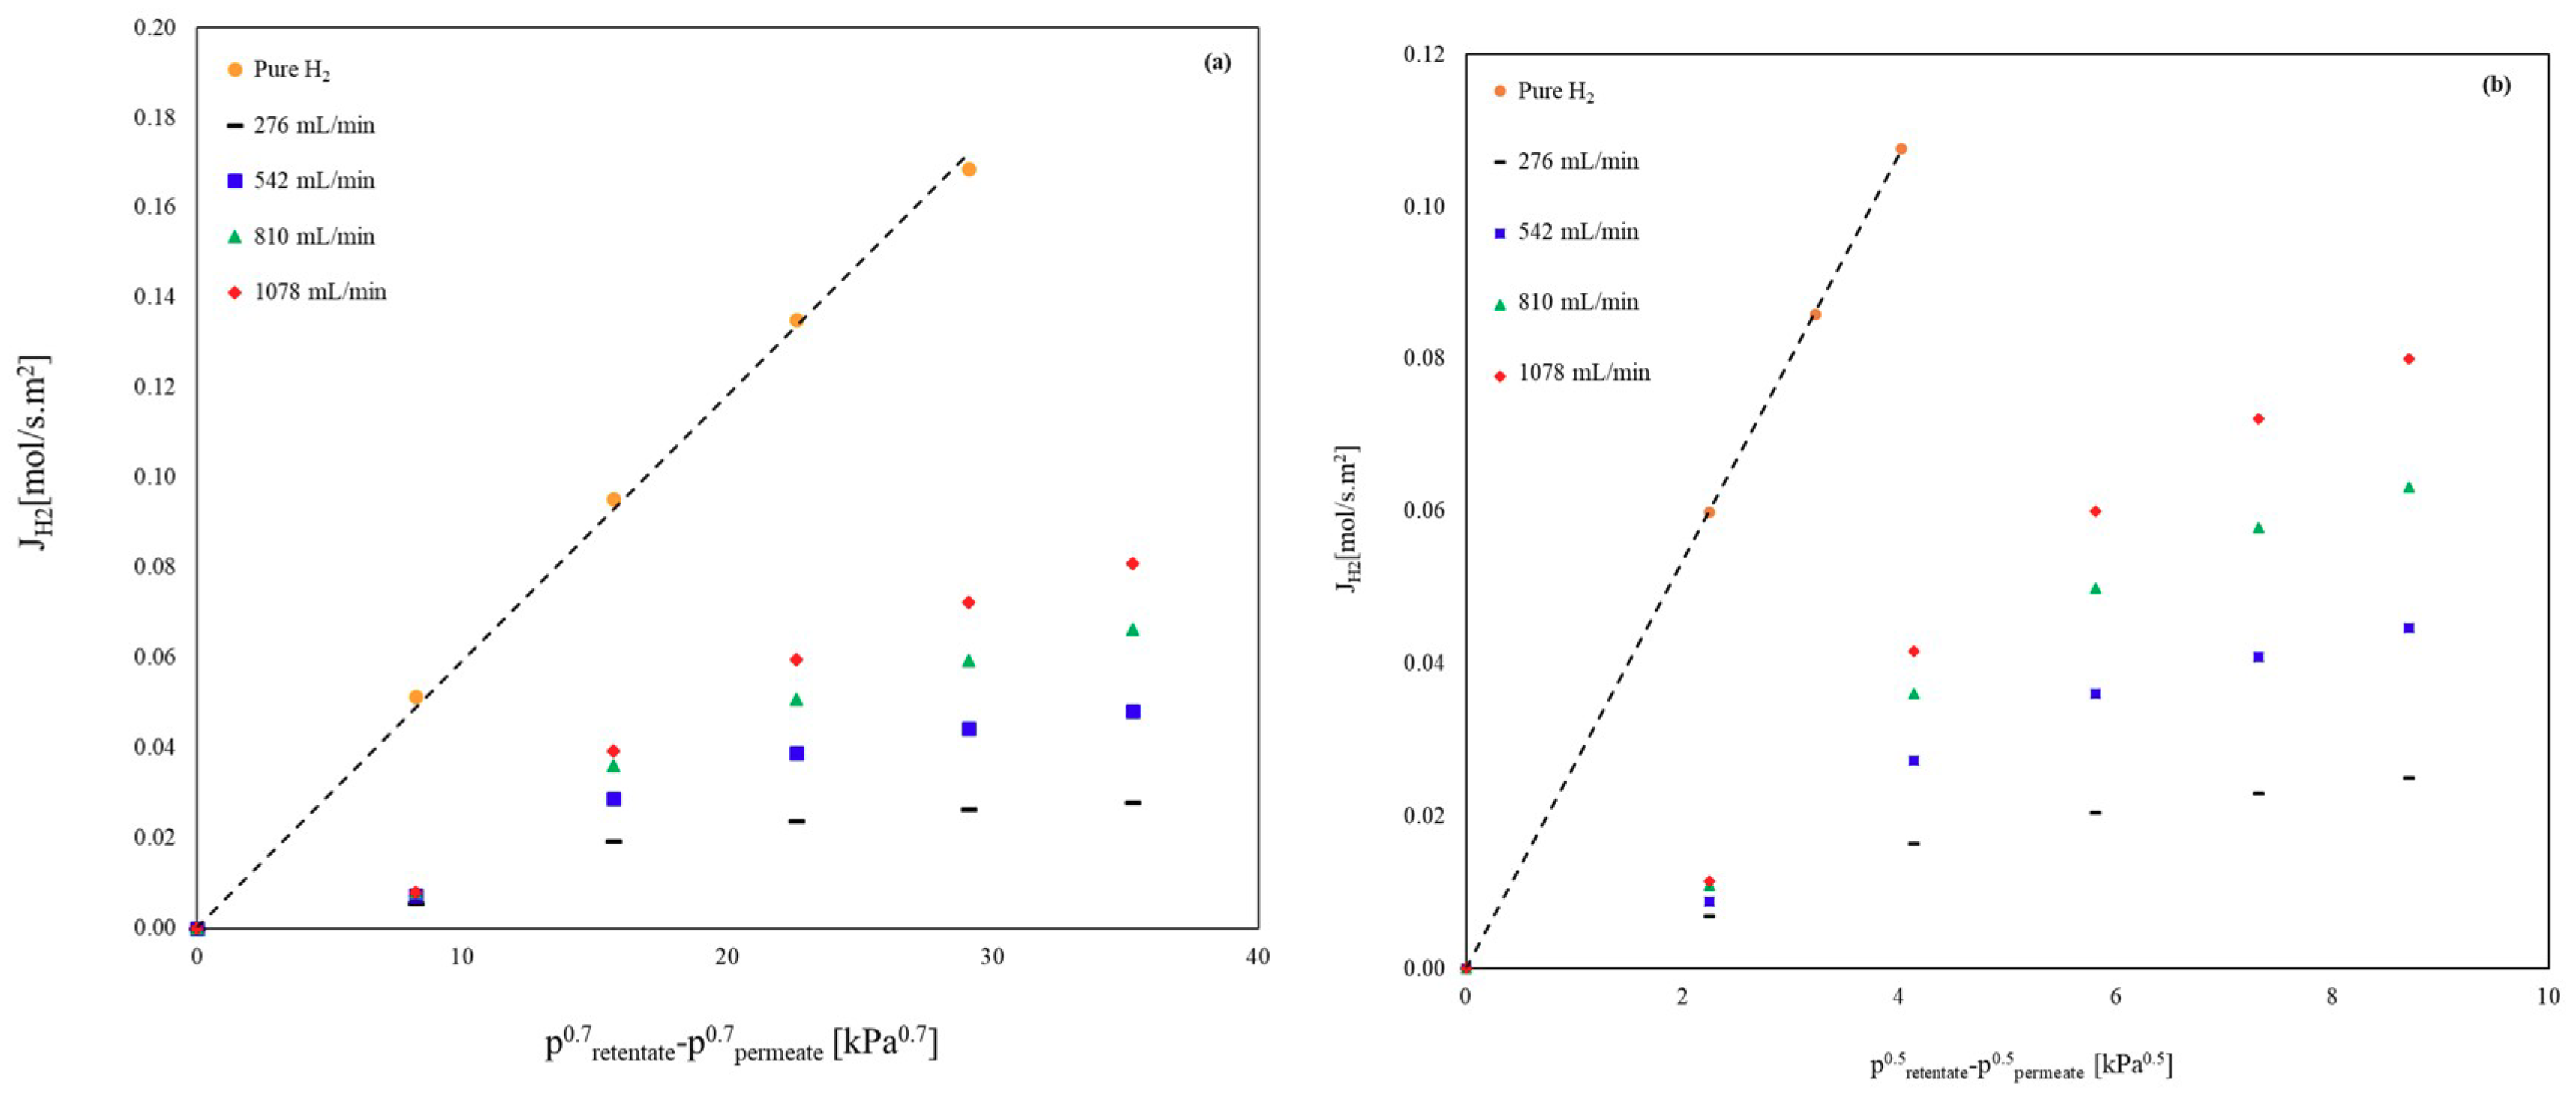
Influence of Inert Gases on the H2 Permeation

He, Ar, and N2 are assumed to be inert gases that do not adsorb on the Pd and Pd-Au surface [28,53,55,56]. Permeation tests were performed with pure H2 before and after each experiment to investigate the effects of such gases on the H2 permeating flux. Next, permeation tests with various binary mixtures using both Pd/YSZ and Pd-Au/Al2O3 membranes were performed, and H2 permeating fluxes for each gas mixture were plotted against the driving force. In the end, the permeation tests were repeated with pure H2 and the changes in permeation flux were evaluated.
As presented in Figure 5a,b, for both membranes, the permeation flux of H2 in all binary mixtures decreases significantly, compared with the pure H2 case. For instance, at 400 °C and a driving force of 8.3 kPa0.7, the H2 permeation fluxes in the binary mixtures decrease by more than 89% compared with the pure H2 permeation flux in the Pd membrane. For the Pd-Au membrane, this drop is more than 85% at a driving force of 2.25 kPa0.5. This large decrease in the H2 permeating flux cannot be simply explained by the dilution effect. The fast rate of H2 removal from the retentate side to the permeate side creates a H2-depleted “concentration polarization” layer immediately next to the membrane surface. The development of this concentration polarization layer is attributed to the mass-transfer resistance in the gas phase, which, in turn, lowers the partial pressure of H2 and subsequently reduces its flux [28,54]. The concentration polarization effect, however, is more pronounced at lower driving forces, e.g., for a binary mixture of H2/Ar in the Pd membrane, the decrease in the permeation flux of H2 from 89% to 80% when the driving force is increased from 8.25 to 15.69 kPa0.7. For the H2/Ar mixture in the Pd-Au membrane, the decrease in H2 permeation flux changes from 88% to 81% as the driving force increase from 2.2 kPa0.5 to 4.14 kPa0.5.
Furthermore, the influence of feed flow rate on the H2 permeation flux of the equimolar binary mixtures of H2 and Ar was investigated in this study. As shown in Figure 6, H2 permeation flux increases in each equimolar binary mixture with feed flow rate for both membranes. This can be explained by the fact that at higher flow rates, the mass-transfer resistance is reduced, and as a result, the H2 flux through the membrane is enhanced.

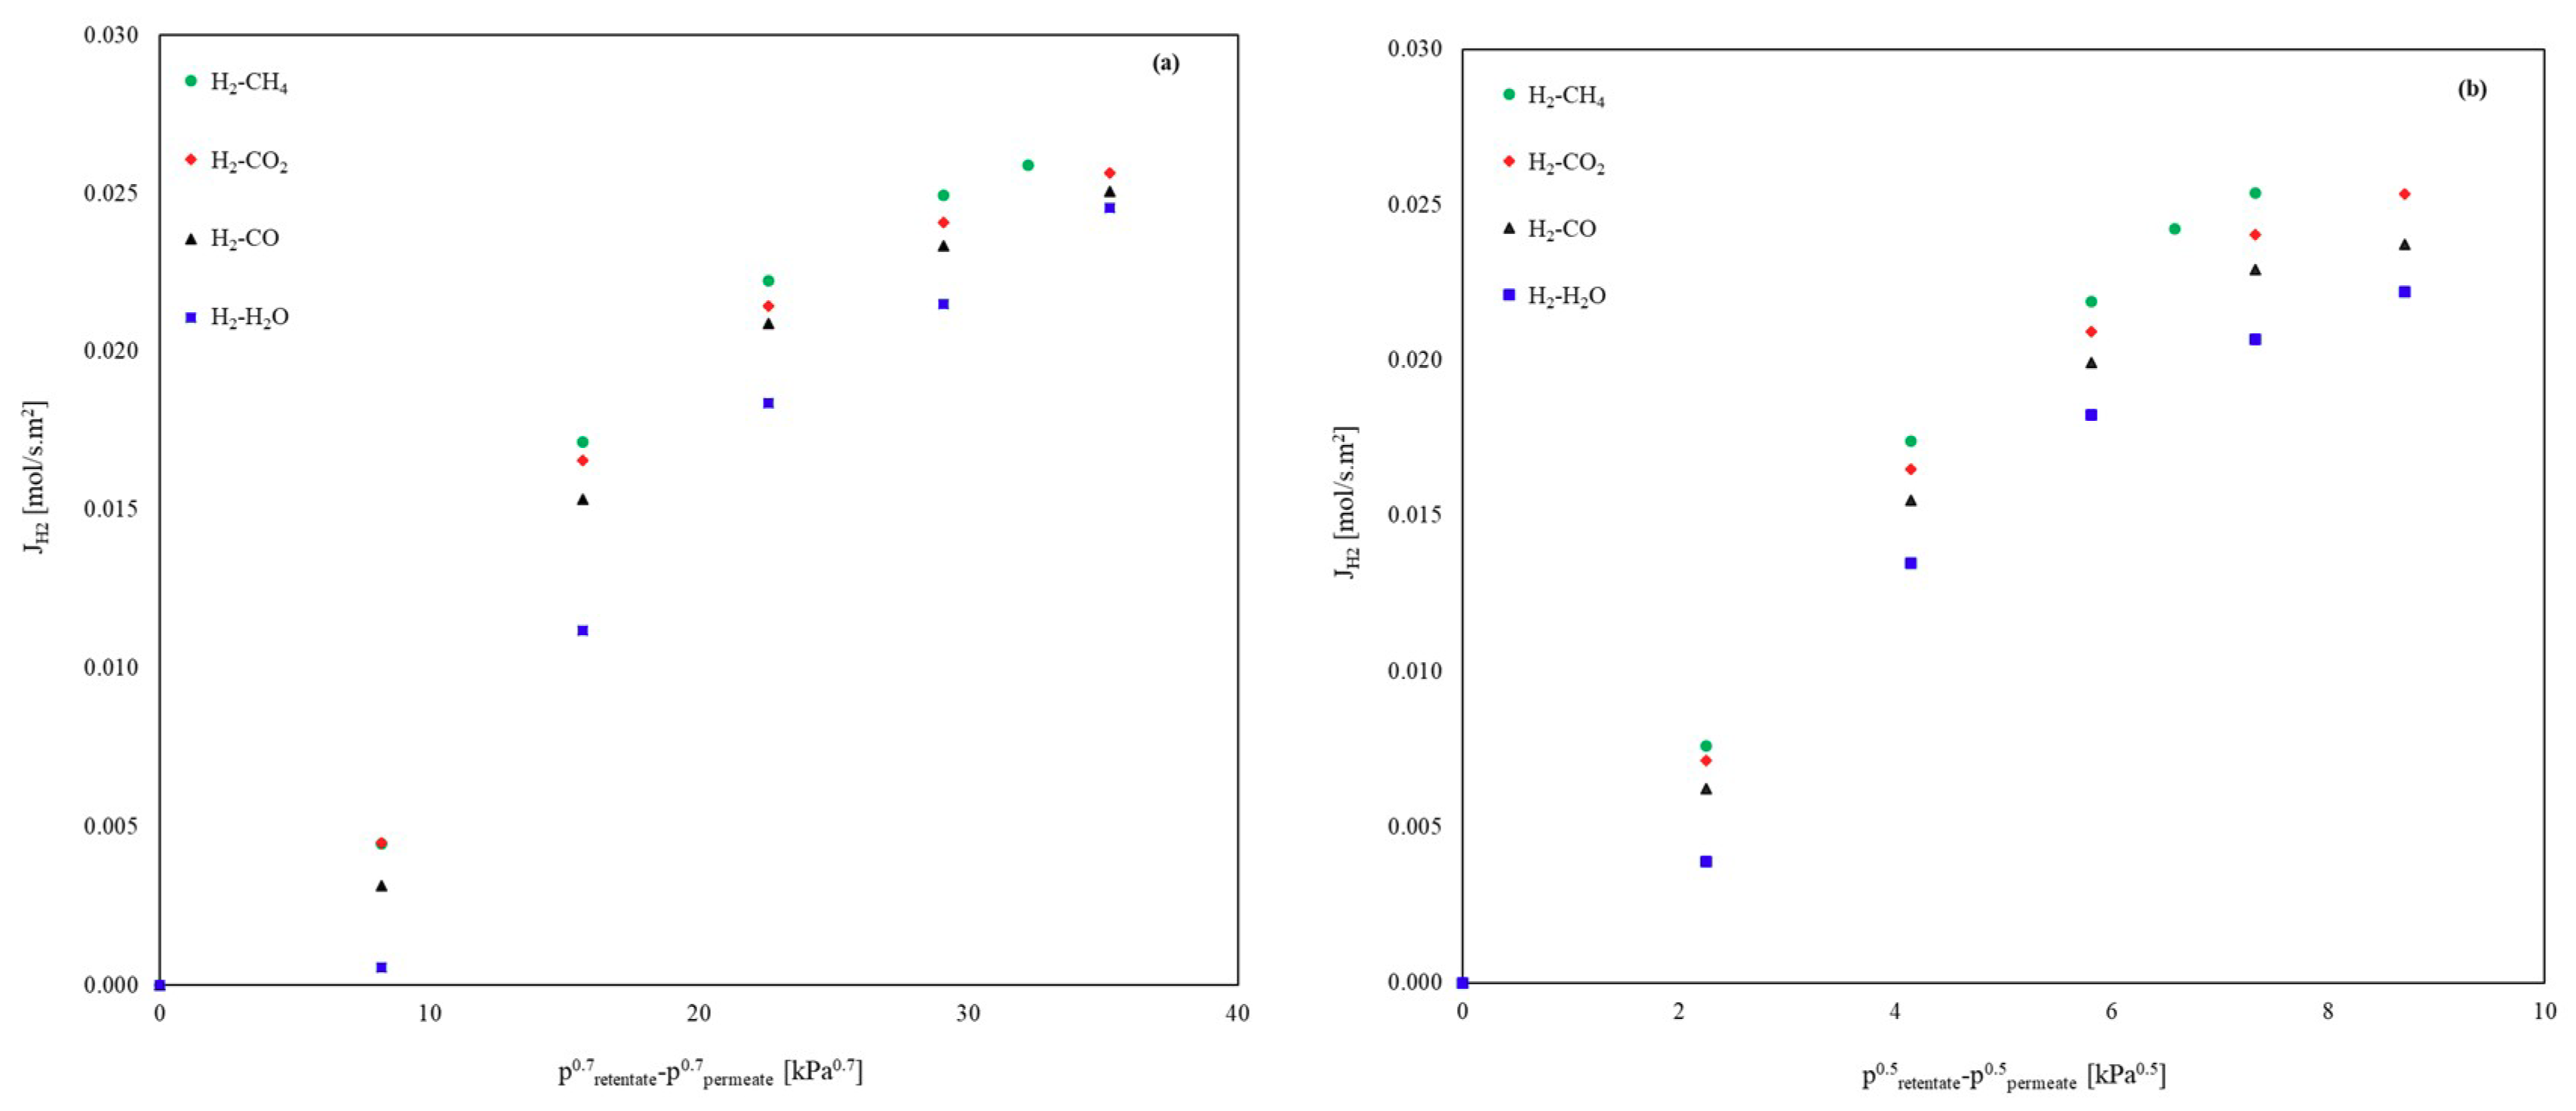
Influence of CH4, CO2, CO and H2O on the H2 Permeation

The influence of several non-inert gases on the H2 permeating flux was studied by feeding the binary mixture as reported in Table 1, and the results are shown in Figure 7 for both Pd/YSZ and Pd-Au/Al2O3. As can be seen in Figure 7a, at 400 °C and a driving force of 10 kPa0.7, steam has the most adverse effect on the H2 permeating flux, with 88% of flux reduction compared with pure H2 for Pd membrane. Similarly for Pd-Au membrane, steam shows the worst effect on the permeation flux of H2, with an approximately 87% decrease in the permeating flux of H2 of at a driving force of 10 kPa0.5. CO has the second worst effect on the permeating flux of H2. At the same operating conditions of pressure and temperature, the permeating flux of H2 decreases by 80% and 85% for Pd and Pd-Au membranes, respectively. CH4 shows the lowest decrease in H2 permeating flux, and exhibits a similar reduction to Ar. The main reason for this behavior is that CH4 has negligible surface adsorption on the Pd layer, while CO and CO2 show a strong affinity toward Pd. CO, CO2, and steam are considered as competitively-adsorbing inhibitors that show high affinity toward the Pd surface [54]. According to Amano et al., the adsorption of even small amounts of CO and CO2 on the Pd surface causes a significant decrease in the effective surface area for the dissociation of H2 molecules, hence causing “blanketing” effects [57]. The CO molecules in particular can block the H2 adsorption sites and/or increase the activation barrier for dissociation and desorption of H2 molecules [58,59]. It is worth noting that the operating conditions, as well as CO concentrations of as low as 5%, could have a significant effect on the H2 flux.
The mechanism by which steam reduces the H2 permeation flux is different than that of CO, however. The presence of steam molecules in the mixture could result in the formation and adsorption of oxygen atoms through H2O decomposition/recombination, which can poison the active surface of Pd [8]. In this work, for the permeation tests using gas mixtures, the permeating flux of pure H2 was measured before and after each experiment to evaluate the influence of each component on the permeating flux of H2. These results show that, on average, the H2 permeating fluxes immediately after the permeation tests decreased by 0.5%, 3.7%, 5.5%, and 8.7% compared with the H2 permeating fluxes immediately before the permeation tests for H2-CH4, H2-CO2, H2-CO, and H2-H2O binary mixtures respectively. These reductions, however, were reversible, and the permeation fluxes of H2 were restored to the initial values after approximately 7 h for H2-H2O mixtures, and approximately less than 3 h for H2-CO2, H2-He, and H2-CO mixtures.

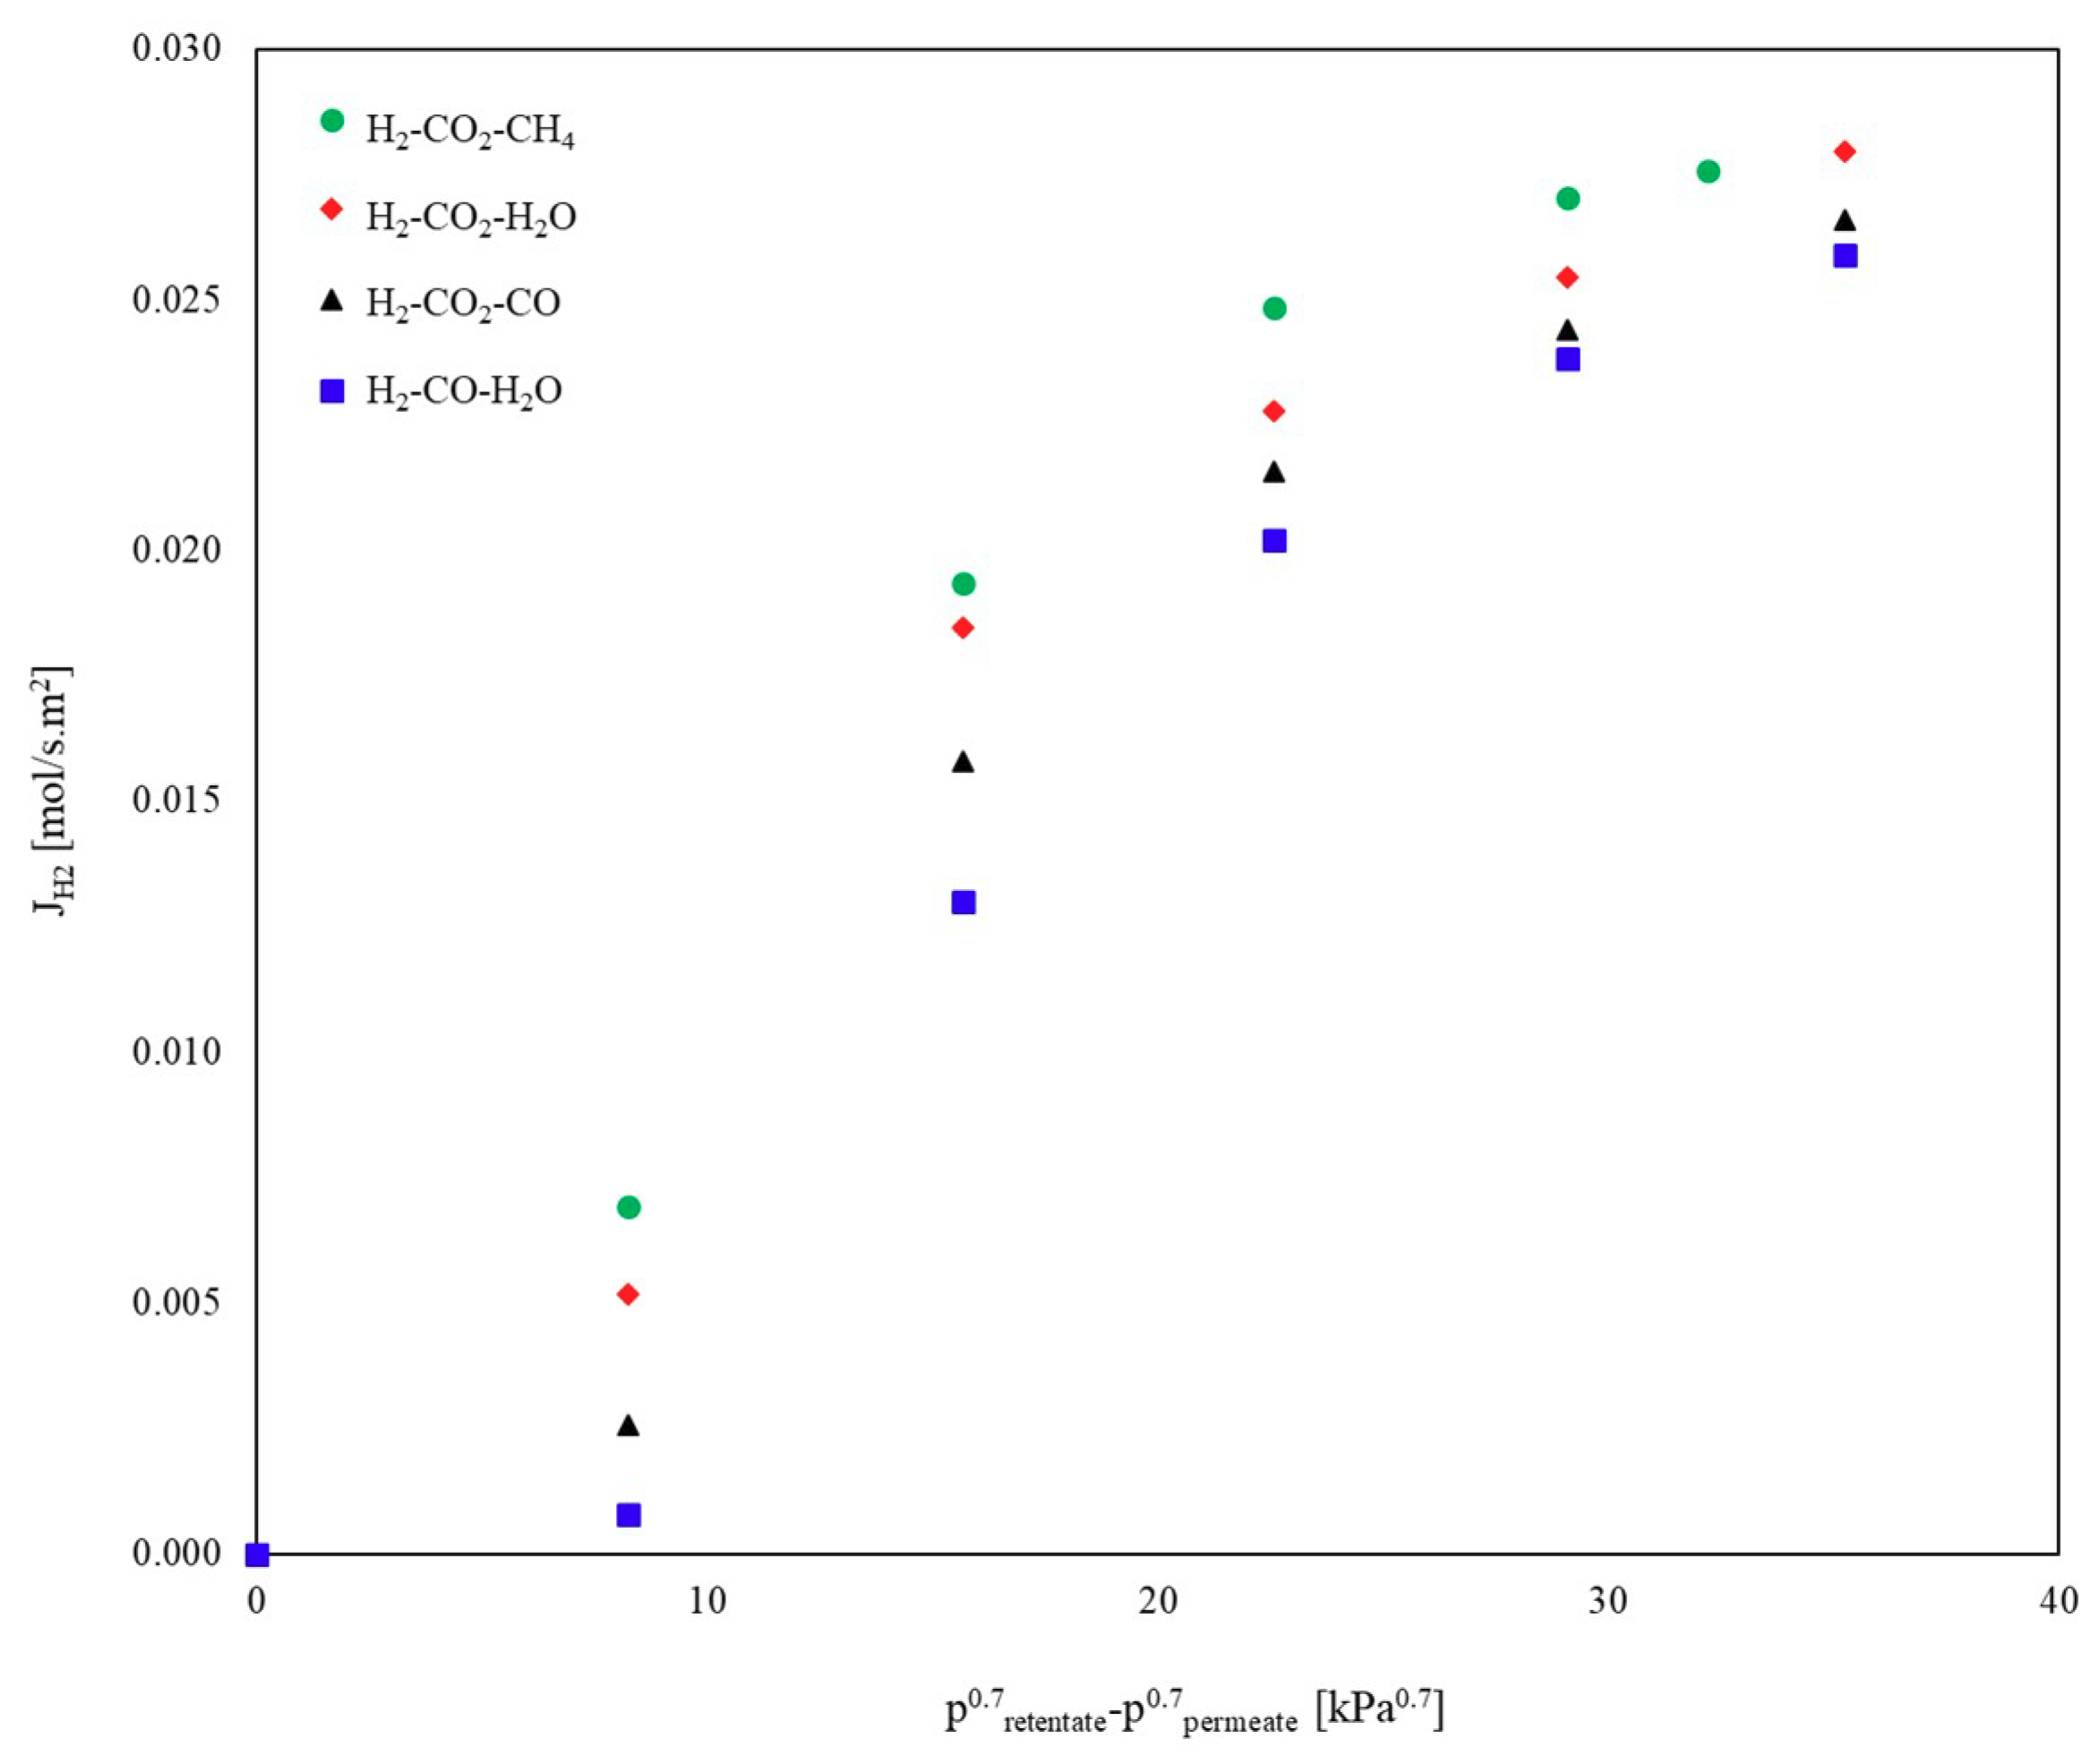
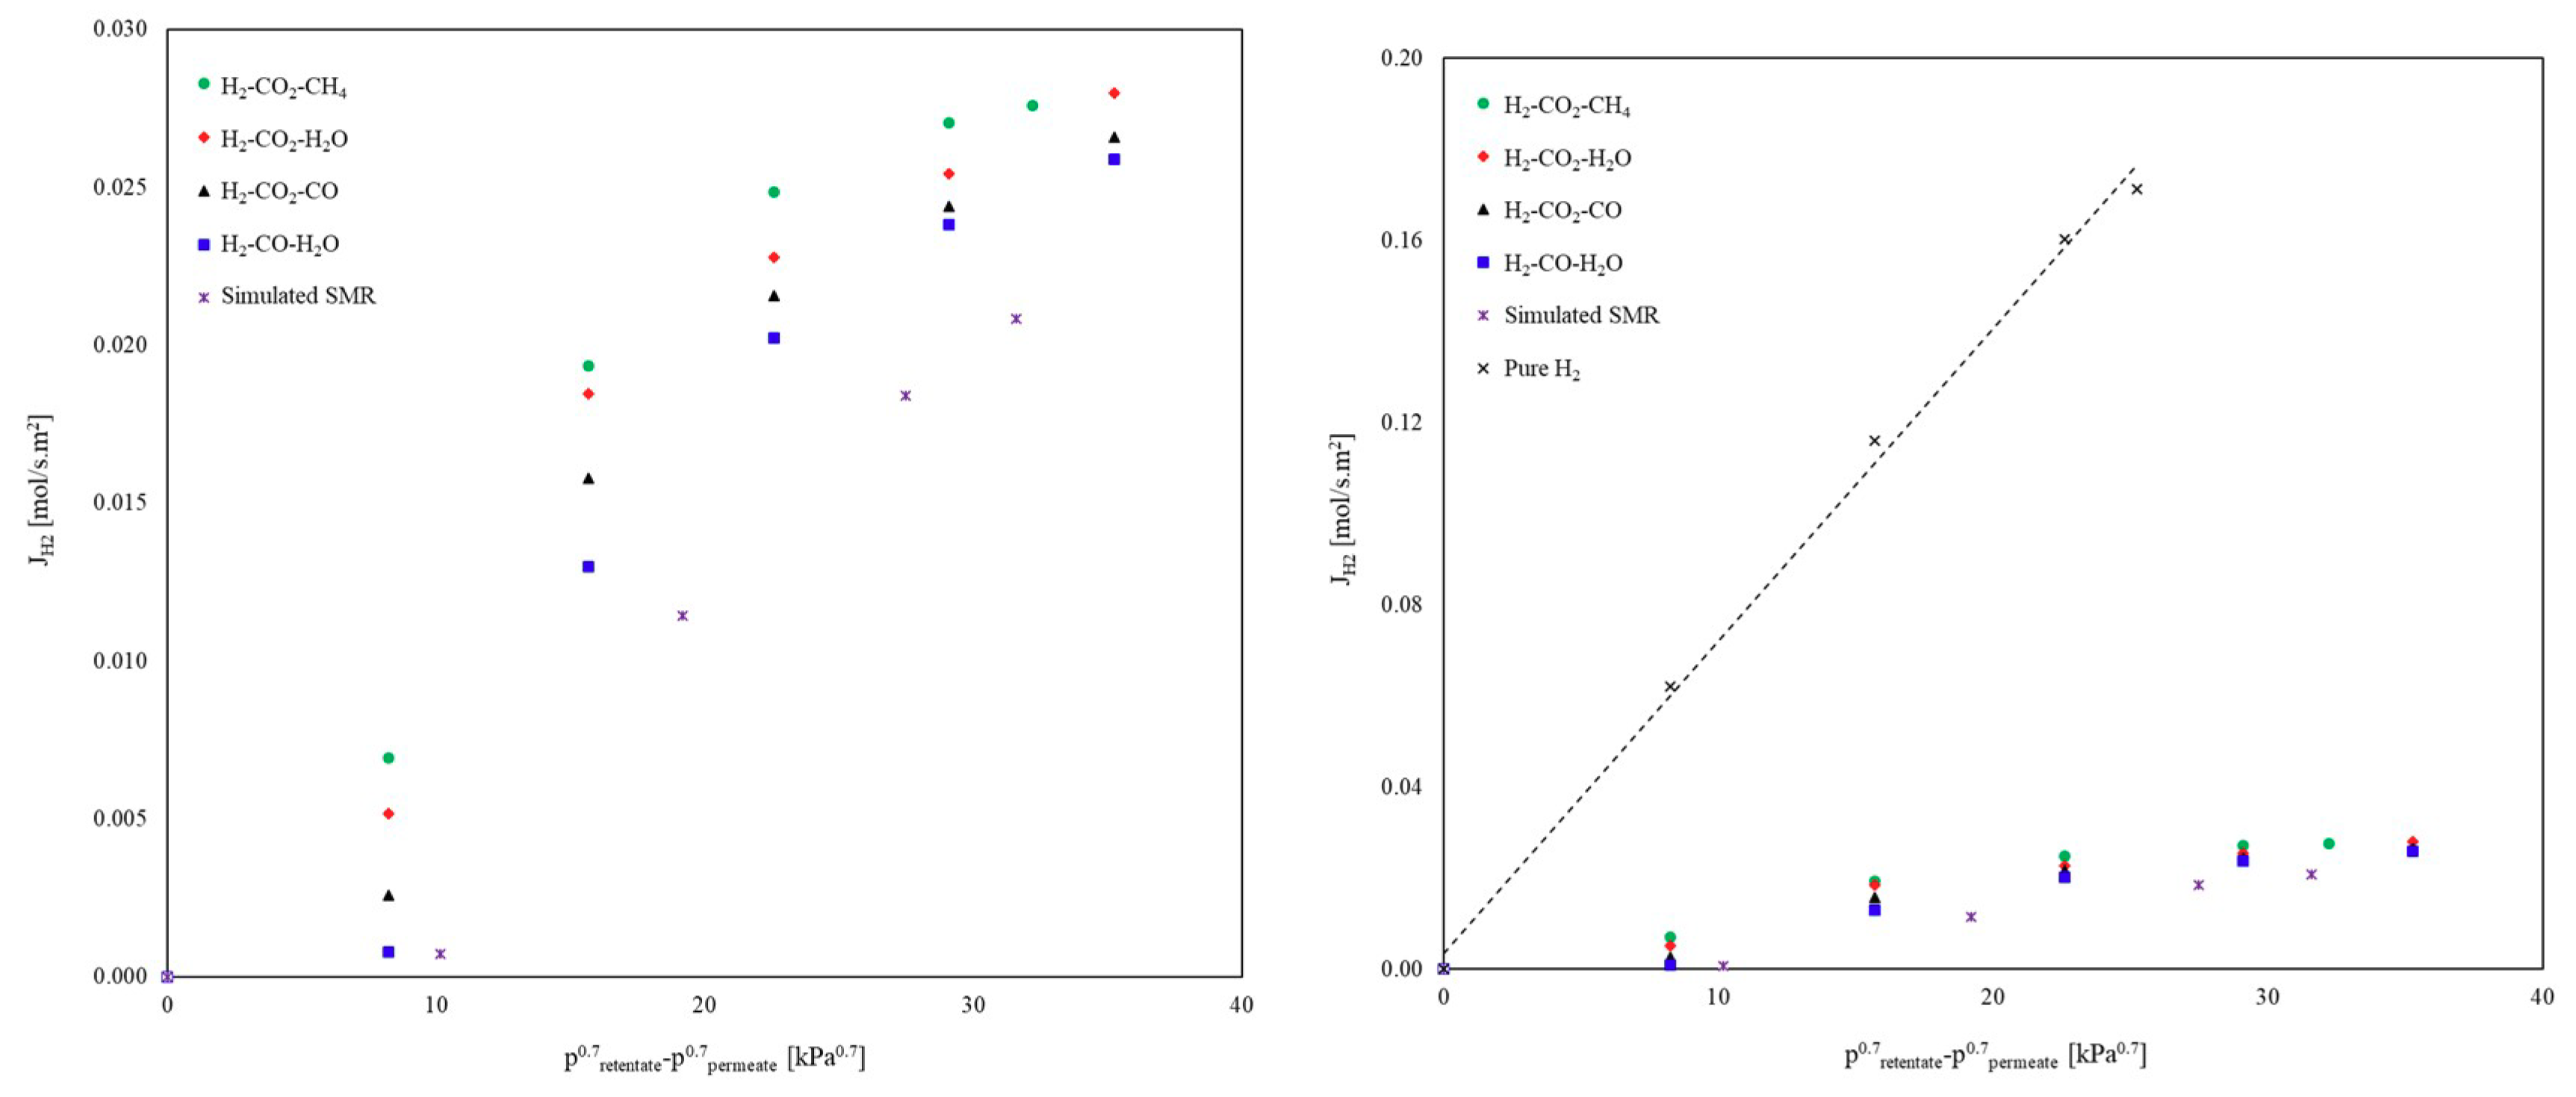
3.1.3. Ternary Mixtures

Throughout the ternary mixture investigations, the molar concentration of H2 in all experiments was held constant at 50%, while the other impurities/components were added to the mixtures with concentrations as reported in Table 1. The influence of impurities and SMR components in ternary gas mixtures is presented in Figure 8. As shown on this figure, the mixture of H2/CO/H2O has the greatest adverse effect on H2 permeating flux. This may be due to the competitive adsorption nature of CO and decomposition/recombination effect of steam combined, together leading to an increased reduction of the permeating flux of H2.
The mechanism by which the mixture of H2/CO2/CO affects the H2 flux is competitive adsorption between the CO, CO2, and H2 molecules for the active sites on the Pd surfaces, while in the ternary mixture of H2/CO2/CH4, the competitive adsorption, dilution, and concentration polarization mechanism plays an important role [28,54,57,58,59].

3.1.4. Simulated SMR Stream

The simulated stream of the SMR reaction was prepared with the compositions reported in Table 1. A S/C ratio of 2.0 was used during the first set of experiments. The results of the simulated SMR stream are plotted and compared against the ternary mixture as well as the pure H2 systems, as shown in Figure 9. It can be clearly concluded form this figure that when all the reformed stream components are present in the feed mixture, the H2 permeation flux is reduced the most. In a simulated SMR stream, the negative effects of concentration polarization, dilution, and depletion of H2 (resulting from existence of CH4 and He in the feed stream), combined with the negative effects of competitive adsorption (due to existence of CO and CO2 in the feed stream) and the decomposition/recombination effect of steam, will reduce the permeating flux of H2 even more compared with the ternary mixture. From the data presented in Figure 9, it can be calculated that at a driving force of 22.6 kPa0.7, the H2 permeating flux in the ternary mixture of H2-CO2-CH4 decreases by 84% compared to the permeating flux of pure H2. This decrease is 91% for the simulated SMR stream. In other words, the H2 permeating flux of the simulated SMR stream is 43% lower compared with the ternary mixture of H2-CO2-CH4 at the same driving force. This result confirms the conclusion that the negative effects of concentration polarization and surface adsorption enhance the decrease in the H2 flux.

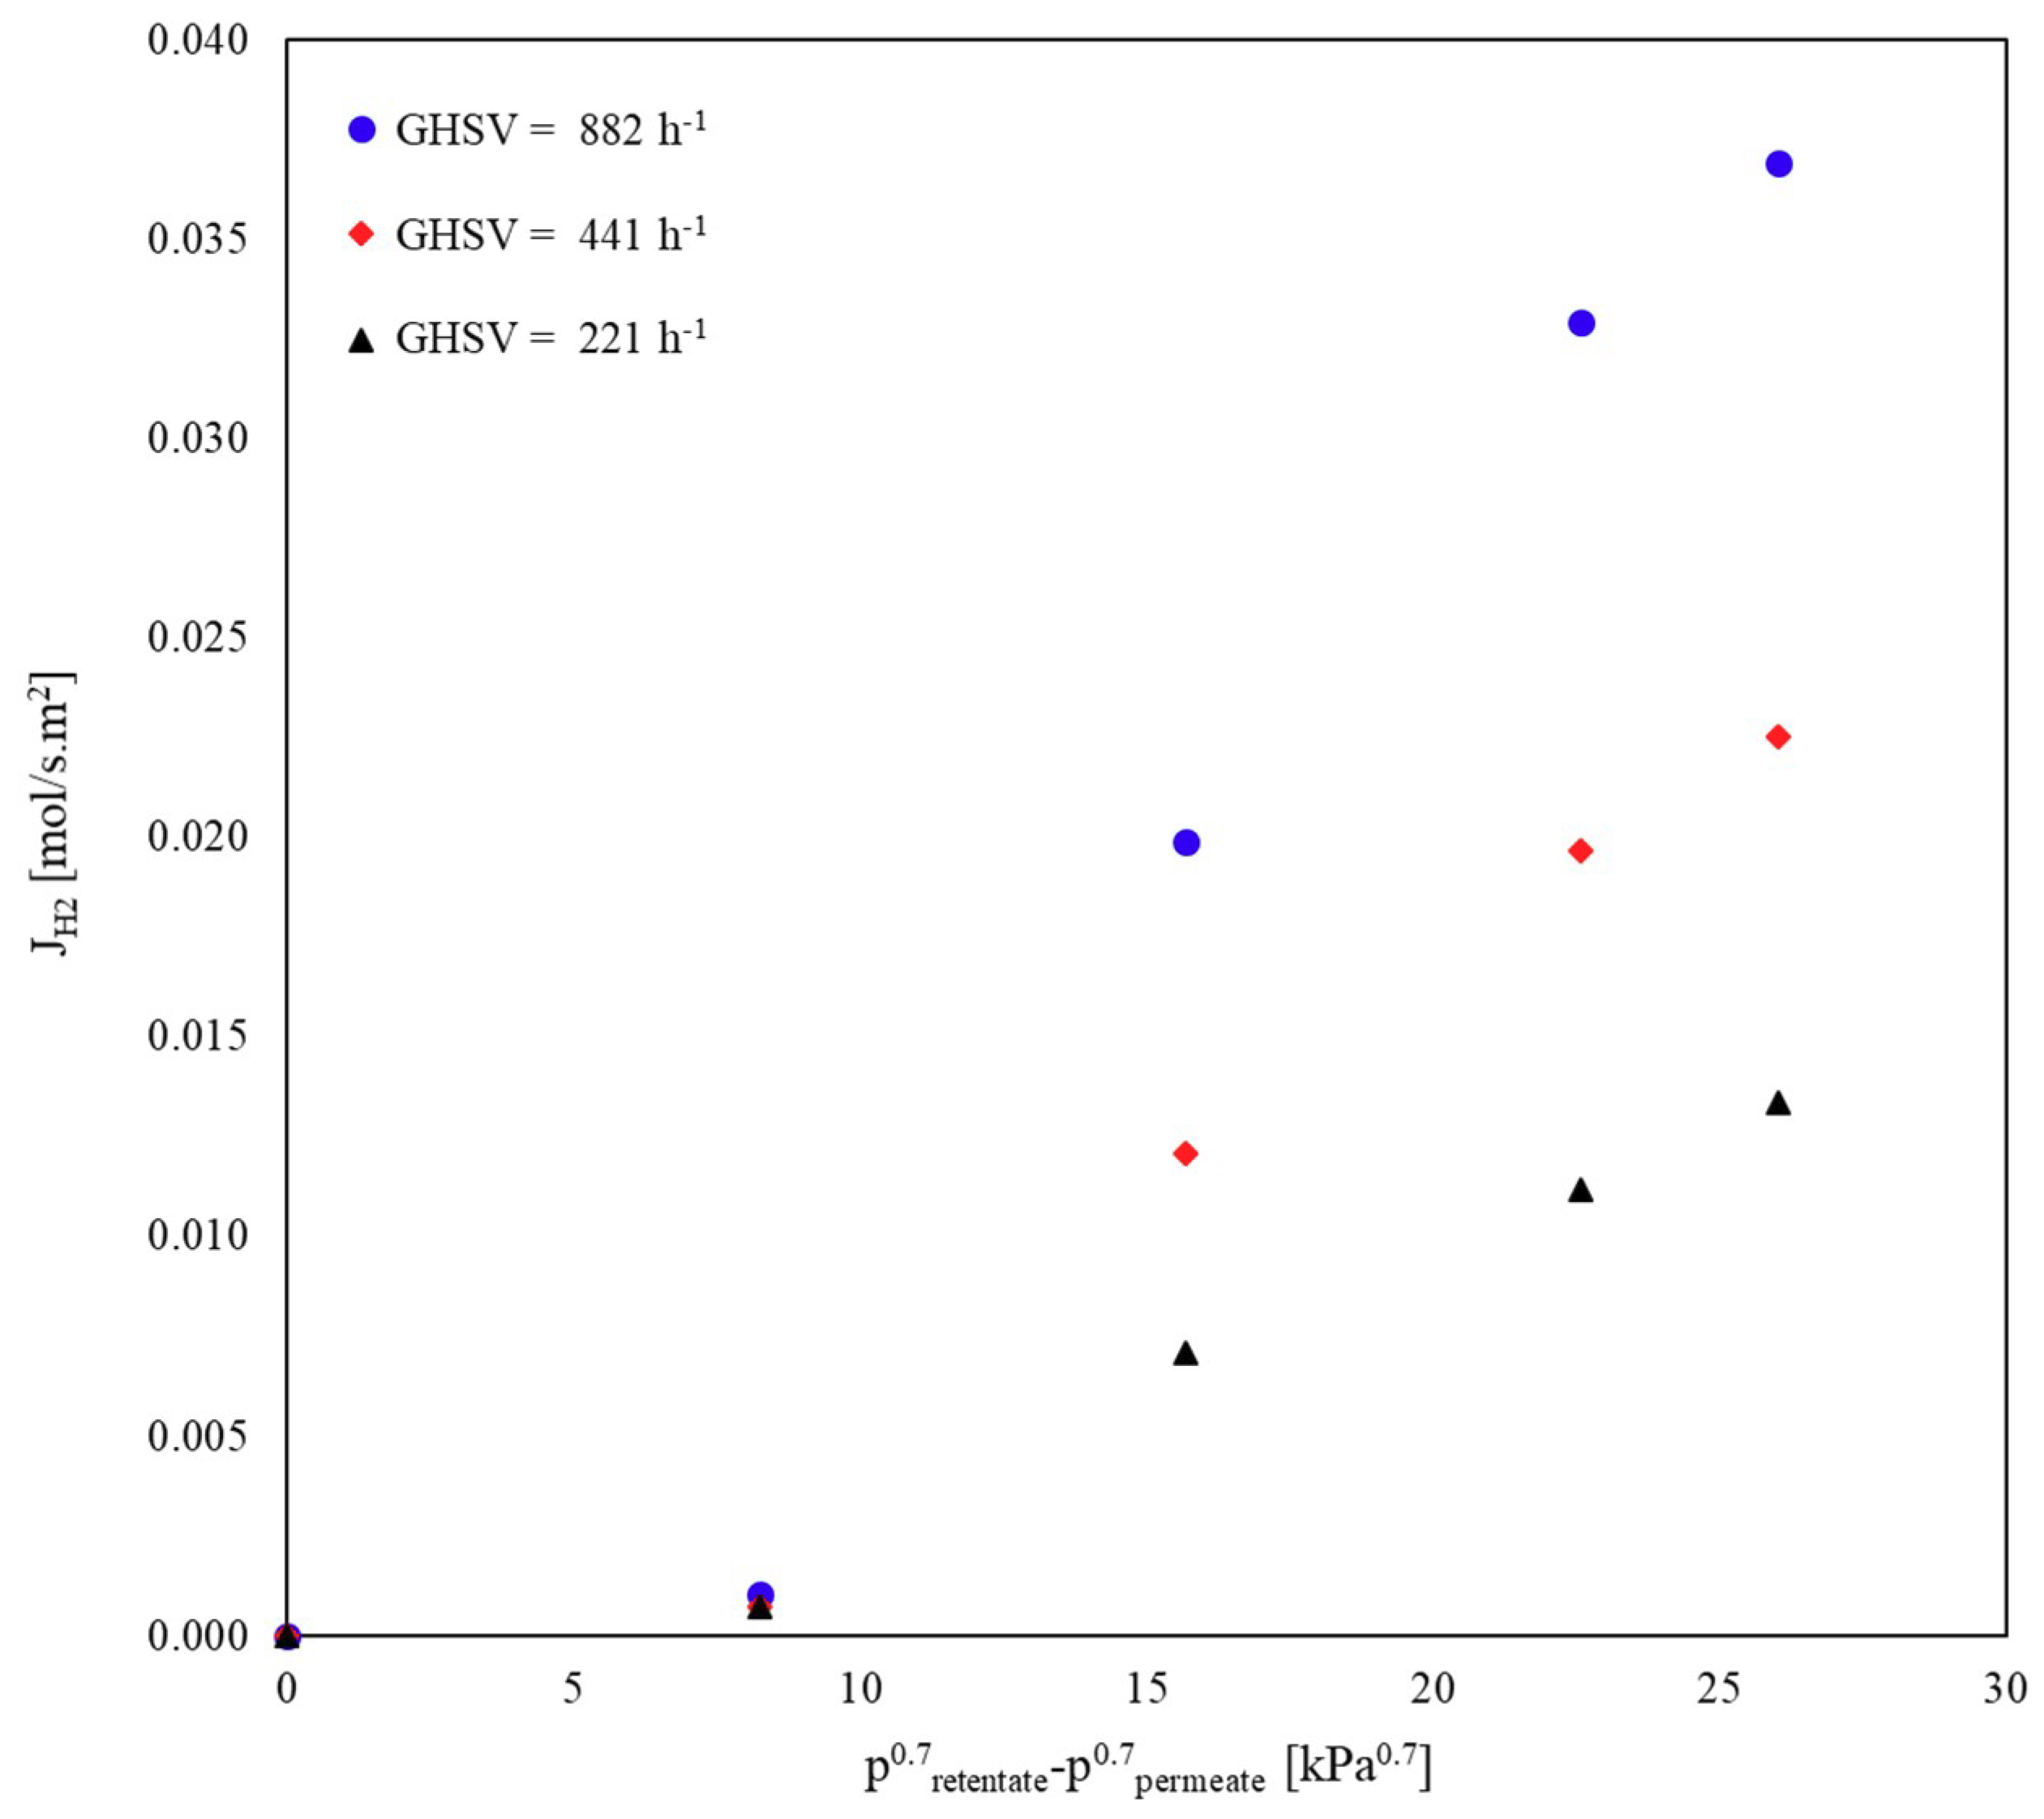
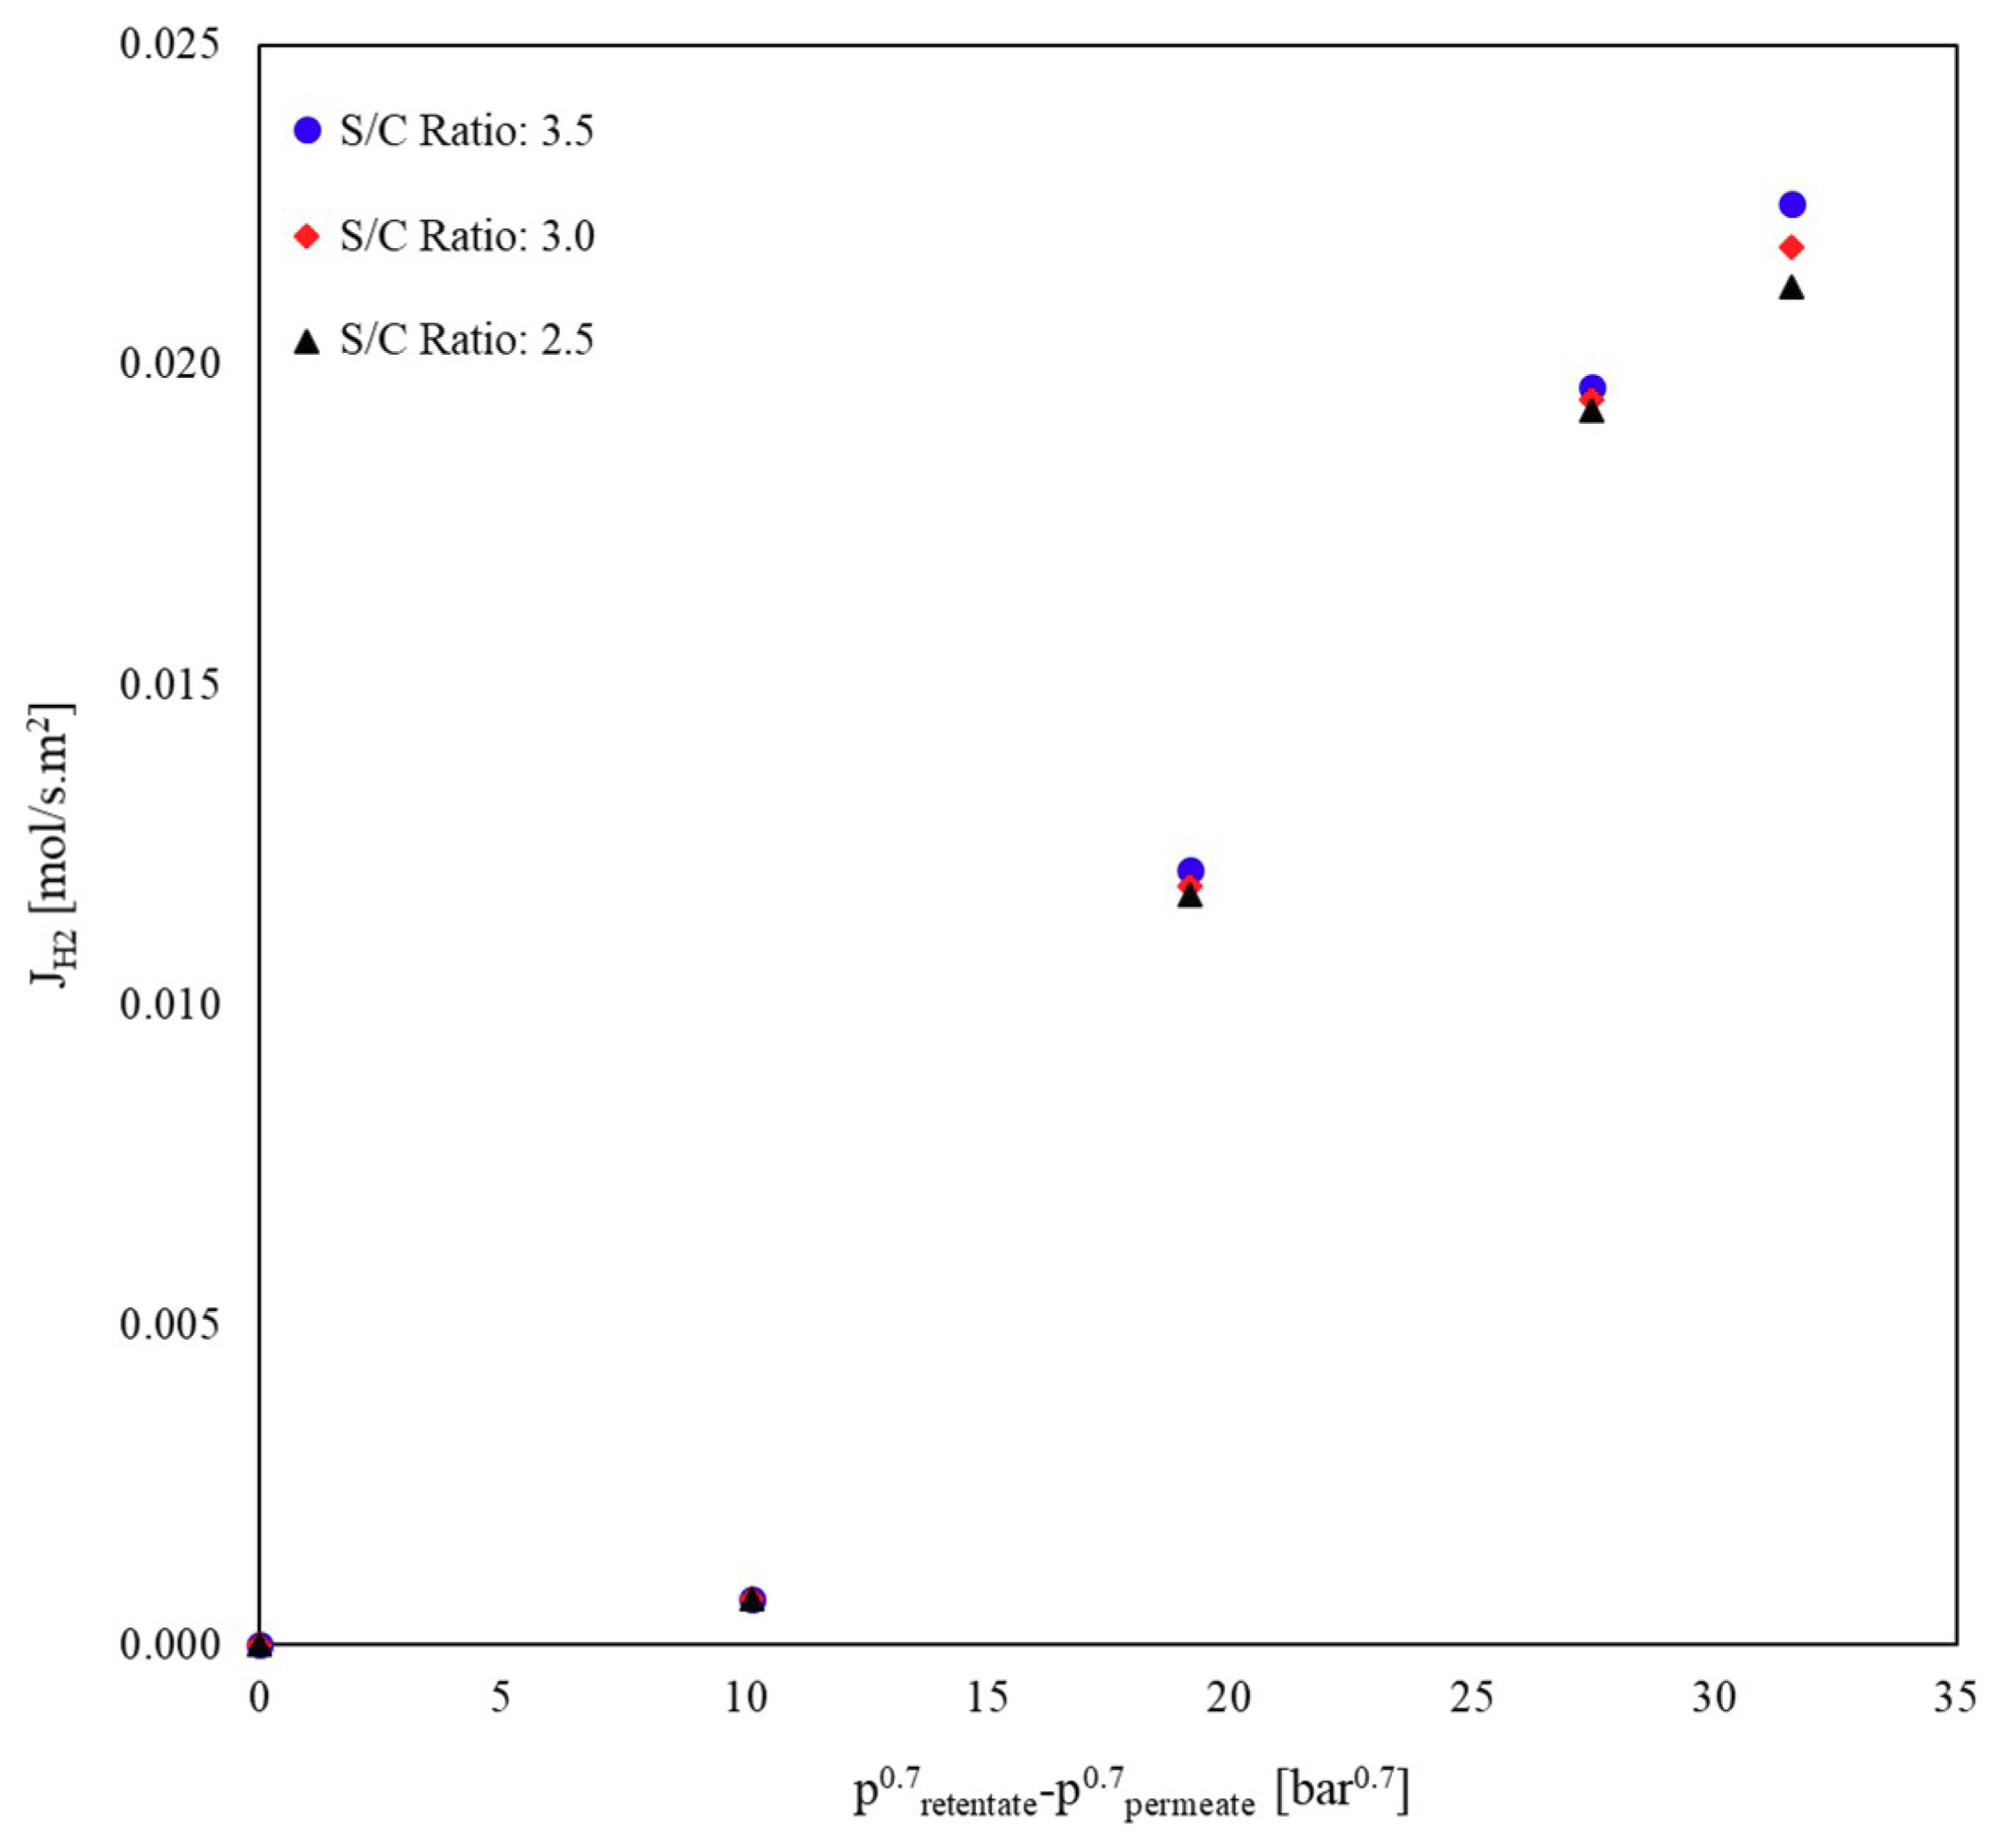
Influence of GHSV and S/C Ratio on the H2 Permeation

The final set of permeation tests was performed to study the effects of GHSV and S/C ratio on the H2 permeation flux in a simulated SMR stream. The molar concentration of all gases used in the simulation can be found in Table 1. In the study of GHSV, the value of S/C ratio was fixed at 3.5. The GHSV is calculated by dividing the total flow rate of gases in the membrane over the active volume of the membrane, with the GHSV initially set at 441 h−1. Next, the GHSV was changed to 882 h−1 (2x the initial value) and 221 h−1 (half of the initial value). The permeation results for all cases are presented in Figure 10. As shown in this graph, there is a strong positive correlation between the GHSV and the H2 permeating flux. In general, the H2 permeating flux increases with GHSV. This could be attributed to the fact that at higher space velocities, the mass-transfer resistance in the gas phase decreases, leading to a reduction in the concentration polarization effect. In particular, by doubling or halving the GHSV, the H2 permeation flux increases by a factor of 1.6, and decreases by a factor of 1.7, respectively.
The effect of the S/C ratio was changed between 2.0 and 3.5 while keeping the GHSV constant at 441 h−1. As shown in Figure 11, the S/C ratio does not have any significant effect on the H2 permeation flux. It is worth mentioning that the industrial SMR reaction is performed at S/C ratios greater than 3/1, only to maintain the catalyst activity during the reaction [60]. High S/C ratios do not change the thermodynamic conditions of the SMR reaction, and only favor the kinetics of the reaction by keeping the catalyst from deactivation, which is caused by formation of fibrous carbon on the interface of the Ni catalyst [61]. In this study, the permeation tests have been investigated by simulating SMR streams, and no real reaction is performed. Hence, the value of the S/C ratio has no effect on the permeating flux of H2, as shown in Figure 11. However, the low S/C ratio can affect the performance of the MR during the reaction test through the deposition of coke on the catalyst active sites and membrane.

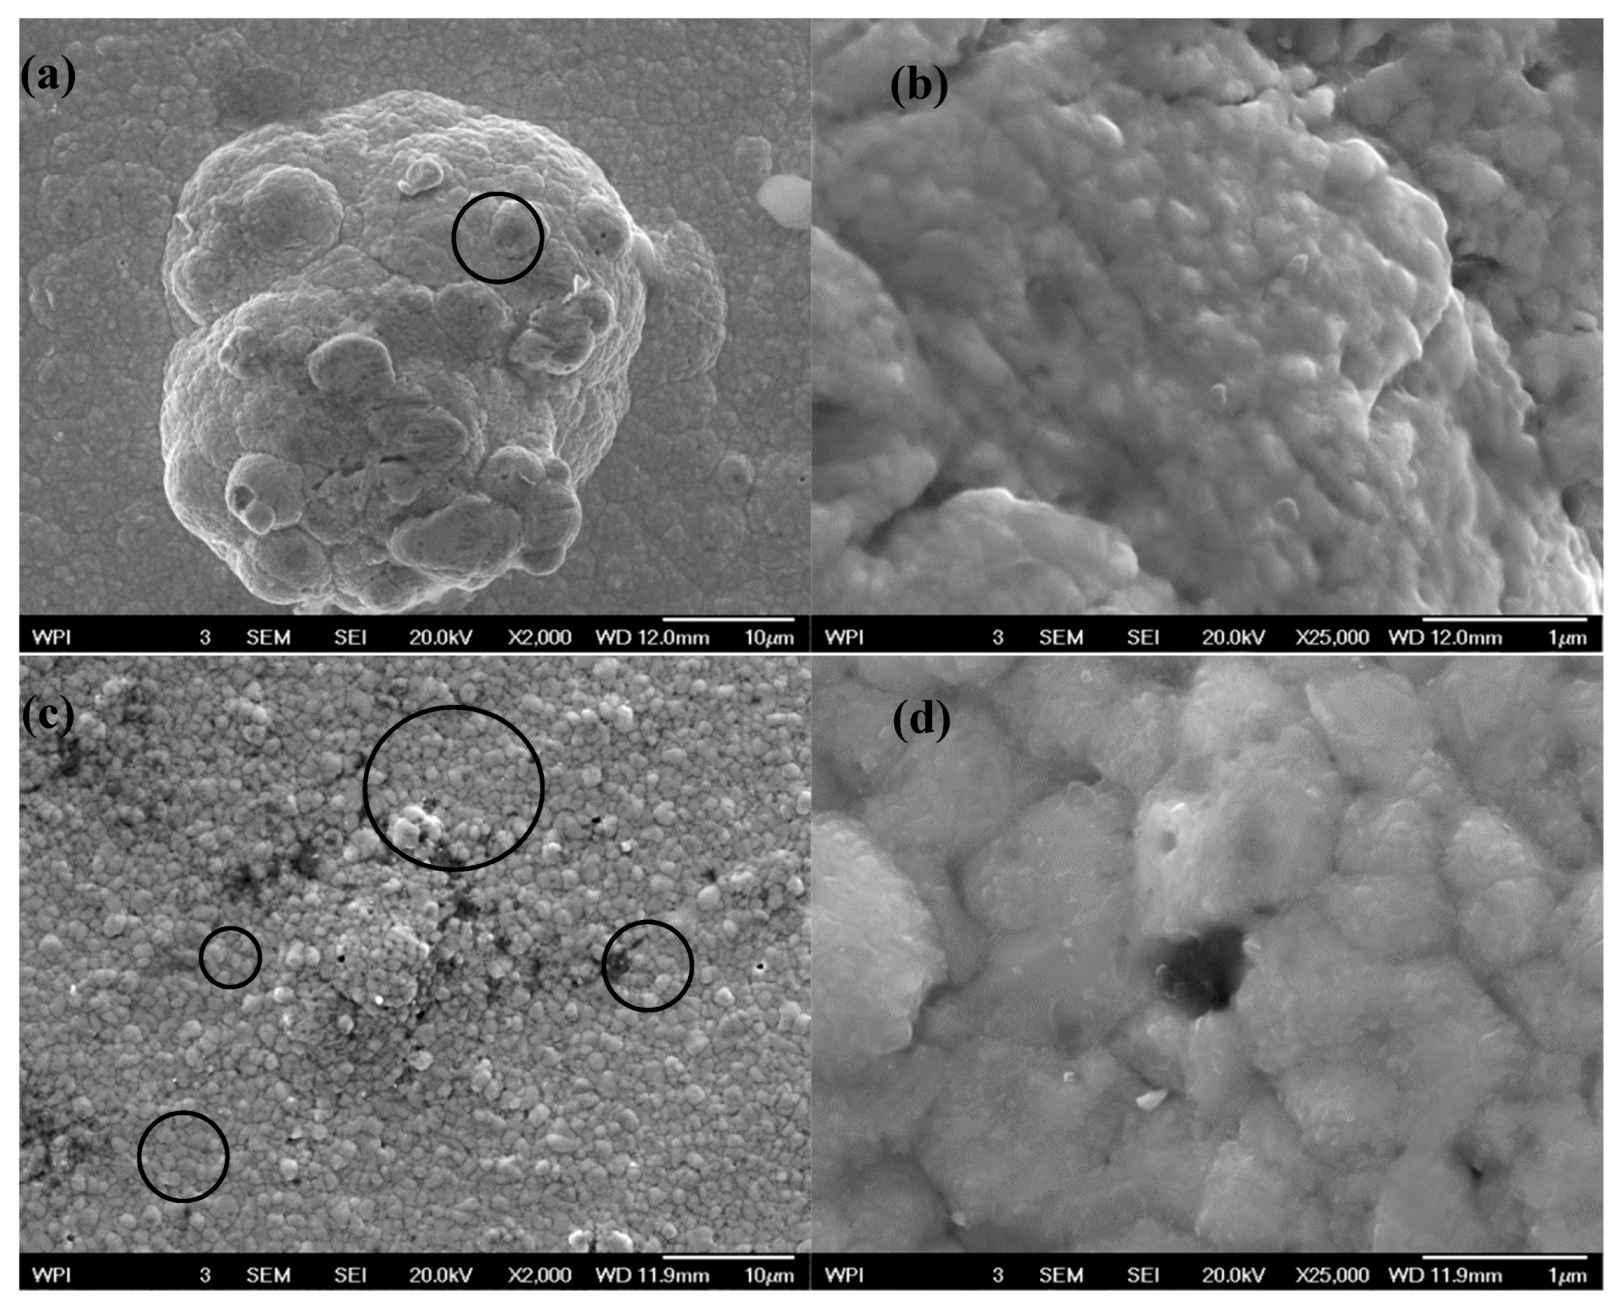
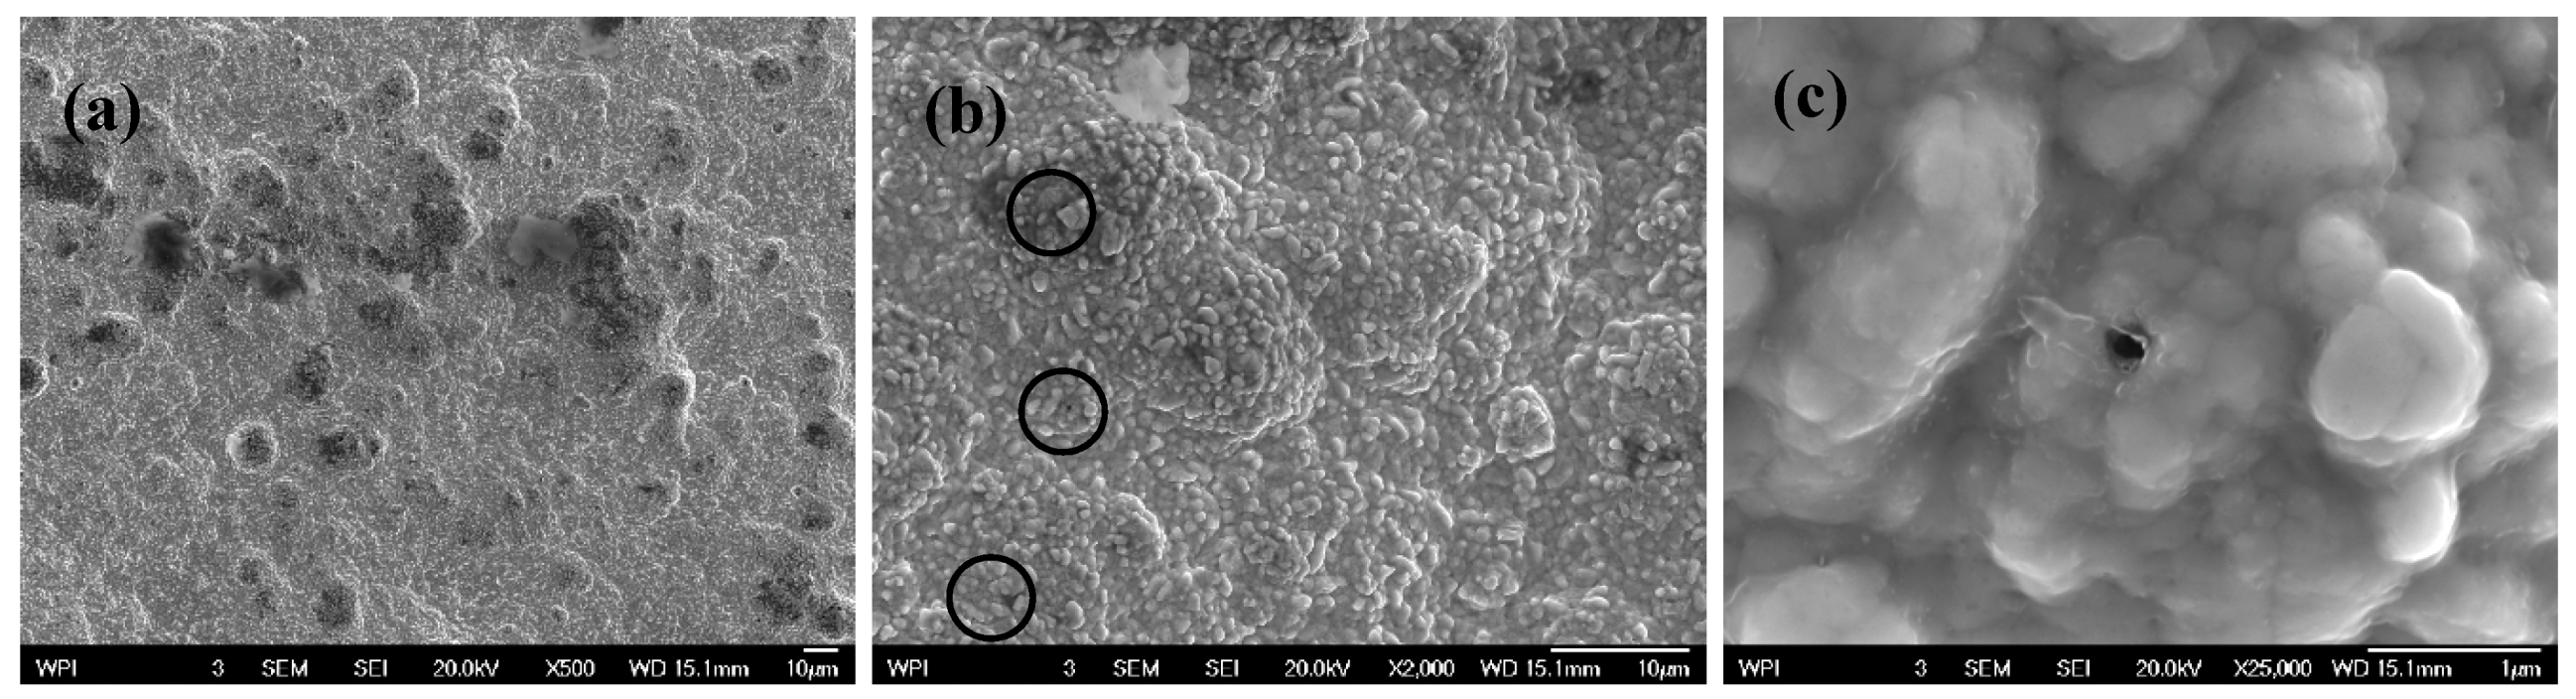
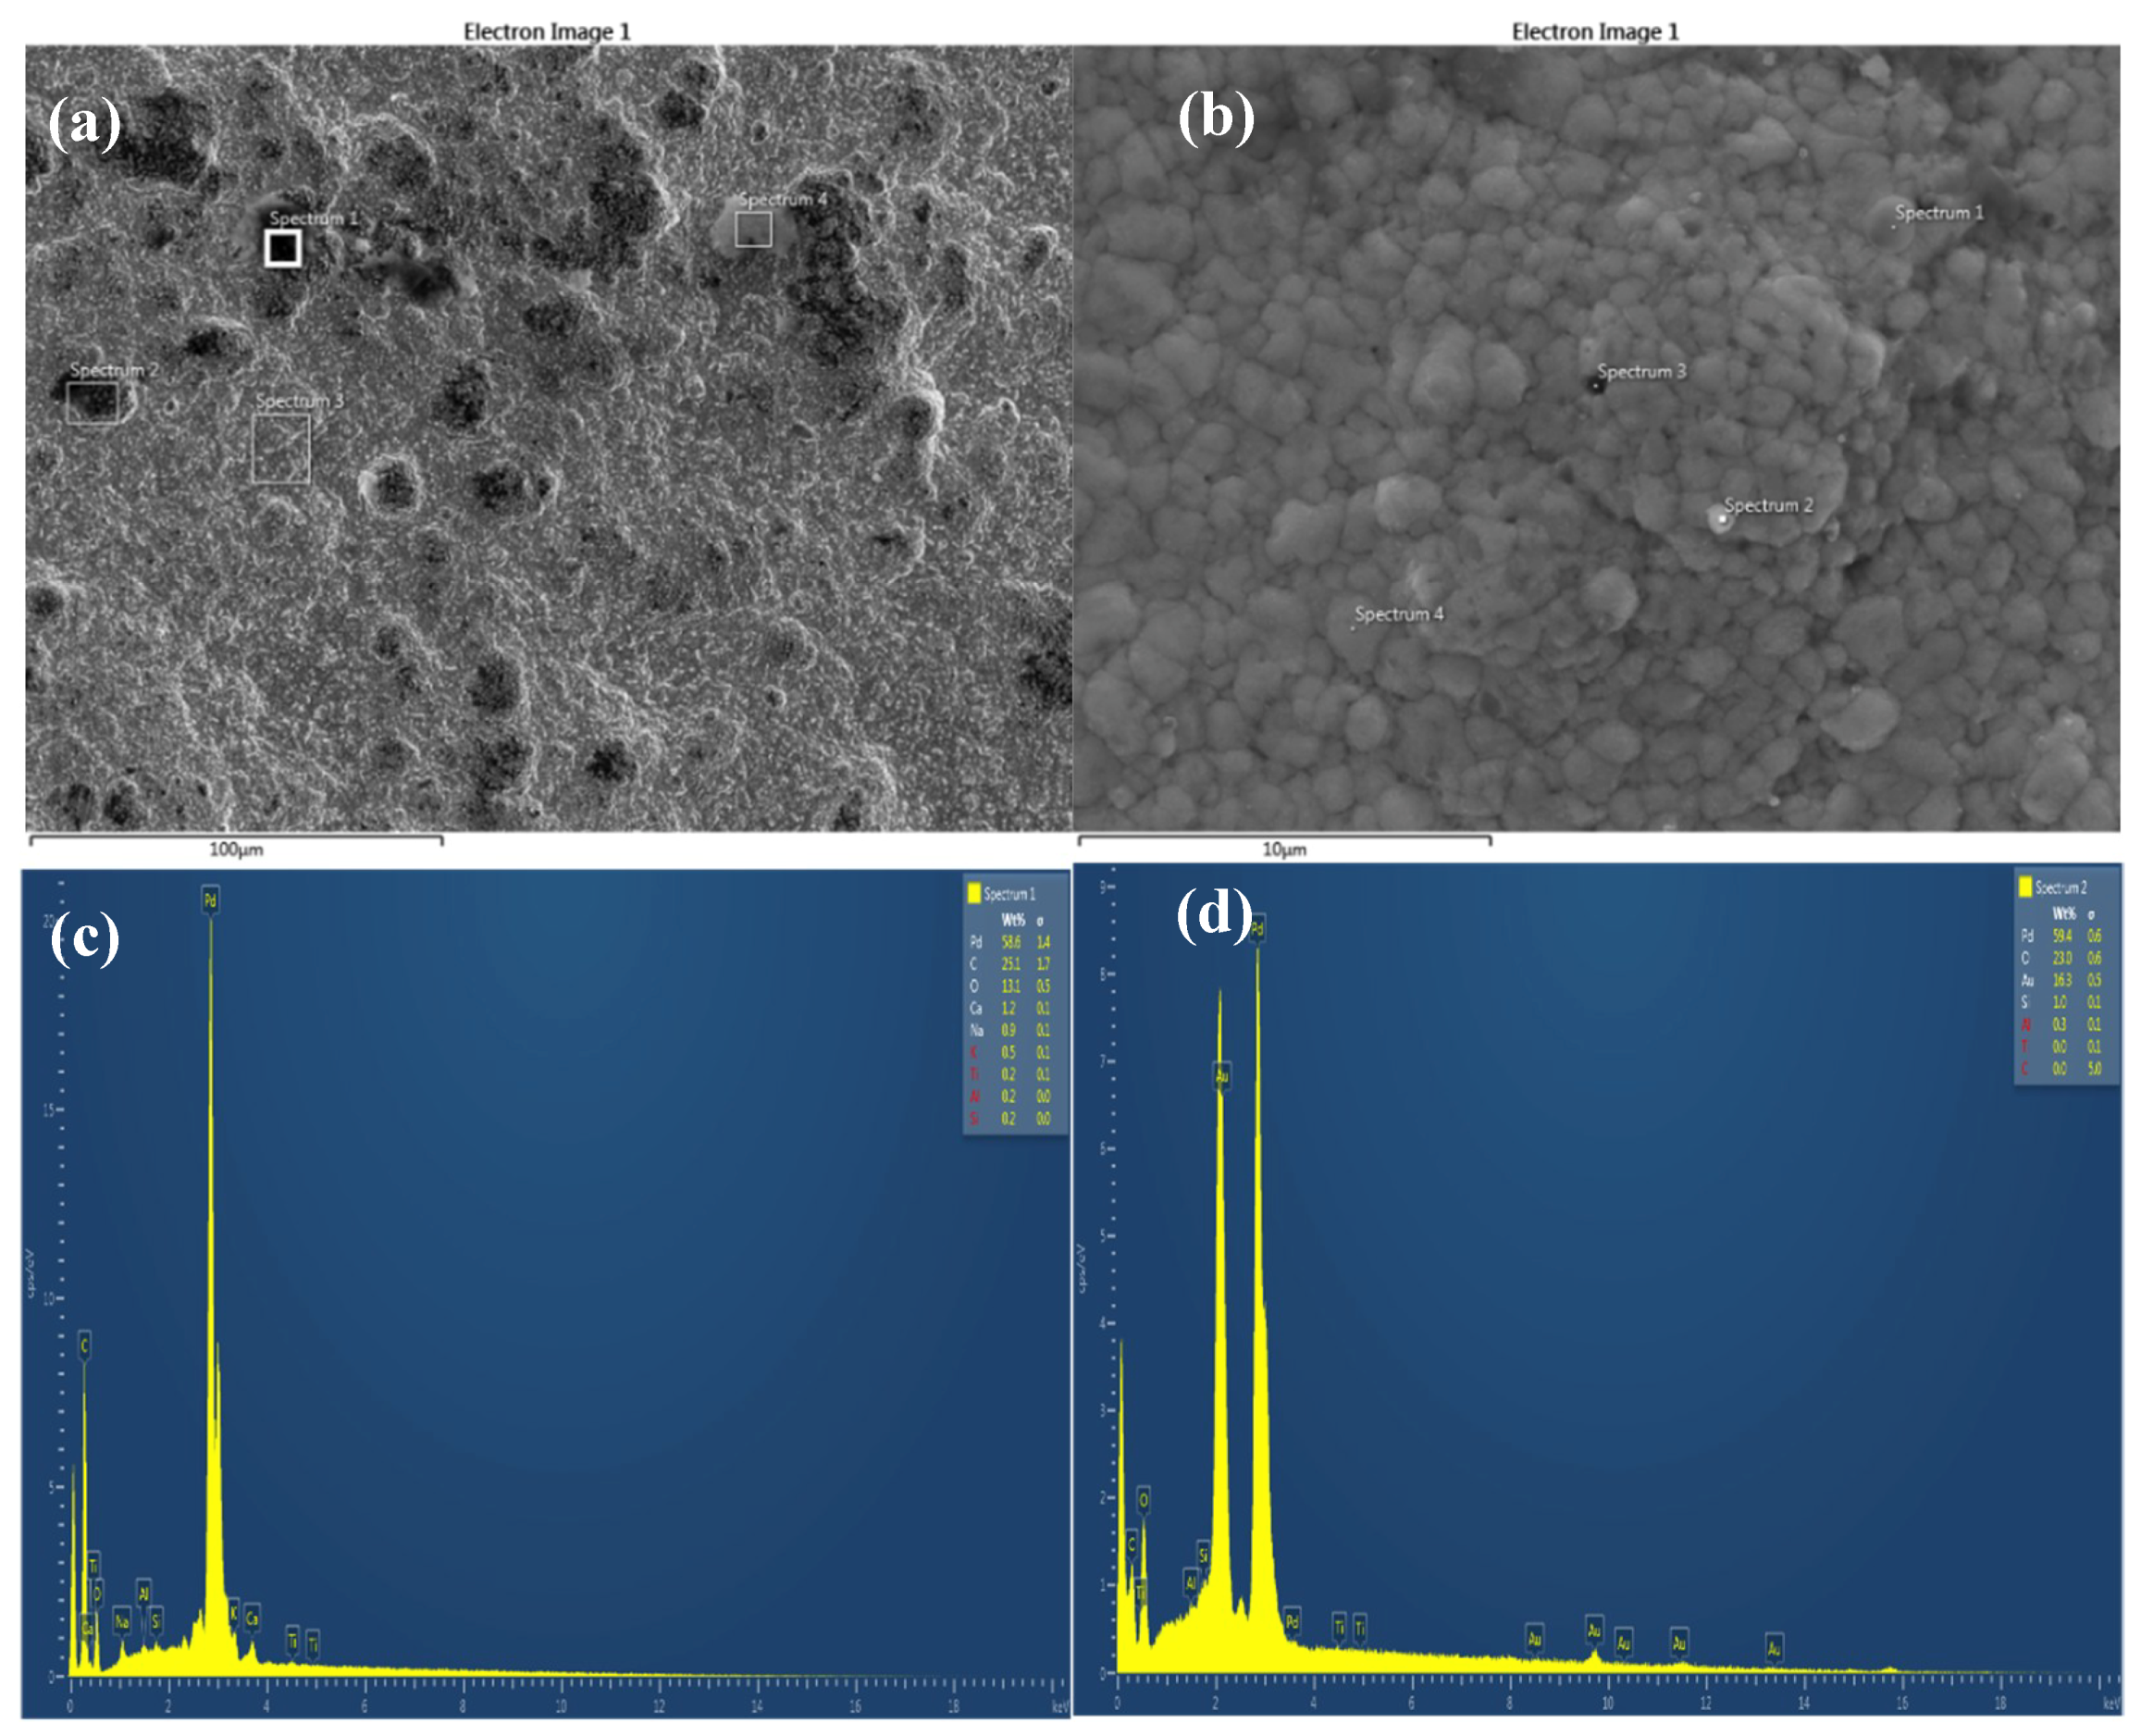
3.2. Scanning Electron Microscope (SEM) Tests

The surface morphology was characterized by SEM and the elemental composition was studied with energy dispersive spectroscopy (EDS) using a JEOL-7000F SEM-EDS to investigate the potential interactions between the feed gas components and the membrane surface, as well as the development of any possible pinholes or cracks.
As shown in Figure 12a,b, the surface of the Pd-Au membrane is very uniform before the permeation tests, while the uniformity is distorted after the conclusion of the tests, as indicated in Figure 12c,d. Small holes can be seen on Pd-Au membrane both before and after the permeation tests. However, the number of these pinholes is much lower, and their sizes are smaller in a pristine Pd-Au membrane compared with the Pd-Au membrane that has undergone permeation tests. Fernandez et al. [62] reported that the existence of impurities during the membrane fabrication process could lead to the development of pinholes. The existence of small pinholes in the pristine membrane confirms the fact that some impurities could exist during the electroless plating process. Suleiman et al. [63] reported that continuous exposure of the Pd surface to H2 causes lattice dilation which, in turn, leads to the development of pinholes and cracks on the membrane surface. Baloyi et al. [64], reported that exposure of the membrane to H2 and the diffusion of H2 atoms through the bulk of metal results in the expansion of lattice structure. They attributed the development of pinholes after the permeation tests to the phase change from a to b-phase and the formation of Pd-hydride.
For the Pd/YSZ membrane, the SEM-EDS analysis was performed on the membrane only after the reaction tests. One can see the development of a number of pinholes on the Pd surface in Figure 13. The diameter of these pinholes is approximately 200–300 nm, as can be seen in Figure 13c. According to Guazzone and Ma [65], incoherent sintering of small Pd clusters or Pd crystallites could result in the formation of pinholes at temperatures between 400–450 °C. Another possible explanation for the development of pinholes could be the numerous cycles of cooling and heating that the membrane has gone through during the tests, as well as the adverse effects of the gaseous components such as CO on the membrane surface. The fact that the ideal selectivity values of H2/He and H2/Ar were not infinite at the beginning of the permeation tests and constantly reduced as the permeation tests continued confirms that the development of pinholes is a combination of incoherent sintering during electroless plating, numerous cycles of heating and cooling, and/or due to the bursting of gas pockets close to the membrane surface in the FCC Pd membrane [66].
EDS analysis were performed on both Pd and Pd-Au membranes to identify the composition of their surfaces at different spots, as shown in Figure 14. EDS analysis of several of the spots on the Pd membrane surface reveals that Pd is not evenly distributed over the membrane surface. The composition of Pd on different spots over the membrane surface varies from 49.2 wt% to 98.4 wt%. For the Pd-Au, a similar trend is observed. Pd and Au are not distributed evenly on the Pd-Au membrane surface. Au content inside the holes is considerably smaller compared with the Au content on the intact bulk of the membrane.
Hou and Hughes [67] reported that the continuous exposure of Pd membrane surface to CO can cause membrane deactivation due to coke formation on the membrane surface. The formation of coke on the membrane surface is confirmed by the EDS analysis, as shown in Figure 14c. This can explain the reduction in H2 permeation flux that was observed during permeation tests with binary mixtures of H2-CO. While some spots on the Pd membrane were found to have carbon contents as high as 33 wt%, no evidence of coke formation was found on the surface of the Pd-Au membrane, as shown in Figure 14d. Further EDS analysis revealed the formation of oxides on the surfaces of both Pd and Pd-Au membranes. This could be a good indication of the formation of PdO on the membrane surfaces which, in turn, adversely affects the permeating flux of H2. In addition, the intensity of the support materials (Al2O3) detected on the surface of the membranes is negligible, which indicates that the holes did not extend all the way to the support, and only affected the top plated layers.

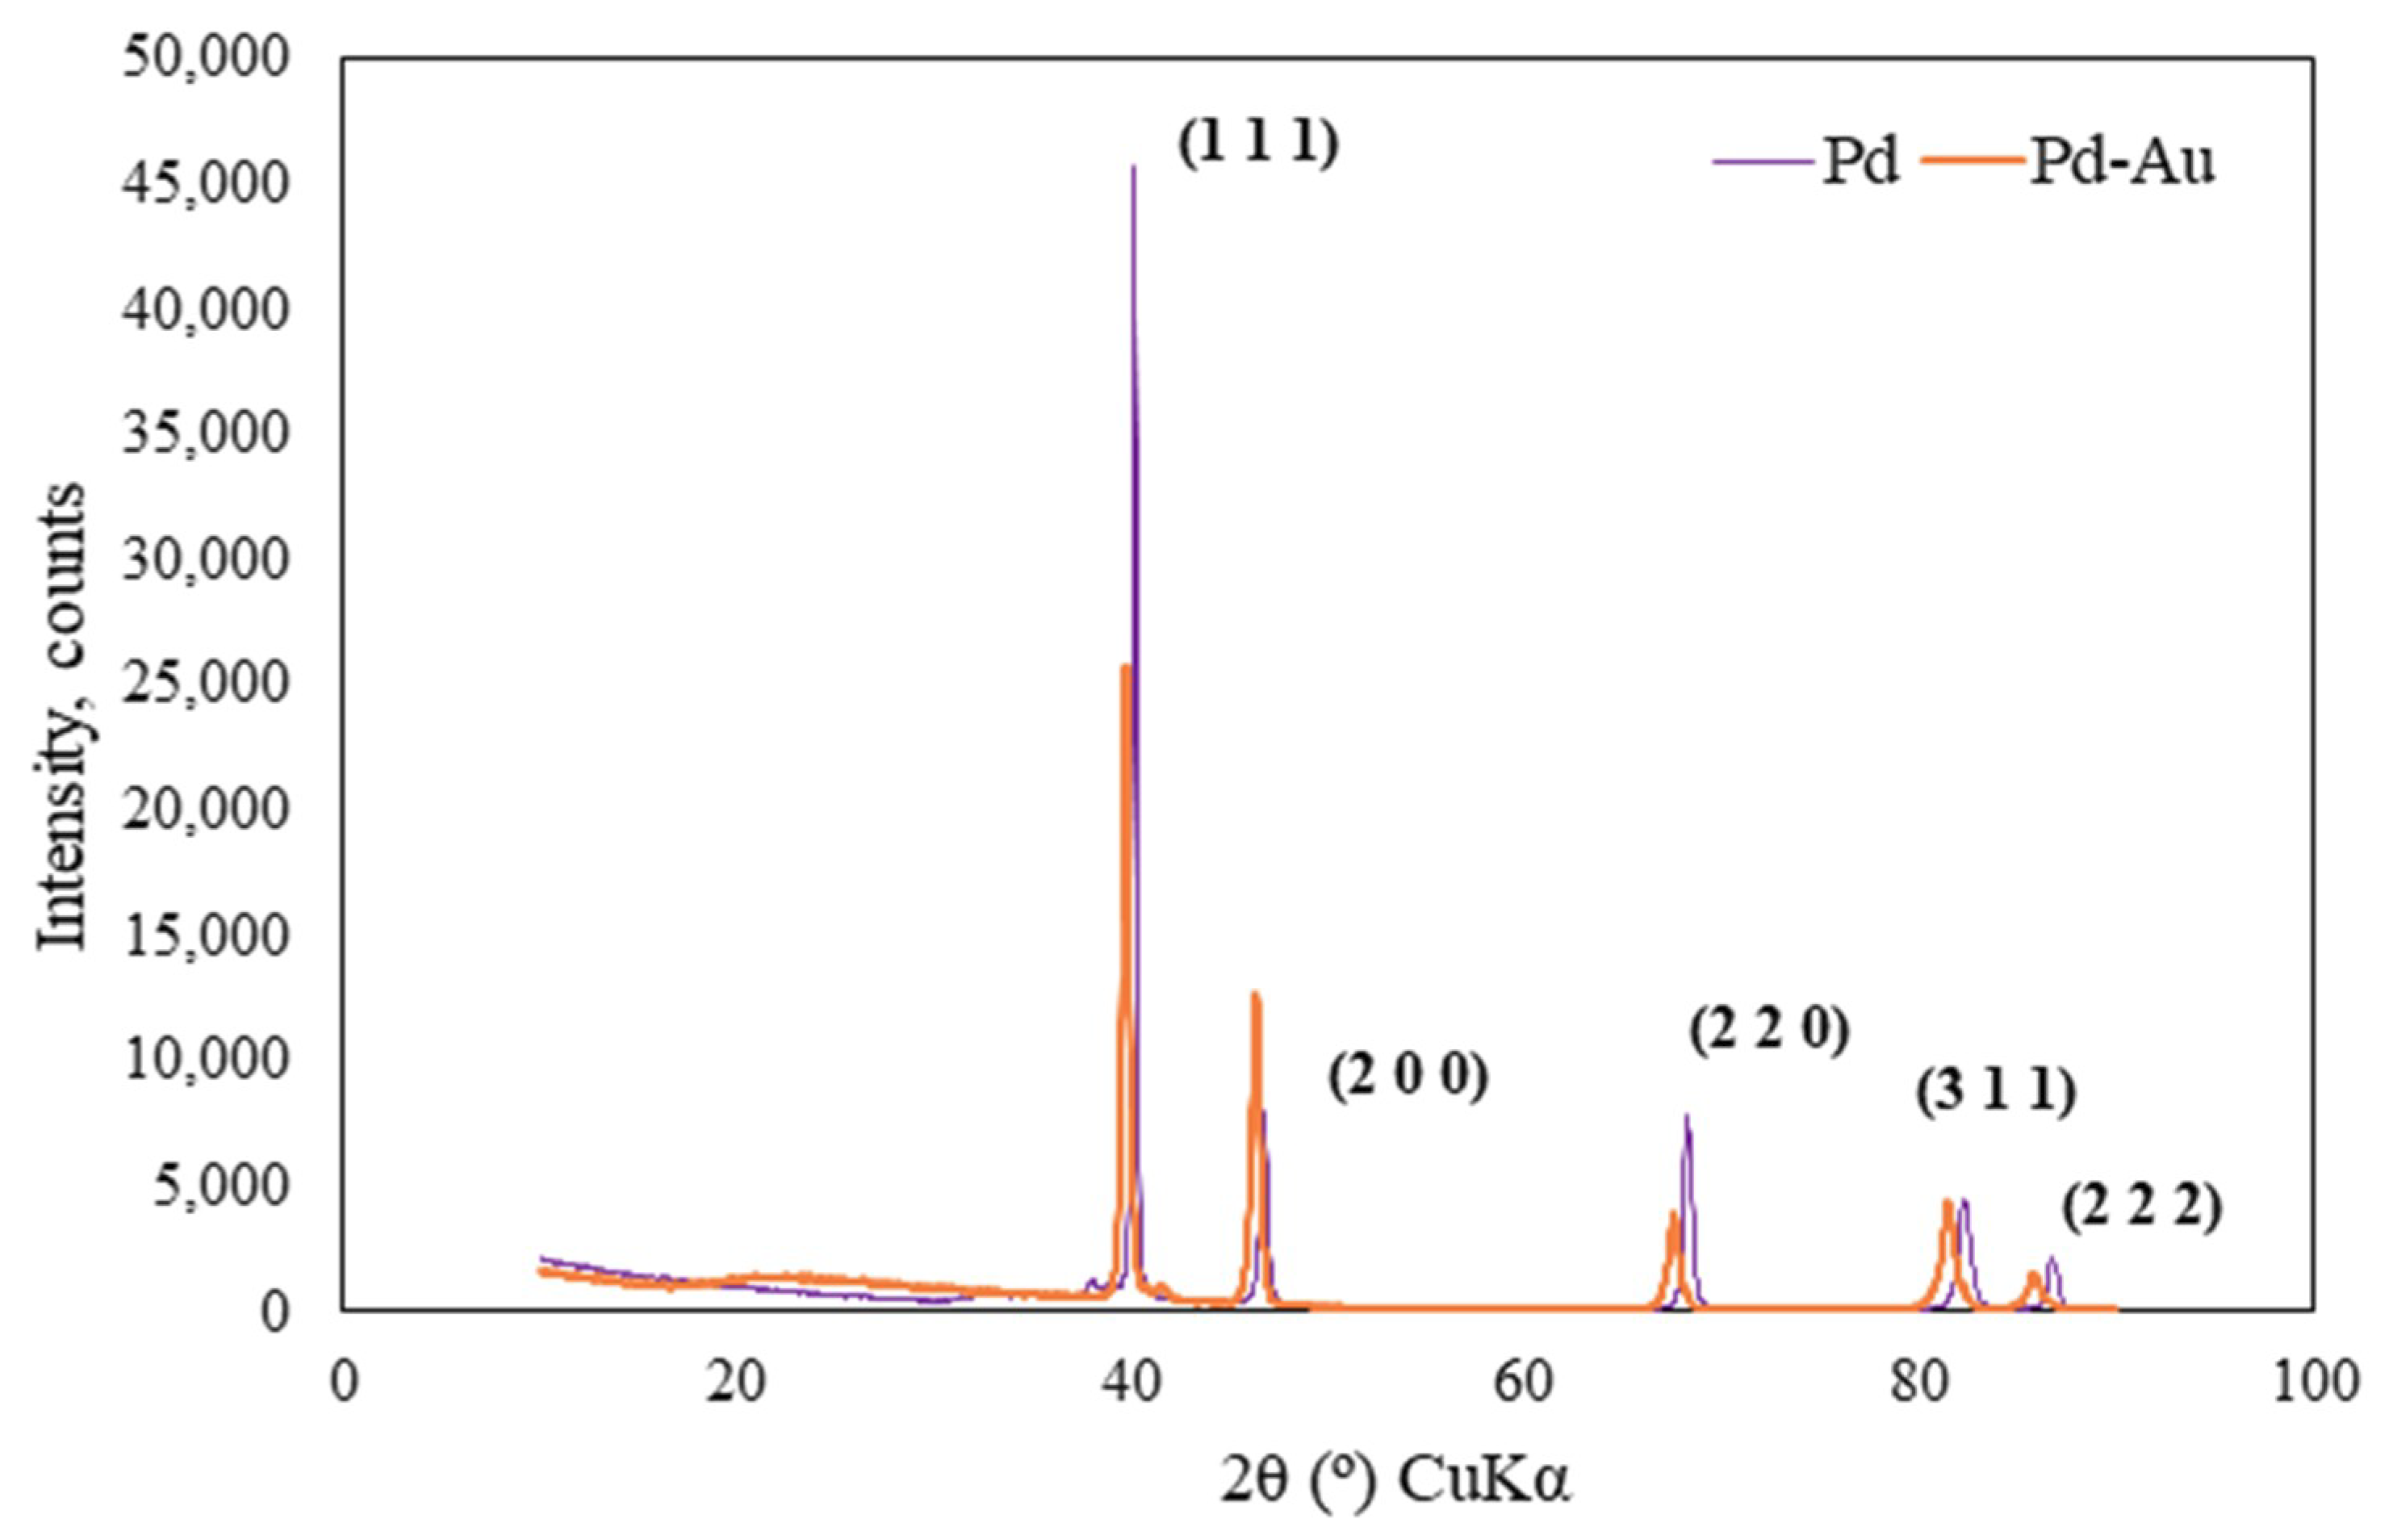
3.3. X-ray Diffraction (XRD) Tests

XRD tests were performed on the membranes after the permeation tests to investigate the development of any potential undesired phases, such as PdO. The XRD analysis were performed using Empyrean diffractometer, and the data were analyzed using Highscore Plus software (Version 4.7, PANalytical, Almelo, The Netherlands).
For Pd membrane five major peaks were identified with their corresponding Miller indices, as reported in Table 4 and shown in Figure 15. These peaks were in good agreement with the results reported by King and Manchester [68]. As shown in Table 4, the lattice structure of Pd at a diffraction angle of 40.1307 has slightly expanded from 2.244 °A to 2.247 °A. This lattice expansion can be explained by the diffusion of H2 through the bulk of the metal [64].
For the Pd-Au membrane, five major peaks were detected, as reported in Table 4 and shown in Figure 15. The composition of the surface material was determined to be Au0.4Pd3.6. Since the composition is mainly Pd, one expects to see the locations of these peaks close to those of pure Pd. These peaks are in agreement with the results reported by Baba et al. [69].
Baloyi et al. reported that long-term exposure of the Pd-based membranes to H2 could result in peak shifting, reduction in peak intensity, broadening of peaks, and the formation of new peaks [64]. According to Ungar [70], the shifting of peaks could be attributed to internal stresses, twinning, and/or planar faults that are caused by the diffusion of H atoms through the membrane, while the reduction in peak intensity could stem from point defects, stacking faults, and crystallite smallness. The existence of pinholes and internal stresses could explain the shift of peaks, as well as the reduction in their intensity in the Pd-Au membrane compared with the Pd membrane.

4. Conclusions

Two composite membranes, i.e., Pd/YSZ and Pd-Au/Al2O3, were fabricated by the electroless plating technique. The permeation experiments for pure gases such as H2, He, and Ar and mixtures of H2 with other reaction gases were performed. At 400 °C and at a trans-membrane pressure of 50 kPa, the ideal selectivity of H2/Ar was found to be 6000 for the Pd membrane, while the Pd-Au membrane showed near-infinite selectivity towards H2 permeation. This is an indication that the transport mechanism in the Pd-Au membrane is governed by solution diffusion, while in the Pd membrane, the transport mechanism can be affected by the Pd surface or bulk defects.
Permeation studies with pure H2 and pure Ar show that both the H2 permeating flux and the ideal selectivity of H2/Ar (αH2/Ar) increase as the operating temperature increases. Permeation tests of binary mixtures of H2-Ar, H2-He, and H2-N2, performed on both Pd/YSZ and Pd-Au/Al2O3, indicate a significant decrease in the permeation flux of H2 in these binary mixtures compared with the pure H2 case, which can be explained by the concentration polarization effect.
Permeation tests of binary mixtures of H2-CH4, H2-CO2, and H2-CO, and H2-H2O were performed on both Pd/YSZ and Pd-Au/Al2O3. These studies show that steam has the worst effect on the H2 permeating flux, followed by CO, CO2, and CH4. While CH4 has negligible surface adsorption on the Pd layer, CO and CO2 show strong affinity toward Pd. The existence of steam molecules in the feed mixture could result in the adsorption of oxygen atoms through H2O decomposition/recombination, which can poison the active surface of Pd.
Permeation tests of the simulated SMR stream prove that the H2 permeation flux is reduced even more compared with the ternary mixtures. In a simulated SMR stream, the negative effects of concentration polarization, dilution, and depletion of H2, combined with the negative effects of competitive adsorption and the decomposition/recombination effect of steam will reduce the permeating flux of H2 even more compared with the ternary mixture. The concentration polarization effect is more pronounced at lower trans-membrane pressures and lower GHSVs. By increasing the trans-membrane pressure or GHSV, the negative effect of concentration polarization will be abated.
The SEM images confirm the existence of pinholes and defects in the structure of the Pd/YSZ membrane, which could have resulted from poor fabrication or bursts of gas near the Pd surface. XRD images show a slight shift in the position of Pd peaks, which can be explained by formation of PdO after the permeation tests.
Concentration polarization, dilution, depletion, and competitive adsorption on the Pd surface are the major phenomena that are detrimental to H2 generation and purification. Hence, it is crucial to know the mechanism by which these phenomena affect the SMR performance and how their effects can be mitigated. The negative effects by which the permeating flux of H2 can be affected was investigated in this work, and the gases associated with each of these effects were identified. This work is one of the few that systematically addresses all four negative effects in an experimental setting and at operating conditions that satisfy the DOE target requirements. The next step that is complementary to this work would be performing the H2 permeation tests in a MR while carrying out the SMR with industrial-grade CH4 with impurities such as CO, CO2, and H2S.

Author Contributions

Conceptualization, K.K.; Data curation, K.K. and C.M.W.; Formal analysis, K.K. and S.L.; Funding acquisition, J.W.; Investigation, K.K., C.M.W. and S.L.; Methodology, S.L.; Project administration, J.W. and S.L.; Resources, J.W.; Supervision, J.W. and S.L.; Validation, K.K. and S.L.; Visualization, K.K.; Writing—original draft, K.K.; Writing—review & editing, C.M.W., Jennifer Wilcox and S.L.

Funding

This research received no external funding.

Acknowledgments

The authors would like to sincerely thank Sina Soltanmohammad, Boquan Li, and Alex Maag for their help with XRD and SEM experiments. Authors would like to extend their special gratitude to Yan Huang for providing this research group with the metallic membranes.

Conflicts of Interest

The authors declare no conflict of interest.

References

  1. EIA Annual Energy Outlook, Energy Information Administration (EIA); U.S. Department of Energy: Washington, DC, USA, 2014.
  2. U.S. Energy Information Administration. Monthly Energy Review; EIA: Washington, DC, USA, 2018.
  3. Holladay, J.D.; Hu, J.; King, D.L.; Wang, Y. An overview of hydrogen production technologies. Catal. Today 2009, 139, 244–260. [Google Scholar] [CrossRef]
  4. Plasynski, S.I.; Litynski, J.T.; McIlvried, H.G.; Srivastava, R.D. Progress and new developments in carbon capture and storage. CRC. Crit. Rev. Plant Sci. 2009, 28, 123–138. [Google Scholar] [CrossRef]
  5. Lattin, W.C.; Utgikar, V.P. Transition to hydrogen economy in the United States: A 2006 status report. Int. J. Hydrogen Energy 2007, 32, 3230–3237. [Google Scholar] [CrossRef]
  6. U.S. Department of Energy. Hydrogen, Fuel Cells and Infrastructure Technologies Program, Multi-Year Research, Development and Demonstration Plan: Planned program activities for 2005–2015; US Department Of Energy: Washington, DC, USA, 2007.
  7. Iulianelli, A.; Liguori, S.; Wilcox, J.; Basile, A. Advances on methane steam reforming to produce hydrogen through membrane reactors technology: A review. Catal. Rev. Sci. Eng. 2016, 58, 1–35. [Google Scholar] [CrossRef]
  8. Liguori, S.; Pinacci, K.P.; Seelam, R.; Keiski, F.; Drago, V.; Calabrò, V.; Basile, A.; Iulianelli, A. Performance of a Pd/PSS membrane reactor to produce high purity hydrogen via WGS reaction. Catal. Today 2012, 193, 87–94. [Google Scholar] [CrossRef]
  9. Ghenciu, A.F. Review of fuel processing catalysts for hydrogen production in PEM fuel cell systems. Curr. Opin. Solid State Mater. Sci. 2002, 6, 389–399. [Google Scholar] [CrossRef]
  10. Al-Mufachi, N.A.; Rees, N.V.; Steinberger-Wilkens, R. Hydrogen selective membranes: A review of palladium-based dense metal membranes. Renew. Sustain. Energy Rev. 2015, 47, 540–551. [Google Scholar] [CrossRef]
  11. Ohi, J.M.; Vanderborgh, N.; Voecks, G. Hydrogen Fuel Quality Specifications for Polymer Electrolyte Fuel Cells in Road Vehicles; US DOE EERE: Washington, DC, USA, 2016.
  12. De Falco, M.D.; Marrelli, L.; Iaquaniello, G. Membrane Reactors for Hydrogen Production Processes; Springer: London, UK, 2011; ISBN 9780857291509. [Google Scholar]
  13. Burkhanov, G.S.; Gorina, N.B.; Kolchugina, N.B.; Roshan, N.R.; Slovetsky, D.I.; Chistov, E.M. Palladium-based alloy membranes for separation of high purity hydrogen from hydrogen-containing gas mixtures. Platin. Met. Rev. 2011, 55, 3–12. [Google Scholar] [CrossRef]
  14. Li, A.; Grace, J.R.; Lim, C.J. Preparation of thin Pd-based composite membrane on planar metallic substrate. Part II. Preparation of membranes by electroless plating and characterization. J. Memb. Sci. 2007, 306, 159–165. [Google Scholar] [CrossRef]
  15. Zhang, J.; Liu, D.; He, M.; Xu, H.; Li, W. Experimental and simulation studies on concentration polarization in H 2 enrichment by highly permeable and selective Pd membranes. J. Memb. Sci. 2006, 274, 83–91. [Google Scholar] [CrossRef]
  16. Zhang, D.; Fan, Y.; Xu, N.; He, Y. Effect of intermetallic diffusion between Pd and Ti-Al alloy on the performance of Pd/Ti-Al alloy composite membranes. J. Memb. Sci. 2011, 377, 221–230. [Google Scholar] [CrossRef]
  17. Yan, S.; Maeda, H.; Kusakabe, K.; Morooka, S. Thin Palladium Membrane Formed in Support Pores by Metal-Organic Chemical Vapor Deposition Method and Application to Hydrogen Separation. Ind. Eng. Chem. Res. 1994, 33, 616–622. [Google Scholar] [CrossRef]
  18. Tong, J.; Kashima, Y.; Shirai, R.; Suda, H.; Matsumura, Y. Thin defect-free Pd membrane deposited on asymmetric porous stainless steel substrate. Ind. Eng. Chem. Res. 2005, 44, 8025–8032. [Google Scholar] [CrossRef]
  19. Li, A.; Grace, J.R.; Lim, C.J. Preparation of thin Pd-based composite membrane on planar metallic substrate: Part I: Pre-treatment of porous stainless steel substrate. J. Memb. Sci. 2007, 298, 175–181. [Google Scholar] [CrossRef]
  20. Mardilovich, I.P.; Engwall, E.; Ma, Y.H. Dependence of hydrogen flux on the pore size and plating surface topology of asymmetric Pd-porous stainless steel membranes. Desalination 2002, 144, 85–89. [Google Scholar] [CrossRef]
  21. Yepes, D.; Cornaglia, L.M.; Irusta, S.; Lombardo, E.A. Different oxides used as diffusion barriers in composite hydrogen permeable membranes. J. Memb. Sci. 2006, 274, 92–101. [Google Scholar] [CrossRef]
  22. Wang, J.; Luo, J.; Feng, S.; Li, H.; Wan, Y.; Zhang, X. Recent development of ionic liquid membranes. Green Energy Environ. 2016, 1, 43–61. [Google Scholar] [CrossRef]
  23. Shu, J.; Adnot, A.; Grandjean, B.P.A.; Kaliaguine, S. Structurally stable composite Pd-Ag alloy membranes: Introduction of a diffusion barrier. Thin Solid Films 1996, 286, 72–79. [Google Scholar] [CrossRef]
  24. Liguori, S.; Iulianelli, A.; Dalena, F.; Pinacci, P.; Drago, F.; Broglia, M.; Huang, Y.; Basile, A. Performance and long-term stability of Pd/PSS and Pd/Al2O3 membranes for hydrogen separation. Membranes 2014, 4, 143–162. [Google Scholar] [CrossRef]
  25. Dolan, M.D. Non-Pd BCC alloy membranes for industrial hydrogen separation. J. Memb. Sci. 2010, 362, 12–28. [Google Scholar] [CrossRef]
  26. Borgognoni, F.; Tosti, S.; Vadrucci, M.; Santucci, A. Pure hydrogen production in a Pd-Ag multi-membranes module by methane steam reforming. Int. J. Hydrogen Energy 2011, 36, 7550–7558. [Google Scholar] [CrossRef]
  27. Brunetti, A.; Caravella, A.; Drioli, E.; Barbieri, G. Process Intensification by Membrane Reactors: High-Temperature Water Gas Shift Reaction as Single Stage for Syngas Upgrading. Chem. Eng. Technol. 2012, 35, 1238–1248. [Google Scholar] [CrossRef]
  28. Peters, T.A.; Stange, M.; Klette, H.; Bredesen, R. High pressure performance of thin Pd-23%Ag/stainless steel composite membranes in water gas shift gas mixtures; influence of dilution, mass transfer and surface effects on the hydrogen flux. J. Memb. Sci. 2008, 316, 119–127. [Google Scholar] [CrossRef]
  29. Dolan, M.D.; Donelson, R.; Dave, N.C. Performance and economics of a Pd-based planar WGS membrane reactor for coal gasification. Int. J. Hydrogen Energy 2010, 35, 10994–11003. [Google Scholar] [CrossRef]
  30. Schramm, O.; Seidel-Morgenstern, A. Comparing porous and dense membranes for the application in membrane reactors. Chem. Eng. Sci. 1999, 54, 1447–1453. [Google Scholar] [CrossRef]
  31. Gallucci, F.; Paturzo, L.; Famà, A.; Basile, A. Experimental Study of the Methane Steam Reforming Reaction in a Dense Pd/Ag Membrane Reactor. Ind. Eng. Chem. Res. 2004, 43, 928–933. [Google Scholar] [CrossRef]
  32. Jørgensen, S.L.; Nielsen, P.E.H.; Lehrmann, P.E. Steam reforming of methane in a membrane reactor. Catal. Today 1995, 25, 303–307. [Google Scholar] [CrossRef]
  33. Chen, W.H.; Syu, W.Z.; Hung, C.I. Numerical characterization on concentration polarization of hydrogen permeation in a Pd-based membrane tube. Int. J. Hydrogen Energy 2011, 36, 14734–14744. [Google Scholar] [CrossRef]
  34. Mori, N.; Nakamura, T.; Noda, K.-I.I.; Sakai, O.; Takahashi, A.; Ogawa, N.; Sakai, H.; Iwamoto, Y.; Hattori, T. Reactor Configuration and Concentration Polarization in Methane Steam Reforming by a Membrane Reactor with a Highly Hydrogen-Permeable Membrane. Ind. Eng. Chem. Res. 2007, 46, 1952–1958. [Google Scholar] [CrossRef]
  35. Caravella, A.; Barbieri, G.; Drioli, E. Concentration polarization analysis in self-supported Pd-based membranes. Sep. Purif. Technol. 2009, 66, 613–624. [Google Scholar] [CrossRef]
  36. Caravella, A.; Sun, Y. Correct evaluation of the effective concentration polarization influence in membrane-assisted devices. Case study: H2 production by Water Gas Shift in Pd-membrane reactors. Int. J. Hydrogen Energy 2016, 41, 11653–11659. [Google Scholar] [CrossRef]
  37. Hara, S.; Sakaki, K.; Itoh, N. Decline in hydrogen permeation due to concentration polarization and CO hindrance in a palladium membrane reactor. Ind. Eng. Chem. Res. 1999, 38, 4913–4918. [Google Scholar] [CrossRef]
  38. Thoen, P.M.; Roa, F.; Way, J.D. High flux palladium-copper composite membranes for hydrogen separations. Desalination 2006, 193, 224–229. [Google Scholar] [CrossRef]
  39. Coroneo, M.; Montante, G.; Catalano, J.; Paglianti, A. Modelling the effect of operating conditions on hydrodynamics and mass transfer in a Pd-Ag membrane module for H2 purification. J. Memb. Sci. 2009, 343, 34–41. [Google Scholar] [CrossRef]
  40. He, G.; Mi, Y.; Lock Yue, P.; Chen, G. Theoretical study on concentration polarization in gas separation membrane processes. J. Memb. Sci. 1999, 153, 243–258. [Google Scholar] [CrossRef]
  41. Mourgues, A.; Sanchez, J. Theoretical analysis of concentration polarization in membrane modules for gas separation with feed inside the hollow-fibers. J. Memb. Sci. 2005, 252, 133–144. [Google Scholar] [CrossRef]
  42. Takaba, H.; Nakao, S. Computational fluid dynamics study on concentration polarization in H2/CO separation membranes. J. Memb. Sci. 2005, 249, 83–88. [Google Scholar] [CrossRef]
  43. Ma, Y.H.; Mardilovich, I.P. Composite Structures with Porous Anodic Oxide Layers and Methods of Fabricationn. U.S. Patent No 8,366,805, 5 February 2013. [Google Scholar]
  44. Ma, Y.H.; Mardilovich, I.P.; Engwall, E.E. Composite Gas Separation Modules Having High Tamman Temperature Intermediate Layersn. U.S. Patent No 7,255,726, 14 August 2007. [Google Scholar]
  45. Ma, Y.H.; Mardilovich, P.P.; She, Y. Hydrogen Gas-Extraction Module and Method of Fabricationn. U.S. Patent No 6,152,987, 28 November 2000. [Google Scholar]
  46. Collins, J.P.; Way, J.D. Preparation and Characterization of a Composite Palladium-Ceramic Membrane. Ind. Eng. Chem. Res. 1993, 32, 3006–3013. [Google Scholar] [CrossRef]
  47. Anzelmo, B. On-Board Hydrogen Production from Natural Gas via a Metallic Pd-Based Membrane Reactor. Ph.D. Thesis, Stanford University, Stanford, CA, USA, 2016. [Google Scholar]
  48. Helmi, A.; Fernandez, E.; Melendez, J.; Tanaka, D.A.P.; Gallucci, F.; Van Sint Annaland, M. Fluidized bed membrane reactors for ultra pure H2 production—A step forward towards commercialization. Molecules 2016, 21, 376. [Google Scholar] [CrossRef] [Green Version]
  49. Iulianelli, A.; Liguori, S.; Huang, Y.; Basile, A. Model biogas steam reforming in a thin Pd-supported membrane reactor to generate clean hydrogen for fuel cells. J. Power Sources 2015, 273, 25–32. [Google Scholar] [CrossRef]
  50. Pacheco Tanaka, D.A.; Llosa Tanco, M.A.; Nagase, T.; Okazaki, J.; Wakui, Y.; Mizukami, F.; Suzuki, T.M. Fabrication of hydrogen-permeable composite membranes packed with palladium nanoparticles. Adv. Mater. 2006, 18, 630–632. [Google Scholar] [CrossRef]
  51. Gade, S.K.; Thoen, P.M.; Way, J.D. Unsupported palladium alloy foil membranes fabricated by electroless plating. J. Memb. Sci. 2008, 316, 112–118. [Google Scholar] [CrossRef]
  52. Peters, T.A.; Stange, M.; Bredesen, R. On the high pressure performance of thin supported Pd–23%Ag membranes—Evidence of ultrahigh hydrogen flux after air treatment. J. Memb. Sci. 2011, 378, 28–34. [Google Scholar] [CrossRef]
  53. Mardilovich, P.P.; She, Y.; Ma, Y.H.; Rei, M.H. Defect-Free Palladium Membranes on Porous Stainless-Steel Support. AIChE J. 1998, 44, 310–322. [Google Scholar] [CrossRef]
  54. Mejdell, A.L.; Jøndahl, M.; Peters, T.A.; Bredesen, R.; Venvik, H.J. Effects of CO and CO2 on hydrogen permeation through a ~3 μm Pd/Ag 23 wt.% membrane employed in a microchannel membrane configuration. Sep. Purif. Technol. 2009, 68, 178–184. [Google Scholar] [CrossRef]
  55. Amandusson, H.; Ekedahl, L.G.; Dannetun, H. Hydrogen permeation through surface modified Pd and PdAg membranes. J. Memb. Sci. 2001, 193, 35–47. [Google Scholar] [CrossRef]
  56. Li, A.; Liang, W.; Hughes, R. The effect of carbon monoxide and steam on the hydrogen permeability of a Pd/stainless steel membrane. J. Memb. Sci. 2000, 165, 135–141. [Google Scholar] [CrossRef]
  57. Amano, M.; Nishimura, C.; Komaki, M. Effects of High Concentration CO and CO2 on Hydrogen Permeation through the Palladium Membrane. Mater. Trans. JIM 1990, 31, 404–408. [Google Scholar] [CrossRef]
  58. Eriksson, M.; Ekedahl, L.-G.G. Real time measurements of hydrogen desorption and absorption during CO exposures of Pd: Hydrogen sticking and dissolution. Appl. Surf. Sci. 1998, 133, 89–97. [Google Scholar] [CrossRef]
  59. Gallucci, F.; Chiaravalloti, F.; Tosti, S.; Drioli, E.; Basile, A. The effect of mixture gas on hydrogen permeation through a palladium membrane: Experimental study and theoretical approach. Int. J. Hydrogen Energy 2007, 32, 1837–1845. [Google Scholar] [CrossRef]
  60. Yamazaki, O.; Tomishige, K.; Fujimoto, K. Development of highly stable nickel catalyst for methane-steam reaction under low steam to carbon ratio. Appl. Catal. A Gen. 1996, 136, 49–56. [Google Scholar] [CrossRef]
  61. Rostrup-Nielsen, J.; Trimm, D.L. Mechanisms of carbon formation on nickel-containing catalysts. J. Catal. 1977, 48, 155–165. [Google Scholar] [CrossRef]
  62. Fernandez, E.; Coenen, K.; Helmi, A.; Melendez, J.; Zuñiga, J.; Pacheco Tanaka, D.A.; Van Sint Annaland, M.; Gallucci, F. Preparation and characterization of thin-film Pd-Ag supported membranes for high-temperature applications. Int. J. Hydrogen Energy 2015, 40, 13463–13478. [Google Scholar] [CrossRef]
  63. Suleiman, M.; Jisrawi, N.M.; Dankert, O.; Reetz, M.T.; Bähtz, C.; Kirchheim, R.; Pundt, A. Phase transition and lattice expansion during hydrogen loading of nanometer sized palladium clusters. J. Alloys Compd. 2003, 356–357, 644–648. [Google Scholar] [CrossRef]
  64. Baloyi, L.N.; North, B.C.; Langmi, H.W.; Bladergroen, B.J.; Ojumu, T.V. The production of hydrogen through the use of a 77 wt% Pd 23 wt% Ag membrane water gas shift reactor. S. Afr. J. Chem. Eng. 2016, 22, 44–54. [Google Scholar] [CrossRef]
  65. Guazzone, F.; Ma, Y.H. Leak growth mechanism in composite Pd membranes prepared by the electroless deposition method. AIChE J. 2008, 54, 487–494. [Google Scholar] [CrossRef]
  66. Goldbach, A.; Yuan, L.; Xu, H. Impact of the fcc/bcc phase transition on the homogeneity and behavior of PdCu membranes. Sep. Purif. Technol. 2010, 73, 65–70. [Google Scholar] [CrossRef]
  67. Hou, K.; Hughes, R. The effect of external mass transfer, competitive adsorption and coking on hydrogen permeation through thin Pd/Ag membranes. J. Memb. Sci. 2002, 206, 119–130. [Google Scholar] [CrossRef]
  68. King, H.W.; Manchester, F.D. A low-temperature X-ray diffraction study of Pd and some Pd-H alloys. J. Phys. F Met. Phys. 1978, 8, 15–26. [Google Scholar] [CrossRef]
  69. Baba, K.; Miyagawa, U.; Watanabe, K.; Sakamoto, Y.; Flanagan, T.B. Electrical resistivity changes due to interstitial hydrogen in palladium-rich substitutional alloys. J. Mater. Sci. 1990, 25, 3910–3916. [Google Scholar] [CrossRef]
  70. Ungár, T. Microstructural parameters from X-ray diffraction peak broadening. Scr. Mater. 2004, 51, 777–781. [Google Scholar] [CrossRef]
Figure 1. Schematic of the experimental setup.
Environments 05 00128 g001
Figure 2. Permeating flux of H2 vs. trans-membrane pressure at 400 °C and various values of n for (a) Pd membrane (b) Pd-Au membrane.
Environments 05 00128 g002
Figure 3. Arrhenius plot representing the permeation flux of pure H2 in a Pd/Al2O3 at a trans-membrane pressure of 100 kPa.
Environments 05 00128 g003
Figure 4. Influence of temperature on the (a) permeating flux of H2 (b) ideal selectivity of H2 to Ar.
Environments 05 00128 g004
Figure 5. Influence of inert gases on the permeation flux of H2 in (a) Pd/YSZ and (b) Pd-Au/Al2O3 membranes.
Environments 05 00128 g005
Figure 6. Influence of feed flow rate on the permeation flux of H2 in (a) Pd/YSZ and (b) Pd-Au/Al2O3 membranes.
Environments 05 00128 g006
Figure 7. Influence of impurities on the permeation flux of H2 in (a) Pd/YSZ and (b) Pd-Au/Al2O3 membranes.
Environments 05 00128 g007
Figure 8. H2 permeation flux in ternary gas mixtures using Pd/YSZ membrane.
Environments 05 00128 g008
Figure 9. H2 permeation flux in simulated SMR stream using Pd/YSZ membrane.
Environments 05 00128 g009
Figure 10. Influence of GHSV on the H2 permeating flux using Pd/YSZ membrane.
Environments 05 00128 g010
Figure 11. Influence of S/C ratio on the H2 permeating flux using Pd/YSZ membrane.
Environments 05 00128 g011
Figure 12. SEM image of the Pd-Au membrane befor (a,b) and after the permeation tests (c,d).
Environments 05 00128 g012
Figure 13. SEM image of the Pd membrane after the permeation tests at various magnifications: (a) X500 (b) X2000 and (c) X25,000
Environments 05 00128 g013
Figure 14. EDS analysis of the surface composition for Pd (a,c), and Pd-Au (b,d) membranes.
Environments 05 00128 g014
Figure 15. XRD analysis of Pd/YSZ and Pd membranes after the permeation tests.
Environments 05 00128 g015
Table 1. Gas mixtures fed into the Pd and Pd-Au MRs at 400 °C for permeation tests.
Gas Mixture TypeGas Mixture FeedGas Mixture CompositionTotal Flow Rate (mL/min)
Pd Membrane
BinaryH2/Ar50/50276
BinaryH2/Ar50/50542
BinaryH2/Ar50/50810
BinaryH2/Ar50/501078
BinaryH2/He50/50276
BinaryH2/CH450/50276
BinaryH2/H2O50/50276
BinaryH2/CO250/50276
TernaryH2/CO/He50/5/45276
TernaryH2/CO2/CH450/25/25276
TernaryH2/CO2/H2O50/25/25276
QuaternaryH2/CO2/CO/He50/25/2.5/22.5276
QuaternaryH2/H2O/CO/He50/25/2.5/22.5276
SenaryH2/CO2/H2O/CH4/CO/He40/20/23/7/1/9276
Pd-Au Membrane
BinaryH2/Ar50/50276
BinaryH2/He50/50276
BinaryH2/N250/50276
BinaryH2/H2O50/50276
Table 2. Gas mixtures fed into the Pd and Pd-Au MRs at 400 °C for permeation tests.
Membrane∆p (kPa)Pd Thickness (µm)T (°C)Ea (kJ/mol)P (mol/m2·s·Pa0.5)nReference
Pd/Al2O34005300NA* 10−60.5[50]
Pd/SS disk2207.2400NA* 15.6 × 10−70.595[51]
Pd/SS disk2209.6400NA* 10.6 × 10−40.595[51]
Pd/SS disk22012.1400NA* 9.3 × 10−40.595[51]
Pd/SS disk22014.6400NA* 5.5 × 10−40.595[51]
Pd-Ag23%/PSS25002.8400NA6.48 × 10−30.5[52]
Pd-Ag23%/PSS19002.8400NA6.20 × 10−30.5[52]
Pd-Ag23%/PSS14002.8400NA5.96 × 10−30.5[52]
Pd-Ag23%/PSS9002.8400NA5.25 × 10−30.5[52]
Pd-Ag23%/PSS5002.8400NA4.66 × 10−30.5[52]
Pd-Ag23%/PSS1002.8400NA3.67 × 10−30.5[52]
Pd/PSS1002035016.4* 5 × 10−70.5[53]
Pd/PSS501040014.7* 8.7 × 10−70.55[24]
Pd/Al2O3200740011.7* 2.3 × 10−60.54[24]
Pd/YSZ501140012.8** 2.54 × 10−50.7This work
Pd-Au/Al2O3508400NA8.42 × 10−40.5This work
* Values are reported in units of mol/m·s·Pa0.5 which can be converted to the current units by diving over membrane thickness; ** units of mol/m·s·Pa0.7.
Table 3. Ideal Selectivity of H2 with respect to He and Ar under various pressures at 400 °C for composite Pd and Pd-Au membranes.
∆p (kPa)αH2/HeαH2/Ar
Pd Membrane
507005900
1006604000
1506503800
2006403700
Pd-Au Membrane
50
100670018,200
150460012,400
Table 4. XRD analysis for Pd and Pd-Au MRs at 400 °C.
2θ (°)d (°A)dlit (°A)Rel. Int. (%)hkl
Pd Membrane
40.13072.247032.24439100111
46.71371.944571.9437016.81200
68.17751.374361.3744016.55220
82.20121.171771.172109.46311
86.66511.122511.122204.27222
Pd-Au Membrane
39.85282.260182.25802100.00111
46.45811.953051.9555047.66002
67.75341.381931.3827515.56022
81.76101.176961.1792115.33113
86.12991.128101.129014.26222

