Vulnerability of Coastal Beach Tourism to Flooding: A Case Study of Galicia, Spain


Abstract
:1. Introduction
2. Flooding and Tourism in Spain
- Infrastructure that limits channeling capacity;
- Drainage systems with insufficient capacity;
- Lack of maintenance of drainage systems;
- Ecosystem modification;
- Inappropriate land management and land use, including development in flood zones;
- Forest fires that reduce forest water storage capacity as a result of vegetation loss.
3. Methodology for the Assessment of Beach Vulnerability
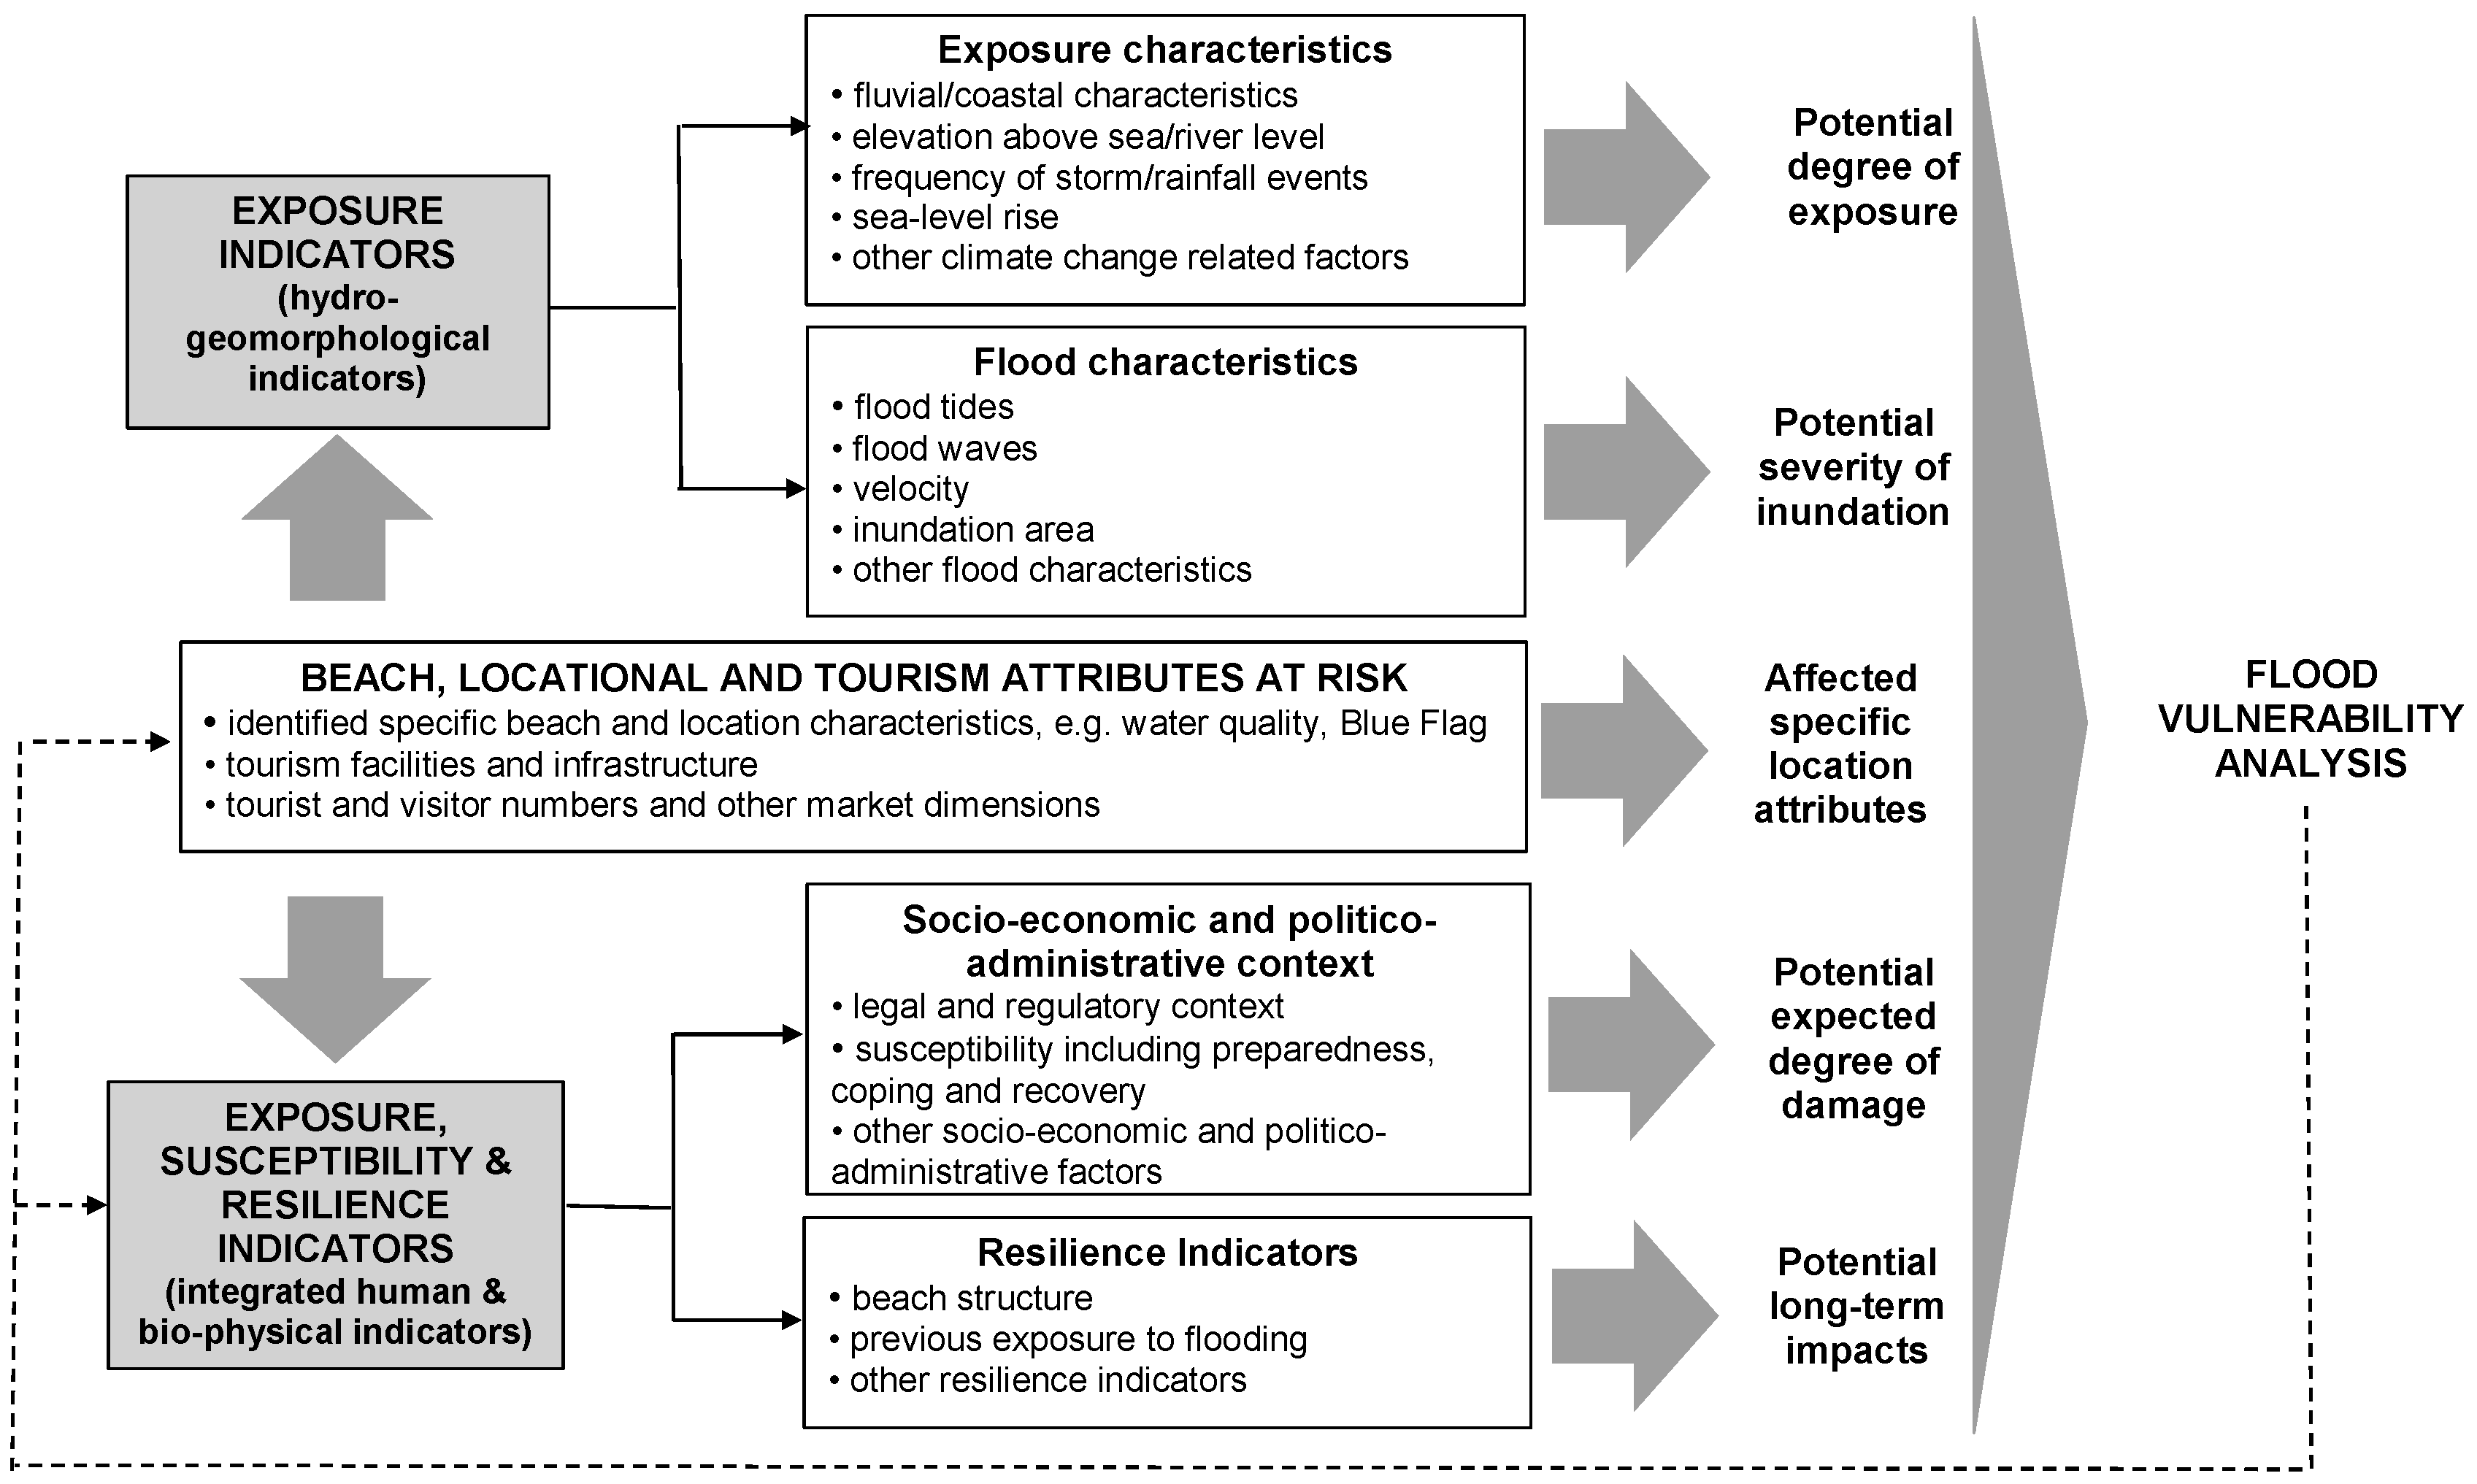
3.1. Vulnerability Analysis
- Climate change, which affects sea levels, as well as rainfall and storm frequencies and intensities;
- Sediment supply, which influences flood pathways, coastal geomorphology and ecosystems;
- Socio-economic change, which can alter the type and extent of human activities and behaviors within the floodplain.
3.2. Exposure Indicators for the Hydro-Geomorphological Subsystem
3.3. Exposure Indicators of Flood Characteristics
3.4. Indicators for Socio-Economic and Political-Administrative Systems
3.5. Resilience Indicators
3.6. Uncertainties
3.7. Scaling and Weighting Indicators
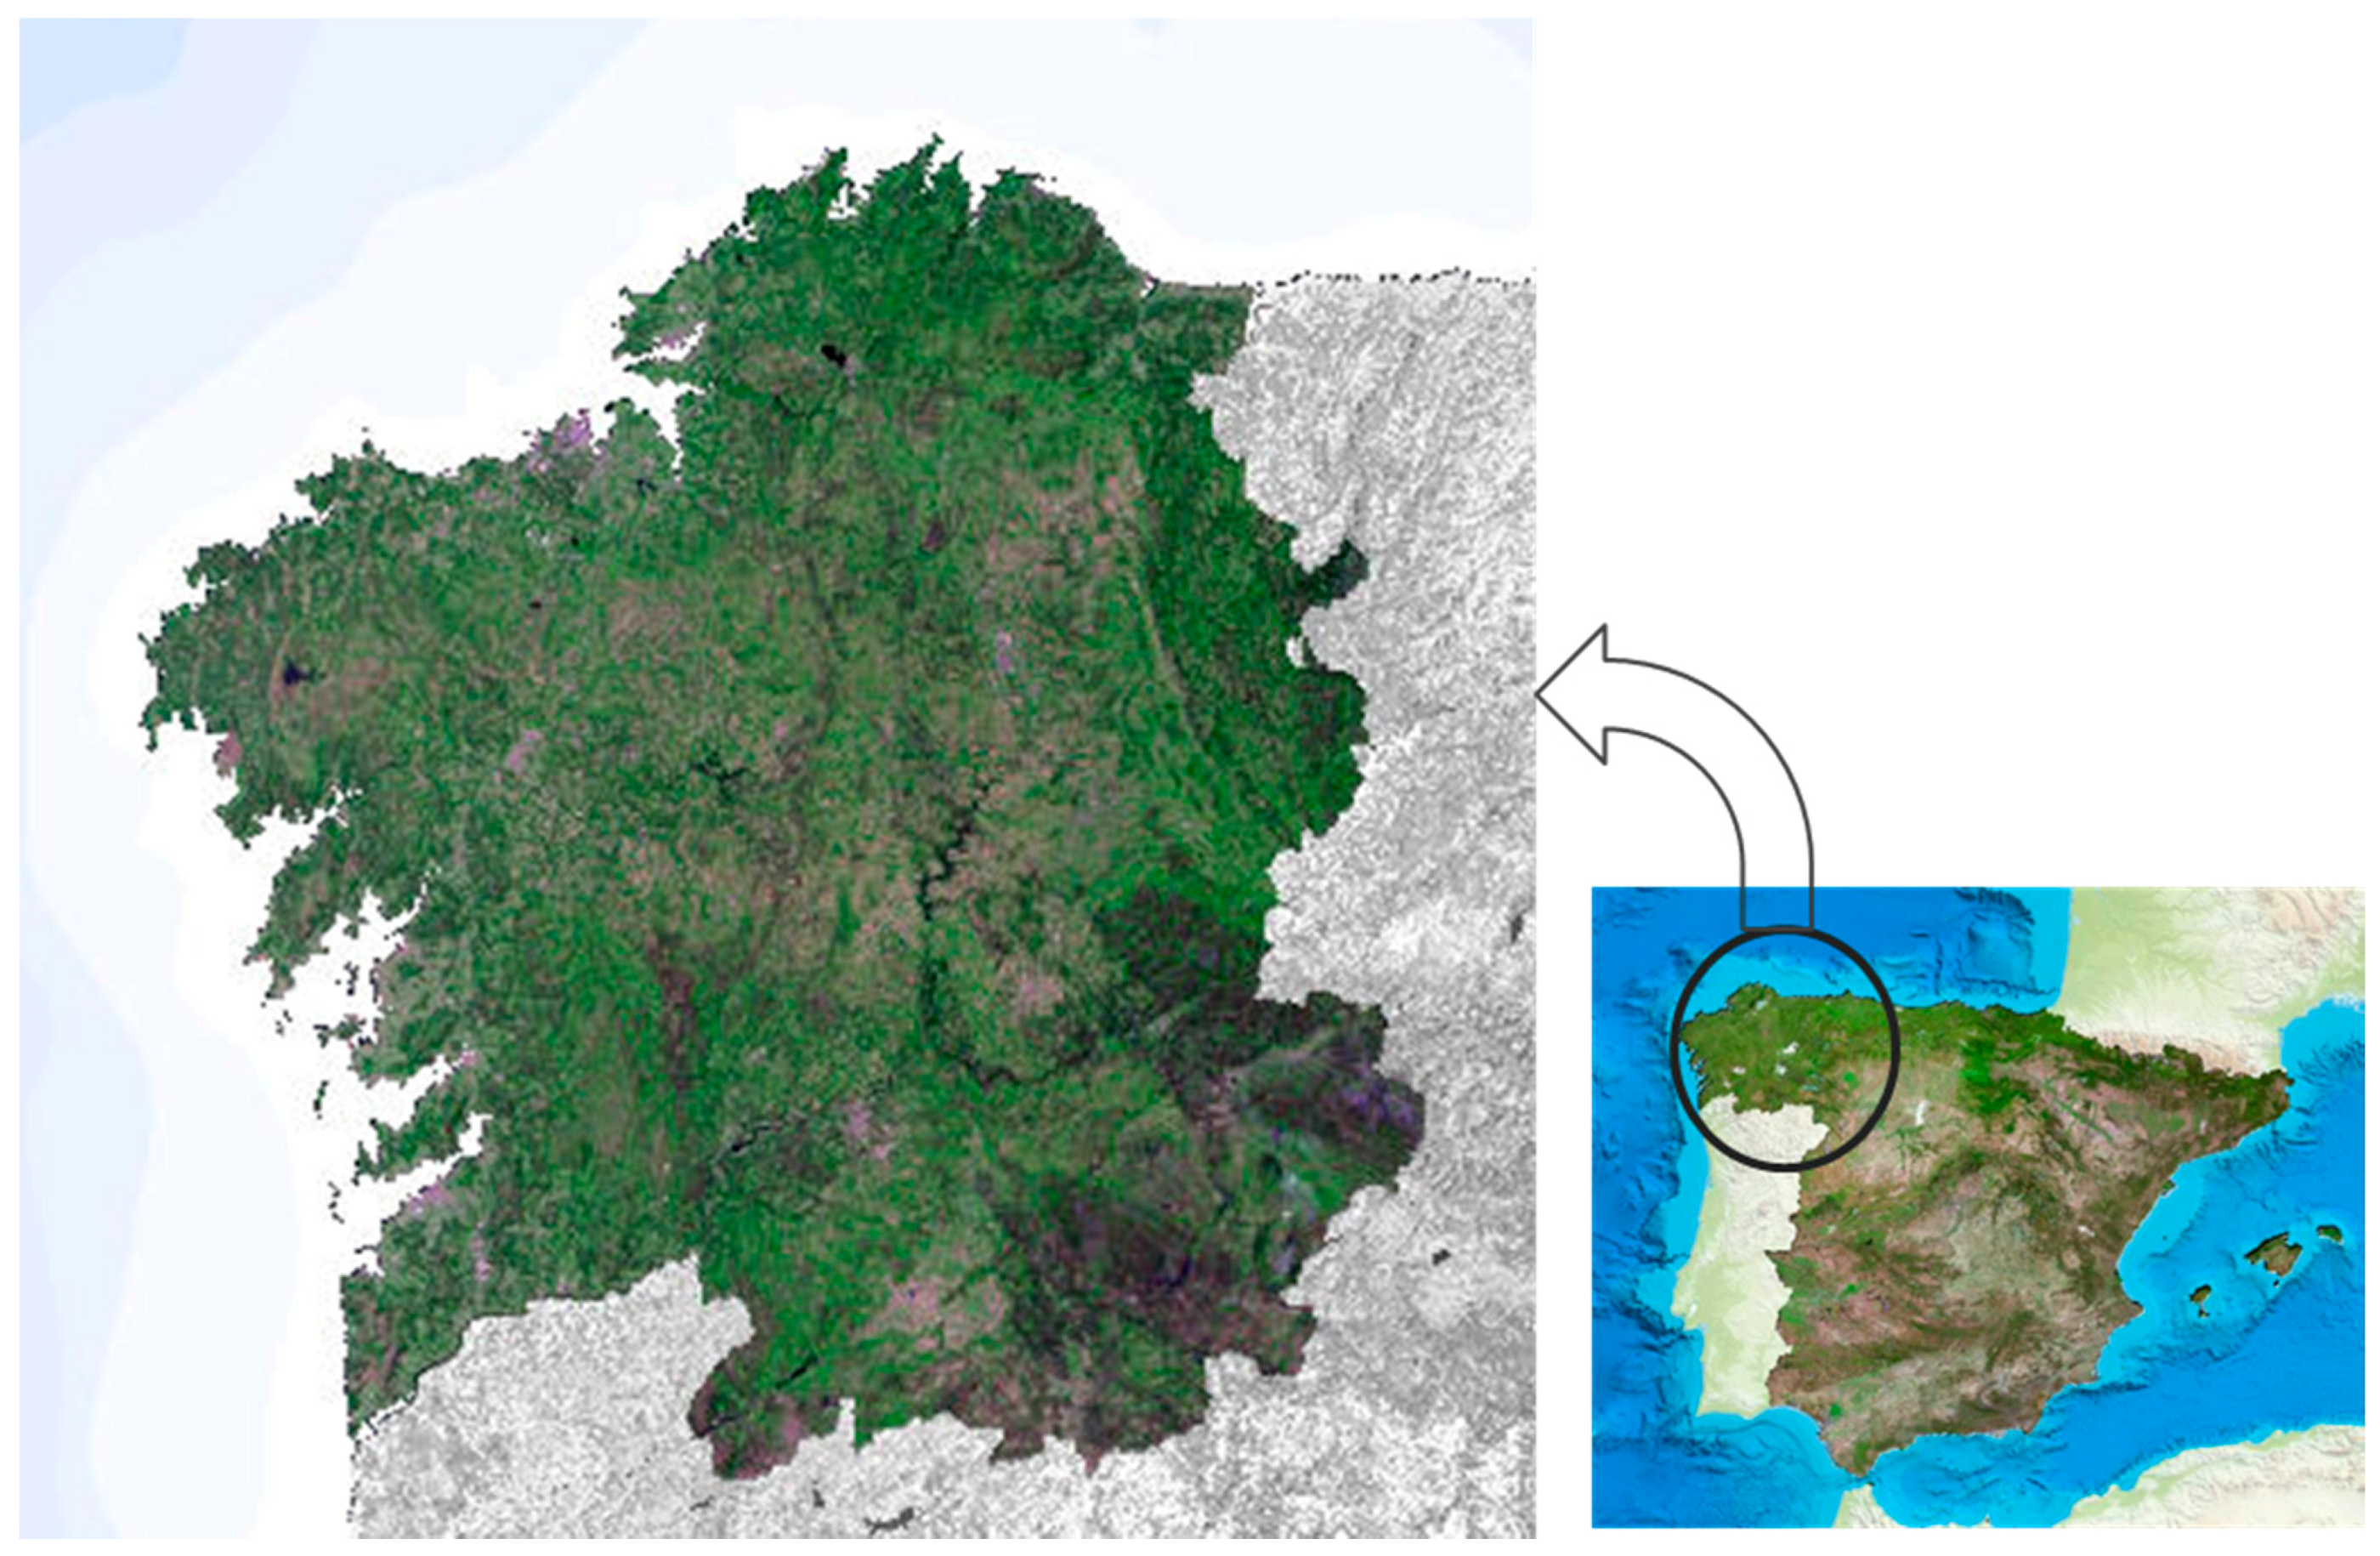
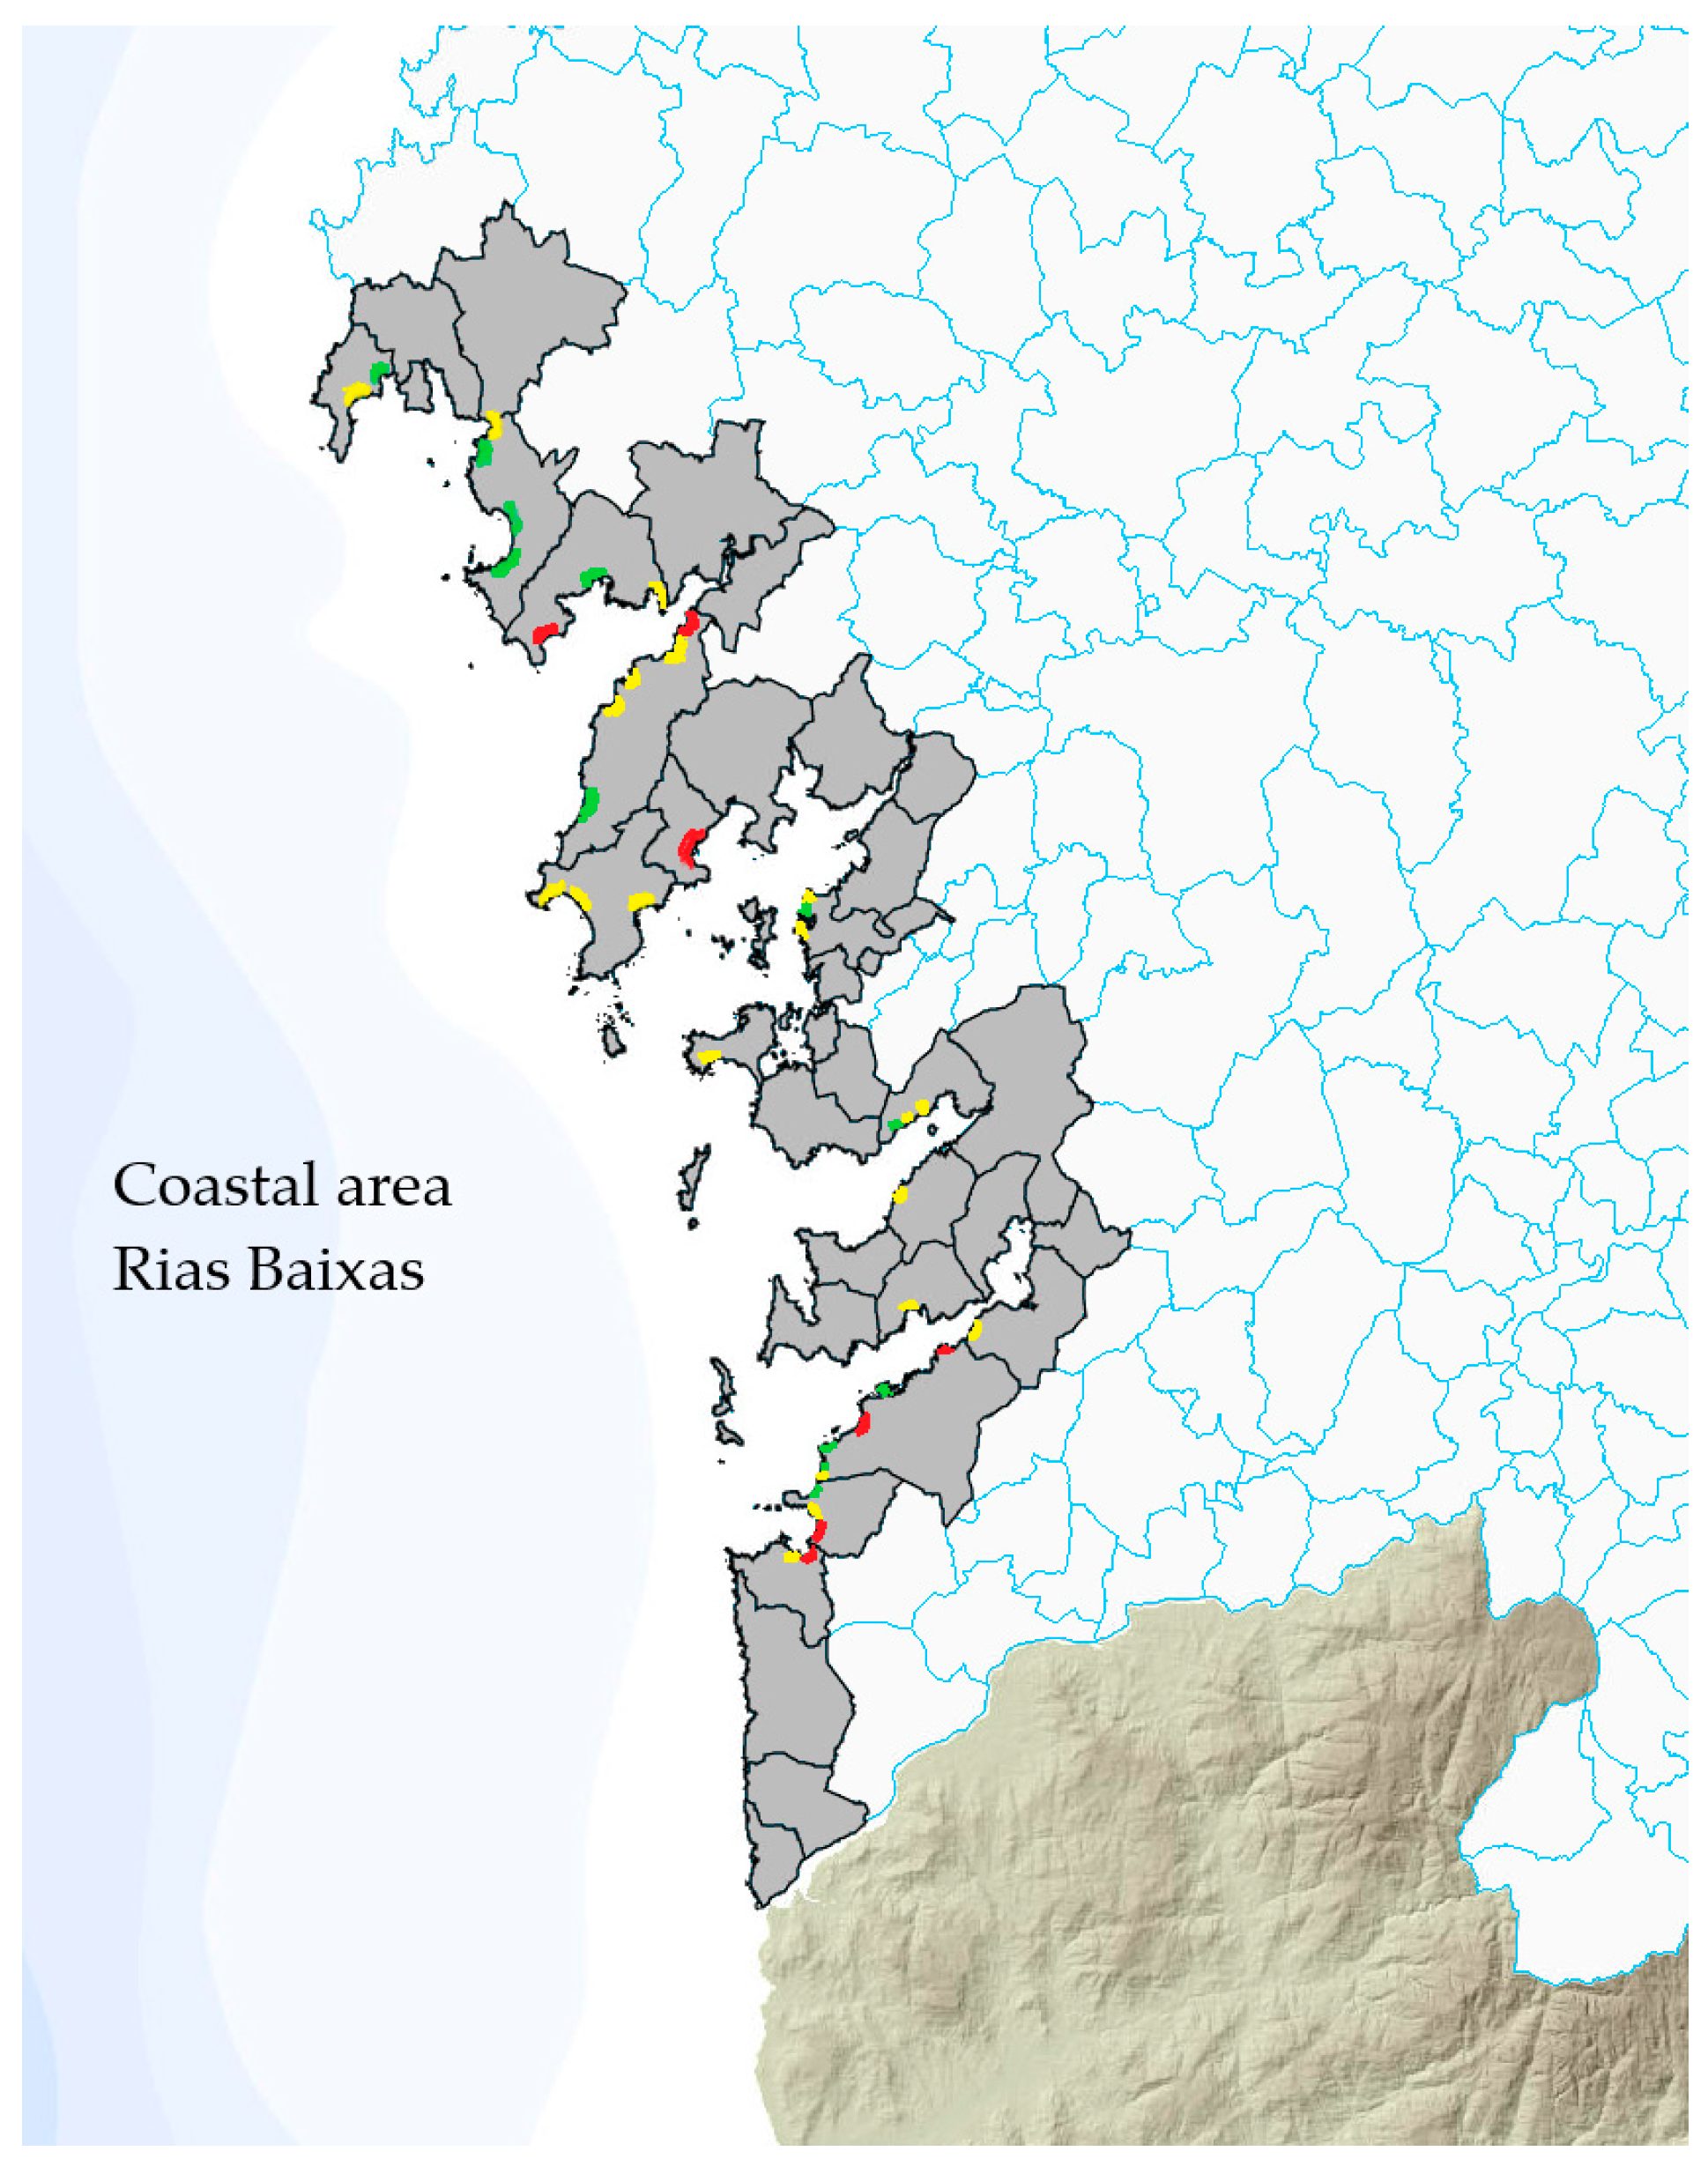
4. Beach Vulnerability Assessment: Galicia
4.1. Hydrogeomorphology—Fluvial/Coastal Characteristics
4.2. Hydrogeomorphology—Elevation above Sea Level
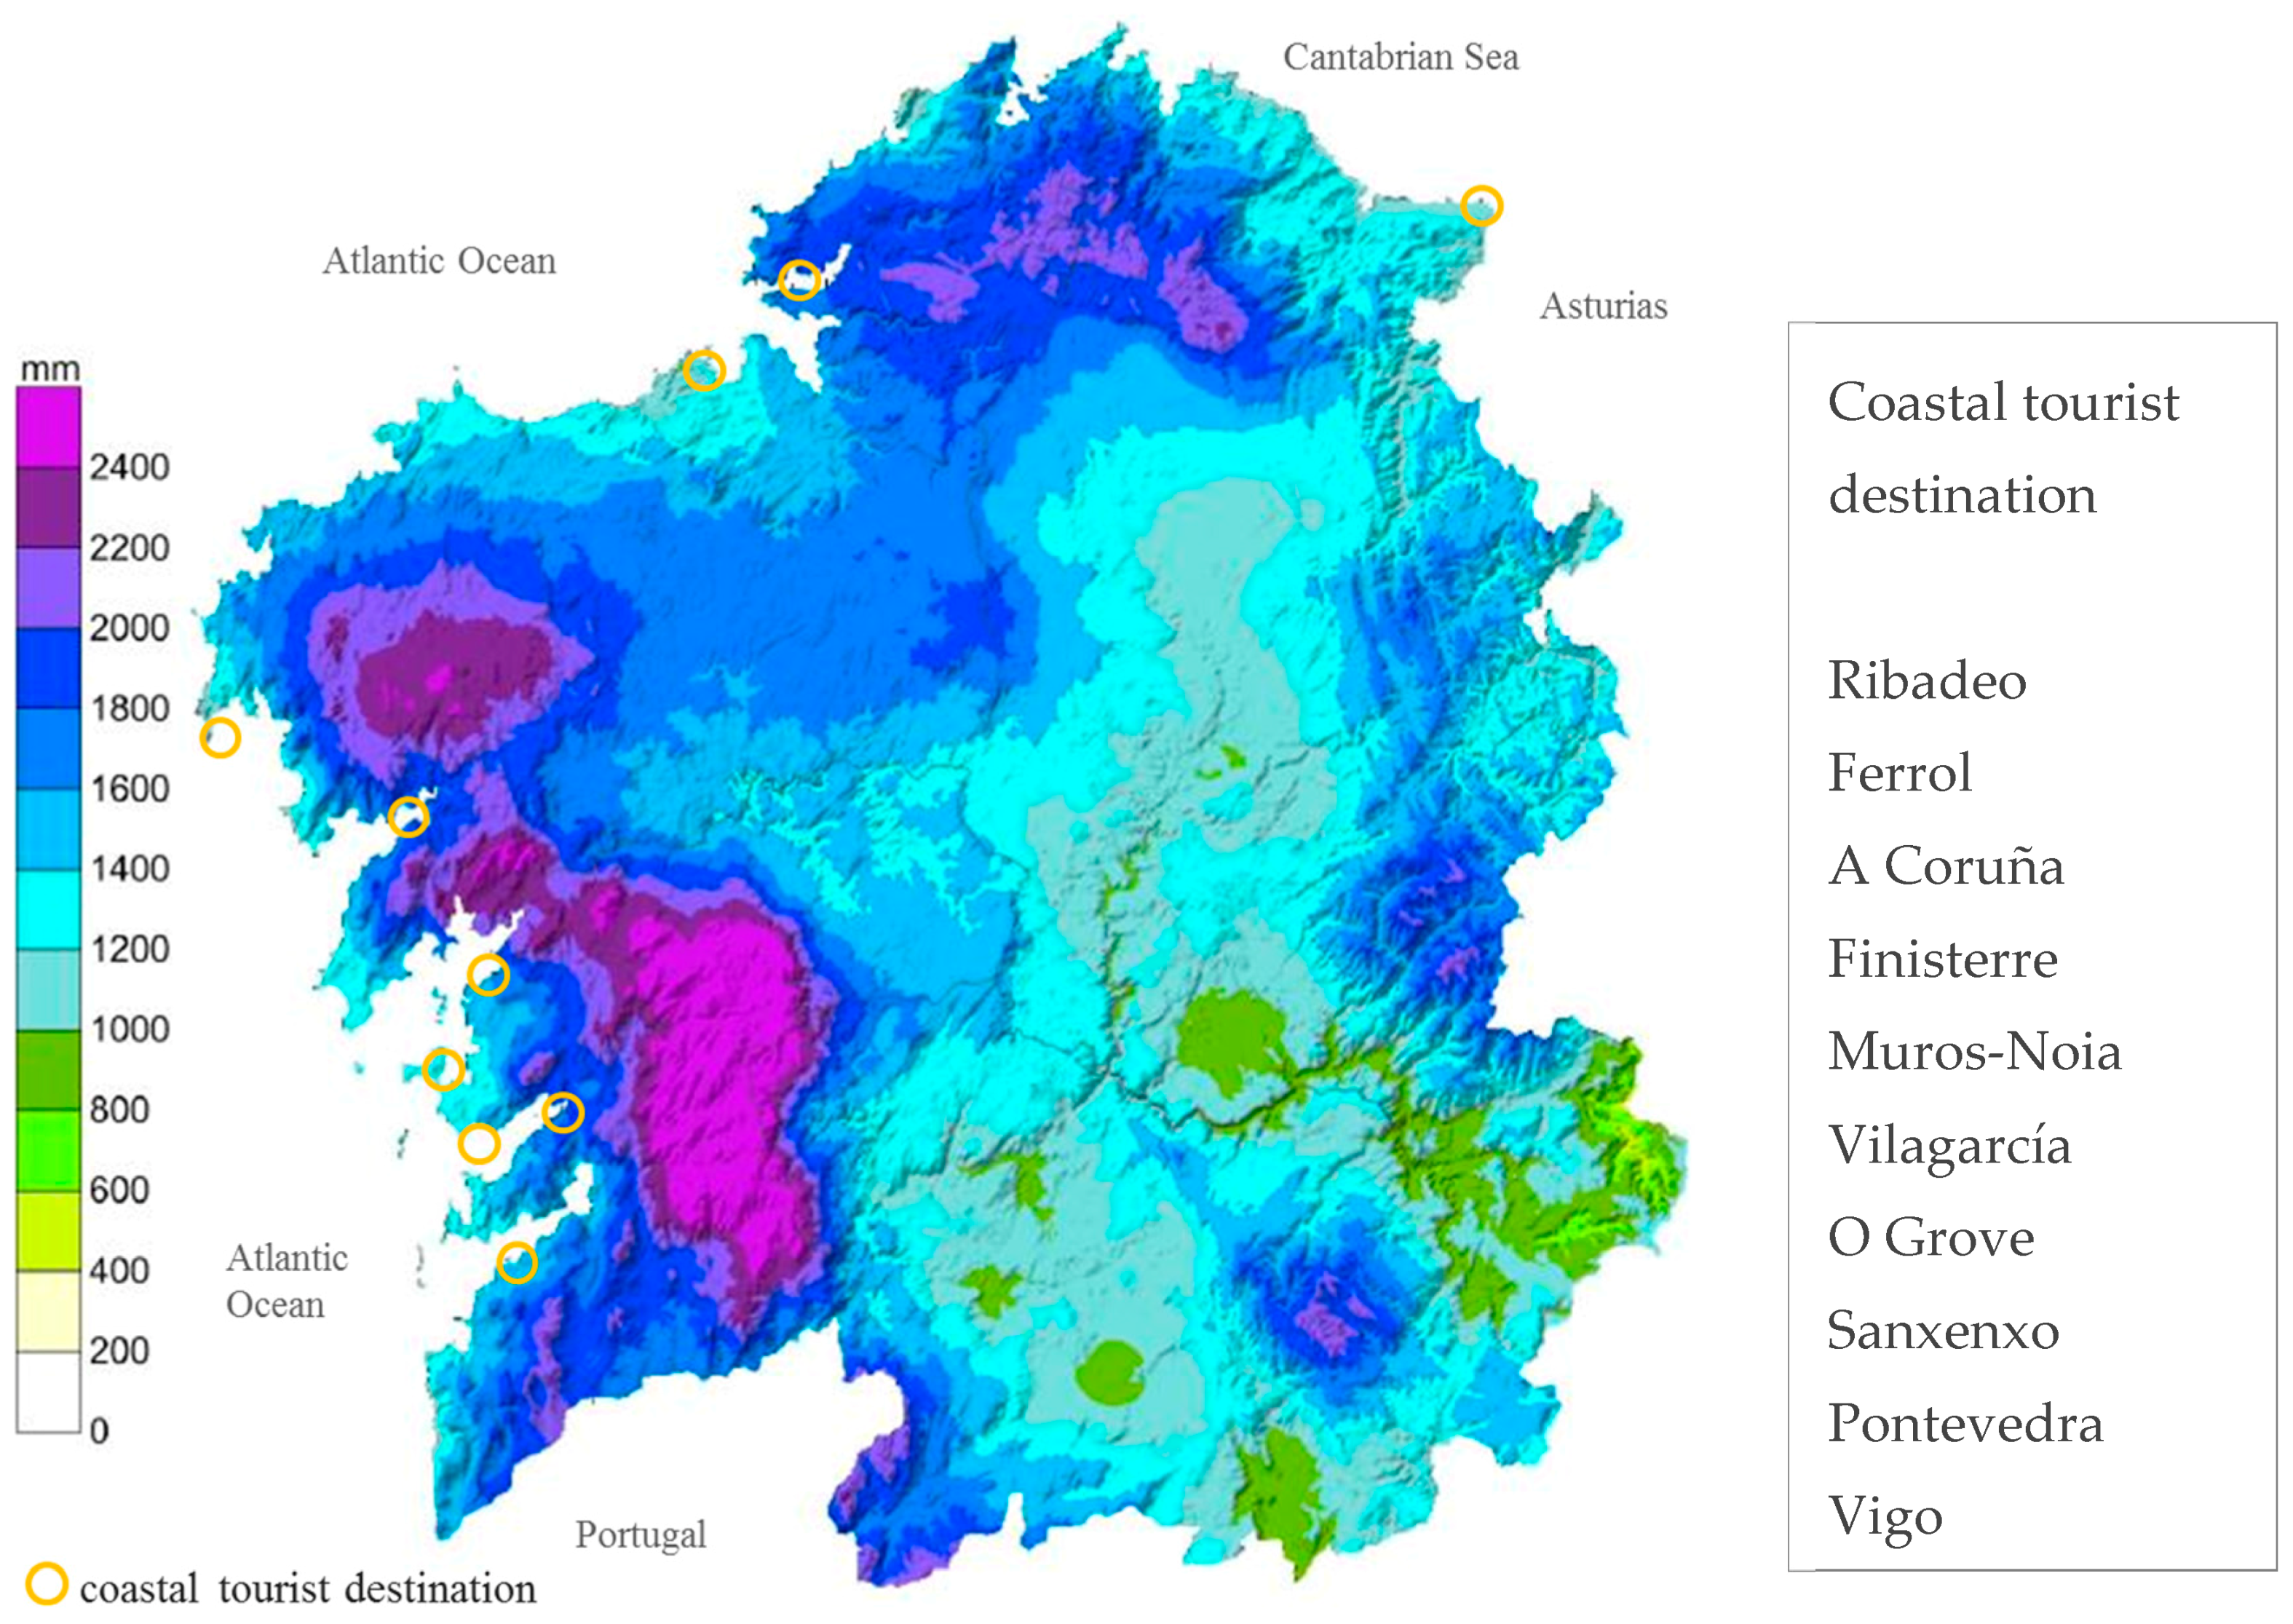
4.3. Hydrogeomorphology—Frequency of Rainfall Events
4.4. Hydrogeomorphology—Frequency of Storms
4.5. Hydrogeomorphology—Sea Level Rise
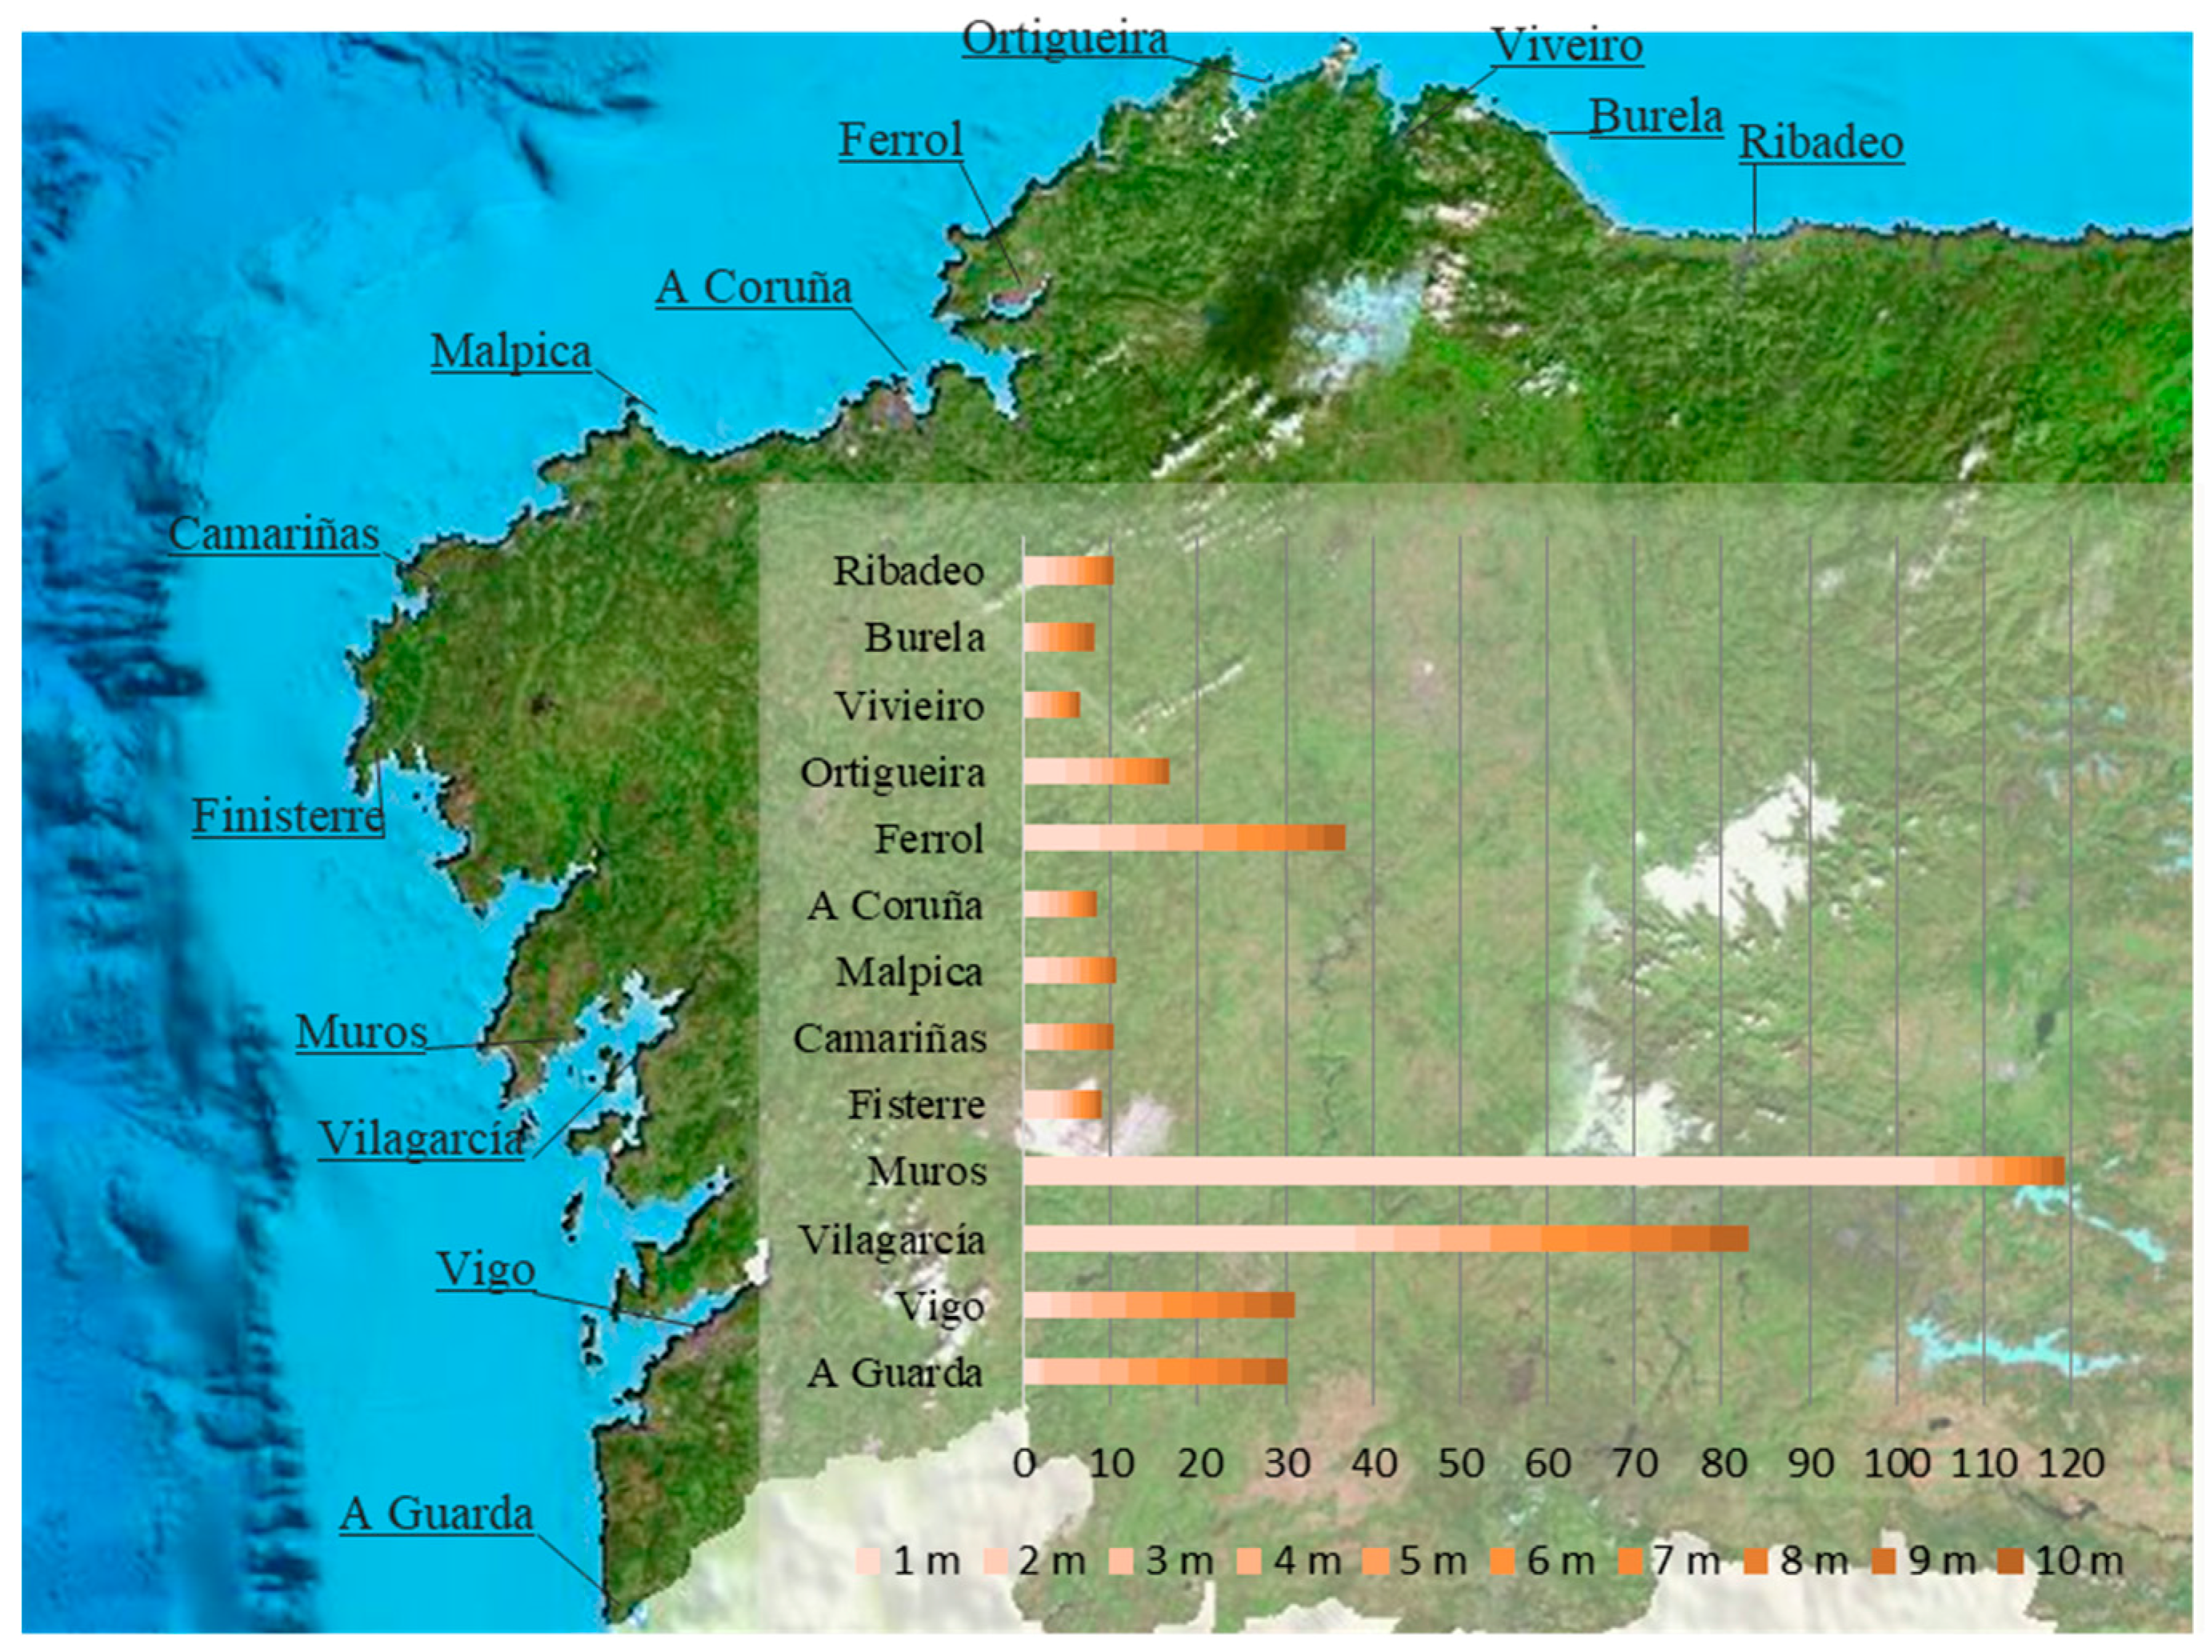
4.6. Flood Characteristics—Tides, Waves, Velocity and Inundation Area
4.7. Other Flood Characteristics
4.8. Socio-Economic and Politico-Administrative Context: Legal and Regulatory Context
4.9. Socio-Economic and Politico-Administrative Context: Susceptibility Including Preparedness, Coping and Recovery
4.10. Socio-Economic and Politico-Administrative Context: Other Socio-Economic and Politico-Administrative Factors
4.11. Resilience Indicators—Beach Structure
4.12. Resilience Indicators—Previous Exposure to Flooding
4.13. Resilience Indicators—Other Resilience Indicators
5. Tourism Vulnerability Assessment
6. Discussion and Conclusions
Acknowledgments
Author Contributions
Conflicts of Interest
Appendix A. Beaches Located at Potential Significant Flood Risk Areas in Galicia

| Length | Width | Typology | Population Density | Tourism Facilities and Infrastructure | Water Quality | Blue Flag | Mid-Range of Tidal Flooding (m) | Mid-Range of Wave Flooding (m) | ||||||||
|---|---|---|---|---|---|---|---|---|---|---|---|---|---|---|---|---|
| Beach Name | Municipality | 16 | 15 | 14 | 16 | 15 | 14 | T100 | T500 | T100 | T500 | |||||
| Covas | Viveiro | 1500 | 10–400 | village | High | promenade, camping, recreational area | G | G | G | 124.15 | 126.1 | 11.86 | 11.68 | |||
| O Torno | Cervo | 650 | 30–90 | village | High | Seafront | E | na | G | √ | √ | 34.73 | 35.73 | 23.96 | 25 | |
| Cubelas | 250 | 10–40 | village | Medium | seafront, recreational area | na | P | P | ||||||||
| Caosa | 120 | 15–60 | urban | Low | na | S | S | |||||||||
| Lago | Xove | 700 | 25–80 | rural | Medium | dunes, gardens and rest area | E | E | E | |||||||
| O Portelo | Burela | 460 | 25–110 | village | High | Seafront | E | E | G | √ | √ | √ | 13.02 | 12.38 | 26.28 | 27.18 |
| Penoural | 109 | 35–70 | village | Low | Seafront | P | P | P | ||||||||
| Areal | A Pobra Caramiñal | 1100 | 26 | urban | High | promenade, yacht club, recreational areas | G | G | G | 71.46 | 75.97 | 2.57 | 1.72 | |||
| Corrubedo | Ribeira | 5000 | 25–40 | remote | Medium | natural park | E | E | E | 59.13 | 57.87 | 22.11 | 24.59 | |||
| O Prado | 300 | 25 | village | Medium | anchorage | S | P | P | ||||||||
| Suigrexa | Porto do Son | 420 | 20 | rural | Medium | S | G | E | 29 | 28.8 | 20.66 | 22.62 | ||||
| Fonforrón | 100 | 7 | rural | High | E | E | E | |||||||||
| A Vila | 170 | 15 | village | High | S | G | E | |||||||||
| San Pedro | Carnota | 250 | 160 | village | Low | seafront | G | G | E | 137.62 | 139.22 | 43.86 | 49.81 | |||
| Ézaro | Dumbría | 800 | 28 | rural | Medium | E | E | E | √ | √ | √ | 26.79 | 32.56 | 67.53 | 89.95 | |
| Lires | Cee | 123 | 20 | remote | Medium | P | P | S | 26.52 | 29.72 | 1.41 | 2.2 | ||||
| Langosteira | Fisterra | 1970 | 26 | rural | Medium | E | E | E | √ | √ | 40.45 | 40.55 | 30.69 | 34.78 | ||
| Espiñeirido | Muxía | 250 | 15 | rural | Low | E | E | E | 25.94 | 26.02 | 59.19 | 62.3 | ||||
| A Cruz | 70 | 100 | rural | Medium | E | E | E | |||||||||
| Area da Vila | Camariñas | 200 | 100 | village | Medium | seafront, yacht club | P | P | P | 10.24 | 9.65 | 11.59 | 13.59 | |||
| Arou | 130 | 50 | rural | Medium | seafront | E | E | E | 17.75 | 18.87 | 87.07 | 88.1 | ||||
| Camelle | 150 | 105 | village | Low | seafront | P | P | P | ||||||||
| Soesto | Laxe | 850 | 30 | remote | Low | surf | E | E | E | 62.67 | 67.82 | 171.12 | 173.51 | |||
| Playa Mayor | Malpica | 378 | 60 | urban | High | surf | S | S | P | 15.27 | 15.77 | 18.64 | 18.14 | |||
| Santa Cristina | Oleiros | 1500 | 80 | village | High | E | E | E | √ | √ | √ | 123.35 | 123.18 | 1.35 | 2.35 | |
| Riazor | A Coruña | 570 | 25 | urban | High | promenade, recreational area | E | E | E | √ | √ | √ | 31.6 | 31.95 | 68.47 | 72.07 |
| Orzán | 700 | 30 | urban | High | promenade, recreational area | E | E | E | √ | √ | √ | |||||
| Matadero | 80 | 20 | urban | High | promenade | E | E | E | √ | √ | √ | |||||
| O Pedrido | Bergondo | 500 | 40 | urban | High | camping | S | G | G | 1619.52 | 1632.09 | 14.4 | 11.06 | |||
| A Magdalena | Cedeira | 1400 | 35 | urban | High | recreational area | S | P | S | 20.8 | 21.07 | 31.18 | 31.97 | |||
| Santa Marta | Baiona | 210 | 60–111 | village | High | yacht club | G | G | G | 104.69 | 106.26 | 16.07 | 18.21 | |||
| Ladeira | 1650 | 28–68 | village | High | dunes, camping | G | na | P | √ | |||||||
| América | Nigrán | 1300 | 50–100 | village | High | recreational sport area | E | E | E | √ | √ | √ | ||||
| Panxón | 1100 | 50–200 | urban | High | promenade, yacht club | E | G | na | ||||||||
| Madorra | 350 | 45 | village | High | E | E | G | |||||||||
| Area Fofa | 130 | 25 | rural | Medium | E | G | E | |||||||||
| Patos | 1400 | 25–80 | village | High | seafront, sport area | E | E | E | 45.69 | 45.2 | 20.66 | 23.2 | ||||
| As Canas | 150 | 25–80 | rural | Low | S | S | S | |||||||||
| Muiños de Fortiñón | Vigo | 120 | 60 | rural | High | E | E | E | √ | √ | √ | |||||
| O Portiño | 130 | 30 | village | Low | E | E | E | |||||||||
| A Sobreira | 180 | 35 | rural | Medium | E | E | E | |||||||||
| Arealonga | Redondela | 180 | 35 | rural | Medium | P | P | P | 6.96 | 7.06 | 0.6 | 0.74 | ||||
| A Punta | Vigo | 50 | 5–120 | rural | High | seafront | E | E | E | √ | √ | √ | ||||
| Bouzas | 450 | 25 | village | Medium | seafront | E | E | E | ||||||||
| Portiño | O Grove | 100 | 5–15 | village | Medium | yacht club | E | G | S | 27.69 | 33.6 | 3.48 | 1.67 | |||
| O Bornal | Vilanova de Arousa | 400 | 20 | village | Medium | E | E | E | 104.01 | 104.9 | 2.04 | 2.21 | ||||
| Terrón | 500 | 15 | rural | High | E | E | E | |||||||||
| As Brañas | 150 | 3 | rural | Low | E | E | E | |||||||||
| Con da Mina | 200 | 10 | village | Medium | E | E | E | |||||||||
| A Igrexa | 250 | 6 | rural | Low | E | E | E | |||||||||
| Length | Width | Typology | Population Density | Tourism Facilities and Infrastructure | Water Quality | Blue Flag | Area of a Potential Fluvial Flooding (km2) | Volume of River Flow (m3/s) | ||||||||||
|---|---|---|---|---|---|---|---|---|---|---|---|---|---|---|---|---|---|---|
| Beach Name | Municipality | 16 | 15 | 14 | 16 | 15 | 14 | T10 | T100 | T500 | T10 | T100 | T500 | |||||
| Esteiro | Ribadeo | 52 | 6–220 | remote | medium | seafront | S | G | G | 0.038 | 0.086 | 0.103 | 7.41 | 17.13 | 26.31 | |||
| Arealonga | Barreiros | 1000 | 45–170 | village | medium | seafront | E | G | G | √ | 0.003 | 0.01 | 0.017 | 2.01 | 4.73 | 7.32 | ||
| Covas * | Viveiro | 1500 | 10–400 | village | high | promenade, camping, ruiniform formations, recreational area | E | E | G | 0.003 | 0.006 | 0.009 | 7.66 | 17.15 | 25.99 | |||
| Sardiñeiro | Fisterra | 370 | 60 | village | low | seafront | P | P | P | 0.005 | 0.002 | 0.022 | 6 | 13.05 | 19.52 | |||
| Lires * | Cee | 123 | 20 | remote | medium | P | P | S | 0.018 | 0.141 | 0.183 | 14.9 | 32.18 | 48 | ||||
| San Pedro * | Carnota | 250 | 160 | village | low | seafront | G | G | E | 0.012 | 0.016 | 0.019 | 4.66 | 8.99 | 12.71 | |||
| San Mamede | 300 | 45 | remote | low | E | E | E | 0.009 | 0.02 | 0.037 | 6.7 | 14.48 | 21.6 | |||||
| Porto Cubelo | 20 | 20 | rural | low | E | E | E | 0.008 | 0.017 | 0.022 | 2.51 | 5.55 | 8.38 | |||||
| A Magdalena * | Cedeira | 1400 | 35 | urban | high | recreational area | S | P | S | 0.012 | 0.034 | 0.048 | 3.77 | 8.8 | 13.56 | |||
| Arnela | Ponteceso | 100 | 20 | urban | medium | seafront | na | P | P | 0.002 | 0.004 | 0.007 | 3.03 | 6.23 | 9.08 | |||
| Razo | Carballo | 800 | 30 | rural | high | dunes, marshland, fossil beach | G | S | S | 0.037 | 0.067 | 0.083 | 14.6 | 31.02 | 45.9 | |||
| A Concha | Ortigueira | 750 | 30 | village | medium | anchorage, cultural heritage | G | E | E | √ | √ | √ | 0.016 | 0.038 | 0.051 | 15.5 | 22.7 | 28 |
| Queiruga | Porto do Son | 1200 | 75 | rural | medium | E | E | E | 0.003 | 0.014 | 0.015 | 3.29 | 6.56 | 9.42 | ||||
| Pozo | 100 | 30 | rural | medium | S | G | E | 0.013 | 0.018 | 0.02 | 7.61 | 14.95 | 21.33 | |||||
| Coira | 720 | 20 | village | high | seafront | E | E | E | 0.001 | 0.003 | 0.006 | 8.97 | 17.39 | 24.66 | ||||
| Ornanda | 300 | 25 | rural | high | 1st category camping | E | E | E | √ | 0.001 | 0.021 | 0.028 | 18.9 | 32.87 | 48.07 | |||
| Bastiagueiro | Oleiros | 500 | 100 | village | high | seafront, recreational area, camping, bike path | E | E | E | √ | √ | √ | 0.013 | 0.026 | 0.034 | 4.35 | 9.7 | 14.67 |
| San Francisco | Muros | 820 | 30 | village | high | seafront, recreational area | E | E | E | √ | √ | √ | 0.001 | 0.004 | 0.007 | 1.33 | 3.08 | 4.75 |
| Ventín | 160 | 30 | rural | low | recreational area | E | E | E | 0.008 | 0.012 | 0.012 | 2.3 | 5.05 | 7.58 | ||||
| Parameán | 250 | 30 | village | medium | G | G | G | 0.007 | 0.013 | 0.015 | 11.4 | 22.12 | 31.44 | |||||
| Perbes | Miño | 540 | 45 | village | high | promenade, camping | E | E | E | √ | √ | √ | 0.007 | 0.001 | 0.017 | 7.3 | 14.55 | 20.9 |
| Coroso | Ribeira | 1700 | 20 | village | high | seafront, leisure port | E | E | E | √ | √ | 0.043 | 0.069 | 0.089 | 8.95 | 20.34 | 31.01 | |
| Areal * | Pobra do Caramiñal | 1100 | 26 | urban | high | promenade, yacht club, recreational areas | G | G | G | 0.13 | 0.232 | 0.27 | 20.4 | 42.22 | 61.76 | |||
| Barrañán | Arteixo | 1100 | 20 | rural | high | seafront, dunes | E | E | E | √ | √ | √ | 0.091 | 0.114 | 0.125 | 23.9 | 35.9 | 45 |
| Alba-Sabón | 850 | 30–80 | remote | medium | seafront | E | E | E | √ | √ | √ | 0.064 | 0.124 | 0.157 | 24.6 | 37.6 | 47.6 | |
| Samil | Vigo | 1250 | 60 | village | high | promenade, recreational area | E | G | S | 0.043 | 0.866 | 1.034 | 90.5 | 138.5 | 175.5 | |||
| Xunqueira | Moaña | 500 | 50 | village | high | promenade, recreational area | G | S | G | 0.3 | 0.087 | 0.115 | 17.5 | 45.88 | 70.43 | |||
| Santa Marta * | Baiona | 210 | 60–111 | village | high | yacht club | G | G | G | 0.016 | 0.045 | 0.057 | 27 | 52.52 | 74.5 | |||
| Arealonga * | Redondela | 180 | 35 | rural | medium | P | P | P | 0.012 | 0.017 | 0.022 | 9.52 | 18.67 | 26.6 | ||||
| Loira | Marín | 330 | 40 | village | high | promenade, recreational area | G | S | S | 0.008 | 0.016 | 0.022 | 22.9 | 34.8 | 43.9 | |||
| Laño | Poio | 585 | 15 | village | low | S | S | P | 0.001 | 0.004 | 0.006 | 9.14 | 17.95 | 25.59 | ||||
| Covelo | 60 | 5 | village | medium | promenade, anchorage | E | E | G | 0.002 | 0.006 | 0.008 | 9.13 | 18.16 | 26.05 | ||||
| Chancelas peq. | 140 | 8–30 | village | medium | promenade | E | E | E | 0.001 | 0.001 | 0.002 | 6.76 | 12.69 | 17.7 | ||||
Appendix B. Calculation Procedure for Riazor beach, A Coruña Municipality
- Level of visitation (Lv). Beaches score low to high (1–3), depending on use, with urban beaches being considered the most visited (score 3), those in the vicinity of a tourist destination being medium frequented (score 2) and remote beaches scoring 1. This indicator is double-weighted.
- Tourism facilities and infrastructure (Tf). Here, the highest score is given to camping, recreational areas or important cultural heritage, in addition to other infrastructures like promenade, seafront or marinas. A lower scoring (2) applies to beaches with less prominent infrastructure and the lowest scoring (1) to beaches without infrastructure.
- Beach width (W). The smaller the beach, the more vulnerable it is considered. The indicator score is 1 for beaches that are more than 75 m wide, score 2 for beaches between 15–75 m wide and score 3 for beaches with 15 m width or less.
- Typology (remote, rural, village or urban) [101]: urban
- Level of occupation: high
- Coastal tourist destination: yes
- Attributes at risk: promenade, recreational area
- Blue flag certified
- Average width = 25 m.
References
- Hall, C.M. Trends in ocean and coastal tourism: The end of the last frontier? Ocean Coast. Manag. 2001, 44, 601–618. [Google Scholar] [CrossRef]
- United Nations Environment Programme (UNEP). Report on the Seminar “Coastal Tourism in the Mediterranean: Adapting to Climate Change”, Cagliari, Italy, 8–10 June 2009; United Nations Environment Programme (UNEP), République Française-Ministère de l’Écologie, du Développement et de l’Aménagement Durables, United Nations World Tourism Organization (UNWTO), Priority Actions Programme: Paris, France, 2009. [Google Scholar]
- Hall, C.M. Global change, islands and sustainable development: Islands of sustainability or analogues of the challenge of sustainable development? In Routledge International Handbook of Sustainable Development; Redclift, M., Springett, D., Eds.; Routledge: Abingdon, UK, 2015; pp. 55–73. [Google Scholar]
- Hoegh-Guldberg, O.; Beal, D.; Chaudhry, T.; Elhaj, H.; Abdullat, A.; Etessy, P.; Smits, M. Reviving the Ocean Economy: The Case for Action–2015; WWF International: Gland, Switzerland, 2015. [Google Scholar]
- Scott, D.; Hall, C.M.; Gössling, S. Tourism and Climate Change: Impacts, Adaptation and Mitigation; Routledge: London, UK, 2012. [Google Scholar]
- Intergovernmental Panel on Climate Change (IPCC). Climate Change 2007: The Physical Science Basis; Contribution of Working Group I to the Fourth Assessment Report of the Intergovernmental Panel on Climate Change; Cambridge University Press: Cambridge, UK, 2007. [Google Scholar]
- Van Oldenborgh, G.J.; Collins, M.; Arblaster, J.; Christensen, J.H.; Marotzke, J.; Power, S.B.; Rummukainen, M.; Zhou, T. Annex I: Atlas of Global and Regional Climate Projections. In Climate Change 2013: The Physical Science Basis. Contribution of Working Group I to the Fifth Assessment Report of the Intergovernmental Panel on Climate Change; Stocker, T.F., Qin, D., Plattner, G.-K., Tignor, M., Allen, S.K., Boschung, J., Nauels, A., Xia, Y., Bex, V., Midgley, P.M., Eds.; Cambridge University Press: Cambridge, UK; New York, NY, USA, 2013. [Google Scholar]
- Gössling, S.; Peeters, P.; Hall, C.M.; Dubois, G.; Ceron, J.P.; Lehmann, L.; Scott, D. Tourism and water use: Supply, demand, and security. An international review. Tour. Manag. 2012, 33, 1–15. [Google Scholar] [CrossRef]
- Vitousek, S.; Barnard, P.L.; Fletcher, C.H.; Frazer, N.; Erikson, L.; Storiazzi, C.D. Doubling of coastal flooding frequency within decades due to sea-level rise. Sci. Rep. 2017, 7, 1399. [Google Scholar] [CrossRef] [PubMed]
- Hallegatte, S.; Green, C.; Nichols, R.J.; Corfee-Morlot, J. Future flood losses in major coastal cities. Nat. Clim. Chang. 2013, 3, 802–806. [Google Scholar] [CrossRef]
- Intergovernmental Panel on Climate Change (IPCC). Summary for policymakers. In Climate Change 2014: Impacts, Adaptation, and Vulnerability. Part A: Global and Sectoral Aspects; Contribution of Working Group II to the Fifth Assessment Report of the IPCC; Cambridge University Press: Cambridge, UK; New York, NY, USA, 2014; pp. 1–32. [Google Scholar]
- Monbaliu, J.; Chen, Z.; Felts, D.; Ge, J.; Hissel, F.; Kappenberg, J.; Narayan, S.; Nicholls, R.J.; Ohle, N.; Schuster, D.; et al. Risk assessment of estuaries under climate change: Lessons from Western Europe. Coast. Eng. 2014, 87, 32–49. [Google Scholar] [CrossRef]
- Government of Galicia. Strategic Plan of Galicia, 2015–2020; Government of Galicia: Galicia, Spain, January 2016; Available online: http://www.planestratexico.gal/es/descarga (accessed on 8 July 2016).
- European Environment Agency (EEA). Mapping the Impacts of Recent Natural Disasters and Technological Accidents in Europe; Environmental Issue Report 35; EEA: Copenhagen, Denmark, 2004. [Google Scholar]
- Risk Management Solutions. Central Europe Flooding, Event Report; Risk Management Solutions: Newark, CA, USA, August 2002; Available online: http://forms2.rms.com/rs/729-DJX-565/images/fl_2002_central_europe_flooding.pdf (accessed on 24 June 2016).
- World Health Organization (WHO). Floods in the WHO European Region: Health Effects and Their Prevention; WHO Regional Office for Europe: Copenhagen, Denmark, 2013. [Google Scholar]
- Olcina Cantos, J. Prevención de riesgos: Cambio climático, sequías e inundaciones. In Fundación Nueva Cultura del Agua, Panel Científico-Técnico de Seguimiento de la Política de Aguas; Convenio Universidad de Sevilla-Ministerio de Medio Ambiente: Seville, Spain, 2008. [Google Scholar]
- Ministry of Agriculture and Fisheries, Food and Environment (MAPAMA). Gestión de los Riesgos de Inundación; Ministerio de Agricultura y Pesca: Alimentación y Medio Ambiente, Spain, 2016; Available online: http://www.mapama.gob.es/es/agua/temas/gestion-de-los-riesgos-de-inundacion/ (accessed on 24 June 2016).
- United Nation Office for Disaster Risk Reduction (UNISDR). Disaster & Risk Profile Spain. PreventionWeb, Project of UNISDR; UNISDR: Geneva, Switzerland, 2016; Available online: http://www.preventionweb.net/countries/esp/data (accessed on 26 June 2016).
- Frei, C.; Schöll, R.; Fukutome, S.; Schmidli, J.; Vidale, P.L. Future change of precipitation extremes in Europe: Intercomparison of scenarios from regional climate models. J. Geophys. Res. Atmos. 2006, 111. [Google Scholar] [CrossRef]
- Feyen, L.; Dankers, R.; Bódis, K.; Salomon, P.; Barredo, J.I. Fluvial flood risk in Europe in present and future climates. Clim. Chang. 2012, 12, 47–62. [Google Scholar] [CrossRef]
- Alfieri, L.; Burek, P.; Feyen, L.; Forzieri, G. Global warming increases the frequency of river floods in Europe. Hydrol. Earth Syst. Sci. 2015, 19, 2247–2260. [Google Scholar] [CrossRef] [Green Version]
- Ciscar, J.C.; Iglesias, A.; Feyen, L.; Goodess, C.M.; Szabó, L.; Christensen, O.B.; Nicholls, R.; Amelung, B.; Watkiss, P.; Bosello, F.; et al. Climate change impacts in Europe. In Final Report of the PESETA Research Project; Office for Official Publications of the European Communities: Luxembourg, 2009. [Google Scholar]
- Mojtahedi, S.M.H.; Oo, B.L. Coastal buildings and infrastructure flood risk analysis using multi-attribute decision-making. J. Flood Risk Manag. 2016, 9, 87–96. [Google Scholar] [CrossRef]
- Aguas de Galicia. Estudio Ambiental Estratégico. Plan de Xestión do Risco de Inundación da Demarcación Hidrográfica de Galicia-Costa (Ciclo 2015–2021); Aguas de Galicia: Santiago de Compostela, Spain, 2016. [Google Scholar]
- United Nations World Tourism Organization (UNWTO). Tourism Highlights, 2015 Edition; UNWTO: Madrid, Spain, 2015; Available online: http://www.e-unwto.org/doi/pdf/10.18111/9789284416899 (accessed on 16 March 2016).
- Instituto Nacional de Estadística (Spanish Statistic National Institute) (INE). Cuenta Satélite del Turismo de España. 2016. Available online: http://www.ine.es/dyngs/INEbase/es/operacion.htm?c=estadistica_C&cid=1254736169169&menu=ultiDatos&idp=1254735576863 (accessed on 9 February 2017).
- Exceltur. Estudio de Impacto Económico del Turismo: IMPACTUR Galicia 2014. Available online: http://www.exceltur.org/wp-content/uploads/2016/02/IMPACTUR-Galicia-2014.pdf (accessed on 3 September 2016).
- Gómez-Martín, M.B. Climate potential and tourist demand in Catalonia (Spain) during the summer season. Clim. Res. 2006, 32, 75–87. [Google Scholar] [CrossRef]
- Rutty, M.; Scott, D. Will the Mediterranean become “too hot” for tourism? A reassessment. Tour. Plan. Dev. 2010, 7, 267–281. [Google Scholar] [CrossRef]
- Olcina, C.; Vera-Rebollo, J.F. Climate change and tourism policy in Spain: Diagnosis in the Spanish Mediterranean coast. Cuadernos de Turismo 2016, 38, 323–571. [Google Scholar]
- Amelung, B.; Nichols, S.; Viner, D. Implications of global climate change for tourism flows and seasonality. J. Travel Res. 2007, 45, 285–296. [Google Scholar] [CrossRef]
- Hein, L.; Metzger, M.J.; Moreno, A. Potential impacts of climate change on tourism; a case study for Spain. Curr. Opin. Environ. Sustain. 2009, 1, 170–178. [Google Scholar] [CrossRef]
- Moreno, A. Turismo y Cambio Climático en España. Evaluación de la Vulnerabilidad del Turismo de Interior Frente a los Impactos del Cambio Climático. Ministerio de Agricultura; Alimentación y Medio Ambiente: Madrid, Spain, 2010. [Google Scholar]
- Vázquez, M.X.; Prada, A. Avaloración económica dos efectos do cambio Climático no Turismo. In Evidencias e Impactos do Cambio Climático en Galicia; Pérez, V., Fernández, M., Gómez, J., Eds.; Xunta de Galicia, Consellería de Medio Ambiente e Desenvolvemento Sostible: Santiago de Compostela, Spain, 2009; pp. 675–699. [Google Scholar]
- Bujosa, A.; Rosselló, J. Climate change and summer mass tourism: The case of Spanish domestic tourism. Clim. Chang. 2013, 117, 363–375. [Google Scholar] [CrossRef]
- Barrios, S.; Ibañez, J.N. Time is of the essence: Adaptation of tourism demand to climate change in Europe. Clim. Chang. 2015, 132, 645–660. [Google Scholar] [CrossRef]
- Connor, R.F.; Hiroki, K. Development of a method for assessing flood vulnerability. Water Sci. Technol. 2005, 51, 61–67. [Google Scholar] [PubMed]
- Balica, S.F.; Douben, N.; Wright, N.G. Flood vulnerability indices at varying spatial scales. Water Sci. Technol. 2005, 60, 2571–2580. [Google Scholar] [CrossRef] [PubMed]
- Balica, S.F.; Wright, N.G. Reducing the complexity of Flood Vulnerability Index. Environ. Hazards 2010, 9, 321–339. [Google Scholar] [CrossRef]
- Adger, W.N.; Hughes, T.P.; Folke, C.; Carpenter, S.R.; Rockstrom, J. Social-ecological resilience to coastal disasters. Science 2005, 309, 1036–1039. [Google Scholar] [CrossRef] [PubMed]
- Kaly, U.; Briguglio, L.; McLeod, H.; Schmall, S.; Pratt, C.; Pal, R. Environmental Vulnerability Index (EVI) to summarise national environmental vulnerability profiles. SOPAC Technol. Rep. 1999, 275, 73. [Google Scholar]
- McLaughlin, S.; Cooper, J.A.G. A multi-scale coastal vulnerability index: A tool for coastal managers? Environ. Hazards 2010, 9, 233–248. [Google Scholar] [CrossRef]
- Balica, S.F.; Wright, N.G.; van der Meulen, F. A flood vulnerability index for coastal cities and its use in assessing climate change impacts. Nat. Hazards 2012, 64, 73–105. [Google Scholar] [CrossRef]
- Kaján, E.; Saarinen, J. Tourism, climate change and adaptation: A review. Curr. Issues Tour. 2013, 16, 167–195. [Google Scholar] [CrossRef]
- Nicholls, R.; Zanuttigh, B.; Vanderlinden, J.P.; Weisse, R.; Silva, R.; Hanson, S.; Narayan, S.; Hoggart, S.; Thompson, R.C.; de Vries, W.; et al. Developing a holistic approach to assessing and managing coastal flood risk. In Coastal Risk Management in a Changing Climate; Zanuttigh, B., Nicholls, R.J., Vanderlinden, J.P., Thompson, R.C., Burcharth, H.F., Eds.; Butterworth-Heinemann: Oxford, UK, 2015; pp. 9–53. [Google Scholar]
- Shumann, A.H. Introduction-hydrological aspects of risk management. In Flood Risk Assessment and Management. How to Specify Hydrological Loads, Their Consequences and Uncertainties; Shumann, A.H., Ed.; Springer Science + Business Media: Dordtrecht, The Netherlands, 2011; pp. 1–11. [Google Scholar]
- Williams, A.; Micallef, A. Beach Management: Principles & Practice; Earthscan: London, UK, 2009. [Google Scholar]
- Peduzzi, P.; Dao, H.; Herold, C.; Rochette, D.; Sanahuja, H. Feasibility Study Report—On Global Risk and Vulnerability Index-Trends per Year (GRAVITY); United Nations Development Programme Emergency Response Division UNDP/ERD: Geneva, Switzerland, 2001; Available online: http://www.grid.unep.ch/products/3_Reports/ew_gravity1.pdf (accessed on 24 January 2017).
- Briguglio, L. Methodological and Practical Considerations for Constructing Socio130 Economic Indicators to Evaluate Disaster Risk; Programme on Information and Indicators for Risk Management, IADB-ECLAC-IDEA; Institute of Environmental Studies, University of Colombia: Manizales, Colombia, 2003. [Google Scholar]
- Cendrero, A.; Sánchez-Arcilla, A.; Zazo, C. Impactos sobre las zonas costeras. In Evaluación Preliminar de los Impactos en España por Efecto del Cambio Climático; Universidad de Castilla-La Mancha, Ministerio de Medio Ambiente: Toledo, Spain, 2005; pp. 469–524. [Google Scholar]
- Losada, I.; Izaguirre, C.; Diaz, P. Cambio Climático en la Costa Española; Oficina Española de Cambio Climático, Ministerio de Agricultura, Alimentación y Medio Ambiente: Madrid, Spain, 2014. [Google Scholar]
- Davis, R.A., Jr.; FitzGerald, D.M. Beaches and Coasts; Blackwell: Oxford, UK, 2004. [Google Scholar]
- Penning-Rowsell, E.C.; Parker, D.J.; de Vries, W.S.; Zanuttigh, B.; Simmonds, D.; Trifonova, E.; Hissel, F.; Monbaliu, J.; Lendzion, J.; Ohnle, N.; et al. Innovation in coastal risk management: An exploratory analysis of risk governance issues at eight THESEUS study sites. Coast. Eng. 2014, 87, 210–217. [Google Scholar] [CrossRef]
- Craig-Smith, S.J.; Tapper, R.; Font, X. The coastal and marine environment. In Tourism and Global Environmental Change: Ecological, Economic, Social and Political Interrelationships; Gössling, S., Hall, C.M., Eds.; Routledge: London, UK, 2006; pp. 107–127. [Google Scholar]
- Faulkner, B.; Vikulov, S. Katherine, washed out one day, back on track the next: A post-mortem of a tourism disaster. Tour. Manag. 2001, 22, 331–344. [Google Scholar] [CrossRef]
- Wilks, J.; Moore, S. Tourism Risk Management for the Asia Pacific Region: An Authoritative Guide for Managing Crises and Disasters; Commonwealth of Australia: Canberra, Australia, 2003. [Google Scholar]
- French, P.W. Coastal Defenses. Process, Problems and Solutions; Routledge: London, UK, 2001. [Google Scholar]
- Lorenzo, F.; Alonso, A.; Pagés, J.L. Erosion and accretion of beach and spit systems in Northwest Spain: A response to human activity. J. Coast. Res. 2007, 23, 834–845. [Google Scholar] [CrossRef]
- Pethick, J.; Crooks, S. Development of a coastal vulnerability index: A geomorphological perspective. Environ. Conserv. 2000, 27, 359–367. [Google Scholar] [CrossRef]
- Gotangco, C.K.; See, J.; Dalupang, J.P.; Ortiz, M.; Porio, E.; Narisma, G.; Yulo-Loizaga, A.; Dator-Bercilla, J. Quantifying resilience to flooding among households and local government units using system dynamics: A case study in Metro Manila. J. Flood Risk Manag. 2016, 9, 196–207. [Google Scholar] [CrossRef]
- Penning-Rowsell, E.C.; Ashley, R.; Evans, E.P.; Hall, J.W. Foresight: Future Flooding: Scientific Summary, Vol 1: Future Risks and Their Drivers; Department of Trade and Industry: London, UK, 2004. [Google Scholar]
- Cendrero, A.; Fischer, D.W. A procedure for assessing the environmental quality of coastal areas for planning and management. J. Coast. Res. 1997, 13, 732–744. [Google Scholar]
- Briguglio, L. The Vulnerability Index and Small Island developing states: A review of conceptual and methodological issues. In Proceedings of the AIMS Regional Preparatory Meeting on the Ten Year Review of the Barbados Programme of Action, Praia, Cape Verde, 1–5 September 2003. [Google Scholar]
- Farrugia, N. Conceptual Issues in Constructing Composite Indices, Occasional Paper on Islands and Small States, 2/2007. In Proceedings of the International Conference on Small States and Economic Resilience, Valletta, Malta, 23–25 April 2007. [Google Scholar]
- Galicia Tourism. Rías y Playas en Galicia. 2016. Available online: http://www.turismo.gal/localizador-de-recursos?filtro=%23STP:15&langId=es_ES (accessed on 3 August 2016).
- Servicio Gallego de Salud [Galician Health Service] SERGAS. Censo de las Playas de Galicia. Programa de Vigilancia Sanitaria 2016. Available online: http://www.sergas.es/Saude-publica/Censo-praias-Galicia (accessed on 8 August 2016).
- European Environment Agency (EEA). European Bathing Water Quality in 2015; EEA Technical report 9/2016; Publications Office of the European Union: Luxembourg, 2016. [Google Scholar]
- Association of Environmental and Consumer Education (ADEAC). Bandera Azul 2016. Available online: http://www.adeac.es/bandera_azul (accessed on 14 October 2016).
- Instituto Nacional de Estadística (Spanish Statistic National Institute) (INE) Encuesta de Ocupación Hotelera 2015. Available online: http://www.ine.es/jaxi/menu.do?type=pcaxis&path=%2Ft11%2Fe162eoh&file=inebase&L=0 (accessed on 24 July 2016).
- Galicia Tourism. Area of Research and Study of Tourism of Galicia. 2016. Available online: http://www.turismo.gal/aei/portal/index.php (accessed on 20 September 2016).
- Instituto de Hidráulica Ambiental de Cantabria (Institute of Environmental Hydraulics of Cantabria) (IHCantabria). Cambio Climático en la Costa Española, Proyecto C3E. Available online: http://www.c3e.ihcantabria.com/ (accessed on 4 March 2017).
- Center for International Earth Science Information Network (CIESIN). Urban-Rural Population and Land Area Estimates Version 2. Palisades; Columbia University, NASA Socioeconomic Data and Applications Center (SEDAC): Washington, DC, USA, 2017; Available online: http://sedac.ciesin.columbia.edu/data/set/lecz-urban-rural-population-land-area-estimates-v2 (accessed on 13 March 2017).
- Cabalar Fuentes, M. Los temporales de lluvia y viento en Galicia. Propuesta de clasificación y análisis de tendencias (1961–2001). Investig. Geogr. 2005, 36, 103–118. [Google Scholar] [CrossRef]
- Cruz, R.; Lago, A.; Lage, A.; Rial, M.E.; Díaz-Fierros, F.; Salsón, S. Evolución recente do clima de Galicia. Tendencias observadas en variables meteorolóxicas. In Evidencias e Impactos do Cambio Climático en Galicia; Pérez, V., Fernández, M., Gómez, J., Eds.; Xunta de Galicia, Consellería de Medio Ambiente e Desenvolvemento Sostible: Santiago de Compostela, Spain, 2009; pp. 19–59. [Google Scholar]
- Martínez de la Torre, A.; Míguez Macho, G. Modelización dun Escenario de futuro Cambio Climático en Galicia. In Evidencias e Impactos do Cambio Climático en Galicia; Pérez, V., Fernández, M., Gómez, J., Eds.; Xunta de Galicia, Consellería de Medio Ambiente e Desenvolvemento Sostible: Santiago de Compostela, Spain, 2009; pp. 543–556. [Google Scholar]
- Xunta de Galicia. Galicia Cambio Climático, Primer Informe. Consellería de Medio Ambiente y Ordenación del Territorio; Government of Galicia, Santiago de Compostela: Galicia, Spain, 2012; Available online: http://cambioclimatico.xunta.gal/novas (accessed on 29 October 2016).
- MeteoGalicia. Climatological Reports. Galician Meteorological Agency. Consellería de Medio Ambiente e Ordenación do Territorio da Xunta de Galicia. 2017. Available online: http://www.meteogalicia.gal/observacion/informesclima/informesIndex.action?request_locale=gl (accessed on 20 February 2017).
- Agencia Española de Meteorología (Spanish Meteorological Agency) (AEMET). Resúmenes Climatológicos; AEMET: Madrid, Spain, 2016; Available online: http://www.aemet.es/es/serviciosclimaticos/vigilancia_clima/resumenes?w=0&datos=2 (accessed on 22 December 2016).
- MeteoGalicia. Network Weather Stations. Available online: http://www.meteogalicia.gal/observacion/rede/redeIndex.action (accessed on 18 March 2017).
- Puertos del Estado. Informe Climático, Extremos Máximos de Oleaje Por Direcciones; Banco de Datos Oceanográficos de Puertos del Estado; Ministerio de Fomento: Madrid, Spain, 2017. [Google Scholar]
- Puertos del Estado. Banco de datos Oceanográficos. 2017. Available online: http://www.puertos.es/es-es/oceanografia/Paginas/portus.aspx (accessed on 16 February 2017).
- Rosón, G.; Cabanas, J.M.; Fernández Pérez, F.; Herrera Cortijo, J.L.; Ruiz-Villarreal, M.; Castro, C.G.; Piedracoba, S.; Álvarez-Salgado, X.A. Evidencias do Cambio Climático na hidrografía e a dinámica das Rías e da plataforma Galega. In Evidencias e Impactos do Cambio Climático en Galicia; Pérez, V., Fernández, M., Gómez, J., Eds.; Xunta de Galicia, Consellería de Medio Ambiente e Desenvolvemento Sostible: Santiago de Compostela, Spain, 2009; pp. 287–303. [Google Scholar]
- Cid, A.; Castanedo, S.; Abascal, A.J.; Menéndez, M.; Medina, R. A high resolution hindcast of the meteorological sea level component for Southern Europe: The GOS dataset. Clim. Dyn. 2014, 43, 2167–2184. [Google Scholar] [CrossRef]
- MeteoGalicia. Tides and Moons. In Galician Meteorological Agency; MeteoGalicia: Santiago de Compostela, Spain, 2017; Available online: http://www.meteogalicia.gal/web/predicion/maritima/mareasIndex.action (accessed on 23 March 2017).
- Aguas de Galicia. Anexo 1 Caracterización das ARPSIS. In Plan de Xestión do Risco de Inundación da Demarcación Hidrográfica de Galicia-Costa (ciclo 2015–2021); ARPSIS: Santiago de Compostela, Spain, January 2016. [Google Scholar]
- Department of Culture and Tourism. Enquisa de destino 2009. In Análise Estatística Sobre o Turismo en Galicia; Secretaría Xeral para o Turismo: Xunta de Galicia, Spain, 2010. [Google Scholar]
- Ministry of Agriculture and Fisheries, Food and Environment (MAPAMA). Aplicación de la Directiva de Inundaciones y del R.D. 903/2010 en la Costa Española. Costas y Medio Marino; Ministerio de Agricultura y Pesca, Alimentación y Medio Ambiente: Madrid, Spain, 2017. Available online: http://www.mapama.gob.es/es/costas/temas/proteccion-costa/directiva-inundaciones/ (accessed on 5 March 2017).
- Ministry of Agriculture and Fisheries, Food and Environment (MAPAMA). Actuaciones para la Protección de la Costa. Ministerio de Agricultura y Pesca; Alimentación y Medio Ambiente: Madrid, Spain, 2017. Available online: http://www.mapama.gob.es/es/costas/temas/proteccion-costa/directiva-inundaciones/ (accessed on 6 March 2017).
- BBVA Foundation. La población en España: 1900–2009. Fundación BBVA, 2010. Available online: http://www.fbbva.es/TLFU/dat/cuadernos_FBBVA_51espana_web.pdf (accessed on 12 March 2017).
- Pompe, J.J.; Rinehart, J.R. Beach quality and the enhancement of recreational property values. J. Leis. Res. 1995, 27, 143–154. [Google Scholar]
- Pérez-Alberti, A.; Vázquez-Paz, M. Caracterización y dinámica de sistemas dunares coseros en Galicia. In Las dunas en España; Sanjaume, E., Gracia, F.J., Eds.; Sociedad Española de Geomorfología: Zaragoza, Spain, 2011; pp. 161–187. [Google Scholar]
- Willis, C.M.; Griggs, G.B. Reductions in fluvial sediment discharge by coastal dams in California and implications for beach sustainability. J. Geol. 2003, 111, 167–182. [Google Scholar] [CrossRef]
- United Nations Office for Disaster Risk Reduction (UNISDR). DesInventar, Disaster Information Management System. Disaster & Risk Profile Spain. 2017. Available online: http://www.desinventar.net/DesInventar/profiletab.jsp?countrycode=esp&continue=y (accessed on 5 March 2017).
- Instituto Nacional de Estadística (Spanish Statistic National Institute) (INE). Gasto total y Gastos Medios por Comunidad Autónoma de Residencia. 2017. Available online: http://www.ine.es/jaxiT3/Datos.htm?t=10721 (accessed on 3 April 2017).
- Hall, C.M.; Prayag, G.; Amore, A. Tourism and Resilience. Dividual, Organisational and Destination Perspectives; Channel View: Bristol, UK, 2018. [Google Scholar]
- Orchiston, C. Tourism business preparedness, resilience and disaster planning in a region of high seismic risk: The case of the Southern Alps, New Zealand. Curr. Issues Tour. 2013, 16, 477–494. [Google Scholar] [CrossRef]
- Jopp, R.; DeLacy, T.; Mair, J. Developing a framework for regional destination adaptation to climate change. Curr. Issues Tour. 2010, 13, 591–605. [Google Scholar] [CrossRef]
- Ministry of Agriculture and Fisheries, Food and Environment (MAPAMA). Guía de Playas. Ministerio de Agricultura y Pesca, Alimentación y Medio Ambiente, Spain, 2016. Available online: http://www.mapama.gob.es/es/costas/servicios/guia-playas/default.aspx (accessed on 17 July 2016).
- European Environment Agency (EEA). State of Bathing Waters; European Environment Agency: Copenhagen, Denmark, 2016; Available online: http://www.eea.europa.eu/themes/water/interactive/bathing/state-of-bathing-waters#parent-fieldnametitle (accessed on 30 June 2016).
- Williams, A. Definitions and typologies of coastal tourism beach destinations. In Disappearing Destinations. Climate Change and Future Challenges for Coastal Tourism; Jones, A., Phillips, M., Eds.; CAB International: Wallingford, UK, 2011; pp. 47–65. [Google Scholar]


| Factor | Indicator | Description | Impact on Vulnerability Increases (+) |
|---|---|---|---|
| Fluvial/costal characteristics | Beach coastline (km) | Kilometers of coastline, density of beaches | Higher beach coastline (+) |
| Hydrographical characteristics (km) | River network, density of rivers | Higher river network (+) | |
| Elevation above sea level | Low elevation coastal zones (km2 or %) | Share of coastline with elevation up to 10 m | Higher share of Low Elevation Coastal Zones (LECZ) (+) |
| Soil subsidence (m2) | Surface of soil that is experimenting a decreasing | Higher area (+) | |
| Frequency of storm/rainfall events | Rainfall intensity (mm or L/m2) | Rainfall volume | Higher intensity/ frequency (+) |
| Rainfall seasonality (mm or L/m2) | Amount of rainfall per month | Impact of rainfall on high season (+) | |
| Frequency of storms (#) | Number of storms events in the last 10 years | Higher frequency of storms (+) | |
| Sea-level rise | Sea-level rise (mm/yr) | Increasing in the level of the sea in x year | Higher Sea Level Rise (SLR) (+) |
| Waves | Wave regime (cm/yr or W/m2/yr) | Changes in wave characteristics: height, period and energy | Higher wave intensity (+) |
| Factor | Indicator | Description | Impact on Vulnerability Increases (+) Decreases (−) |
|---|---|---|---|
| Flood tide | Tide range (m) | Sea level variation due to tides within a day | Variable |
| Tidal flooding (m) | Estimated range by tidal flooding; 2 scenarios with return periods of 50, 100 years (T50, T100) | Higher flooding (+) | |
| Flood waves | Wave flooding (m) | Estimated range reached by wave flooding (2 scenarios T50, T100) | Higher flooding (+) |
| Velocity | Volume of flow (m3/s) | Flow volume of rivers discharging into the coast (3 scenarios with return periods of T10, T50, T100) | More volume (+) |
| Response time (scale) | Time that elapses between the moment of maximum rainfall and when the peak flow is reached | More time (−) | |
| Inundation area | Area of fluvial flooding (km2) | Surface area of potential fluvial flooding (3 scenarios with return periods of T10, T50, T100) | Larger area (+) |
| Area of sea flooding (km2) | Estimated flooded area according to a potential increase the elevation of the level of flooding in meters | Larger area (+) | |
| Other flood characteristics | Level of flooding (m or %) | Level reached as a result of the joint action of the astronomical tide, storm surge and run-up generated by waves | Higher level of flooding (+) |
| Factor | Indicator | Description |
|---|---|---|
| Legal and regulatory context | Regulatory context | Competences and responsibility on the coastal domain among the different levels of government |
| Beaches at protected area | Beaches with risk of flood located in areas of environmental protection | |
| Susceptibility including preparedness, coping and recovering | Contingency plans | Contingency plans designed to deal with flood risk situations and impacts on beaches |
| Beach nourishment and recovering | Replenishing beach sediment in nourishment operations, recovering and cleaning | |
| Time recovery | Time needed to recover to a functional operation after coastal flood events | |
| Other socio-economic and politico-administrative factors | Population | Number of people affected and number of inhabitants in potential flood zone |
| Stock of affected capital | Losses and properties affected by floods |
| Factor | Indicator | Description |
|---|---|---|
| Beach structure | Coast and beach profile | Coastal features and natural protection that have influence on flood resilience |
| Length and width of the beach | Length, width and width variation during the year of beaches with risk of flood | |
| Sediment supply | Amount of sustained supply of sediment for the preservation and sustainability of the beaches | |
| Previous exposure to flooding | Historical floods | Historical flood events and experience and knowledge gained in previous floods |
| Other resilience indicators | Flood protection | Existence of shelters and structural measures that physically prevent beach flooding |
| Household disposable income | Household disposable income as a resilience factor |
| Year | Vigo | Vilagarcia | A Coruña | Ribadeo | |||||
|---|---|---|---|---|---|---|---|---|---|
| Coast | Dissipative Beach | Coast | Dissip. Beach | Coast | Dissip. Beach | Coast | Dissip. Beach | ||
| FL50 Absolute growth (m) | 2020 | 0.05 | 0.06 | 0.01 | 0.14 | 0.04 | 0.07 | 0.05 | 0.09 |
| 2030 | 0.11 | 0.13 | 0.02 | 0.32 | 0.08 | 0.16 | 0.11 | 0.19 | |
| 2040 | 0.17 | 0.21 | 0.03 | 0.50 | 0.13 | 0.25 | 0.16 | 0.30 | |
| FL50 Relative growth (%) | 2020 | 1.3 | 1.10 | 0.20 | 1.70 | 0.96 | 1.26 | 1.35 | 1.69 |
| 2030 | 2.9 | 2.48 | 0.45 | 3.83 | 2.17 | 2.85 | 3.05 | 3.81 | |
| 2040 | 4.6 | 3.85 | 0.68 | 5.96 | 3.38 | 4.43 | 4.75 | 5.93 | |
| Extrapolation of Trends | Scenario 1 SLR: 0.5 m | Scenario 2 SLR: 0.85 m | Scenario 3 SLR: 2 m | |
|---|---|---|---|---|
| A Coruña | 6.4 | 6.9 (+7.3%) | 7.2 (+11.3%) | 8.3 (+28.0%) |
| Lugo | 5.6 | 6.1 (+9.3%) | 6.3 (+13.3%) | 7.4 (+32.5%) |
| Pontevedra | 5.4 | 5.9 (+9.0%) | 6.2 (+14.0%) | 7.2 (+32.6%) |
| Province | Flood Cases | Examples of Tourism Infrastructure Affected in Flood Events | |
|---|---|---|---|
| A Coruña | 190 | 21/12/1995 | hotel facilities of Muxía |
| 20/10/2000 | beaches in Pobra do Caramiñal and Cedeira, hotel facilities in A Coruña | ||
| Pontevedra | 146 | 21/12/1995 | seafronts and beaches in Baiona, Moaña and Marín |
| 20/10/2000 | flooding of beaches in Nigrán, Vilanova de Arousa, Portonovo, Marín and Baiona; hotel facilities in Baiona and A Guarda | ||
| 11/10/2001 | hotel facilities in Pontevedra and Sanxenxo | ||
| 04/09/2004 | hotel facilities in Vigo | ||
| 18/11/2006 | tourist facilities in Pontevedra, Sanxenxo, Vilagarcía de Arousa, Cangas and Marin. | ||
| Lugo | 39 | 30/04/1998 | access road to the coast in Foz |
| 20/10/2000 | access road to Abrela beach in O Vicedo | ||
| 09/06/2010 | hotel facilities in Viveiro, access road to Catedrales beach | ||
| Feature | Scoring 1–3 |
|---|---|
| Level of visitation | Low to high |
| Tourism facilities | Depending on number and character |
| Beach width | more than 75 m; 15–75 m; less than 15 m |
© 2017 by the authors. Licensee MDPI, Basel, Switzerland. This article is an open access article distributed under the terms and conditions of the Creative Commons Attribution (CC BY) license (http://creativecommons.org/licenses/by/4.0/).
Share and Cite
Toubes, D.R.; Gössling, S.; Hall, C.M.; Scott, D. Vulnerability of Coastal Beach Tourism to Flooding: A Case Study of Galicia, Spain. Environments 2017, 4, 83. https://doi.org/10.3390/environments4040083
Toubes DR, Gössling S, Hall CM, Scott D. Vulnerability of Coastal Beach Tourism to Flooding: A Case Study of Galicia, Spain. Environments. 2017; 4(4):83. https://doi.org/10.3390/environments4040083
Chicago/Turabian StyleToubes, Diego R., Stefan Gössling, C. Michael Hall, and Daniel Scott. 2017. "Vulnerability of Coastal Beach Tourism to Flooding: A Case Study of Galicia, Spain" Environments 4, no. 4: 83. https://doi.org/10.3390/environments4040083
APA StyleToubes, D. R., Gössling, S., Hall, C. M., & Scott, D. (2017). Vulnerability of Coastal Beach Tourism to Flooding: A Case Study of Galicia, Spain. Environments, 4(4), 83. https://doi.org/10.3390/environments4040083