Relationship between Ambient Temperature and Mental Health in the USA †

Abstract
:1. Introduction
2. Methods
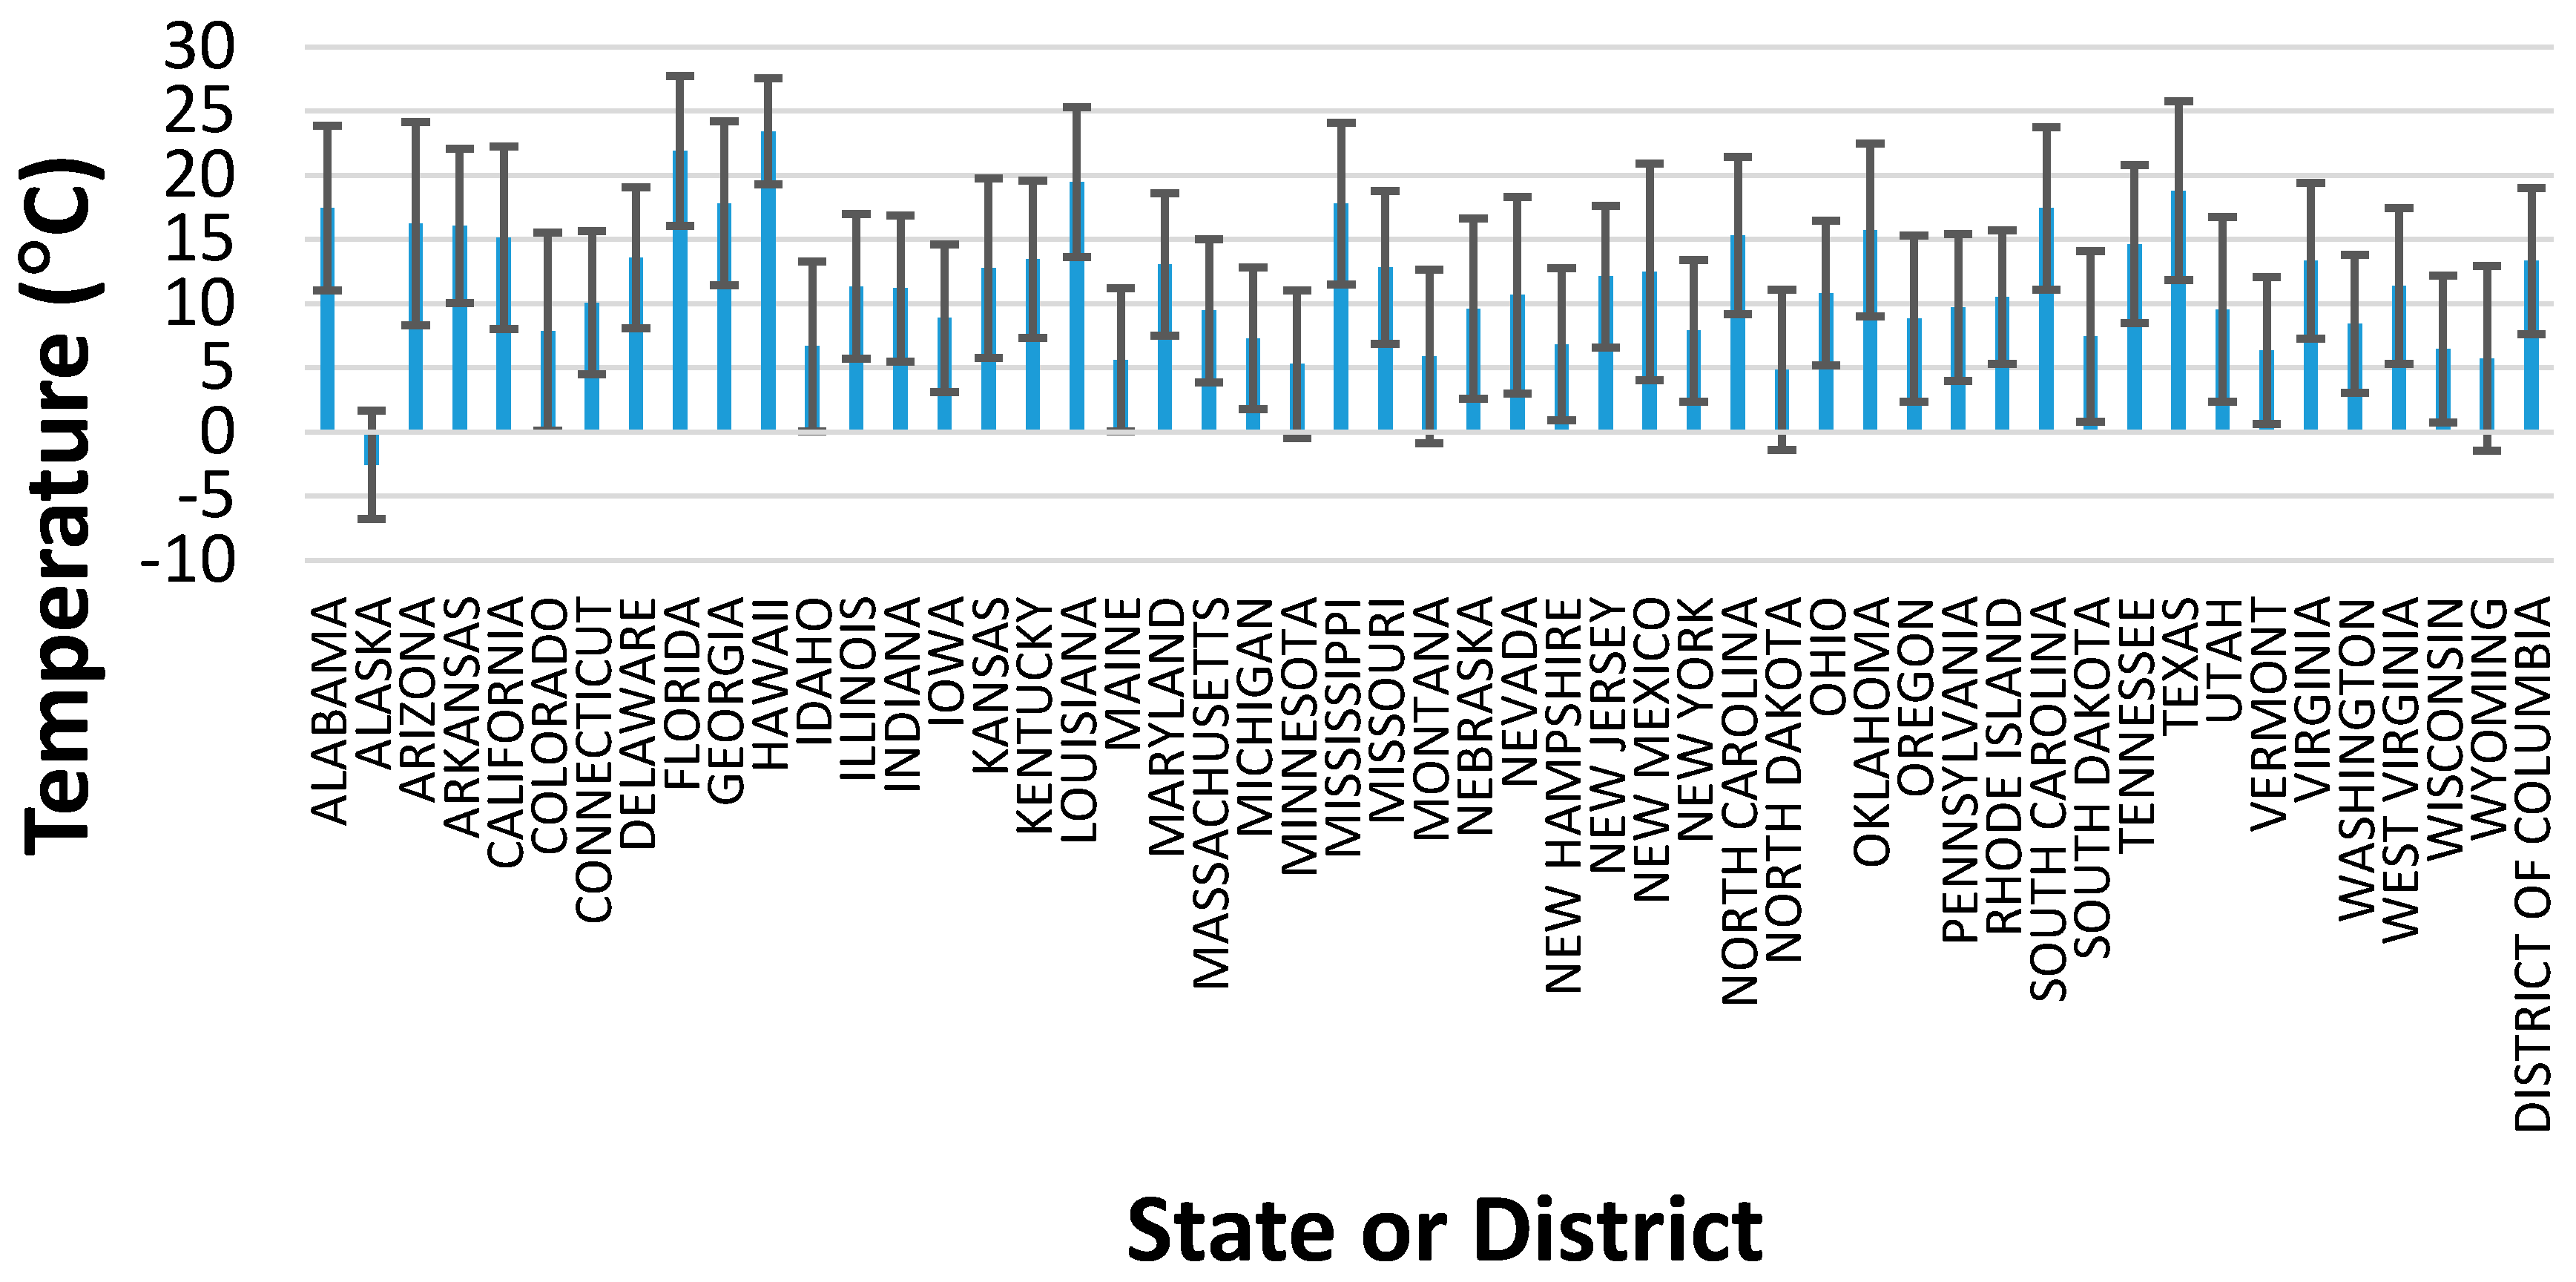
2.1. Climate Data
2.2. Mental Health Data
2.3. GDP, % Urban, and Unemployment Data
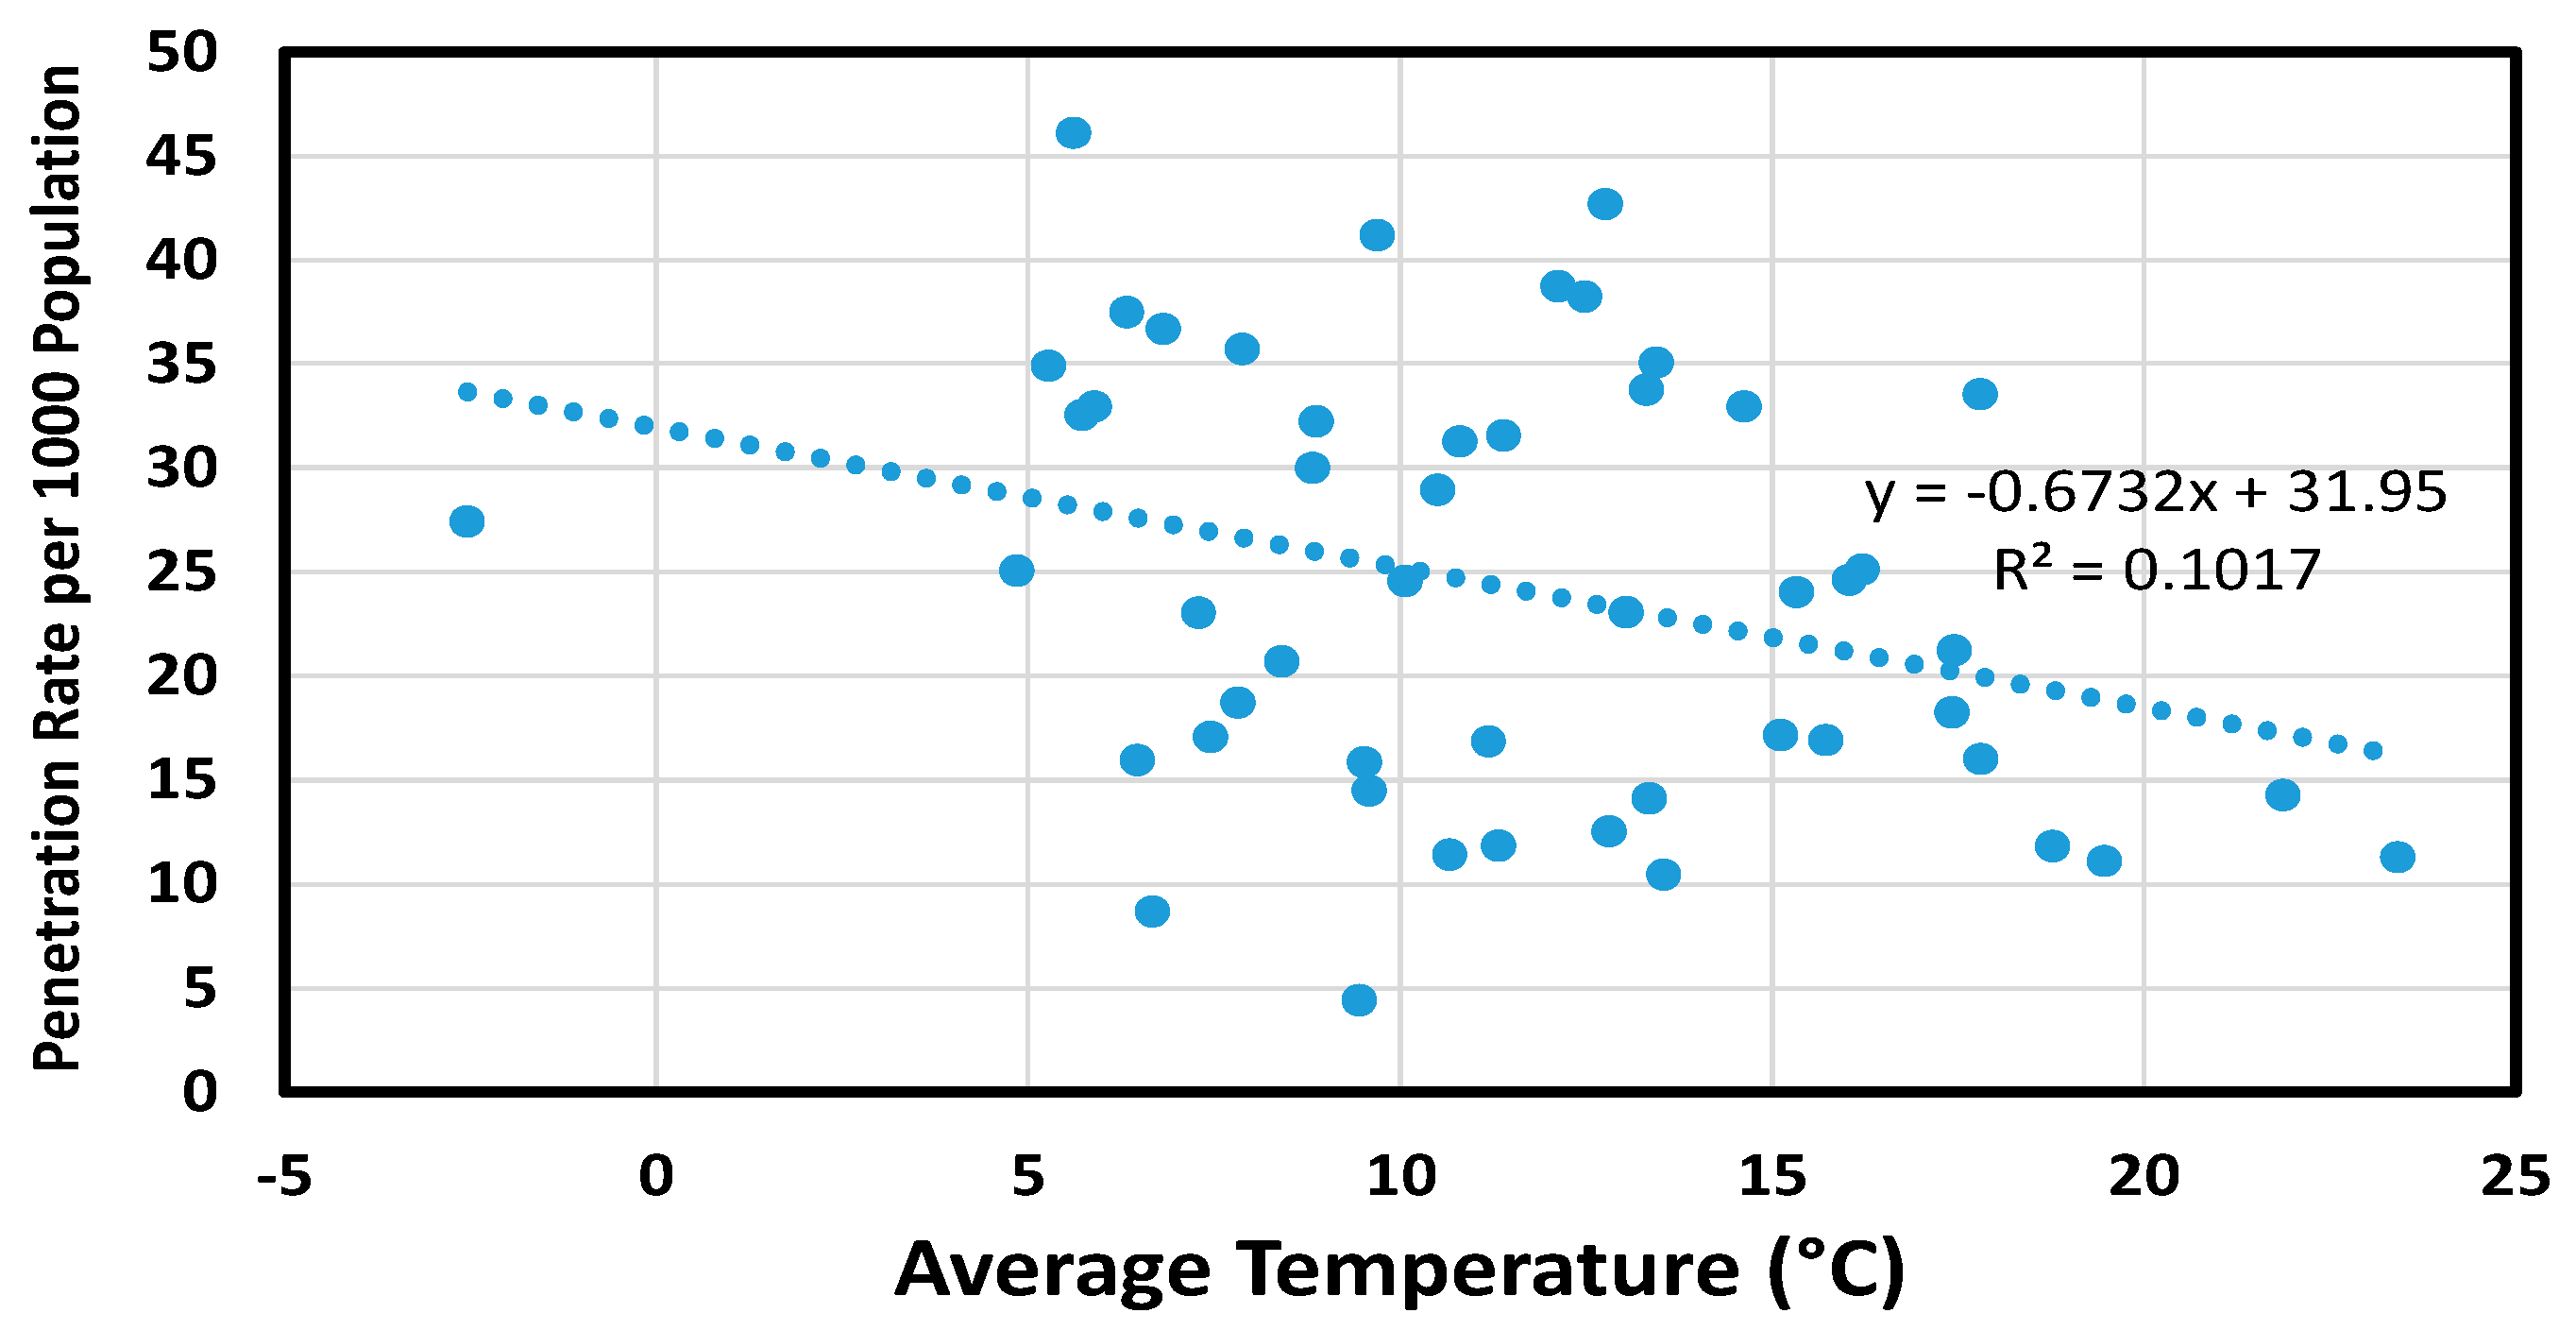
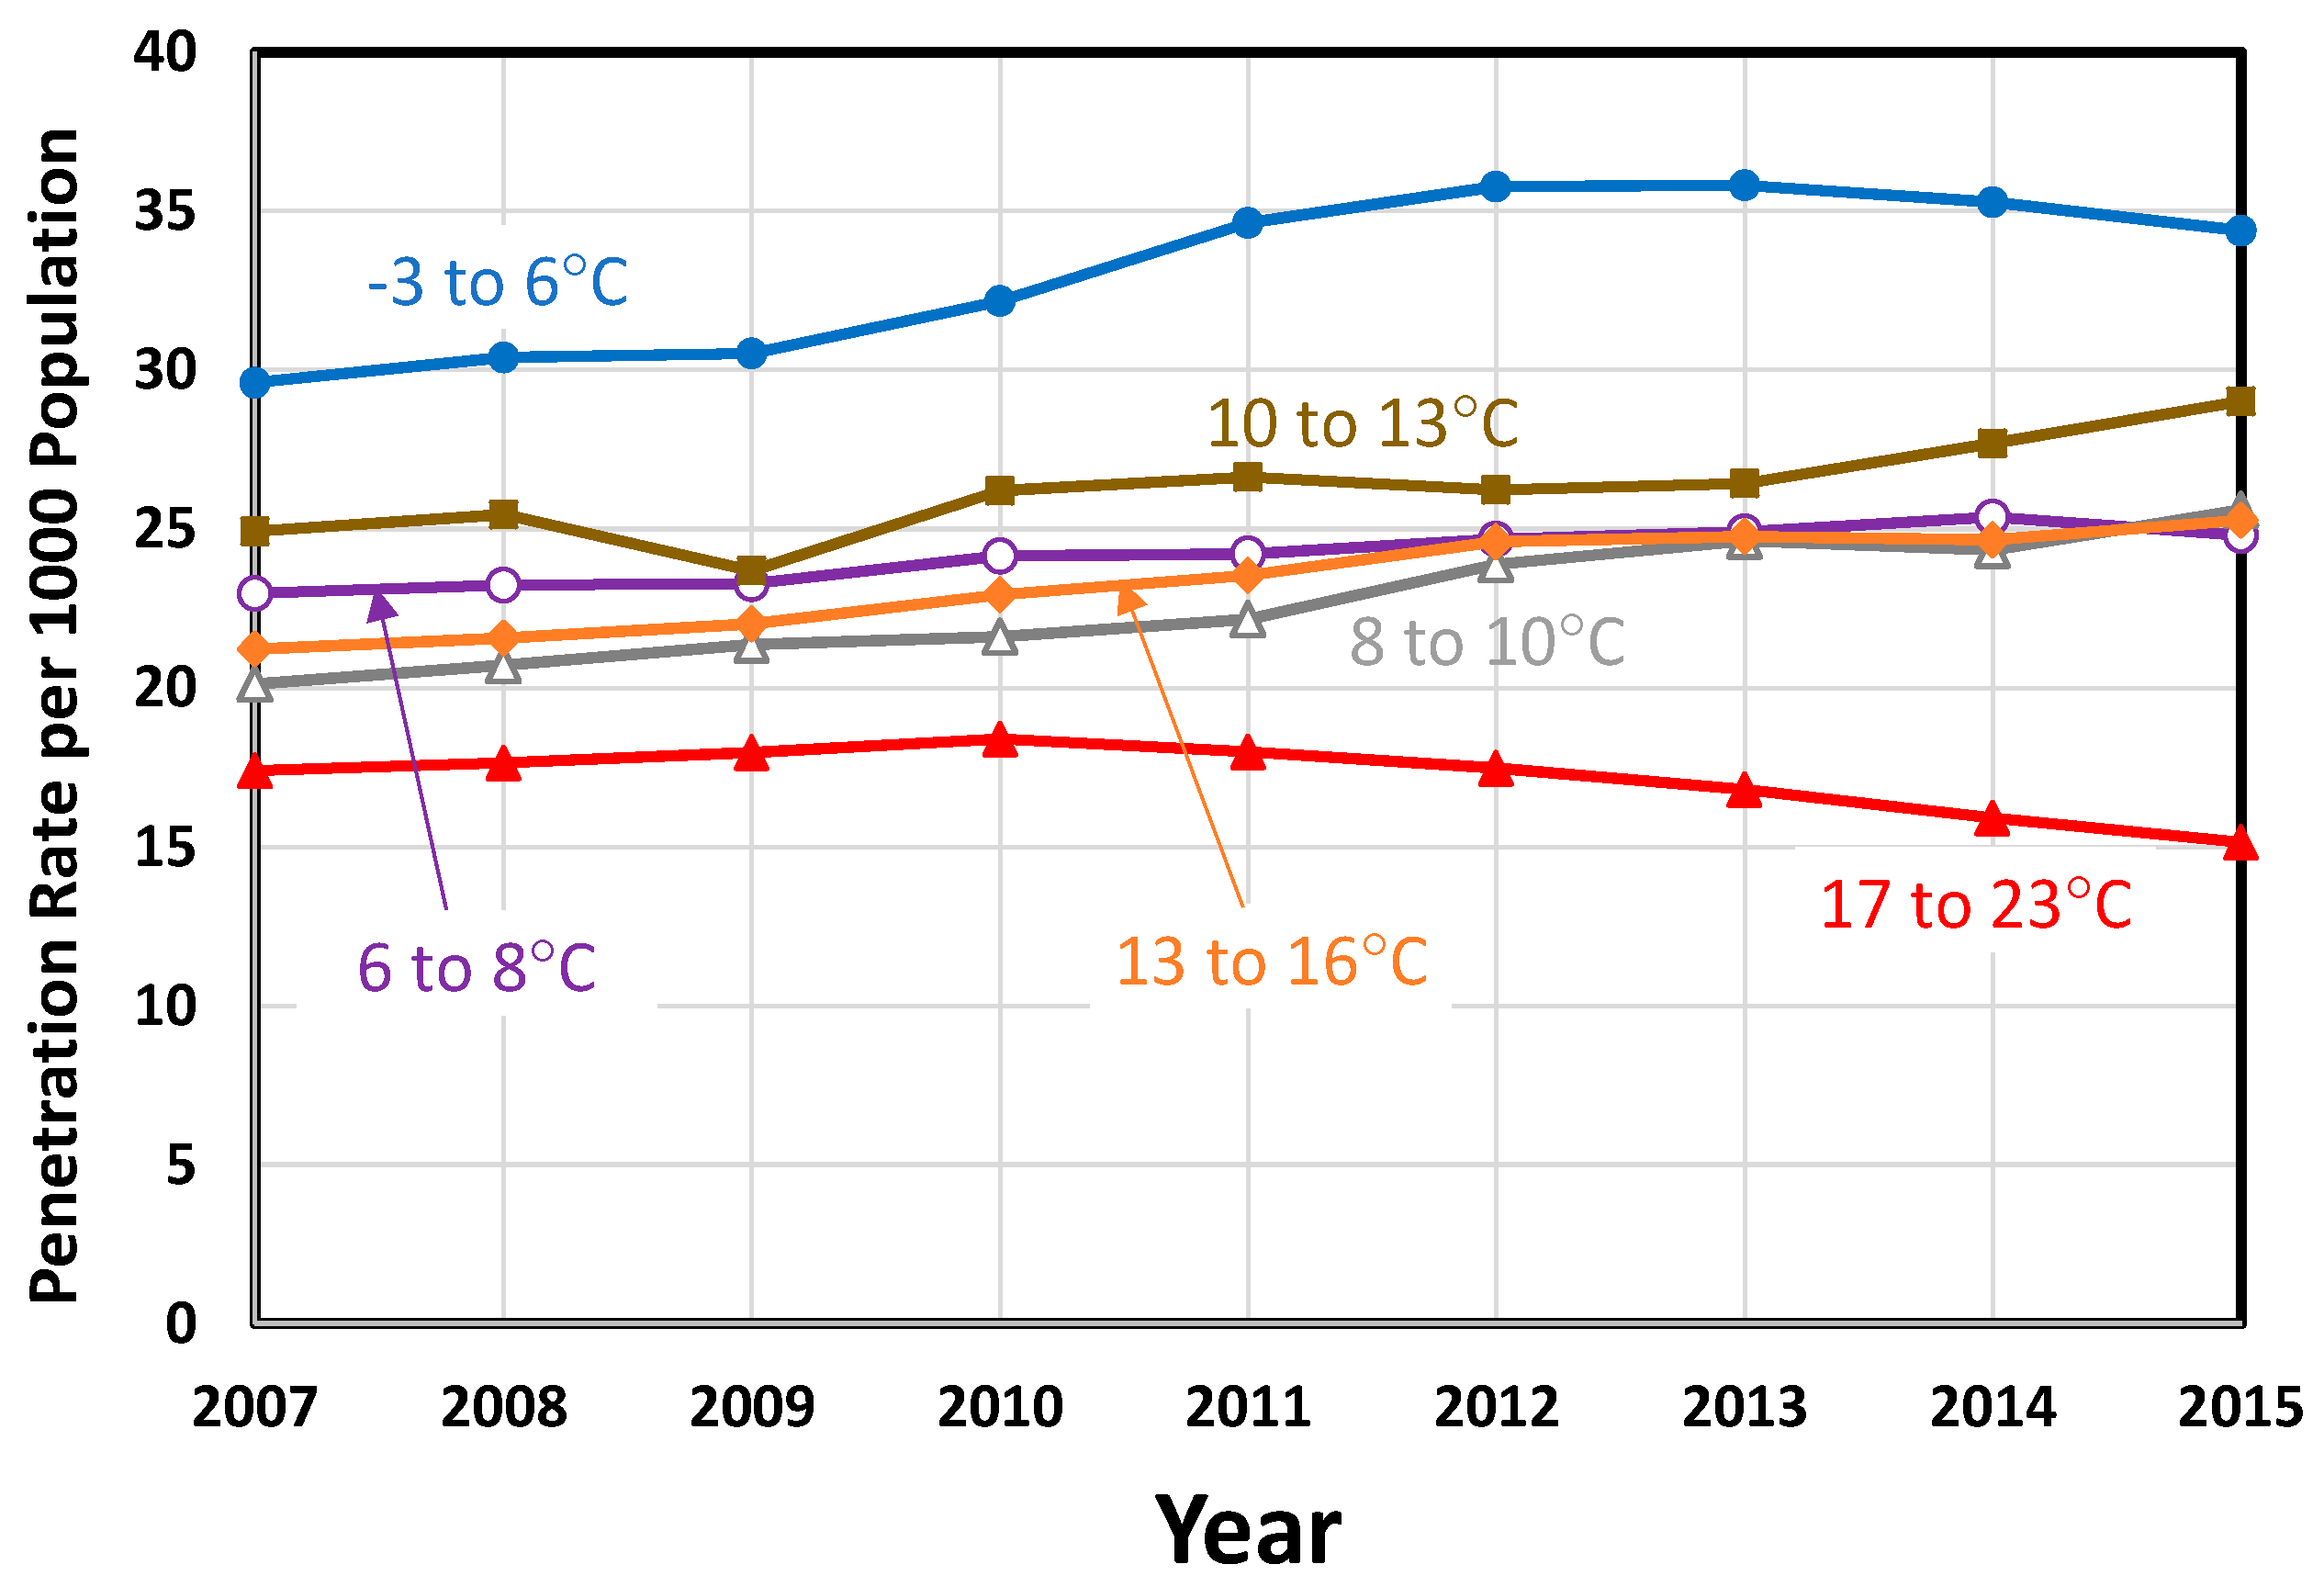
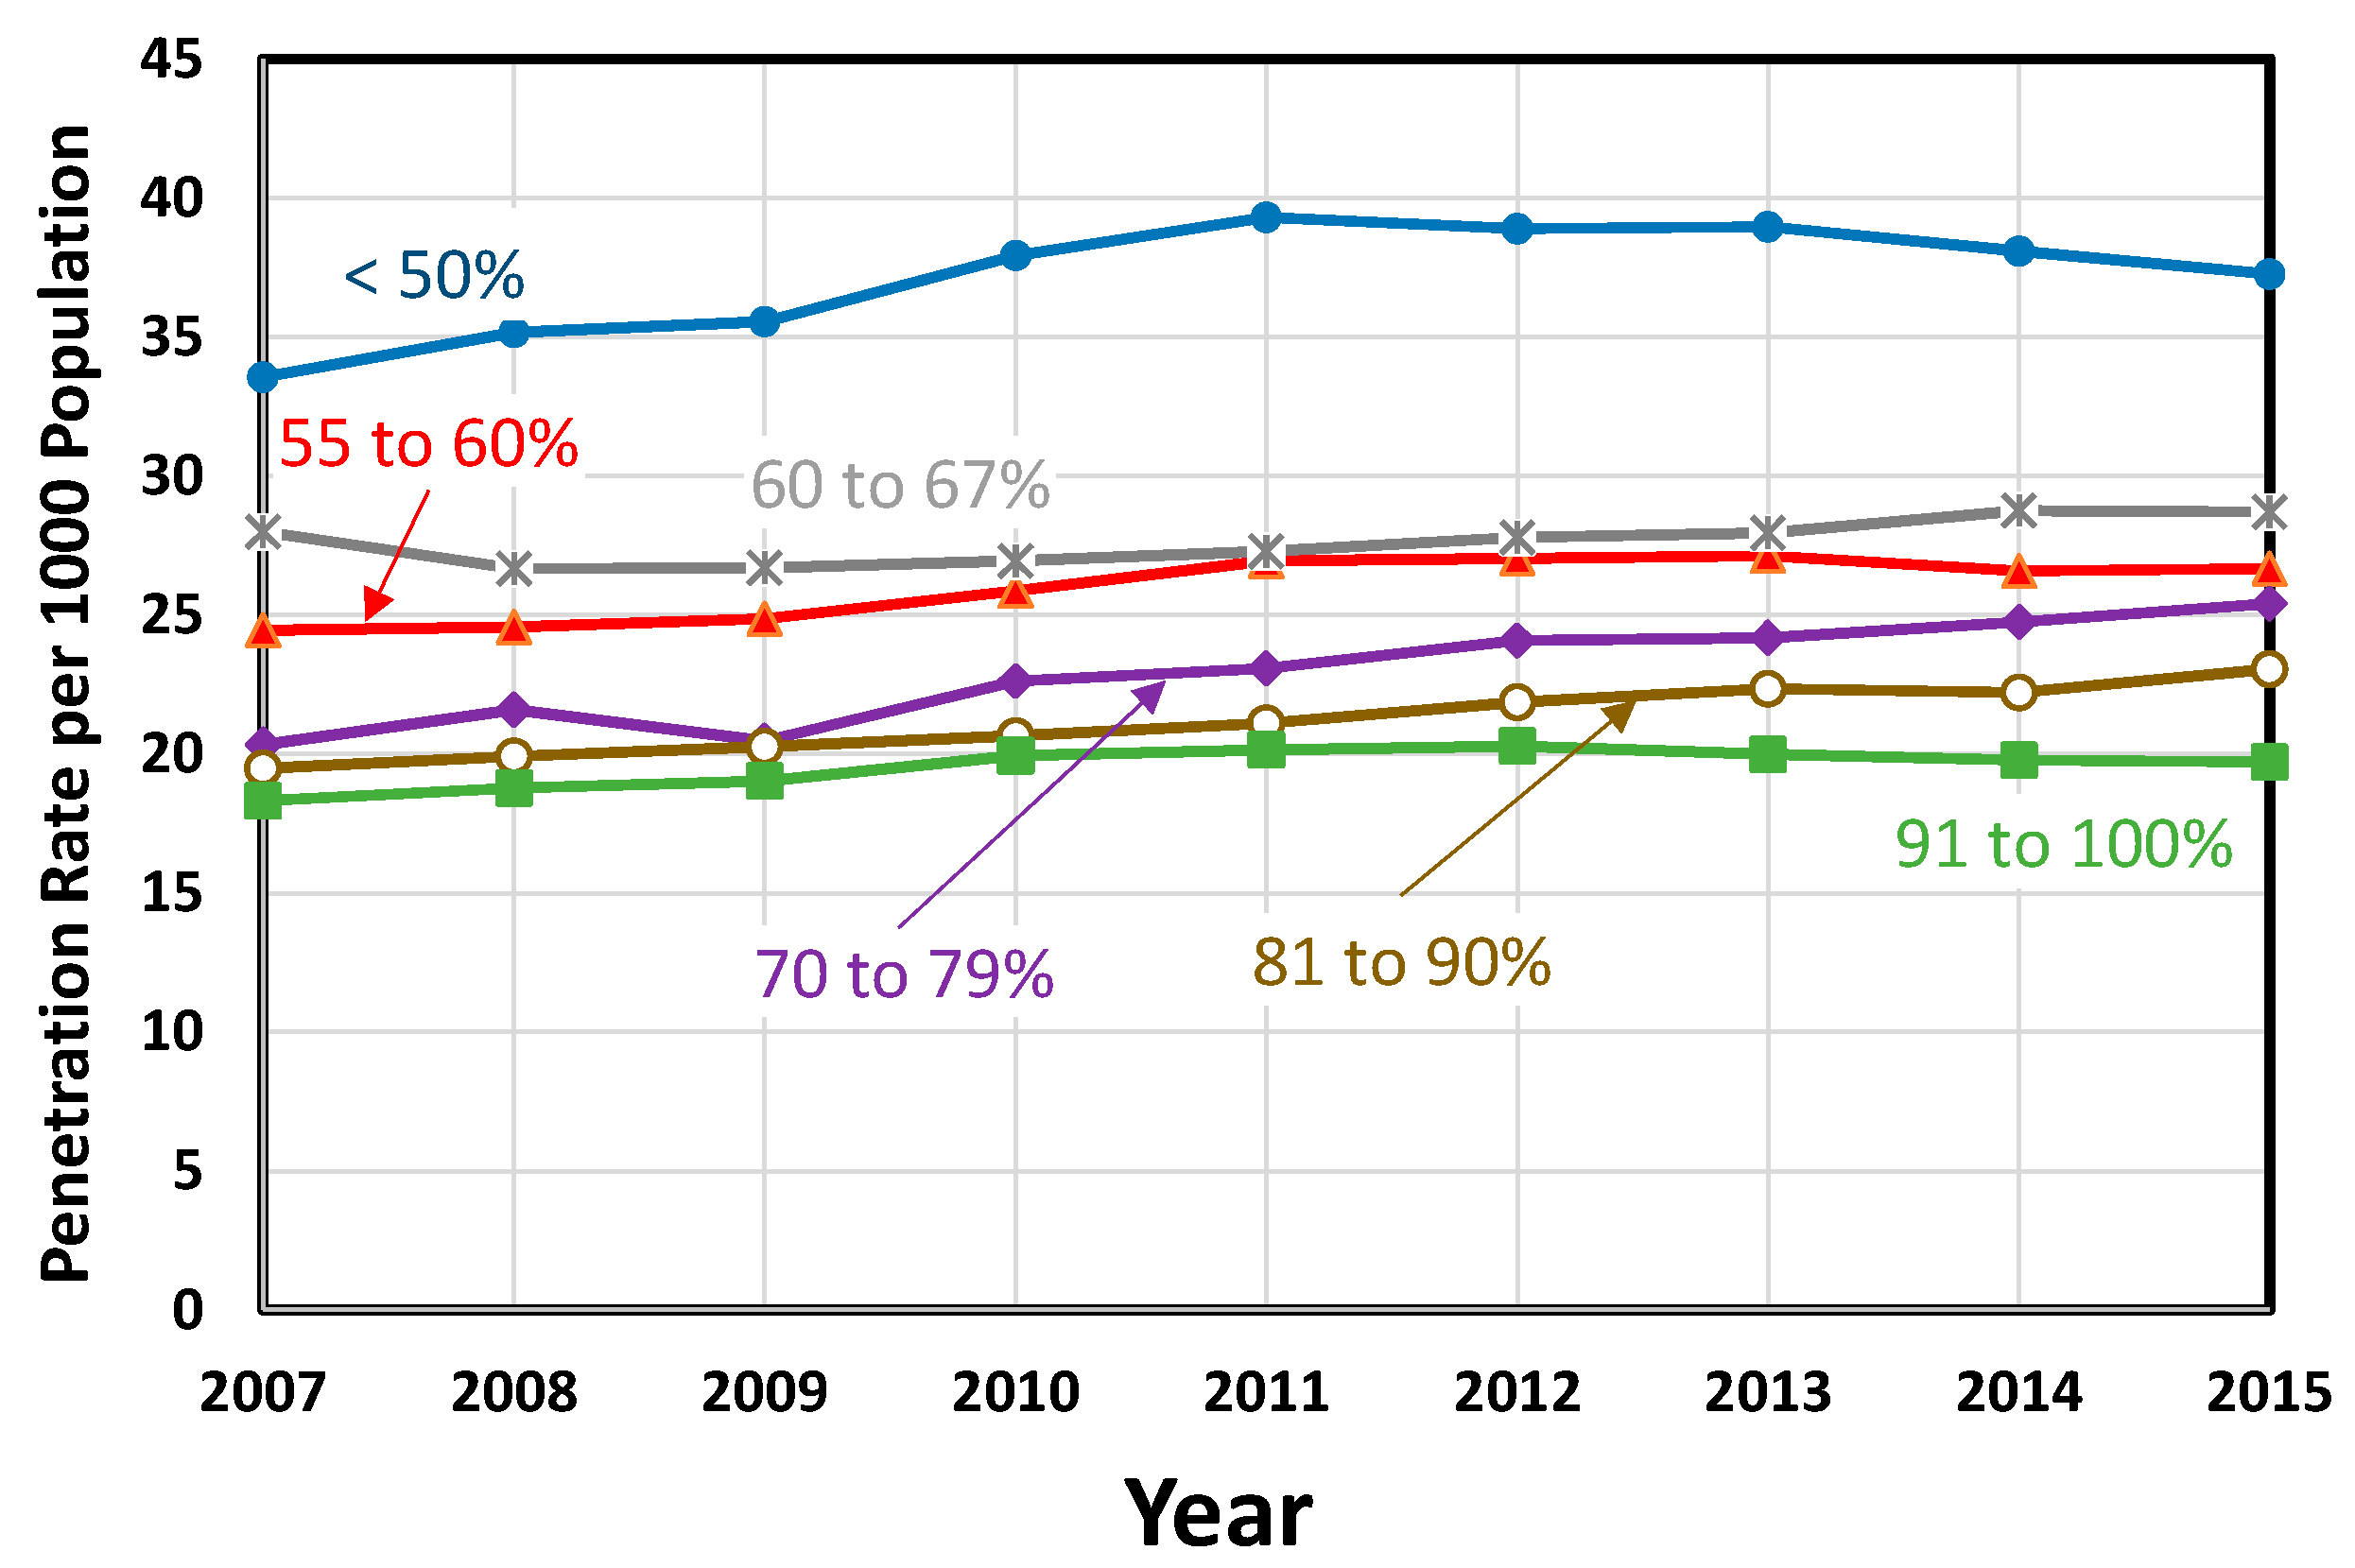
3. Results
4. Multiple Linear Regression Attempt
5. Discussion
6. Conclusions
Author Contributions
Conflicts of Interest
References
- Patz, J.; Frumkin, H.; Holloway, T.; Vimont, D.; Haines, A. Climate Change: Challenges and Opportunities for Global Health. JAMA 2014, 312, 1565–1580. [Google Scholar] [CrossRef] [PubMed]
- Golden, J.S.; Hartz, D.; Brazel, A.; Luber, G.; Phelan, P. A biometeorology study of climate and heat-related morbidity in phoenix from 2001 to 2006. Int. J. Biometeorol. 2008, 52, 471–480. [Google Scholar] [CrossRef] [PubMed]
- Huang, C.; Barnett, A.G.; Wang, X.; Vaneckova, P.; FitzGerald, G.; Tong, S. Projecting future heat-related mortality under climate change scenarios: A systematic review. Environ. Health Perspect. 2011, 119, 1681–1690. [Google Scholar] [CrossRef] [PubMed] [Green Version]
- Vida, S.; Durocher, M.; Ouarda, T.B.M.J.; Gosselin, P. Relationship between ambient temperature and humidity and visits to mental health emergency departments in Québec. Psychiatr. Serv. 2012, 63, 1150–1153. [Google Scholar] [CrossRef] [PubMed]
- Wang, X.; Lavigne, E.; Ouellette-kuntz, H.; Chen, B.E. Acute impacts of extreme temperature exposure on emergency room admissions related to mental and behavior disorders in Toronto, Canada. J. Affect. Disord. 2014, 155, 154–161. [Google Scholar] [CrossRef] [PubMed]
- Berry, H.L.; Bowen, K.; Kjellstrom, T. Climate change and mental health: A causal pathways framework. Int. J. Public Health 2010, 55, 123–132. [Google Scholar] [CrossRef] [PubMed]
- Williams, S.; Nitschke, M.; Sullivan, T.; Tucker, G.R.; Weinstein, P.; Pisaniello, D.L.; Parton, K.A.; Bi, P. Heat and health in Adelaide, South Australia: Assessment of heat thresholds and temperature relationships. Sci. Total Environ. 2012, 414, 126–133. [Google Scholar] [CrossRef] [PubMed]
- Fearnley, E.J.; Magalhães, R.J.S.; Speldewinde, P.; Weinstein, P.; Dobson, A. Environmental correlates of mental health measures for women in western Australia. EcoHealth 2014, 11, 502–511. [Google Scholar] [CrossRef] [PubMed]
- National Centers for Environmental Information. Climate at a Glance. Available online: https://www.ncdc.noaa.gov/cag/time-series/us/1/0/pcp/12/12/2007-2015?base_prd=true&firstbaseyear=2007&lastbaseyear=2015 (accessed on 7 January 2017).
- DASIS: Drug and Alcohol Services Information System, Substance Abuse and Mental Health Services Administration, U.S. Department of Health and Human Services. Available online: https://wwwdasis.samhsa.gov/dasis2/urs.htm (accessed on 7 January 2017).
- U.S. Bureau of Economic Analysis. Available online: https://www.bea.gov/ (accessed on 7 January 2017).
- U.S. Bureau of Labor Statistics. Available online: https://www.bls.gov/ (accessed on 7 January 2017).
- United States Census Bureau. Available online: https://www.census.gov/ (accessed on 7 January 2017).
- Baechler, M.C.; Gilbride, T.L.; Cole, P.C.; Hefty, M.G.; Ruiz, K. High-Performance Home Technologies: Guide to Determining Climate Regions by County; Technical Report PNNL-17211 Rev. 3; PNNL: Richland, WA, USA, 2015; Volume 7.3. [Google Scholar]
- Vyssoki, B.; Kapusta, N.D.; Praschak-Rieder, N.; Dorffner, G.; Willeit, M. Direct effect of sunshine on suicide. JAMA Psychiatr. 2014, 71, 1231–1237. [Google Scholar] [CrossRef] [PubMed]
- Anonymous. The NSDUH Report: Affordability Most Frequent Reason for not Receiving Mental Health Services; SAMHSA: Rockville, MA, USA, 2013. [Google Scholar]
- Seasonal Affective Disorder. Available online: https://www.mentalhealth.gov/what-to-look-for/mood-disorders/seasonal-affective-disorder/index.html (accessed on 7 January 2017).


| ARIZONA | ||||||||
| Year | Ave. Temp.* (°C) | Min. Temp.* (°C) | Max. Temp.* (°C) | Precipitation (cm) | Per Capita Real GDP ($) | Percent Urban (%) | Unemploy-ment Rate (%) | Penetration Rate per 1000 Population |
| 2007 | 16.44 | 8.50 | 24.39 | 27.91 | $44,168 | 3.9 | 23.35 | |
| 2008 | 15.89 | 7.94 | 23.83 | 31.27 | $41,800 | 5.9 | 22.32 | |
| 2009 | 16.17 | 8.11 | 24.17 | 17.86 | $38,232 | 10.0 | 24.44 | |
| 2010 | 15.78 | 8.06 | 23.44 | 35.33 | $37,935 | 89.81 | 10.4 | 25.63 |
| 2011 | 15.72 | 7.72 | 23.78 | 24.46 | $38,257 | 9.5 | 25.34 | |
| 2012 | 16.72 | 8.56 | 24.89 | 24.28 | $38,559 | 8.2 | 28.86 | |
| 2013 | 15.83 | 7.94 | 23.67 | 30.81 | $38,303 | 8.0 | 29.27 | |
| 2014 | 16.83 | 8.89 | 24.72 | 28.12 | $38,427 | 7.0 | 23.85 | |
| 2015 | 16.56 | 8.89 | 24.17 | 36.55 | $38,414 | 6.0 | 23.03 | |
| AVERAGES | 16.22 | 8.29 | 24.12 | 28.51 | $39,344 | 89.81 | 7.7 | 25.12 |
| OHIO | ||||||||
| Year | Ave. Temp.* (°C) | Min. Temp.* (°C) | Max. Temp.* (°C) | Precipitation (cm) | Per Capita Real GDP ($) | Percent Urban (%) | Unemploy-ment Rate (%) | Penetration Rate per 1000 Population |
| 2007 | 11.28 | 5.50 | 17.00 | 104.55 | $44,399 | 5.6 | 26.97 | |
| 2008 | 10.33 | 4.61 | 16.11 | 112.01 | $43,548 | 6.5 | 28.01 | |
| 2009 | 10.28 | 4.72 | 15.89 | 92.71 | $41,593 | 10.3 | 29.49 | |
| 2010 | 10.94 | 5.28 | 16.61 | 93.37 | $42,667 | 77.92 | 10.1 | 30.77 |
| 2011 | 11.28 | 5.94 | 16.61 | 142.11 | $44,192 | 8.7 | 31.45 | |
| 2012 | 12.22 | 6.33 | 18.17 | 94.69 | $44,896 | 7.2 | 31.63 | |
| 2013 | 10.50 | 5.17 | 15.83 | 105.89 | $45,254 | 7.6 | 33.08 | |
| 2014 | 9.56 | 3.94 | 15.17 | 97.94 | $46,385 | 5.6 | 34.46 | |
| 2015 | 10.89 | 5.22 | 16.61 | 109.27 | $46,826 | 4.9 | 35.80 | |
| AVERAGES | 10.81 | 5.19 | 16.44 | 105.84 | $44,418 | 77.92 | 7.4 | 31.30 |
| MINNESOTA | ||||||||
| Year | Ave. Temp.* (°C) | Min. Temp.* (°C) | Max. Temp.* (°C) | Precipitation (cm) | Per Capita Real GDP ($) | Percent Urban (%) | Unemploy-ment Rate (%) | Penetration Rate per 1000 Population |
| 2007 | 5.78 | 0.06 | 11.56 | 74.19 | $51,351 | 4.6 | 16.61 | |
| 2008 | 4.11 | −1.78 | 10.06 | 69.44 | $51,234 | 5.5 | 31.37 | |
| 2009 | 4.50 | −1.17 | 10.17 | 67.01 | $48,884 | 7.8 | 34.13 | |
| 2010 | 6.06 | 0.28 | 11.78 | 84.94 | $50,148 | 73.27 | 7.3 | 36.87 |
| 2011 | 5.56 | −0.11 | 11.28 | 61.85 | $50,875 | 6.5 | 39.25 | |
| 2012 | 7.33 | 1.33 | 13.39 | 66.47 | $51,272 | 5.8 | 41.45 | |
| 2013 | 4.06 | −1.61 | 9.72 | 73.69 | $51,999 | 4.9 | 38.47 | |
| 2014 | 3.72 | −1.89 | 9.33 | 73.96 | $53,005 | 4.0 | 37.01 | |
| 2015 | 6.39 | 0.67 | 12.11 | 74.83 | $53,380 | 3.8 | 39.04 | |
| AVERAGES | 5.28 | −0.47 | 11.04 | 71.82 | $51,350 | 73.27 | 5.6 | 34.91 |
| State | Ave. Temp. (°C) | Min.Temp. (°C) | Max. Temp. (°C) | Precipitation (cm) | Per Capita Real GDP ($) | % Urban Population | Unemployment Rate (%) | Penetration Rate per 1000 Population |
|---|---|---|---|---|---|---|---|---|
| ALABAMA | 17.46 | 11.05 | 23.88 | 140.57 | $36,496 | 59.04 | 7.69 | 21.24 |
| ALASKA | −2.54 | −6.75 | 1.67 | 94.31 | $69,488 | 66.02 | 7.14 | 27.42 |
| ARIZONA | 16.22 | 8.29 | 24.12 | 28.51 | $39,344 | 89.81 | 7.66 | 25.12 |
| ARKANSAS | 16.04 | 10.02 | 22.06 | 136.38 | $35,232 | 56.16 | 6.93 | 24.62 |
| CALIFORNIA | 15.12 | 8.01 | 22.23 | 46.58 | $53,871 | 94.95 | 8.94 | 17.17 |
| COLORADO | 7.83 | 0.13 | 15.54 | 45.93 | $50,752 | 86.15 | 6.28 | 18.74 |
| CONNECTICUT | 10.07 | 4.50 | 15.64 | 122.11 | $65,003 | 87.99 | 7.19 | 24.57 |
| DELAWARE | 13.55 | 8.07 | 19.03 | 113.88 | $63,336 | 83.30 | 6.44 | 10.45 |
| FLORIDA | 21.87 | 16.02 | 27.72 | 132.49 | $39,238 | 91.16 | 7.66 | 14.29 |
| GEORGIA | 17.81 | 11.41 | 24.21 | 124.84 | $43,195 | 75.07 | 7.96 | 16.00 |
| HAWAII | 23.42 | 19.27 | 27.55 | 108.22 | $49,805 | 91.93 | 5.30 | 11.28 |
| IDAHO | 6.67 | 0.06 | 13.30 | 58.59 | $35,193 | 70.58 | 6.36 | 8.68 |
| ILLINOIS | 11.32 | 5.69 | 16.96 | 109.31 | $51,776 | 88.49 | 8.03 | 11.86 |
| INDIANA | 11.19 | 5.51 | 16.88 | 112.95 | $43,399 | 72.44 | 7.46 | 16.87 |
| IOWA | 8.87 | 3.11 | 14.62 | 96.42 | $47,425 | 64.02 | 4.88 | 32.26 |
| KANSAS | 12.76 | 5.78 | 19.75 | 72.51 | $45,414 | 74.20 | 5.51 | 42.70 |
| KENTUCKY | 13.44 | 7.34 | 19.56 | 128.41 | $37,883 | 58.38 | 7.79 | 35.09 |
| LOUISIANA | 19.47 | 13.62 | 25.29 | 142.49 | $45,830 | 73.19 | 6.52 | 11.10 |
| MAINE | 5.61 | 0.05 | 11.18 | 123.63 | $38,127 | 38.66 | 6.56 | 46.13 |
| MARYLAND | 13.04 | 7.48 | 18.60 | 113.52 | $53,622 | 87.20 | 6.03 | 23.09 |
| MASSACHUSETTS | 9.46 | 3.88 | 15.01 | 126.15 | $61,643 | 91.97 | 6.50 | 4.43 |
| MICHIGAN | 7.29 | 1.78 | 12.81 | 86.66 | $40,287 | 74.57 | 9.04 | 23.04 |
| MINNESOTA | 5.28 | −0.47 | 11.04 | 71.82 | $51,350 | 73.27 | 5.58 | 34.91 |
| MISSISSIPPI | 17.80 | 11.51 | 24.07 | 143.16 | $31,838 | 49.35 | 8.34 | 33.54 |
| MISSOURI | 12.81 | 6.84 | 18.77 | 115.50 | $42,366 | 70.44 | 7.03 | 12.53 |
| MONTANA | 5.90 | −0.88 | 12.67 | 49.40 | $38,284 | 55.89 | 5.69 | 32.96 |
| NEBRASKA | 9.59 | 2.57 | 16.62 | 63.55 | $50,261 | 73.13 | 3.86 | 14.50 |
| NEVADA | 10.67 | 3.01 | 18.33 | 23.64 | $45,451 | 94.20 | 9.43 | 11.41 |
| NEW HAMPSHIRE | 6.81 | 0.89 | 12.73 | 127.81 | $48,675 | 60.30 | 4.83 | 36.69 |
| NEW JERSEY | 12.12 | 6.60 | 17.64 | 123.36 | $55,895 | 94.68 | 7.51 | 38.74 |
| NEW MEXICO | 12.49 | 4.06 | 20.91 | 33.77 | $40,579 | 77.43 | 6.63 | 38.25 |
| NEW YORK | 7.88 | 2.38 | 13.39 | 113.34 | $61,476 | 87.87 | 7.00 | 35.72 |
| NORTH CAROLINA | 15.33 | 9.19 | 21.45 | 123.45 | $43,734 | 66.09 | 7.94 | 24.04 |
| NORTH DAKOTA | 4.85 | −1.40 | 11.10 | 50.05 | $58,332 | 59.90 | 3.29 | 25.06 |
| OHIO | 10.81 | 5.19 | 16.44 | 105.84 | $44,418 | 77.92 | 7.39 | 31.30 |
| OKLAHOMA | 15.72 | 9.02 | 22.44 | 91.21 | $41,410 | 66.24 | 5.24 | 16.91 |
| OREGON | 8.83 | 2.35 | 15.28 | 79.61 | $48,781 | 81.03 | 8.12 | 30.00 |
| PENNSYLVANIA | 9.70 | 4.00 | 15.39 | 114.82 | $47,462 | 78.66 | 6.68 | 41.20 |
| RHODE ISLAND | 10.51 | 5.30 | 15.70 | 123.79 | $46,315 | 90.73 | 8.86 | 28.97 |
| SOUTH CAROLINA | 17.42 | 11.07 | 23.77 | 118.10 | $36,043 | 66.33 | 8.32 | 18.27 |
| SOUTH DAKOTA | 7.46 | 0.80 | 14.10 | 56.02 | $46,320 | 56.65 | 4.01 | 17.08 |
| TENNESSEE | 14.63 | 8.51 | 20.78 | 136.27 | $40,887 | 66.39 | 7.63 | 32.97 |
| TEXAS | 18.77 | 11.81 | 25.73 | 69.54 | $49,971 | 84.70 | 6.09 | 11.82 |
| UTAH | 9.52 | 2.34 | 16.72 | 33.67 | $42,799 | 90.58 | 5.14 | 15.88 |
| VERMONT | 6.33 | 0.60 | 12.04 | 122.98 | $42,431 | 38.90 | 4.96 | 37.50 |
| VIRGINIA | 13.35 | 7.30 | 19.40 | 113.47 | $51,656 | 75.45 | 5.44 | 14.11 |
| WASHINGTON | 8.41 | 3.04 | 13.77 | 109.87 | $54,012 | 84.05 | 7.30 | 20.71 |
| WEST VIRGINIA | 11.39 | 5.33 | 17.44 | 117.64 | $35,385 | 48.72 | 6.84 | 31.55 |
| WISCONSIN | 6.47 | 0.74 | 12.19 | 85.88 | $45,195 | 70.15 | 6.51 | 15.95 |
| WYOMING | 5.73 | −1.48 | 12.94 | 41.20 | $63,715 | 64.76 | 4.82 | 32.55 |
| DISTRICT OF COLUMBIA | 13.31 | 7.63 | 19.00 | 104.88 | $164,536 | 100.00 | 8.17 | 33.78 |
| SUMMARY OUTPUT (All Variables) | |||||
| Regression Statistics | |||||
| Multiple R | 0.54 | ||||
| R Square | 0.29 | ||||
| Adjusted R Square | 0.17 | ||||
| Standard Error | 9.48 | ||||
| Observations | 51 | ||||
| ANOVA | |||||
| df | SS | MS | F | Significance F | |
| Regression | 7 | 1551.28 | 221.61 | 2.46 | 0.03 |
| Residual | 43 | 3867.19 | 89.93 | ||
| Total | 50 | 5418.47 | |||
| Coefficients | Standard Error | t Stat | p-Value | ||
| Intercept | 11.55 | 25.24 | 0.46 | 0.65 | |
| Average Temperature (°C) | −116.43 | 212.08 | −0.55 | 0.59 | |
| Minimum Temperature (°C) | 56.32 | 106.29 | 0.53 | 0.60 | |
| Maximum Temperature (°C) | 59.37 | 105.85 | 0.56 | 0.58 | |
| Precipitation (cm) | 0.08 | 0.08 | 1.07 | 0.29 | |
| Per Capita Real GDP ($) | 0.00 | 0.00 | 1.51 | 0.14 | |
| % Urban Population | −0.26 | 0.13 | −1.94 | 0.06 | |
| Unemployment Rate | 1.03 | 1.13 | 0.91 | 0.37 | |
© 2017 by the authors. Licensee MDPI, Basel, Switzerland. This article is an open access article distributed under the terms and conditions of the Creative Commons Attribution (CC BY) license (http://creativecommons.org/licenses/by/4.0/).
Share and Cite
Phelan, P.E.; Phelan, B.E. Relationship between Ambient Temperature and Mental Health in the USA. Environments 2017, 4, 71. https://doi.org/10.3390/environments4040071
Phelan PE, Phelan BE. Relationship between Ambient Temperature and Mental Health in the USA. Environments. 2017; 4(4):71. https://doi.org/10.3390/environments4040071
Chicago/Turabian StylePhelan, Patrick E., and Bernadette E. Phelan. 2017. "Relationship between Ambient Temperature and Mental Health in the USA" Environments 4, no. 4: 71. https://doi.org/10.3390/environments4040071
APA StylePhelan, P. E., & Phelan, B. E. (2017). Relationship between Ambient Temperature and Mental Health in the USA. Environments, 4(4), 71. https://doi.org/10.3390/environments4040071