Article

Human Health Risk Assessment of Total and Organic Mercury in Fish and Seafood from Jakarta Bay, Indonesia


1
Graduate School of Environmental and Symbiotic Sciences, Prefectural University of Kumamoto, Tsukide 3-1-100, Kumamoto 862-8502, Japan
2
Research Center for Environmental Technology and Clean Technology, National Research and Innovation Agency, Science and Technology Complex (KST) B.J. Habibie, South Tangerang 15314, Indonesia
3
Research Center for Molecular Chemistry, Science and Technology Complex (KST) B.J. Habibie, South Tangerang 15314, Indonesia
4
Research Center for Energy Conversion Technology, Science and Technology Complex (KST) B.J. Habibie, South Tangerang 15314, Indonesia
5
Research Center for Oceanology, National Research and Innovation Agency, Science and Technology Complex (KST) B.J. Habibie, South Tangerang 15314, Indonesia
6
Research Center for Geoinformatics, National Research and Innovation Agency, Jakarta 10340, Indonesia
*
Author to whom correspondence should be addressed.
Environments 2026, 13(9), 482; https://doi.org/10.3390/environments13090482
Submission received: 12 August 2026 / Revised: 27 August 2026 / Accepted: 27 August 2026 / Published: 29 August 2026

Abstract

Mercury (Hg) contamination in seafood is a major environmental and public health concern because organic Hg, predominantly methylmercury (MeHg), bioaccumulates and biomagnifies through aquatic food webs. However, information on Hg speciation in fish and seafood from Indonesia remains limited. This study quantified total Hg (THg) and organic Hg (OHg) in 111 specimens representing 15 commercially important fish and seafood species collected from Jakarta Bay, Indonesia, and assessed the associated human health risk. Median THg concentrations ranged from 0.032 to 3.82 mg/kg dry weight (dw), whereas median OHg concentrations ranged from 0.014 to 2.95 mg/kg dw. A comparison with international and Indonesian food safety guidelines showed that Moses perch (Lutjanus russellii) exceeded the maximum permissible Hg concentration, whereas all other species complied with established limits. Median organic Hg accounted for 26.5–89.4% of THg. THg and OHg concentrations were significantly positively correlated with fish length but not weight. Most species presented negligible non-carcinogenic risks (hazard quotient, HQ < 1); however, 16% and 4% of evaluated exposures exceeded the HQ threshold for children and adults, respectively. Overall, Hg speciation combined with human health risk assessment provides a comprehensive evaluation of seafood safety beyond THg alone. These findings provide baseline data supporting consumption advisories, long-term Hg monitoring, and evidence-based risk management in Indonesia.

1. Introduction

Mercury (Hg) is highly toxic to human health, posing a particular threat to the development of the child in utero and early in life. It occurs naturally and exists in various forms including elemental or metallic, inorganic (for example, mercuric chloride), and organic (for example, methylmercury (MeHg) and ethylmercury (EtHg) [1]. In aquatic environments, mercury can undergo various chemical and biological transformations after being transported through the atmosphere and deposited in water and sediments [2]. Inorganic Hg can be converted to methylmercury (MeHg) through microbial methylation under suitable environmental conditions [3,4]. Once formed, MeHg can be taken up by phytoplankton and transferred through zooplankton and fish, resulting in its accumulation and biomagnification in the food web, particularly in predatory species such as sharks and swordfish [5]. MeHg can also be transformed back through microbial and photochemical demethylation, which affects its persistence and availability in aquatic systems [6,7].
Elemental Hg and MeHg are toxic to the central and peripheral nervous system. The inhalation of Hg vapour can produce harmful effects on the nervous, digestive, and immune systems, lungs and kidneys, and may be fatal. Contaminated fish and shellfish are the main sources of MeHg exposure, especially in populations that rely heavily on consumption of predatory fish [1]. Cooking does not eliminate Hg from fish [1]. Children are especially vulnerable and may be exposed directly by eating contaminated fish. Methylmercury bioaccumulated in fish and consumed by pregnant women may lead to neurodevelopmental problems in the developing foetus. Transplacental exposure is the most dangerous, as the foetal brain is very sensitive [1]. Children exposed to MeHg while they are in the womb can suffer neurological impacts to their cognitive thinking, memory, attention, language, fine motor skills, and visual spatial skills [8,9]. In infants and young children, a condition called acrodynia (or “pink disease”), characterized by red and painful extremities with local swelling and intense itching and which can be accompanied by insomnia, irritability, and sensitivity to light, has been reported to result from chronic Hg exposure [1].
Methylmercury is particularly concerning due to its potential to bioaccumulate in organisms and biomagnify in aquatic food webs [10,11,12]. The bioaccumulation of Hg is closely tied to the biogeochemical processes that control MeHg production and availability, as well as the ecological processes that govern biomagnification [13,14]. Biomagnification occurs when contaminant concentrations in consumers exceed the concentrations found in their prey [15].
Indonesia is one of the five largest consumers of aquatic foods globally. In 2019, the share of the five largest consuming countries (China, Indonesia, India, the United States of America, and Japan) rose to 59 percent [16]. National fish consumption reached nearly 59 kg capita−1 year−1 in 2024 and increased by approximately 54% during the last decade [17]. As seafood consumption continues to rise, concerns regarding Hg exposure through seafood are becoming increasingly important.
Jakarta Bay is located in the vicinity of the megacity Jakarta, Indonesia, where various anthropogenic activities contribute trace hazardous elements to the bay through industrial discharges, municipal wastewater, surface runoff, and atmospheric deposition [18,19]. Trace metal contamination has been reported in Jakarta Bay, where Pb, Cd, Cu, Zn, and Ni have been detected in water and sediment over the past 15 years [18,19,20]. A similar order of element concentrations was observed in tissues of economically important bivalve and fish species and in the bay’s environmental matrices. At several sampling stations, concentrations of Cu, Cr, and Hg in water and sediment were above the effects range medians [21].
Despite the severe pollution in Jakarta Bay, the area provides important economic and social benefits for local fishermen and supplies an affordable source of protein for communities in Jakarta and its surrounding areas [21]. Seafood consumption may therefore represent an important pathway through which local communities are exposed to potentially hazardous trace elements originating from Jakarta Bay [22]. Human health risk assessment is widely used to estimate the potential adverse health effects associated with exposure to environmental contaminants through food consumption and has become an important tool for evaluating seafood safety [23]. Since fish consumption is the primary route of human exposure to MeHg, assessing the health risks associated with the consumption of MeHg contaminated seafood from Jakarta Bay is essential for protecting public health and providing scientific information for seafood management and consumption advisories [24].
Although there are growing concerns regarding Hg contamination in Indonesian coastal waters, comprehensive information on Hg speciation in commercially important seafood remains lacking. Previous studies largely focused on THg concentrations [21,25,26,27,28], whereas the distribution of organic Hg (OHg), its contribution to THg, and its implications for human exposure received limited attention. Since MeHg is the predominant toxic form accumulated in seafood, evaluating Hg speciation is important for improving dietary exposure assessment. Therefore, this study simultaneously evaluated THg and OHg concentrations, characterized OHg/THg ratios, and assessed human health risk associated with seafood consumption in Jakarta Bay. Integrating Hg speciation analysis with exposure assessment provides a more comprehensive evaluation of seafood safety than THg measurements alone and establishes an important baseline for future Hg monitoring and risk management in Indonesia.

2. Materials and Methods

2.1. Study Area

Jakarta Bay is a semi-enclosed coastal bay situated along the northern coast of Jakarta, Indonesia, extending from approximately 106°21′ to 107°03′ E in longitude and 5°10′ to 6°10′ S in latitude. Its western and eastern boundaries are marked by Tanjung Pasir and Tanjung Karawang, respectively. Several major rivers drain freshwater and wastewater from Jakarta and the surrounding areas into the bay. These include the Cisadane River to the west, the Angke and Ciliwung Rivers in the central part of the bay, and the Citarum River in the east, which forms the largest river delta near Tanjung Karawang. The bay covers an area of approximately 514 km2 and has a shoreline extending about 76 km [29]. Its average depth is approximately 15 m [29,30].
The industrial areas which are located close to the Jakarta Bay such as Cilincing—North Jakarta, Pulogadung—East Jakarta, Bekasi and Bogor may also contribute to the increasing pollution of the Jakarta Bay [21]. The surrounding rivers and canals transport domestic and industrial wastes into Jakarta Bay, and river discharge has been identified as an important pathway for anthropogenic heavy metals leading to coastal sediments [21,31]. Previous studies also reported Hg contamination in Jakarta Bay sediments, with elevated concentrations associated with industrial emissions and other anthropogenic activities [32].

2.2. Sample Collection

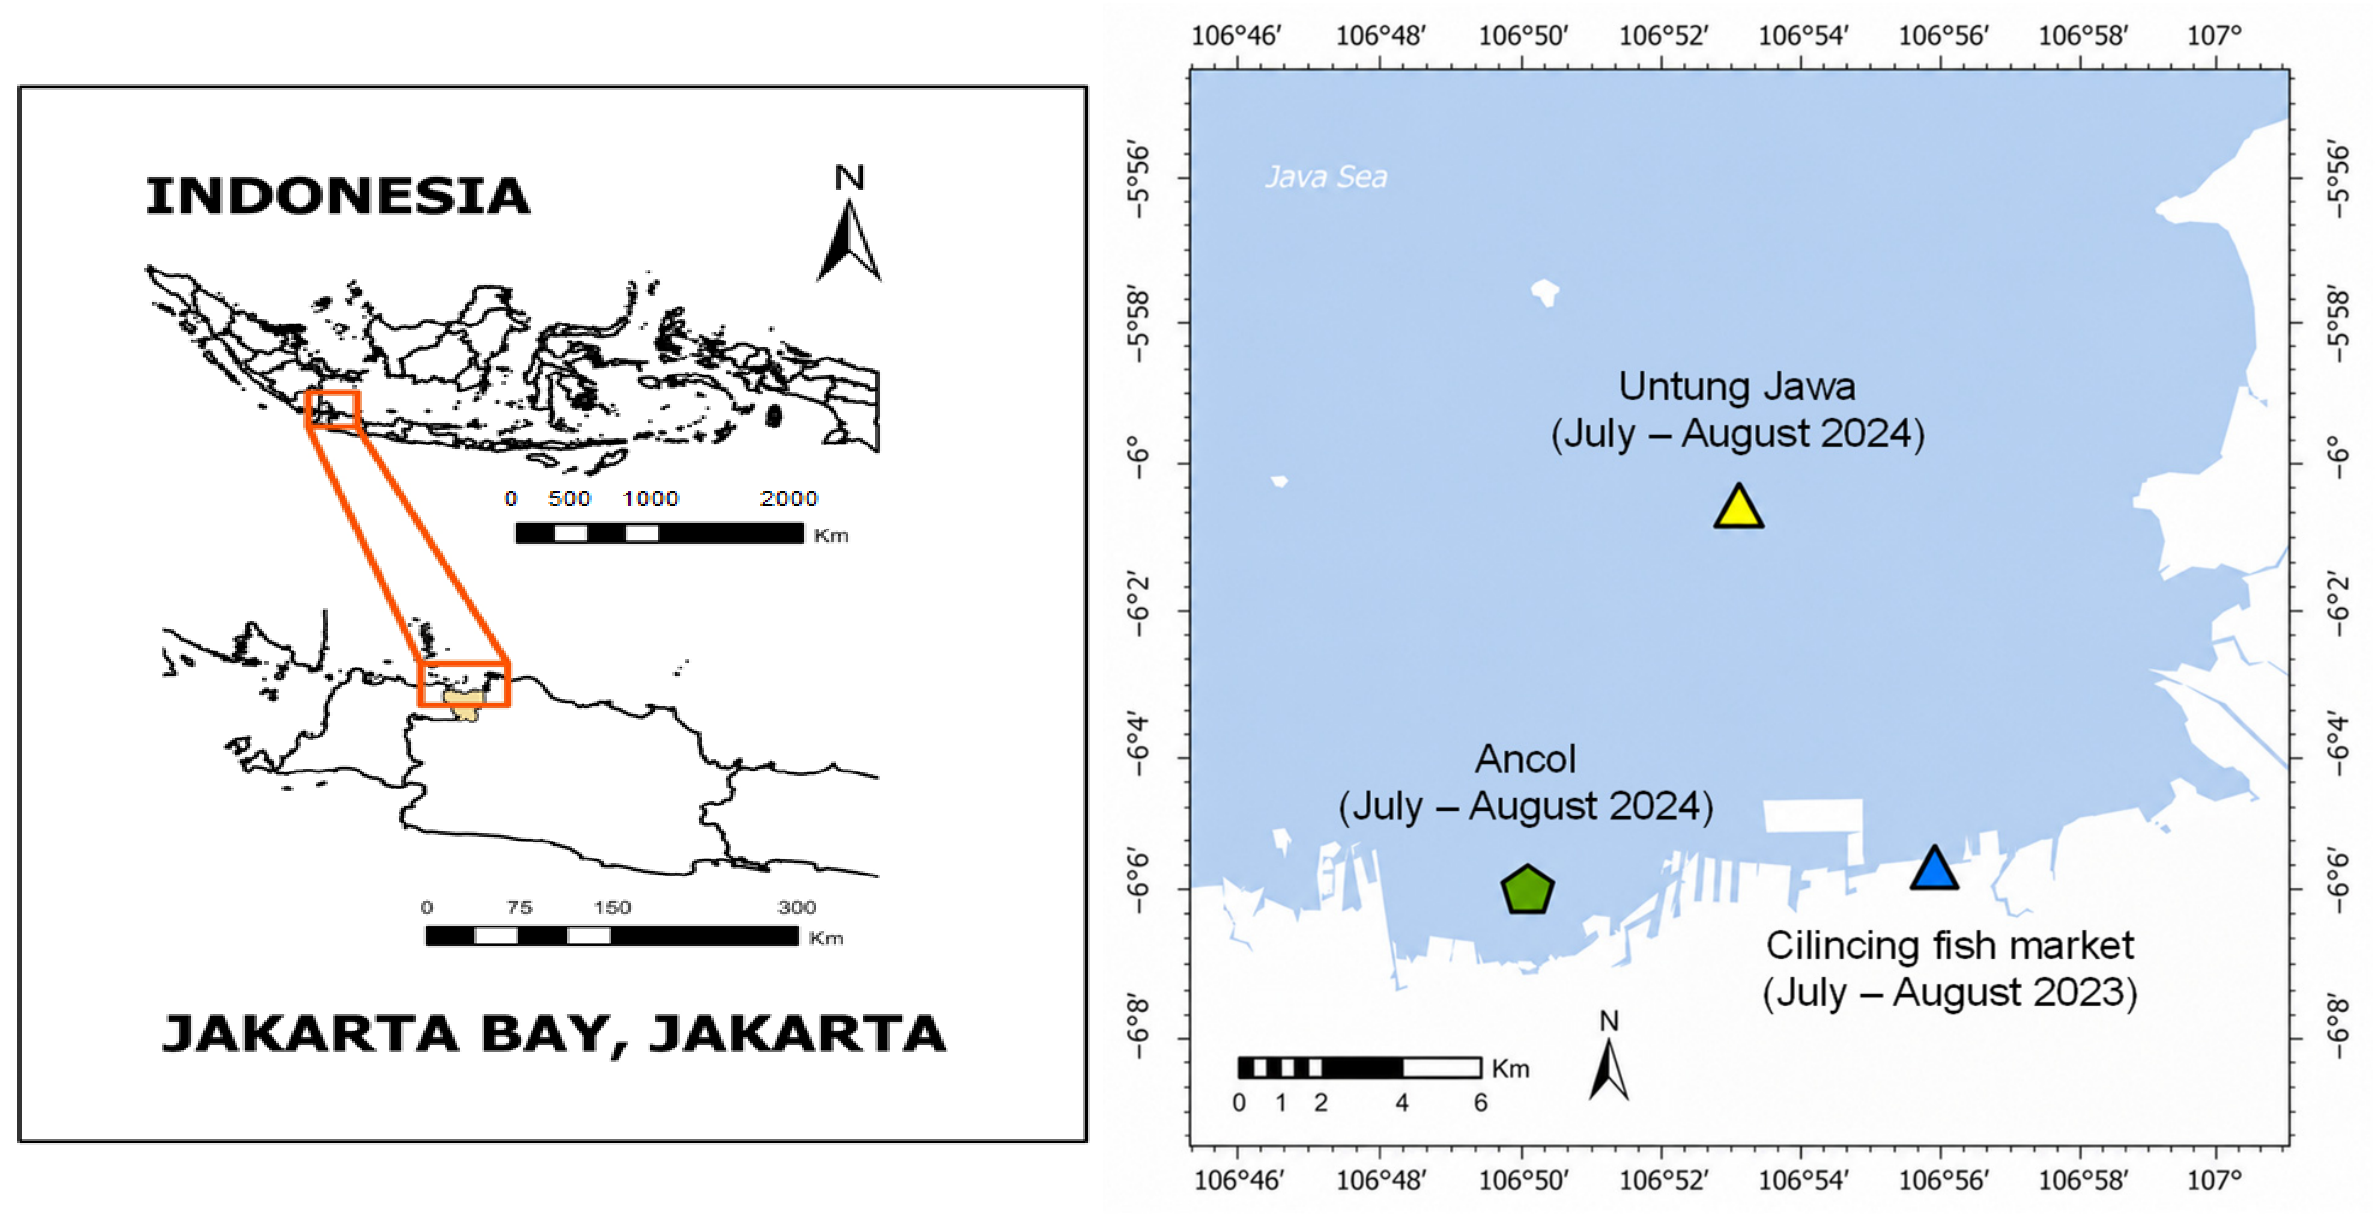
Fish and seafood samples were collected from Jakarta Bay, Indonesia, during July–August 2023 and July–August 2024. Sampling locations included Cilincing Fish Market (6°05′52″ S, 106°56′23″ E), Untung Jawa Island (6°00′40″ S, 106°53′33″ E), and Ancol (6°06′14″ S, 106°50′24″ E) (Figure 1). A total of 111 samples representing 15 species were collected during the two sampling periods, with 40 samples collected in 2023 and 71 samples in 2024. The samples included fish, molluscs, crustaceans, and cephalopods (Table 1). The samples were captured by fishermen from Jakarta Bay area through trawling, then placed into clean polythene bags and transported to the laboratory with ice bags.

2.3. Sample Pretreatment

Both the length and weight of the collected samples were measured. Then, the samples were dissected with ceramic scissors, and the muscle tissues were freeze-dried (DC401, Yamato Scientific Co., Ltd., Tokyo, Japan). Dried samples were ground into fine powder and homogenized in an agate mortar and then stored in a desiccator. The water content of the muscle tissue was calculated by the weight of water reduced on vacuum freeze drying.

2.4. Analysis of Total and Organic Hg (≒ MeHg)

Total mercury and OHg were determined following the method of Yoshimoto et al. [33]. Organic mercury in fish muscle consists predominantly of MeHg, with other OHg species generally occurring only at trace levels. Accordingly, OHg concentration in this study was considered a close approximation of MeHg concentration [34,35]. Therefore, OHg is used throughout this study as an operationally defined organic Hg fraction that closely approximates MeHg in fish muscle. Samples (0.2 g dry weight) were digested with 1 mL of 0.1% cysteine solution and 1 mL of 5 M NaOH at 80 °C for 1–2 h. The digested samples were diluted to 5 mL with distilled water and subsequently degreased using di-isobutyl ketone, followed by hexane washing to remove residual lipids. For THg determination, an aliquot of the resulting digested and degreased solution was analysed directly.
For OHg analysis, 2 mL of the digested and degreased solution was transferred into a polypropylene tube and mixed with 2 mL of 5 M HBr, 0.5 mL of 1 M CuCl2, and 6 mL of toluene. After vigorous shaking and centrifugation, the toluene phase containing OHg was collected and back-extracted into 1 mL of 0.2% cysteine–2% sodium acetate solution. Total Hg and OHg concentrations were quantified using a direct thermal decomposition Hg analyser (MA-3000, Nippon Instruments, Kyoto, Japan) based on cold-vapor atomic absorption spectrometry at 253.7 nm.
To ensure contamination prevention, all glassware was thoroughly cleaned with detergent, rinsed with tap water, and sonicated for 10 min, immersed in a 4M nitric acid (HNO3) solution for a minimum of 24 h, rinsed five times with ultrapure water, and subsequently dried overnight in a drying machine.
Analytical accuracy was assessed using the certified reference material NMIJ CRM 7403-a (Trace elements, arsenobetaine and methylmercury in swordfish tissue; National Metrology Institute of Japan, Tsukuba, Japan). Recovery determinations were conducted on three different days prior to sample analysis, with three determinations for THg and three for OHg. Each determination was based on four replicate measurements, and the reported values represent the mean ± SD of the replicates. The measured concentrations of THg and OHg agreed well with the certified values, with recoveries rates from 99.9 ± 6.37%–100 ± 0.93% (n = 3) and 99.6 ± 6.98%–100 ± 6.74% (n = 3), respectively. The detection limit of the THg and OHg concentration was 0.001 mg/kg dw. One blank was included in each analytical run to monitor potential contamination. Each individual specimen was analysed as a single determination.

2.5. Health Risk Assessment

In this study, the health risk of Hg was determined based on the United States Environmental Protection Agency’s guidance for health risk assessment of chemical compounds [36]. Chronic daily intake (CDI) was computed using the following equation:
C D I i n g e s t i o n = C × I R × E D × E F B W × A T
where C is MeHg concentration (mg/kg ww), IR is ingestion rate of fish (25.6 g ww/day for children and 51.3 g ww/day for adults) [37], or mussel (0.214 g ww/day for children and 0.429 g ww/day for adults) [38], ED is exposure duration (6 years for children and 30 years for adults) [36], EF is exposure frequency (350 day/year) [36], BW is body weight (15 kg for children and 55 kg for adults) [39], and AT is the averaging time (2190 days for children and 10,950 days for adults) [36]. The fish and mussel ingestion rates were derived from the average weekly per capita consumption reported by Statistics Indonesia (BPS) [37,38] and converted to daily consumption rates.
To evaluate the potential non-carcinogenic risk of Hg exposure, the hazard quotient (HQ) was calculated according to Equation (2). HQ represents the ratio of the estimated exposure to the reference dose (RfD). An HQ above 1 indicates a potential health concern, while an HQ of 1 or below suggests that the exposure is unlikely to pose a non-carcinogenic risk.
H Q i n g = C D I I n g e s t i o n R f D I n g e s t i o n
where CDIIngestion is the chronic daily intake from Equation (1) and RfDIngestion is the oral reference dose for MeHg (0.0001 mg/kg-day) [40].

2.6. Statistical Analysis

Statistical analysis for this study was performed utilizing a range of specialized software packages, notably IBM SPSS Statistics version 24 (IBM Corp., Armonk, NY, USA) R version 4.6.1 [41]. The Kolmogorov–Smirnov test was employed to evaluate the normality of the data distribution, which indicated a non-normal distribution. The Kruskal–Wallis test was used to evaluate the differences among groups and Dunn’s post hoc multiple comparison test with Holm correction was performed to identify significant pairwise differences while controlling for multiple comparisons. Samples collected in 2023 and 2024 were pooled for the overall species-based analysis. To compare temporal variations between samples obtained in 2023 and 2024 for species included by both sampling periods, the Mann–Whitney U test was used. A p-value of less than 0.05 was considered to indicate statistical significance. ArcGIS Pro, version 3.0.2 (Environmental Systems Research Institute (ESRI), Redlands, CA, USA) was utilized for spatial visualization and mapping. Spatial visualization and mapping were performed using ArcGIS Pro (Environmental Systems Research Institute (ESRI), CA, USA).

3. Results and Discussion

3.1. Total Hg, Organic Hg Concentrations, and OHg (MeHg) Ratio

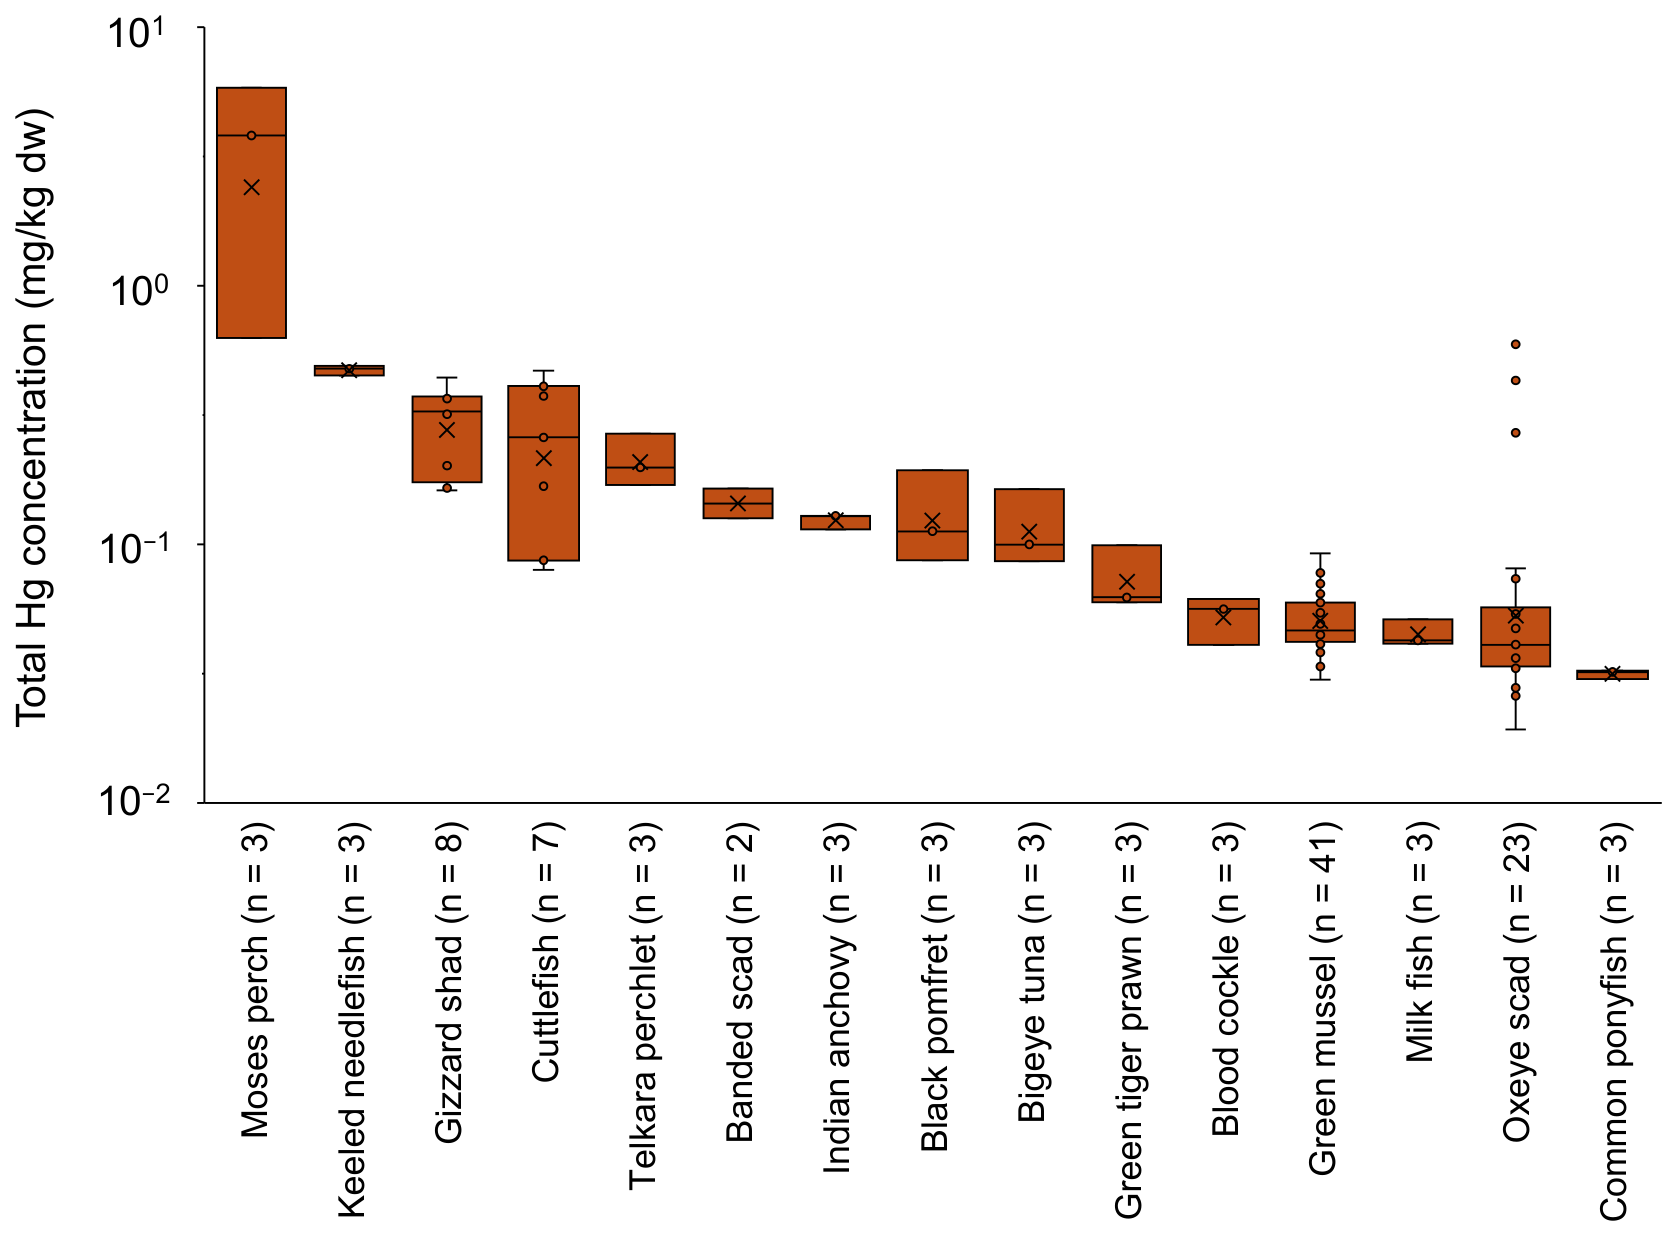
Total Hg concentration varied markedly among the investigated fish and seafood, with median THg concentrations ranging from 0.032 mg/kg dry weight (dw) in common ponyfish to 3.82 mg/kg dw in Moses perch (Figure 2). According to the Kruskal–Wallis analysis, THg concentrations differed significantly across the 15 investigated species (p < 0.001). Pairwise comparisons using Dunn’s post hoc test with Holm correction also indicated significant differences for several species pairs after adjustment for multiple comparisons (adjusted p < 0.05) Species with relatively high THg concentrations, including Moses perch, keeled needlefish, gizzard shad, and cuttlefish, showed significantly different Hg accumulation patterns compared with several low THg species. Moses perch differed significantly from common ponyfish (adjusted p = 0.009), green mussel (adjusted p = 0.048), and oxeye scad (adjusted p = 0.014). Similarly, gizzard shad showed significant differences compared with common ponyfish (adjusted p = 0.006), green mussel (adjusted p = 0.003), and oxeye scad (adjusted p < 0.001), while cuttlefish differed significantly from common ponyfish (adjusted p = 0.018), green mussel (adjusted p = 0.034), and oxeye scad (adjusted p = 0.007). However, most pairwise comparisons were not significant. The lack of significant differences among many species pairs was likely due to overlapping Hg distributions caused by biological variability and limited sample sizes, rather than species differences [42,43]. These results should be interpreted cautiously, particularly for species represented by only 2–3 specimens.
The measured THg concentration was compared with the maximum permissible levels established by the Codex Alimentarius Commission [44], Commission Regulation (EU) 2023/915 [45], and the Indonesian National Agency of Drug and Food Control [46], which specify a maximum Hg concentration of 0.5 mg/kg wet weight (ww) for most fish species and 1 mg/kg ww for selected predatory species such as tuna, swordfish, sharks, and marlin. For comparison with regulatory limits expressed on a wet-weight basis, Hg concentrations were converted from dry weight (dw) to wet weight (ww) by dividing the dry-weight concentrations by a correction factor of 4.19, based on a moisture content of approximately 76.2%. Among the investigated species, only Moses perch (Lutjanus russellii) exceeded the regulatory limit for most fish, with a maximum THg concentration of 1.39 mg/kg ww.
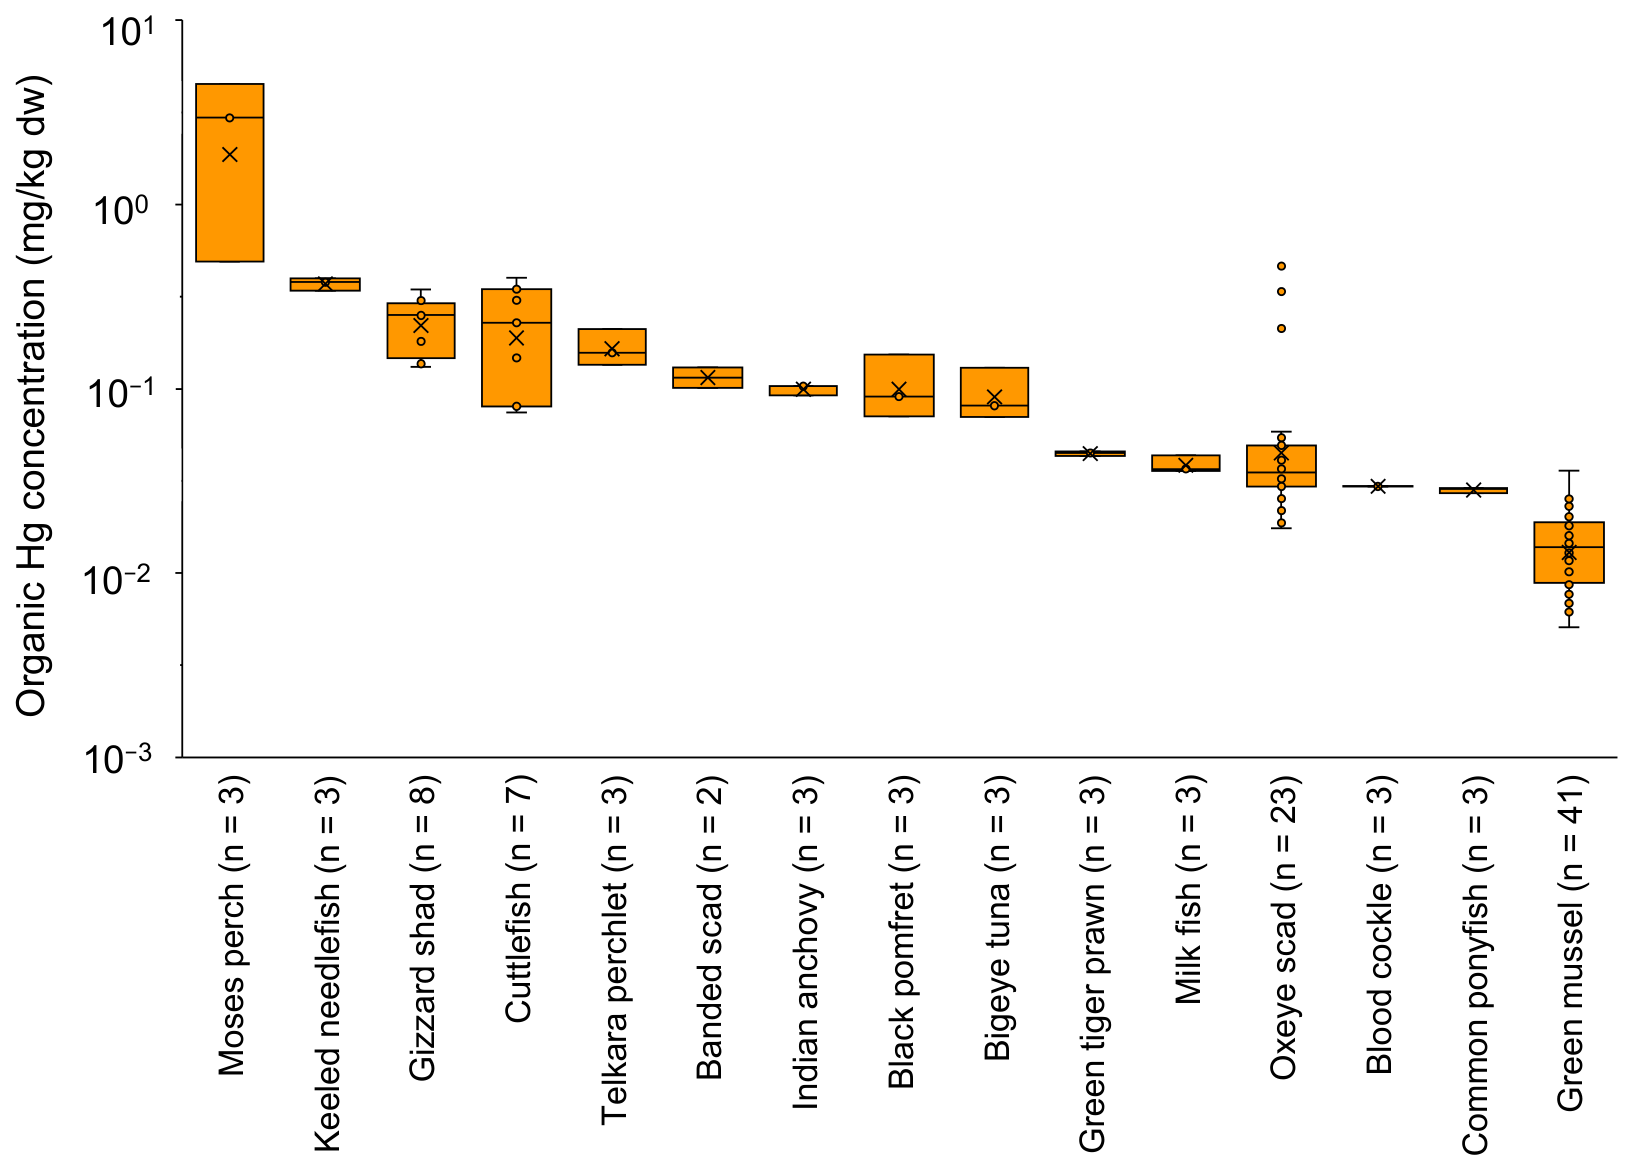
Similar to THg accumulation, the concentration of OHg varied across the fish and seafood (Figure 3), with median concentrations ranging from 0.014 mg/kg dw in green mussel to 2.95 mg/kg dw in Moses perch. Significant differences in organic mercury (OHg) concentrations were observed among the examined species (Kruskal–Wallis test, p < 0.001). Median OHg concentrations varied considerably among species, with the highest levels observed in Moses perch, followed by keeled needlefish, gizzard shad, and cuttlefish, whereas lower concentrations were detected in green mussel. Dunn’s post hoc comparisons with Holm adjustment revealed that green mussel exhibited significantly lower OHg concentrations than cuttlefish (adjusted p < 0.001), gizzard shad (adjusted p < 0.001), keeled needlefish (adjusted p = 0.002), Moses perch (adjusted p < 0.001), oxeye scad (adjusted p < 0.001), and Telkara perchlet (adjusted p = 0.040). However, most pairwise comparisons remained non-significant after correction, indicating considerable overlap in OHg concentrations among many species. Some species had only 2–3 specimens, so these differences should be interpreted with caution.
Organic Hg concentration (as a proxy for MeHg) was converted from dry weight dw to wet weight (ww) using the same correction factor applied to THg (4.19), corresponding to a moisture content of approximately 76.2%, and was evaluated against international and national food safety limits, including the Codex/FAO–WHO guideline of 0.5 mg/kg ww for most fish species [44], the Japanese regulatory limits of 0.3 mg/kg ww for general fish and 0.4 mg/kg ww for certain fishery products [47], and the Indonesian National Standard (SNI 7387:2009) maximum level of 0.5 mg/kg ww for mercury in fishery products [48]. In the present study, most species were well below all referenced guideline values. However, Moses perch (Lutjanus russelli) reached OHg concentrations up to 1.07 mg/kg ww, exceeding all referenced guideline values, indicating potential non-compliance with international food safety standards.
Previous studies demonstrated that Hg concentrations in aquatic organisms vary considerably among species due to differences in trophic position, prey composition, and environmental exposure pathways [43,49,50]. Similar species dependent variability was also reported in Indonesian marine organisms. Suratno et al. [25] reported significant differences in THg concentrations between Indian scad (Decapterus russelli) and torpedo scad (Megalaspis cordyla), suggesting that Hg accumulation and its relationship with body size vary among species. Likewise, Koesmawati and Arifin [27] reported marked differences in THg concentrations among seafood species collected from the Jakarta Fishing Port; however, the elevated Hg concentration observed in green mussels was attributed to contamination of the local coastal environment, indicating that environmental conditions, in addition to species-specific traits, strongly influence Hg accumulation. Similar differences were reported in marine fishes from Southeast Asia, where Hg concentration varied considerably among fish taxa collected from Cambodia, Indonesia, Malaysia, and Thailand [51].
Higher Hg burdens in predatory species are generally associated with the efficient assimilation and retention of MeHg, which undergoes biomagnification through aquatic food webs [13]. Conversely, species occupying lower trophic levels or with different feeding strategies may exhibit lower Hg concentrations because of reduced dietary exposure and differences in Hg uptake efficiency [52]. Higher OHg concentrations in predatory fish species are consistent with the well-established biomagnification of MeHg through aquatic food webs, where Hg concentrations generally increase with increasing trophic level [12,53]. Conversely, the lower OHg concentrations observed in filter-feeding bivalves, such as green mussel, may reflect differences in mercury exposure pathways and lower trophic positions compared with predatory fishes [54]. These results highlight the importance of ecological characteristics when evaluating Hg contamination and potential human exposure through seafood consumption.
The greater Hg concentrations detected in Moses perch could be related to biological characteristics often associated with predatory marine fishes, such as higher trophic position and carnivorous feeding behaviours, which enhance MeHg biomagnification through the aquatic food web [12,55]. Dietary uptake is the primary pathway for MeHg accumulation, and its high assimilation efficiency combined with slow elimination results in progressive increases in Hg concentration with trophic level [13,56]. Therefore, the elevated Hg concentrations observed in Moses perch are consistent with patterns reported for piscivorous marine fishes in previous studies. Our preliminary data of δ15N, which is indicator of trophic position, could support this higher Hg bioaccumulation in Moses perch (Sulistia et al. in preparation).
Methylmercury, the most toxic and bioavailable Hg species in fish, is readily absorbed through seafood consumption and represents the principal pathway of human Hg exposure [34,57]. Following dietary uptake, MeHg binds strongly to sulfhydryl groups in proteins and is retained efficiently in muscle tissues because of its slow elimination rate, resulting in prolonged biological persistence and greater accumulation than inorganic Hg [34,58]. Consequently, the high OHg concentration observed in Moses perch, a piscivorous species [59], suggests a greater potential for dietary MeHg exposure than consumption of species with lower OHg concentrations. The differences of OHg concentration observed in the present study are consistent with previous findings demonstrating that MeHg accumulation is influenced by multiple ecological and physiological factors, including feeding strategy, trophic position, habitat characteristics, metabolic processes, environmental MeHg availability, as well as Hg uptake and detoxification mechanisms [60,61]. Conversely, the relatively low OHg concentrations observed in green mussel, blood cockle, green tiger prawn, milkfish, and common ponyfish indicate comparatively lower accumulation of the biologically available Hg fraction, although environmental conditions, trophic position, and physiological characteristics may also influence Hg speciation and tissue concentrations [60].
Determination of OHg provides additional information on Hg speciation that complements THg measurements when evaluating Hg exposure through seafood. Information on OHg concentrations in several commercially marine species from Indonesian coastal waters, including Moses perch, keeled needlefish, Telkara perchlet, banded scad, and common ponyfish, remains limited. Therefore, the present study provides valuable baseline data on OHg accumulation that can support future Hg monitoring, seafood safety assessments, and environmental health management in Indonesia.
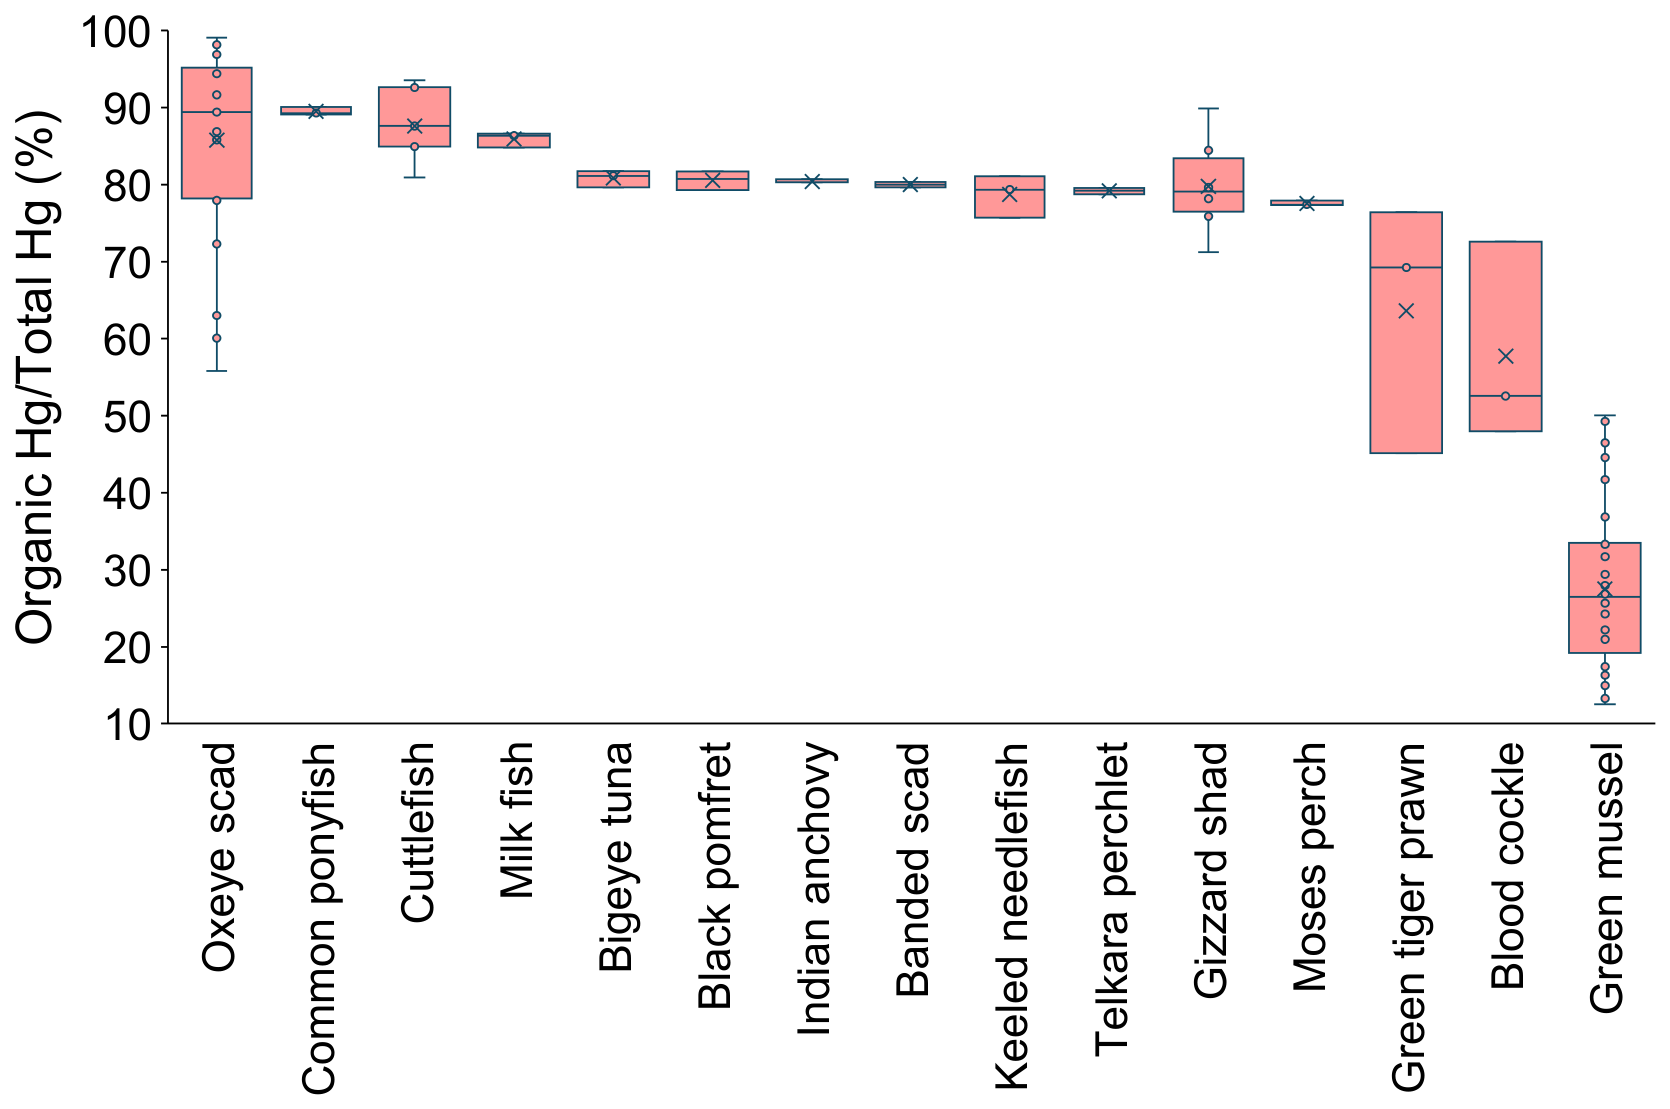
The OHg/THg ratio varied from 26.5% to 89.4% (Figure 4). Oxeye scad had the largest proportions (89.4%), followed by common ponyfish (89.3%), cuttlefish (87.6%), milkfish (86.4%), bigeye tuna (81.2%), and black pomfret (80.7%). Intermediate levels were found in Indian anchovy (80.3%), banded scad (80.0%), keeled needlefish (79.4%), Telkara perchlet (79.2%), gizzard shad (79.1%), and Moses perch (77.4%). Invertebrates with lower OHg proportions, such as green tiger prawn (69.2%), blood cockle (52.6%), and green mussel (26.5%), showed progressively lower OHg intake from finfish to benthic invertebrates.
The consistently high OHg/THg ratios observed in most fish species (>77–89%) indicate that Hg in muscle tissue is predominantly present as OHg. This reflects biomagnification through aquatic food webs, where MeHg is strongly assimilated via diet and retained due to slow elimination. Global assessments confirm that fish muscle typically contains approximately 80–95% MeHg of THg [62].
Variation in OHg/THg ratios among species demonstrates that THg concentrations alone may not fully represent the biologically relevant fraction of Hg in seafood. Although THg is widely used for seafood monitoring, the proportion of OHg differed considerably among the investigated species, indicating that Hg speciation provides additional insight into Hg bioaccumulation and potential dietary exposure. Because MeHg is the predominant toxic form of Hg in seafood, incorporating Hg speciation into monitoring can improve the assessment of seafood safety and human health risks [33,34,63].
The highest ratios observed in oxeye scad, ponyfish, milkfish, and cuttlefish (>86–89%) indicate the strong trophic transfer efficiency of MeHg in marine food webs. This is consistent with well-established evidence that MeHg production in aquatic environments is driven by microbial activity in sediments and is efficiently transferred across trophic levels through predation [61]. In contrast, crustaceans and bivalves exhibited lower OHg proportions (26–69%), which may reflect increased exposure to inorganic Hg from sediments and suspended particulate matter. Filter-feeding bivalves such as green mussel and blood cockle accumulate Hg primarily through direct uptake of particulate-bound inorganic Hg rather than through food-web biomagnification, resulting in lower MeHg fractions [56]. The very low OHg/THg ratio in green mussel (26.5%) indicates dominant inorganic Hg uptake associated with benthic and filtration pathways [54].
Overall, the results demonstrate a clear taxonomic separation in Hg speciation where fish are dominated by MeHg due to biomagnification through aquatic food webs, whereas invertebrates contain higher proportions of inorganic Hg due to direct environmental exposure pathways. This pattern is widely observed in aquatic ecosystems and is critical for human health risk assessment because MeHg is the most toxic and bioavailable form in seafood [62].

3.2. Temporal Trends in Hg Concentration and Fish Biological Parameters Between 2023 and 2024

Oxeye scad (Selar boops), cuttlefish (Sepia sp.), gizzard shad (Anodontostoma chacunda), and green mussel (Perna viridis) were consistently collected between 2023 and 2024. The Mann–Whitney U test revealed different patterns between sampling years among species. Concentrations of THg and OHg in oxeye scad, as well as fish length and body weight, were significantly higher in 2023 than in 2024 (p < 0.05). All four variables were significantly lower in 2023 than in 2024 in cuttlefish (p < 0.05). However, gizzard shad was only significantly greater in length in 2023, whereas THg concentration, OHg concentration, and body weight were similar between years (p > 0.05). Over the sample year, green mussel was shown to be significantly higher for OHg and body weight (p < 0.05) in 2023, but not significantly different for THg concentration and length (p > 0.05). These results suggest that differences between 2023 and 2024 samples were not consistent across species. Because sampling also took place at different sites, differences may be caused by combined spatial heterogeneity in Hg exposure and natural biological variability than of temporal variation alone [12,64]. Additionally, Hg bioaccumulation is influenced by biological and ecological factors, including trophic position, habitat use, feeding ecology, and body size, which may contribute to differences in Hg concentrations among species [65]. However, because the sample size in 2023 was too small (n < 5), further results and the discussion used all the dataset.

3.3. Comparison with Other Studies

The total Hg concentrations observed in the present study (0.032–3.82 mg/kg dw) were generally comparable to those reported for commercially important seafood from Indonesia and other developing countries, although substantial interspecific variation was evident (Table 1). Total Hg concentrations exceeded those reported for fish and shrimp from the Gresik Coast [28] but were comparable to predatory seafood from the Jakarta Fishing Port [27], Peninsular Malaysia [66], Jakarta Bay [51], and the Indian Ocean [67]. In contrast, green mussels from the present study contained much lower THg concentrations than those reported from previous study in Jakarta Bay and East Java [68,69], indicating considerable spatial variation in Hg contamination within Indonesia.
A major strength of the present study is the simultaneous determination of THg and OHg, revealing OHg/THg ratios ranging from 26.5% to 89.4%. Similar to the study from Guanabara Bay, Brazil [70,71], predatory fish exhibited high OHg proportions, whereas the filter-feeding green mussel showed a much lower OHg/THg ratio, reflecting differences in trophic position and Hg uptake pathways.
Mecury is bioavailable in Jakarta Bay based on the detection of THg and OHg in the investigated fish and seafood. Relatively low to moderate THg values compared to a previous study from Jakarta Bay and other Indonesian coastal waters (Table 2) suggest that Hg accumulation is not uniform among organisms. For example, green mussel showed lower THg concentrations than previous study from Jakarta Bay and East Java as reported by Andayani et al. [69]. Spatial and temporal variability of Hg exposure may cause this difference. Other factors such as environmental condition and anthropogenic input can also affect the difference in Hg concentration in organisms. Local environmental conditions may influence Hg accumulation in green mussel as a filter feeding organism, making it an indicator of site-specific contamination levels [72].
However, Hg transfer through the food web in Jakarta Bay in this study was shown by the elevated Hg concentration in higher trophic level or predator organisms. As a result, while the overall Hg concentrations in most of the fish and seafood investigated in this study were relatively low, the presence and transfer of Hg in marine biota from Jakarta Bay suggests the importance of continuous monitoring, particularly for commercially consumed and higher trophic level species, to assess long-term changes in Hg exposure and the potential risk associated with seafood consumption.

3.4. Health Risk Assessment

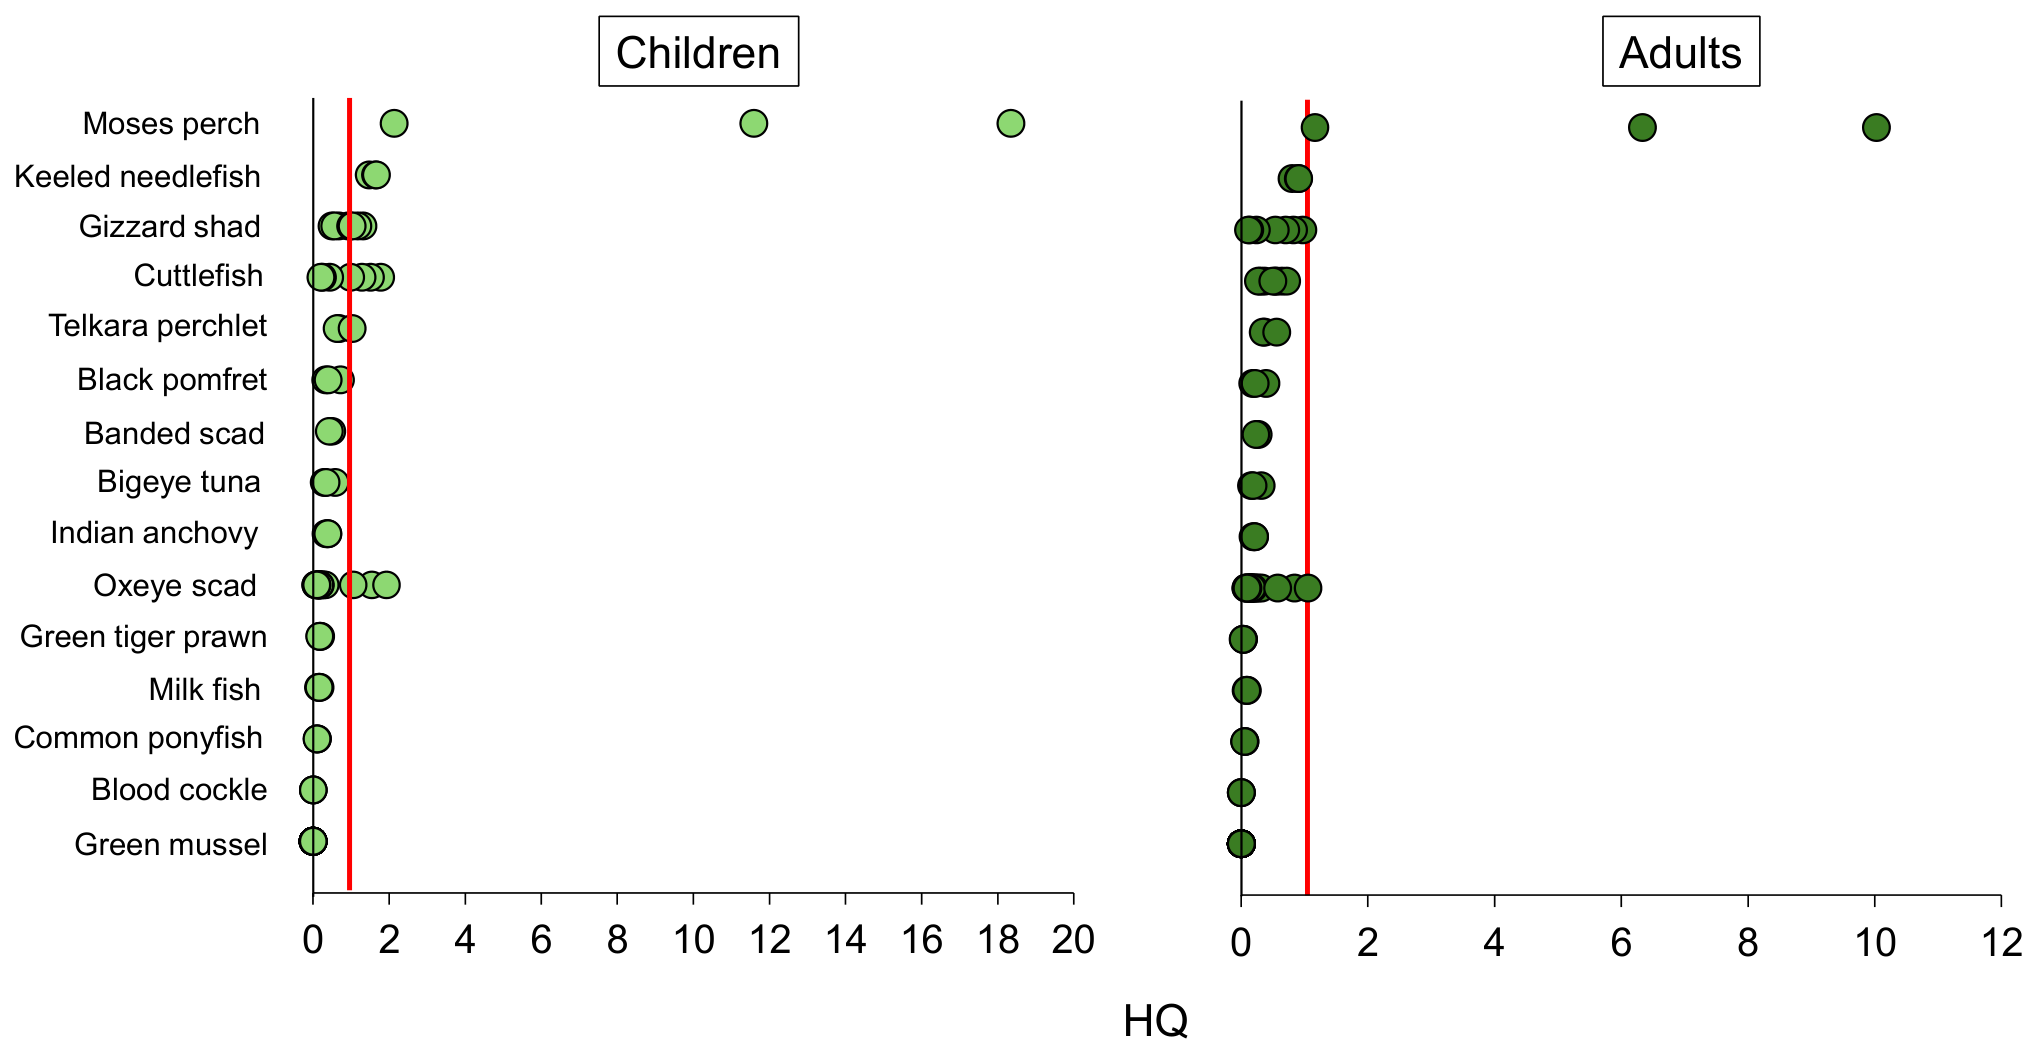
The hazard quotient (HQ) analysis revealed that most seafood species posed no significant non-carcinogenic risk (HQ < 1). However, certain high-trophic-level species exceeded the threshold (HQ ≥ 1), indicating potential health concerns under higher intake levels (Figure 5). This finding is consistent with international risk assessments indicating that the consumption of predatory fish is an important source of dietary MeHg exposure in humans [73,74]. An age-dependent difference was observed, with children exhibiting consistently higher HQ values than adults across all species. Approximately 16% of exposure in children exceeded the HQ threshold, compared to only 4% in adults. This difference is primarily driven by lower body weight in children, resulting in higher intake per unit body mass when consuming the same amount of seafood. Although most investigated fish and seafood species posed negligible non-carcinogenic risks under the evaluated exposure scenarios, the higher HQ values observed in children emphasize their greater susceptibility to dietary Hg exposure. These findings suggest that children should be considered a priority population when developing seafood consumption advisories. Because dietary Hg exposure is dose-dependent, reducing the amount or frequency of consumption of species with higher Hg concentrations may help reduce exposure, particularly among children. In addition, MeHg is a neurotoxicant with heightened sensitivity during early developmental stages [8,73]. However, we also highlighted the role of selenium (Se) in influencing MeHg toxicity, suggesting that the potential health effects of dietary Hg exposure may be influenced by Se status and the relative amounts of Hg and Se in seafood [75,76,77,78].
Species with higher THg and OHg concentrations corresponded to elevated HQ values, indicating that OHg (MeHg-equivalent) was the dominant driver of dietary exposure risk. Previous research also indicated that Hg speciation provides additional information for assessing dietary MeHg exposure beyond THg concentrations [74]. Overall, while most fish and seafood remain within acceptable risk limits, predatory fish represent a key exposure pathway requiring targeted consumption advisories. These results are consistent with current international guidelines emphasizing species-specific and population-sensitive risk management strategies for MeHg exposure [73,74]. Because sample sizes were limited and varied among species, particularly for Moses perch (n = 3), the CDI and HQ estimates should be considered preliminary and interpreted with caution.

3.5. Limitations of Study

This study provides important baseline information on THg, OHg, and Hg speciation in commercially important seafood from Jakarta Bay. However, several limitations should be considered. First, the number of specimens analysed varied among species, with relatively small sample sizes for some species limiting robust species-specific statistical analyses. Further studies with larger sample sizes are needed. Second, seafood samples were collected from three sampling locations around Jakarta Bay to represent commercially available seafood, but the study was not designed to evaluate spatial variation in Hg contamination. Future studies incorporating spatially explicit sampling are needed to characterize the spatial distribution of Hg in Jakarta Bay. In addition, the CRM was analysed on three different days before sample analysis rather than at regular intervals throughout the sample runs; therefore, potential instrumental drift during the analytical sequence could not be fully assessed. Finally, the human health risk assessment was based on deterministic exposure scenarios using standard seafood consumption rates and body weights, which may not fully capture variability in dietary habits among different population groups. Future studies applying probabilistic risk assessment together with expanded spatial monitoring would provide a more comprehensive evaluation of Hg exposure through seafood consumption.

4. Conclusions

This study represents one of the first integrated assessments of Hg speciation, accumulation patterns, and human health risk in commercially important fish and seafood from Jakarta Bay, Indonesia, offering new insights into Hg contamination and seafood-related exposure pathways in coastal ecosystems. Mercury concentration varied markedly among species, with Moses perch (Lutjanus russellii) exhibiting the highest THg and OHg concentrations and representing the species exceeding international and Indonesian food safety guidelines. OHg/THg ratios revealed distinct patterns of Hg speciation among aquatic organisms, highlighting the value of Hg speciation for interpreting Hg bioaccumulation beyond THg measurements alone. Although most seafood species posed negligible non-carcinogenic health risks, elevated hazard quotient values observed for predatory fish, particularly among children, indicate that sensitive population groups may require targeted consumption guidance.
Overall, integrating Hg speciation with human health risk assessment provides a more comprehensive evaluation of seafood safety than reliance on THg alone. These findings establish important baseline data for commercially seafood from Jakarta Bay and support the development of species-specific seafood consumption advisories, long-term Hg monitoring programs, and evidence-based risk management strategies to protect both ecosystem integrity and public health in Indonesia.

Supplementary Materials

The following supporting information can be downloaded at: https://www.mdpi.com/article/10.3390/environments13090482/s1, Table S1. Biometric characteristics and mercury concentrations of fish and invertebrates collected from Jakarta Bay.

Author Contributions

Conceptualization, formal analysis, data curation, methodology, writing—original draft, and writing—review, S.S.; data curation, methodology, writing—original draft, writing—review, T.G., M.B., F.S.S., M.I.S., E.M.M. and T.A. (Tia Agustiani); visualization, writing—review and editing, R.H. and E.S.; supervision, conceptualization, writing—review, editing, and funding acquisition, T.A. (Tetsuro Agusa), J.K., Y.A. and A.S. All authors have read and agreed to the published version of the manuscript.

Funding

This study was supported by the International Postgraduate Scholarship for Mercury Research of the Kumamoto Prefecture Government, Indonesia Endowment Fund for Education Agency (LPDP) Grant, implemented by the Research and Innovation Scheme for Advanced Indonesia (RIIM EKSPEDISI): B-1106/II.7.5/FR.06/3/2024 and B-1680/III.4/H.K.01.00/3/2024, and the Research Center of Environmental and Clean Technology, Indonesian National Research & Innovation Agency (BRIN).

Institutional Review Board Statement

No live animals were captured, handled, treated, or experimentally manipulated during the study; therefore, ethical review and approval were not required. Fish and seafood specimens were purchased from local markets and fishermen and were already dead when obtained by the researchers. No animals were collected or sacrificed specifically for this study. Only muscle tissues from the purchased specimens were used for chemical analysis.

Data Availability Statement

The original contributions presented in this study are included in the article/Supplementary Material. Further inquiries can be directed to the corresponding author.

Acknowledgments

The authors would like to acknowledge the support and commitment of the Kumamoto Prefecture Government, the Prefectural University of Kumamoto, and the National Research and Innovation Agency (BRIN) of the Republic of Indonesia to this study.

Conflicts of Interest

The authors declare no conflicts of interest. The funders had no role in the design of the study; in the collection, analyses, or interpretation of data; in the writing of the manu-script; or in the decision to publish the results.

References

  1. World Health Organization (WHO). Exposure to Mercury: A Major Public Health Concern, 2nd ed; World Health Organization: Geneva, Switzerland, 2021. [Google Scholar]
  2. Zhao, W.; Gan, R.; Xian, B.; Wu, T.; Wu, G.; Huang, S.; Wang, R.; Liu, Z.; Zhang, Q.; Bai, S.; et al. Overview of Methylation and Demethylation Mechanisms and Influencing Factors of Mercury in Water. Toxics 2024, 12, 715. [Google Scholar] [CrossRef] [Scilit] [PubMed]
  3. Luo, H.; Cheng, Q.; He, D.; Sun, J.; Li, J.; Pan, X. Recent Advances in Microbial Mercury Methylation: A Review on Methylation Habitat, Methylator, Mechanism, and Influencing Factor. Process Saf. Environ. Prot. 2023, 170, 286–296. [Google Scholar] [CrossRef] [Scilit]
  4. Peng, X.; Yang, Y.; Yang, S.; Li, L.; Song, L. Recent Advance of Microbial Mercury Methylation in the Environment. Appl. Microbiol. Biotechnol. 2024, 108, 235. [Google Scholar] [CrossRef] [Scilit] [PubMed]
  5. International Programme on Chemical Safety. Methylmercury—Environmental Health Criteria 101; World Health Organization: Geneva, Switzerland, 1990. [Google Scholar]
  6. Zhao, S.; Pudasainee, D.; Duan, Y.; Gupta, R.; Liu, M.; Lu, J. A Review on Mercury in Coal Combustion Process: Content and Occurrence Forms in Coal, Transformation, Sampling Methods, Emission and Control Technologies. Prog. Energy Combust. Sci. 2019, 73, 26–64. [Google Scholar] [CrossRef] [Scilit]
  7. Yu, C.; Peng, M.; Wang, X.; Pan, X. Photochemical Demethylation of Methylmercury (MeHg) in Aquatic Systems: A Review of MeHg Species, Mechanisms, and Influencing Factors. Environ. Pollut. 2024, 344, 123297. [Google Scholar] [CrossRef] [Scilit] [PubMed]
  8. World Health Organization. Mercury and Health. Available online: https://www.who.int/news-room/fact-sheets/detail/mercury-and-health?utm_source=chatgpt.com (accessed on 5 February 2026).
  9. United States Environmental Protection Agency. Health Effects of Exposures to Mercury. Available online: https://www.epa.gov/mercury/health-effects-exposures-mercury?utm_source=chatgpt.com (accessed on 5 February 2026).
  10. Chiang, G.; Kidd, K.A.; Díaz-Jaramillo, M.; Espejo, W.; Bahamonde, P.; O’Driscoll, N.J.; Munkittrick, K.R. Methylmercury Biomagnification in Coastal Aquatic Food Webs from Western Patagonia and Western Antarctic Peninsula. Chemosphere 2021, 262, 128360. [Google Scholar] [CrossRef] [Scilit] [PubMed]
  11. Harding, G.; Dalziel, J.; Vass, P. Bioaccumulation of Methylmercury within the Marine Food Web of the Outer Bay of Fundy, Gulf of Maine. PLoS ONE 2018, 13, e0197220. [Google Scholar] [CrossRef] [Scilit] [PubMed]
  12. Lavoie, R.A.; Jardine, T.D.; Chumchal, M.M.; Kidd, K.A.; Campbell, L.M. Biomagnification of Mercury in Aquatic Food Webs: A Worldwide Meta-Analysis. Environ. Sci. Technol. 2013, 47, 13385–13394. [Google Scholar] [CrossRef] [Scilit] [PubMed]
  13. Kidd, K.; Clayden, M.; Jardine, T. Bioaccumulation and Biomagnification of Mercury through Food Webs. In Environmental Chemistry and Toxicology of Mercury; Wiley: Hoboken, NJ, USA, 2011; pp. 453–499. [Google Scholar]
  14. Ullrich, S.M.; Tanton, T.W.; Abdrashitova, S.A. Mercury in the Aquatic Environment: A Review of Factors Affecting Methylation. Crit. Rev. Environ. Sci. Technol. 2001, 31, 241–293. [Google Scholar] [CrossRef] [Scilit]
  15. Borgå, K.; Kidd, K.A.; Muir, D.C.; Berglund, O.; Conder, J.M.; Gobas, F.A.; Kucklick, J.; Malm, O.; Powell, D.E. Trophic Magnification Factors: Considerations of Ecology, Ecosystems, and Study Design. Integr. Environ. Assess. Manag. 2012, 8, 64–84. [Google Scholar] [CrossRef] [Scilit] [PubMed]
  16. The Food and Agriculture Organization. The State of World Fisheries and Aquaculture 2022: Towards Blue Transformation; Food and Agriculture Organization: Rome, Italy, 2022. [Google Scholar]
  17. Ministry of Marine Affairs and Fisheries of Indonesia (KKP). Angka Konsumsi Ikan. Available online: https://portaldata.kkp.go.id/portals/data-statistik/aki/tbl-dinamis (accessed on 5 February 2026).
  18. Arifin, Z.; Puspitasari, R.; Miyazaki, N. Heavy Metal Contamination in Indonesian Coastal Marine Ecosystems: A Historical Perspective. Coast. Mar. Sci. 2012, 35, 227–233. [Google Scholar] [CrossRef]
  19. Williams, T.M.; Rees, J.G.; Setiapermana, D. Metals and Trace Organic Compounds in Sediments and Waters of Jakarta Bay and the Pulau Seribu Complex, Indonesia. Mar. Pollut. Bull. 2000, 40, 277–285. [Google Scholar] [CrossRef] [Scilit]
  20. Rochyatun, E.; Rozak, A. Pemantauan Kadar Logam Berat Dalam Sedimen di Perairan Teluk Jakarta. Makara Sci. Ser. 2010, 11, 28–36. [Google Scholar] [CrossRef] [Scilit]
  21. Siregar, T.H.; Priyanto, N.; Putri, A.K.; Rachmawati, N.; Triwibowo, R.; Dsikowitzky, L.; Schwarzbauer, J. Spatial Distribution and Seasonal Variation of the Trace Hazardous Element Contamination in Jakarta Bay, Indonesia. Mar. Pollut. Bull. 2016, 110, 634–646. [Google Scholar] [CrossRef] [Scilit] [PubMed]
  22. Putri, L.S.E.; Prasetyo, A.D.; Arifin, Z. Green Mussel (Perna viridis L.) as Bioindicator of Heavy Metals Pollution at Kamal Estuary, Jakarta Bay, Indonesia. J. Environ. Res. Dev. 2012, 6, 389–396. [Google Scholar]
  23. United States Environmental Protection Agency (USEPA). Risk Assessment Guidance for Superfund: Human Health Evaluation Manual (Part A); Office of Emergency and Remedial Response, U.S. Environmental Protection Agency: Washington, DC, USA, 1989.
  24. The Food and Agriculture Organization, World Health Organization. Report of the Joint FAO/WHO Expert Consultation on the Risks and Benefits of Fish Consumption; Food and Agriculture Organization of the United Nations World Health Organization: Rome, Italy, 2011. [Google Scholar]
  25. Suratno; Puspitasari, R.; Rositasari, R.; Oktaviyani, S. Total Mercury of Marine Fishes in Natuna Islands Area, Indonesia: Risk Assessment for Human Consumption. IOP Conf. Ser. Earth Environ. Sci. 2019, 277, 012025. [Google Scholar] [CrossRef] [Scilit]
  26. Bentley, K.; Soebandrio, A. Arsenic and Mercury Concentrations in Marine Fish Sourced from Local Fishermen and Fish Markets in Mine-Impacted Communities in Ratatotok Sub-District, North Sulawesi, Indonesia. Mar. Pollut. Bull. 2017, 120, 75–81. [Google Scholar] [CrossRef] [Scilit] [PubMed]
  27. Koesmawati, T.A.; Arifin, Z. Mercury and Arsenic Content in Seafood Samples from the Jakarta Fishing Port, Indonesia. Mar. Res. Indones. 2015, 40, 9–16. [Google Scholar] [CrossRef] [Scilit]
  28. Soegianto, A.; Moehammadi, N.; Irawan, B.; Affandi, M.; Hamami. Mercury Concentrations in Edible Species Harvested from Gresik Coast, Indonesia and Its Health Risk Assessment. Cah. Biol. Mar. 2010, 51, 1–8. [Google Scholar]
  29. Regional Environmental Management Agency of DKI Jakarta Province. State of the Local Environment Report of DKI Jakarta Province 2013; Government of DKI Jakarta Province: Jakarta, Indonesia, 2013.
  30. Hosono, T.; Su, C.-C.; Delinom, R.; Umezawa, Y.; Toyota, T.; Kaneko, S.; Taniguchi, M. Decline in Heavy Metal Contamination in Marine Sediments in Jakarta Bay, Indonesia Due to Increasing Environmental Regulations. Estuar. Coast. Shelf Sci. 2011, 92, 297–306. [Google Scholar] [CrossRef] [Scilit]
  31. Sindern, S.; Tremöhlen, M.; Dsikowitzky, L.; Gronen, L.; Schwarzbauer, J.; Siregar, T.H.; Ariyani, F.; Irianto, H.E. Heavy Metals in River and Coast Sediments of the Jakarta Bay Region (Indonesia)—Geogenic versus Anthropogenic Sources. Mar. Pollut. Bull. 2016, 110, 624–633. [Google Scholar] [CrossRef] [Scilit] [PubMed]
  32. Edward, E.; Triandiza, T.; Rajab, A.W.; Dody, S.; Rugebregt, M.; Kusnadi, A.; Opier, R. Evaluation of Sediment Quality Based on the Concentration of Heavy Metals Hg, Pb, Cd, Cu, Zn, and Ni in Jakarta Bay Using the Index Analysis Approach. In Geography, Earth Science and Environment: Research Highlights Vol. 6; BP International: Kolkata, India, 2025; pp. 1–16. [Google Scholar]
  33. Yoshimoto, K.; Anh, H.T.V.; Yamamoto, A.; Koriyama, C.; Ishibashi, Y.; Tabata, M.; Nakano, A.; Yamamoto, M. Simple Analysis of Total Mercury and Methylmercury in Seafood Using Heating Vaporization Atomic Absorption Spectrometry. J. Toxicol. Sci. 2016, 41, 489–500. [Google Scholar] [CrossRef] [Scilit] [PubMed]
  34. Bloom, N.S. On the Chemical Form of Mercury in Edible Fish and Marine Invertebrate Tissue. Can. J. Fish. Aquat. Sci. 1992, 49, 1010–1017. [Google Scholar] [CrossRef] [Scilit]
  35. de Paiva, E.L.; Milani, R.F.; Boer, B.S.; Quintaes, K.D.; Morgano, M.A. Methylmercury in Fish Species Used in Preparing Sashimi: A Case Study in Brazil. Food Control 2017, 80, 104–112. [Google Scholar] [CrossRef] [Scilit]
  36. U.S. Environmental Protection Agency. Exposure Factors Handbook: 2011 Edition; U.S. Environmental Protection Agency: Washington, DC, USA, 2011.
  37. Statistics Indonesia (BPS). Average Per Capita Consumption Per Week of Several Kinds of Essential Foodstuffs. Available online: https://www.bps.go.id/id/statistics-table/1/MjMxNiMx/rata-rata-konsumsi-per-kapita-seminggu-beberapa-macam-bahan-makanan-penting--2015-2024.html (accessed on 23 July 2026).
  38. Statistics Indonesia (BPS). Average Weekly Per Capita Consumption in Urban and Rural Areas by Food Commodity and Per Capita Weekly Expenditure Group (Commodity Unit). 2021. Available online: https://www.bps.go.id/id/statistics-table/2/MjA5MCMy/rata-rata-konsumsi-perkapita-seminggu-di-daerah-perkotaan-dan-pedesaan-menurut-komoditi-makanan-dan-golongan-pengeluaran-per-kapita-seminggu.html (accessed on 23 July 2026).
  39. Ministry of Health of the Republic of Indonesia. Guidelines for Environmental Health Risk Analysis; Ministry of Health of the Republic of Indonesia: Jakarta, Indonesia, 2012.
  40. U.S. Environmental Protection Agency. Chemical Assessment Summary: Methylmercury (MeHg); CASRN 22967-92-6; U.S. Environmental Protection Agency: Washington, DC, USA, 2001.
  41. R Core Team. R: A Language and Environment for Statistical Computing; R Foundation for Statistical Computing: Vienna, Austria, 2026. [Google Scholar]
  42. Burger, J.; Gochfeld, M. Risk to Consumers from Mercury in Pacific Cod (Gadus macrocephalus) from the Aleutians: Fish Age and Size Effects. Environ. Res. 2007, 105, 276–284. [Google Scholar] [CrossRef] [Scilit] [PubMed]
  43. Chumchal, M.M.; Hambright, K.D. Ecological Factors Regulating Mercury Contamination of Fish from Caddo Lake, Texas, USA. Environ. Toxicol. Chem. 2009, 28, 962–972. [Google Scholar] [CrossRef] [Scilit] [PubMed]
  44. CXS 193-1995; General Standard for Contaminants and Toxins in Food and Feed. Codex Alimentarius Commission: Rome, Italy, 2023.
  45. European Commission. Commission Regulation (EU) 2023/915 of 25 April 2023 on Maximum Levels for Certain Contaminants in Food and Repealing Regulation (EC) No 1881/2006; Publications Office of the European Union: Luxembourg, 2023; pp. 103–157. [Google Scholar]
  46. Indonesian National Agency of Drug and Food Control. Regulation of the National Agency of Drug and Food Control No. 9 of 2022 on Requirements for Heavy Metal Contamination in Processed Foods; Badan Pengawas Obat dan Makanan: Jakarta, Indonesia, 2022.
  47. Ministry of Health, Labour and Welfare. Standards for Foods and Food Additives: Maximum Levels for Mercury in Fish and Fishery Products; Ministry of Health, Labour and Welfare: Tokyo, Japan, 2020.
  48. SNI 7387:2009; Maximum Limits of Heavy Metal Contamination in Food. Badan Standardisasi Nasional (BSN): Jakarta, Indonesia, 2009.
  49. Campbell, L.M.; Norstrom, R.J.; Hobson, K.A.; Muir, D.C.G.; Backus, S.; Fisk, A.T. Mercury and Other Trace Elements in a Pelagic Arctic Marine Food Web (Northwater Polynya, Baffin Bay). Sci. Total Environ. 2005, 351–352, 247–263. [Google Scholar] [CrossRef] [Scilit] [PubMed]
  50. Watras, C.J.; Back, R.C.; Halvorsen, S.; Hudson, R.J.M.; Morrison, K.A.; Wente, S.P. Bioaccumulation of Mercury in Pelagic Freshwater Food Webs. Sci. Total Environ. 1998, 219, 183–208. [Google Scholar] [CrossRef] [Scilit] [PubMed]
  51. Agusa, T.; Kunito, T.; Sudaryanto, A.; Monirith, I.; Kan-Atireklap, S.; Iwata, H.; Ismail, A.; Sanguansin, J.; Muchtar, M.; Tana, T.S.; et al. Exposure Assessment for Trace Elements from Consumption of Marine Fish in Southeast Asia. Environ. Pollut. 2007, 145, 766–777. [Google Scholar] [CrossRef] [Scilit] [PubMed]
  52. Kehrig, H.A.; Seixas, T.G.; Malm, O.; Di Beneditto, A.P.M.; Rezende, C.E. Mercury and Selenium Biomagnification in a Brazilian Coastal Food Web Using Nitrogen Stable Isotope Analysis: A Case Study in an Area under the Influence of the Paraiba Do Sul River Plume. Mar. Pollut. Bull. 2013, 75, 283–290. [Google Scholar] [CrossRef] [Scilit] [PubMed]
  53. Córdoba-Tovar, L.; Marrugo-Negrete, J.; Barón, P.R.; Díez, S. Drivers of Biomagnification of Hg, As and Se in Aquatic Food Webs: A Review. Environ. Res. 2022, 204, 112226. [Google Scholar] [CrossRef] [Scilit] [PubMed]
  54. Pan, K.; Wang, W.-X. Mercury Accumulation in Marine Bivalves: Influences of Biodynamics and Feeding Niche. Environ. Pollut. 2011, 159, 2500–2506. [Google Scholar] [CrossRef] [Scilit] [PubMed]
  55. Karimi, R.; Frisk, M.; Fisher, N.S. Contrasting Food Web Factor and Body Size Relationships with Hg and Se Concentrations in Marine Biota. PLoS ONE 2013, 8, e74695. [Google Scholar] [CrossRef] [Scilit] [PubMed]
  56. Eagles-Smith, C.A.; Silbergeld, E.K.; Basu, N.; Bustamante, P.; Diaz-Barriga, F.; Hopkins, W.A.; Kidd, K.A.; Nyland, J.F. Modulators of Mercury Risk to Wildlife and Humans in the Context of Rapid Global Change. Ambio 2018, 47, 170–197. [Google Scholar] [CrossRef] [Scilit] [PubMed]
  57. Jinadasa, B.K.K.K.; Jayasinghe, G.D.T.M.; Pohl, P.; Fowler, S.W. Mitigating the Impact of Mercury Contaminants in Fish and Other Seafood—A Review. Mar. Pollut. Bull. 2021, 171, 112710. [Google Scholar] [CrossRef] [Scilit] [PubMed]
  58. Mason, R.P.; Choi, A.L.; Fitzgerald, W.F.; Hammerschmidt, C.R.; Lamborg, C.H.; Soerensen, A.L.; Sunderland, E.M. Mercury Biogeochemical Cycling in the Ocean and Policy Implications. Environ. Res. 2012, 119, 101–117. [Google Scholar] [CrossRef] [Scilit] [PubMed]
  59. Gilby, B.L.; Goodridge Gaines, L.A.; Henderson, C.J.; Borland, H.P.; Coates-Marnane, J.; Connolly, R.M.; Maxwell, P.S.; Mosman, J.D.; Olds, A.D.; Perry, H.J.; et al. Optimizing Landscape-Scale Coastal Monitoring and Reporting through Predicted versus Observed Animal Abundance Models. ICES J. Mar. Sci. 2024, 81, 1988–2003. [Google Scholar] [CrossRef] [Scilit]
  60. Jeong, H.; Ali, W.; Zinck, P.; Souissi, S.; Lee, J.-S. Toxicity of Methylmercury in Aquatic Organisms and Interaction with Environmental Factors and Coexisting Pollutants: A Review. Sci. Total Environ. 2024, 943, 173574. [Google Scholar] [CrossRef] [Scilit] [PubMed]
  61. Driscoll, C.T.; Mason, R.P.; Chan, H.M.; Jacob, D.J.; Pirrone, N. Mercury as a Global Pollutant: Sources, Pathways, and Effects. Environ. Sci. Technol. 2013, 47, 4967–4983. [Google Scholar] [CrossRef] [Scilit] [PubMed]
  62. United Nations Environment Programme. Global Mercury Assessment 2018; UN Environment Programme, Chemicals and Health Branch: Geneva, Switzerland, 2019. [Google Scholar]
  63. United States Environmental Protection Agency. Water Quality Criterion for the Protection of Human Health: Methylmercury; U.S. Environmental Protection Agency (EPA), Office of Water, Office of Science and Technology: Washington, DC, USA, 2001.
  64. Sunderland, E.M.; Krabbenhoft, D.P.; Moreau, J.W.; Strode, S.A.; Landing, W.M. Mercury Sources, Distribution, and Bioavailability in the North Pacific Ocean: Insights from Data and Models. Glob. Biogeochem. Cycles 2009, 23, GB2010. [Google Scholar] [CrossRef] [Scilit]
  65. Le Bourg, B.; Kiszka, J.J.; Bustamante, P.; Heithaus, M.R.; Jaquemet, S.; Humber, F. Effect of Body Length, Trophic Position and Habitat Use on Mercury Concentrations of Sharks from Contrasted Ecosystems in the Southwestern Indian Ocean. Environ. Res. 2019, 169, 387–395. [Google Scholar] [CrossRef] [Scilit] [PubMed]
  66. Ahmad, N.I.; Noh, M.F.M.; Mahiyuddin, W.R.W.; Jaafar, H.; Ishak, I.; Azmi, W.N.F.W.; Veloo, Y.; Hairi, M.H. Mercury Levels of Marine Fish Commonly Consumed in Peninsular Malaysia. Environ. Sci. Pollut. Res. 2015, 22, 3672–3686. [Google Scholar] [CrossRef] [Scilit] [PubMed]
  67. Jinadasa, B.K.K.K.; Chathurika, G.S.; Jayaweera, C.D.; Jayasinghe, G.D.T.M. Mercury and Cadmium in Swordfish and Yellowfin Tuna and Health Risk Assessment for Sri Lankan Consumers. Food Addit. Contam. Part B 2019, 12, 75–80. [Google Scholar] [CrossRef] [Scilit] [PubMed]
  68. Barokah, S.P.G.R.; Dwiyitno, D.; Nugroho, I. Kontaminasi Logam Berat (HG, PB, Dan CD) Dan Batas Aman Konsumsi Kerang Hijau (Perna Virdis) Dari Perairan Teluk Jakarta Di Musim Penghujan. J. Pascapanen Bioteknol. Kelaut. Perikan. 2019, 14, 95–106. [Google Scholar] [CrossRef] [Scilit]
  69. Andayani, A.; Koesharyani, I.; Fayumi, U.; Rasidi, R.; Sugama, K. Akumulasi Logam Berat Pada Kerang Hijau Di Perairan Pesisir Jawa. OLDI 2020, 5, 135–144. [Google Scholar] [CrossRef] [Scilit]
  70. Kehrig, H.A.; Costa, M.; Moreira, I.; Malm, O. Methylmercury and Total Mercury in Estuarine Organisms from Rio de Janeiro, Brazil. Environ. Sci. Pollut. Res. 2001, 8, 275–279. [Google Scholar] [CrossRef] [Scilit] [PubMed]
  71. Kehrig, H.A.; Costa, M.; Moreira, I.; Malm, O. Total and Methylmercury in a Brazilian Estuary, Rio de Janeiro. Mar. Pollut. Bull. 2002, 44, 1018–1023. [Google Scholar] [CrossRef] [Scilit] [PubMed]
  72. Saleh, I.; Syamsir, S.; Pramaningsih, V.; Hansen, H. The Use of Green Mussel as Bioindicator of Heavy Metal Pollution in Indonesia: A Review. Environ. Anal. Health Toxicol. 2021, 36, e2021026. [Google Scholar] [CrossRef] [Scilit] [PubMed]
  73. EFSA Panel on Contaminants in the Food Chain (CONTAM). Scientific Opinion on the Risk for Public Health Related to the Presence of Mercury and Methylmercury in Food. EFSA J. 2012, 10, 2985. [Google Scholar] [CrossRef] [Scilit]
  74. U.S. Environmental Protection Agency. Integrated Risk Information System (IRIS): Methylmercury; CASRN 22967-92-6; U.S. Environmental Protection Agency: Washington, DC, USA, 2001.
  75. Ralston, N.V.C.; Blackwell, J.L.; Raymond, L.J. Importance of Molar Ratios in Selenium-Dependent Protection Against Methylmercury Toxicity. Biol. Trace Elem. Res. 2007, 119, 255–268. [Google Scholar] [CrossRef] [Scilit] [PubMed]
  76. Ralston, N.V.C.; Raymond, L.J. Dietary Selenium’s Protective Effects against Methylmercury Toxicity. Toxicology 2010, 278, 112–123. [Google Scholar] [CrossRef] [Scilit] [PubMed]
  77. Ralston, N.V.C.; Raymond, L.J. Mercury’s Neurotoxicity Is Charact. by Its Disruption of Selenium Biochemistry. Biochim. Biophys. Acta (BBA) Gen. Subj. 2018, 1862, 2405–2416. [Google Scholar] [CrossRef] [Scilit] [PubMed]
  78. Ralston, N.V.C.; Kaneko, J.J.; Raymond, L.J. Selenium Health Benefit Values Provide a Reliable Index of Seafood Benefits vs. Risks. J. Trace Elem. Med. Biol. 2019, 55, 50–57. [Google Scholar] [CrossRef] [Scilit] [PubMed]
Figure 1. Sampling locations of fish and seafood in Jakarta Bay.
Environments 13 00482 g001
Figure 2. Total Hg concentration in fish and seafood. Boxes display the inter quartile range (IQR), with median values shown by horizontal lines and mean values marked by × symbols. Circles indicate individual observations. The y-axis is presented on a logarithmic scale.
Environments 13 00482 g002
Figure 3. Organic Hg concentration in fish and seafood. Boxes display the inter quartile range (IQR), with median values shown by horizontal lines and mean values marked by × symbols. Circles indicate individual observations. The y-axis is presented on a logarithmic scale.
Environments 13 00482 g003
Figure 4. OHg/THg ratio across marine species. Boxes display the inter quartile range (IQR), with median values shown by horizontal lines and mean values marked by × symbols. Circles indicate individual observations.
Environments 13 00482 g004
Figure 5. Hazard quotient (HQ) value for OHg associated with the consumption of fish and seafood by children and adults. The red line represents the risk threshold of HQ.
Environments 13 00482 g005
Table 1. Collected fish and seafood from Jakarta Bay.
Common NameScientific NameSample Size (n)
Fish
     Black pomfretParastromateus niger3
     Bigeye tunaThunnus obesus3
     Moses perchLutjanus russellii3
     Keeled needlefishPlatybelone platyura3
     Oxeye scadSelar boops23
     MilkfishChanos chanos3
     Gizzard shadAnodontostoma chacunda8
     Indian anchovyStolephorus indicus3
     Common ponyfishLeiognathus equulus3
     Telkara perchletAmbassis vachelli3
     Banded scadCaranx para2
Cephalopods
     CuttlefishSepia sp.7
Crustaceans
     Green tiger prawnPenaeus semisulcatus3
Molluscs
     Green musselPerna viridis41
     Blood cockleAnadara granosa3
Table 2. Comparison of THg, MeHg, and MeHg/THg concentrations in fish and seafood from Indonesia and selected developing countries.
CountrySampling AreaSeafood CategoryNo. SpeciesTHg
(mg/kg dw)
MeHg
(mg/kg dw)
MeHg/THg (%)References
IndonesiaJakarta BayFish, crustaceans, cephalopods, bivalves150.032–3.820.014–2.95 **26.5–89.4 **Present study
Gresik CoastFish, shrimp7<0.6–0.204n.a.n.a.[28]
Jakarta Fishing PortTuna, marlin, mussel30.560–1.51n.a.n.a.[27]
Jakarta BayGreen mussel10.227–0.262n.a.n.a.[68]
East JavaGreen mussel111.7n.a.n.a.[69]
Jakarta BayUnknown (Sconberomorus sp.), Talang queenfish, White-spotted spinefoot30.110–0.470 n.a.n.a.[51]
MalaysiaPeninsular MalaysiaDemersal fish460.173–2.54n.a.n.a.[66]
Pelagic fish 0.055–2.14n.a.n.a.
SrilankaIndian OceanYellowfin tuna, swordfish2<70–1.42n.a.n.a.[57]
BrazilGuanabara BayCarnivorous fish, detritivorous fish, filter feeding bivalve 30.0508–0.658 *0.0317–0.642 *27–98 [70]
Guanabara BayCarnivorous fish, planktivorous fish, filter feeding bivalve 30.0508–0.658 *0.0317–0.643 *29–98[71]
n.a. = not available; *: conversion from ww to dw using 70% water content; **: OHg ≒ MeHg.
Disclaimer/Publisher’s Note: The statements, opinions and data contained in all publications are solely those of the individual author(s) and contributor(s) and not of MDPI and/or the editor(s). MDPI and/or the editor(s) disclaim responsibility for any injury to people or property resulting from any ideas, methods, instructions or products referred to in the content.