1. Introduction
Urbanization has transformed the way people live, with over half of the global population now residing in urban areas [
1]. In Europe, over 60% of people live in areas with insufficient green spaces, falling below the standards recommended by the World Health Organization (WHO) [
2]. There is growing recognition that green environments can improve health by reducing exposure to air pollution and contributing to the prevention of non-communicable diseases [
3]. Expanding green areas in urban settings could prevent up to 42,968 deaths annually, which represents 2.3% of all deaths from natural causes in Europe [
2].
In addition to preserving outdoor green spaces, integrating Nature-Based Solutions (NBS) into indoor environments has emerged as a promising strategy for promoting health. Indoor plants have been recognized as a cost-effective and sustainable intervention that may contribute to improved indoor environmental quality (IEQ) and create healthier environments [
4]. The European Commission defines NBS as cost-effective solutions inspired by and supported by nature, offering environmental, social, and economic benefits while addressing critical challenges such as air quality and climate resilience [
5].
Modern office buildings, in which Europeans spend an estimated 30% of their day [
6], are crucial environments for implementing NBS. Poor IEQ in office environments negatively impacts workers’ well-being, health, and productivity [
7]. While previous environmental intervention studies in office buildings have examined strategies for promoting healthy and comfortable workplaces [
8], there is still limited evidence on the effects of NBS, such as indoor plants, on workers’ outcomes. Emerging studies suggest that indoor plants may contribute to improved air quality by reducing pollutant levels, such as volatile organic compounds (VOC), and by regulating temperature and humidity [
9,
10]. This enhances thermal comfort and reduces exposure to air pollution. However, additional evidence suggests that this potential may be limited under real-world conditions [
11], with the benefits of indoor plants appearing to be more strongly associated with occupants’ outcomes.
Importantly, indoor plants may improve psychological and physiological outcomes. Research has linked their presence to reduced stress, anxiety, and chronic fatigue, as well as enhanced concentration, productivity, and cognitive performance [
12,
13]. Indoor plants have also been associated with more positive perceptions of the indoor environment, with occupants describing spaces as better decorated, cleaner, visually more comfortable, and cooler [
14]. Additionally, exposure to natural environments has also been associated with changes in the autonomic nervous system (ANS) activity, particularly parasympathetic activation and sympathetic stabilization [
15,
16]. Despite this evidence, existing randomized controlled trials (RCT) have limitations, including small sample sizes, short exposure periods, and reliance on simulated environments [
17,
18]. Moreover, despite the substantial body of research on individual IEQ factors, studies simultaneously evaluating multiple environmental conditions (air quality, ventilation, thermal, lighting, and acoustic conditions) and their effects on worker satisfaction, well-being, health, and productivity in actual office settings remain limited [
19].
This study aims to address existing gaps by conducting an RCT to assess the effects of integrating indoor plants into urban office environments. Specifically, the study will evaluate their impact on worker well-being, health, and productivity. Attention will be given to changes in ANS activity assessed through pupillometry, as this non-invasive method offers an objective measure of stress, fatigue, and workload.
2. Materials and Methods
2.1. Study Design
This study is part of a larger research initiative aimed at implementing an environmental intervention program in 30 modern offices in Porto, Northern Portugal, and assessing the effectiveness of tailored measures for improving IEQ and office workers’ outcomes, using an RCT. The offices were randomly allocated to either the intervention group or the control group by a researcher who was not involved in the study to guarantee the independence of the randomization process. A random number between 0 and 1 was assigned to each office using an Excel spreadsheet. The offices were subsequently ranked in ascending order based on these numbers; the first 15 offices were allocated to the intervention group, and the remaining 15 offices were allocated to the control group. The interventions were designed based on IEQ findings from a preliminary assessment of the offices assigned to the intervention group, focusing on low-cost and easy-to-implement solutions [
19].
The primary intervention identified was the introduction of indoor plants in 12 modern office spaces across five buildings in the intervention group. The intervention involved placing pots of plants from
Sansevieria trifasciata,
Dracaena fragrans, and
Chlorophytum comosum, previously investigated for their potential to improve indoor air quality (IAQ) [
9,
20].
Following established recommendations for air-purification effects, each pot, with an average height of 40 cm, was positioned at a density of one plant per 9 m
2 [
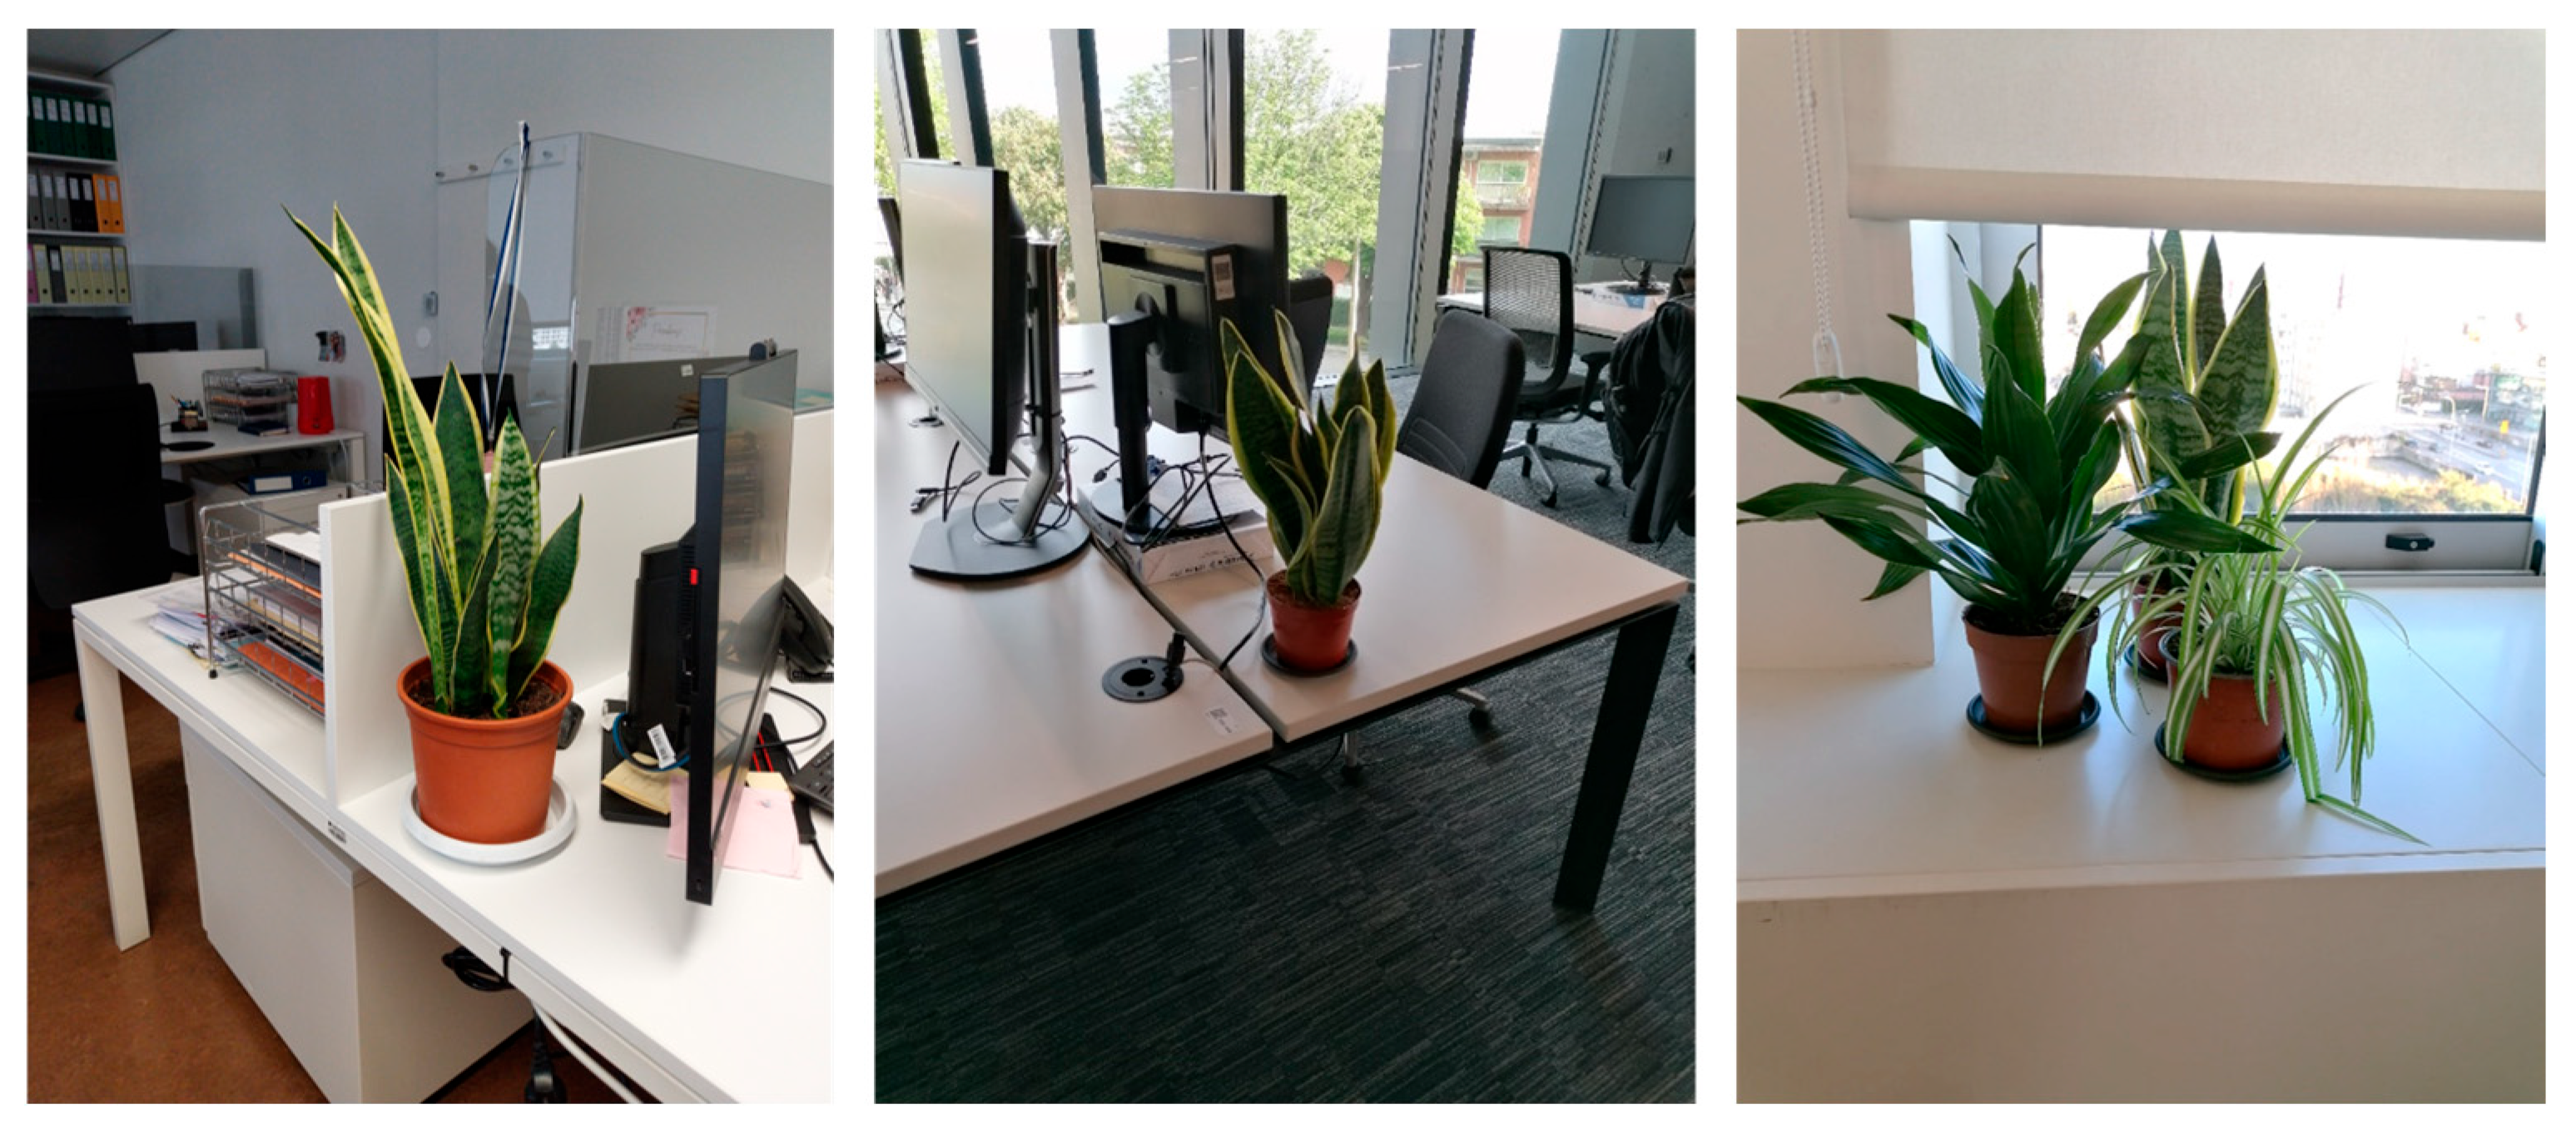
21]. The plants were strategically placed to ensure they were visible to workers, such as on desks, windowsills, or the floor. During the intervention period, researchers managed plant care, which included watering and monitoring for signs of disease.
Figure 1 presents examples of indoor plant placement within the intervention offices.
Eleven offices were assigned to the control group. These offices were located within the same five buildings as the intervention offices but did not receive the plant intervention. Overall, office floor area ranged from 35 to 150 m
2 in the intervention group and 70 to 150 m
2 in the control group. Offices accommodated, on average, 13 and 11 occupants, respectively, and were all equipped with HVAC systems for heating and cooling. Window-opening practices followed the occupants’ usual routines throughout the study period. Operable windows were present in 9 intervention offices and 9 control offices. More details of the offices’ characteristics are presented in
Table S1.
Assessments were conducted in offices from both the intervention and control groups at two time points: baseline (pre-intervention) and after 14 days of intervention (intervention phase). Each assessment campaign was carried out on a representative workday. IEQ conditions were measured during both assessment campaigns: IAQ parameters (particulate matter of less than 2.5 and 10 μm in diameter (PM
2.5 and PM
10), ultrafine particles (UFP) (less than 0.1 μm in diameter), carbon monoxide (CO), ozone (O
3), and volatile organic compounds (VOC)), ventilation (carbon dioxide (CO
2)) and thermal comfort (air temperature, relative humidity (RH), predicted mean vote (PMV), and predicted percentage of dissatisfied (PPD)), lighting (illuminance), and acoustic (mean and peak noise). Temperature, RH, CO
2, and CO levels were measured using IAQ-CALC monitors (model 7545, TSI, MN, USA), with accuracies of ±0.6 °C for temperature (0 to 60 °C), ±3.0% for RH (5 to 95%), ±50 ppm for CO
2 (0 to 5000 ppm), and ±3 ppm for CO (0 to 500 ppm). The sensors used were a non-dispersive infrared sensor for CO
2, an electrochemical sensor for CO, a thermistor for temperature, and a thin-film capacitive sensor for RH. PM
2.5 and PM
10 concentrations were obtained by 90° light scattering DustTrak DRX aerosol monitors (model 8533, TSI, USA) with a range of operation from 0.001 to 150 mg/m
3. Levels of UFP were determined using P-Trak portable condensation particle counters (model 8525, TSI, USA), which can count airborne particles ranging in size from 0.02 to 1 μm at a concentration range from 0 to 5 × 10
5 particles/cm
3. O
3 was measured with an Aeroqual instrument (Series 500 IAQ, Areoqual, Auckland, New Zealand) using a gas-sensitive semiconductor sensor (range: 0–0.15 ppm, accuracy: <±0.005 ppm). VOC concentrations were also monitored using an Aeroqual instrument, equipped with a photoionization detector (range: 0 to 30 ppm, accuracy: <±0.02 ppm + 10%). PMV and PPD indices were obtained using a thermal microclimate data logger (HD 32.1, Delta OHM, Caselle di Selvazzano, Italy). Illuminance was assessed with a lux meter (545, Testo, Titisee-Neustadt, Germany), measuring from 0 to 100,000 lux with an accuracy of ±3%. Noise levels were measured using a sound level meter (Solo, 01 dB, Limonest, France), equipped with an MCE 212 microphone, and operating over a range of 30–137 dB(A). The equipment was calibrated by an accredited external laboratory within the 12 months preceding the study. Detailed descriptions of the study design and IEQ assessment protocols are available elsewhere, as well as the effect of NBS on IEQ conditions [
22].
Office workers from both the intervention and control groups were invited to participate in the study. Each worker received an explanation of the study’s goals and procedures. To minimize potential biases, the eligibility criteria stipulated that participants must have worked in their current office for at least six months. Workers who agreed to participate completed structured questionnaires both before and after the intervention and underwent pupillometry assessments to evaluate ANS activity.
This study received approval from the Ethics Committee of the Faculty of Medicine of the University of Porto (72/CEFMUP/2022). Written informed consent was obtained from all participants. Each participant was assigned a unique identification code to ensure anonymity and to facilitate the association of collected data with the respective buildings and offices.
2.2. Questionnaire Survey
The pre-intervention questionnaire was designed to collect detailed information about the participants. This included socio-demographic characteristics, work-related details (e.g., job experience and time spent in the office), factors related to the family and home environment, well-being, lifestyle, health symptoms, and perceptions of IEQ and productivity. Mental well-being was assessed using the WHO-5 Well-Being Index [
23], a validated instrument that evaluates well-being over the previous two weeks. The WHO-5 consists of five items scored from 0 (at no time) to 5 (all of the time). The total score is multiplied by 4 to produce a percentage ranging from 0% to 100%, with higher scores indicating greater well-being.
Health-related data collected included diagnosed conditions such as asthma, hay fever, allergic rhinitis, eczema, skin problems, and food or environmental allergies. The questionnaires further collected information on self-reported symptoms experienced in the last 12 months, excluding those potentially attributable to COVID-19, flu, or cold. The symptoms assessed included constant sneezing, itchy or irritated eyes, dry cough, wheezing, shortness of breath, dry or itchy skin, and headaches [
24].
Perceptions of IAQ, lighting, noise, and general IEQ were measured using a 5-point Likert scale: very unpleasant, unpleasant, neutral, pleasant, and very pleasant. The ASHRAE 7-point thermal sensation scale was used to assess thermal comfort, ranging from cold, cool, slightly cool, neutral, slightly warm, warm, to hot [
25]. Productivity perceptions were evaluated using a 7-point Likert scale to determine the perceived influence of the workplace’s IEQ on productivity, indicating the perceived magnitude and direction of the influence: +30% or more, +20%, +10%, stable, −10%, −20%, and −30% or less.
The questionnaires used during the intervention phase were designed to assess changes in workers’ well-being, health, productivity, and perceptions of IEQ over the two weeks following the pre-intervention phase. To ensure consistency, the same WHO-5 Well-Being Index and IEQ perception questions were included. Participants were also asked to rate how their well-being, health, productivity, and IEQ had changed over the last two weeks, using a 5-point Likert scale: much worse, worse, no change, better, and much better. Additional questions explored whether the observed changes were related to the workplace and which specific IEQ factors (temperature, lighting, noise, IAQ, none, or other) were perceived to have contributed to these changes.
To account for external factors, participants reported the number of days they worked from home and the average time spent in the office during the intervention period. To enable longitudinal comparisons, participation in the intervention phase was restricted to workers who completed the pre-intervention questionnaire.
2.3. Pupillometry Assessments
In addition to self-reported data, participants underwent pupillometry-based assessments of ANS activity during both the pre-intervention and intervention phases. A portable infrared PLR-200 pupillometer (NeurOptics Inc., city, CA, USA) was used to objectively measure pupillary responses, providing insights into the activity of the parasympathetic and sympathetic branches of the ANS.
Pupillometry evaluations were conducted in a semi-dark environment to minimize external light interference and ensure consistency across measurements. Before each assessment, participants underwent a brief adaptation period to the lighting conditions. During data acquisition, participants stood upright with their back supported by a wall or another vertical surface and were instructed to fix their gaze on a target positioned directly ahead while minimizing head and eye movements. The right eye of each participant was assessed, as no side-to-side differences in pupillary response were expected. If blinking occurred, the measurement was repeated. The parameters evaluated included: pupil diameter (initial and peak constriction), which reflects baseline pupil size and response to light stimulation; average constriction velocity (ACV) and maximum constriction velocity (MCV), indicators of the speed of parasympathetic-mediated constriction; constriction amplitude, which represents the total change in pupil size during constriction, a measure of parasympathetic activity; average dilation velocity (ADV), reflects the rate of pupil dilation, commonly used as an indicator of sympathetic nervous system activity; and T75 (time to 75% recovery), the total time required for the pupil to recover 75% of its initial resting size after reaching peak constriction, another sympathetic activity indicator.
Parasympathetic activity was primarily assessed through parameters such as pupil diameter, ACV, MCV, and constriction amplitude. Sympathetic activity was evaluated using ADV and T75.
2.4. Data Management and Statistical Analysis
Data from the questionnaires were digitized, and all the variables were checked. For self-perception of IEQ factors, responses were rated as follows: 1 (very unpleasant), 2 (unpleasant), 3 (neutral), 4 (pleasant), and 5 (very pleasant). For thermal comfort, the following values were attributed to compare satisfaction rates: 1 (cold and hot), 3 (cool and warm), 5 (slightly cool and slightly warm), and 7 (neutral). Regarding changes during the intervention period: 1 (much worse), 2 (worse), 3 (no change), 4 (better), and 5 (much better).
Descriptive statistics were calculated, and statistical analysis was performed using IBM SPSS Statistics software (version 27), considering a statistical significance level of p < 0.05. The normality of the metric variables was tested using the Kolmogorov–Smirnov test. Non-parametric tests were applied for variables with a skewed distribution, while parametric tests were used for normally distributed variables. Differences in participants’ well-being, productivity, and IEQ satisfaction per study group were tested using the Mann–Whitney U test. The Spearman method was applied to explore associations in self-reported outcomes between study phases. Pupillometry differences between pre-intervention and intervention phases were tested with the Wilcoxon test and t-test. Differences among self-reported well-being, health, productivity, and IEQ satisfaction between study groups during the intervention period were investigated using the Mann–Whitney U test. Binary logistic and linear regression were performed to identify significant predictors, using a 95% confidence interval (CI). Confounders were controlled by adjusting models for variables such as age, gender, and smoking status.
3. Results
The study was conducted from 14 February 2023 to 21 March 2024 and engaged 130 workers across two phases, with 75 assigned to the intervention group and 55 to the control group. An overall participation rate of 67% was achieved. Pupillometry participation was lower, with 75% of the intervention group and 64% of the control group completing the assessments.
Table 1 summarizes the baseline characteristics of participants, including personal and employment data, family and home environments, lifestyle, health, and pre-intervention pupillometry parameters. Most participants held at least a master’s degree, had permanent contracts, and averaged over two years in their current office. They reported working approximately 8 h daily, totaling 40 h per week.
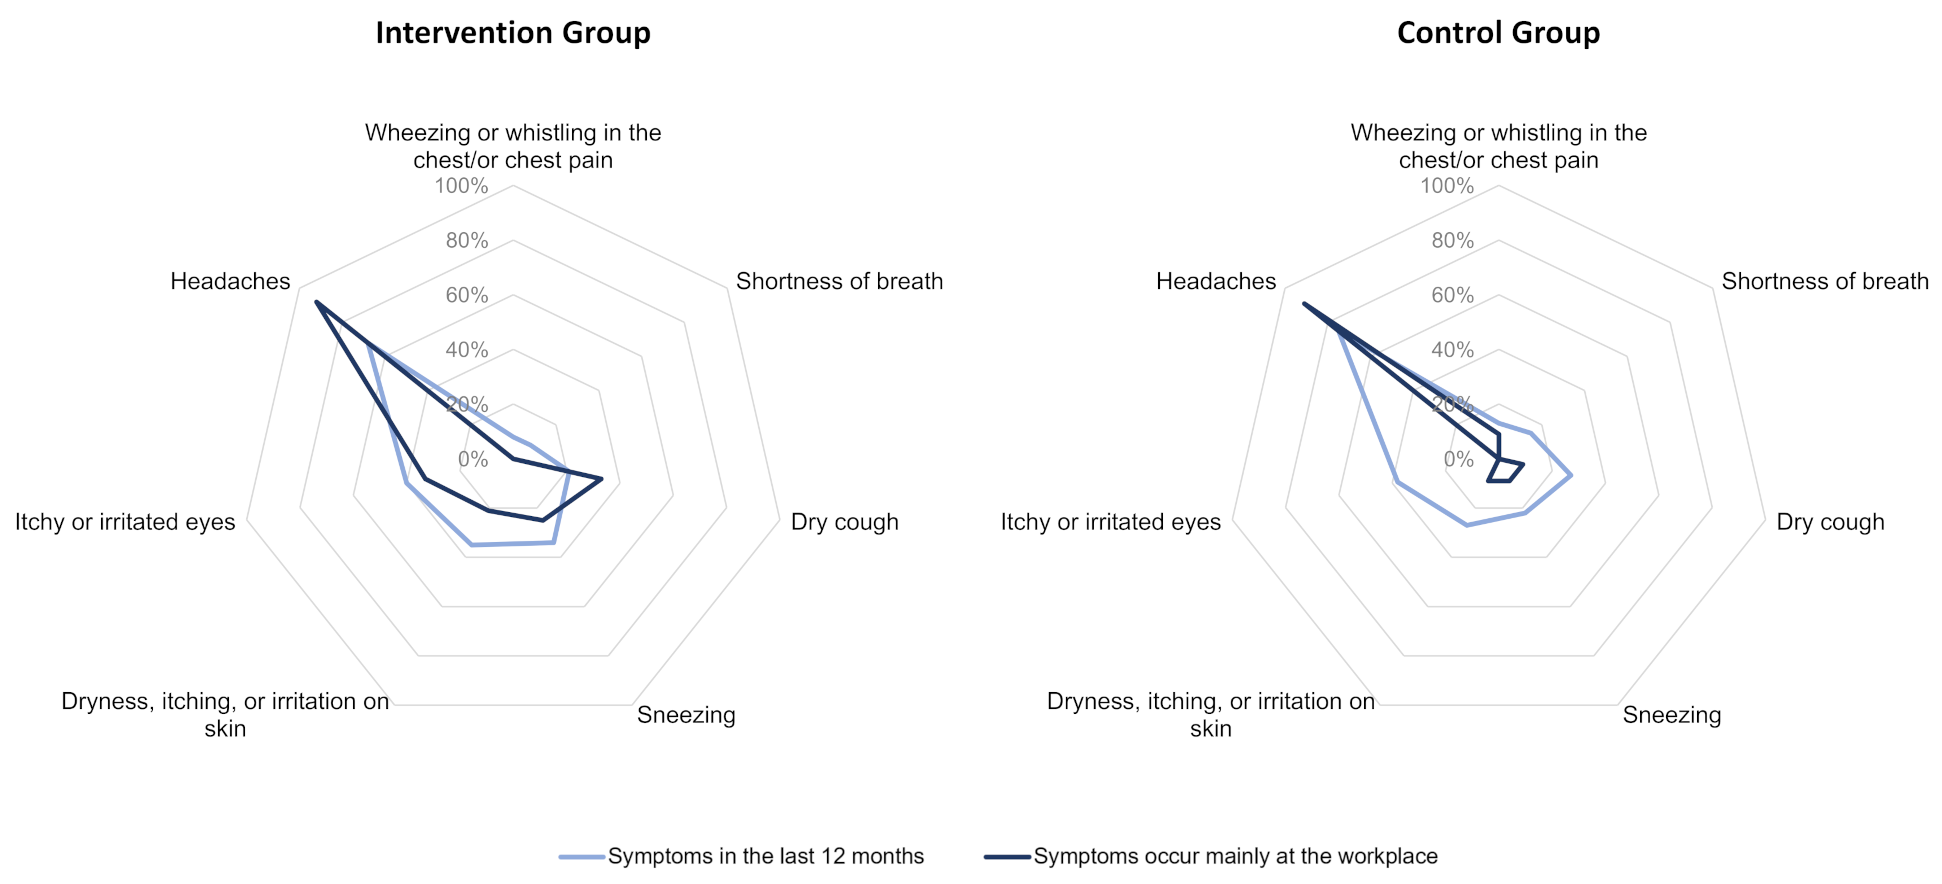
Figure 2 shows the prevalence of health symptoms in the past year, with headaches being the most common, followed by itchy or irritated eyes. Symptoms were reported as occurring in the office by 40% of participants in the intervention group and 22% of those in the control group. Among symptomatic participants, over 90% experienced headaches specifically in the office.
Both groups showed similar baseline well-being levels (WHO-5 scores: intervention 67.1%, control 67.2%; U = 1904, z = −0.020, p = 0.985). Participants reported that workplace environmental conditions positively influenced their productivity by an average of 12%, with no significant differences between groups (intervention 12.3%, control 11.6%; p > 0.05).
Baseline satisfaction with IEQ and specific environmental aspects is summarized in
Table 2. The results revealed similar satisfaction levels between groups. The exception was air temperature, rated significantly higher by the control group (mean 4.8 vs. 4.2;
U = 1492,
z = −2.211,
p = 0.027), corresponding to a thermal sensation ranging from cool to slightly cool/warm to slightly warm. Lighting received the highest satisfaction (pleasant), whereas noise received the lowest ratings (neutral). Lower satisfaction scores do not necessarily indicate non-compliance with comfort standards, as occupants’ perceptions are also influenced by individual preferences and expectations [
26]. Previous analyses identified associations between objective and subjective measures, namely higher lighting satisfaction with increasing illuminance levels and greater thermal satisfaction with lower PPD values [
27].
Office of the study spaces, detailed in
Table S1, indicated that the offices were located in urban areas with limited green spaces. Mean IEQ levels during both assessment phases were within national and international recommendations [
28,
29,
30,
31,
32,
33,
34], with descriptive statistics summarized in
Table S2 and further analyzed by Felgueiras et al. [
22]. Overall, no significant changes were observed in PM, VOC, and CO
2 levels between the pre-intervention and intervention phases. However, lower UFP and VOC concentrations were observed during the intervention phase in 58% and 88% of intervention offices, respectively.
A slight reduction in WHO-5 well-being indexes was observed in both groups during the intervention. Scores in the intervention group decreased from 67.1% to 63.2%, while the control group decreased from 67.2% to 62.9%. The reduction was less pronounced in the intervention group (3.9%) than in the control group (4.3%), though neither met the 10% threshold indicative of a significant change [
23]. Well-being scores were correlated across study phases in both groups (intervention:
rs = 0.658,
p < 0.001; control:
rs = 0.617,
p < 0.001). Overall, 32% of the intervention group reported a positive change in well-being compared to 20% in the control group (
Table 3). Among those reporting improved well-being in the intervention group, 58% attributed the change to IAQ, 42% to indoor temperature, and 13% to indoor plants.
A reduction in VOC levels during the intervention was significantly associated with an improvement in well-being in the intervention group (OR: 1.16, 95% CI 1.00–1.35, p = 0.048). The model explained 20.6% of the variance. No significant associations were found for the control group.
A greater proportion of participants in the intervention group reported improvements in their health compared with those in the control group (9% vs. 4%, respectively). However, no statistically significant differences were obtained between the groups (p > 0.05). Several pupillometry parameters showed significant changes in the intervention group. The initial pupil diameter decreased by 5% (from 5.7 mm to 5.4 mm, z = −3.585, p < 0.001), final pupil diameter by 8% (from 4.0 mm to 3.7 mm, z = −3.704, p < 0.001), and constriction amplitude increased by 4% (from 30.8% to 32.1%, t(49) = 2.139, p = 0.037). No significant changes were observed in other parasympathetic or sympathetic activity indicators. The control group showed no significant pupillometry changes. No significant associations were observed between changes in IEQ perceptions and pupillometry parameters in either study group.
There were no significant differences in changes in productivity between groups (
p > 0.05). Improvements were reported by 17% of the intervention group and 25% of the control group (
Table 3). Among participants reporting productivity improvements in the intervention group, 85% attributed these changes to IAQ and/or indoor plants. Conversely, in the control group, improvements were linked to changes in temperature (33%), lighting (25%), noise (25%), and non-IEQ factors (25%).
The PMV thermal comfort index approached the neutral range only in the control group (0.20 to 0.04 vs. 0.13 to 0.17 in the intervention group). Illuminance increased more in the control group (241 lux vs. 42 lux in task areas). Changes in air temperature were significant predictors of productivity improvements only in the control group (OR: 0.87, 95% CI 0.79–0.97, p = 0.014).
A greater proportion of participants in the intervention group reported improvements in overall IEQ conditions (39% vs. 15% in the control group;
Table 3). Perceived IEQ scores were significantly higher in the intervention group (3.4 vs. 3.1,
U = 1484.5,
z = −3.121,
p = 0.002). In the intervention group, 66% attributed IEQ improvements to IAQ and indoor plants, whereas 63% of the control group linked changes to thermal comfort.
Based on linear regression analyses conducted in the present study, reductions in target pollutants (CO2, PM2.5, PM10, and VOC) were not found to be significant predictors of IEQ satisfaction or productivity in either group (p > 0.05).
4. Discussion
This study investigated whether the use of indoor plants could improve workers’ well-being, health, productivity, and satisfaction with IEQ in urban offices. The study employed a robust design involving simultaneous assessments of IEQ conditions and office workers’ outcomes across two phases: pre-intervention and post-intervention evaluations. Two groups were analyzed: an intervention group with plants and a control group without. In addition to self-reported data on office workers’ well-being, health, productivity, and perceptions, this study also employed objective assessments using pupillometry. This non-invasive technique has not previously been explored in office settings, providing a unique opportunity to obtain objective indicators related to occupational risks, such as workload and stress.
Our findings suggest that introducing indoor plants in offices has a limited effect on well-being. A similar result was reported in the work by Hähn et al. [
35], who studied the effects of a mix of indoor plants in individual offices and break-out spaces (two potted plants per person), noting no significant changes in subjective well-being. However, according to some literature, indoor plants in offices have been associated with positive changes in people’s self-reported perceptions by reducing negative feelings while inducing positive moods [
14,
36]. In particular, in an RCT study, the subjective well-being associated with the WHO-5 index was significantly higher in the group subjected to contact with nature—such as walking, ecological photography, sketching butterflies, planting vegetables, drinking herbal tea, observing birds, and taking a nap in nature—compared to the control group [
37]. Furthermore, biophilic experiments in offices, which included visual (real indoor plants) and auditory (nature sounds) elements, have been shown to provide well-being benefits such as stress reduction measured through self-perception and skin conductance response [
38]. Nevertheless, in our study, reductions in VOC levels associated with the implementation of indoor plants were significantly correlated with enhanced self-perceived well-being. However, while indoor plants have been proposed as a strategy to improve IAQ, accumulating evidence suggests that their pollutant removal capacity may be generally limited under real building conditions, particularly in mechanically ventilated spaces where ventilation rates greatly exceed plant-mediated pollutant removal rates [
11]. Indeed, many phytoremediation studies have been conducted under highly controlled laboratory conditions, often focusing on the removal of individual chemical compounds, which may not accurately represent complex real-world indoor environments [
39]. Nevertheless, indoor plants may constitute a cost-effective NBS that can complement conventional ventilation systems in offices [
40]. While their direct contribution to pollutant removal may be modest under typical operating conditions, indoor plants may still provide environmental and occupant-related benefits.
Moreover, our findings suggest that indoor plants may influence ANS-related physiological responses among office workers. Overall, the findings suggest that having plants in offices may be associated with measurable changes in indicators of parasympathetic activity. The reduction in pupil diameter and increased constriction amplitude observed suggest enhanced parasympathetic activity, reflecting a shift toward a more relaxed physiological state. Indeed, improvement in relaxation is a recognized benefit of increased contact with green environments [
3,
18]. The findings from our study align with previous studies that used heart rate variability (low-frequency and high-frequency components) to assess parasympathetic and sympathetic activity in response to indoor plants. For example, the presence of the indoor plant
Epipremnum aureum in dental clinics was associated with a significant increase in parasympathetic activity of patients, suggesting a more relaxed physiological state in the presence of plants [
41]. Moreover, students who viewed photographs of urban green spaces exhibited improved recovery from stress, as evidenced by an improvement in parasympathetic activity observed through electrocardiogram and impedance cardiogram analyses [
42]. While no changes were observed for sympathetic activity (ADV and T75 parameters) in our study, previous research reported that transplanting indoor plants, such as the
Peperomia dahlstedtii, leads to a suppression of the sympathetic system. This was associated with comfortable, soothed, and natural feelings, when compared to tasks involving computer use [
43].
Additionally, although no significant changes were observed in our study, the literature suggests that indoor plants in offices have been associated with improvements in worker productivity. Nieuwenhuis et al. [
44] reported that enriching an office environment with plants increased productivity by 15%, while Hähn et al. [
35] found that removing plants from individual offices (with plants only placed in break-out areas) produced a decrease in perceived productivity, attention, and efficiency levels. It is important to note that using objective assessments of productivity could potentially yield different outcomes. In this regard, previous research using Stroop tasks (requiring responses to incongruent colour-word stimuli), the Guilford’s Alternative Uses test (asking alternative uses for common everyday objects) and the reading span test (sentence processing and word recall), has suggested that biophilic conditions may enhance neural efficiency during cognitive tasks [
36], creativity [
15], and attention [
13]. Improvements in these indicators could potentially be reflected in productivity outcomes, as individuals are better able to focus, think creatively, and perform tasks effectively in environments enriched with NBS. Moreover, the results of our study suggest that greater fluctuations in indoor temperature were associated with lower chances of productivity improvement in the control group. Indeed, thermal comfort has been identified as a critical factor influencing work productivity, with the ideal temperature range being between 22 and 24 °C in temperate or cold climates [
45]. In this regard, during the intervention phase, a greater percentage of participants in the intervention group (67%) worked in offices with air temperature outside of the recommended range, compared to the participants in the control group (45%). This difference may help explain why a greater proportion of participants in the control group reported productivity improvements, which could mask productivity changes resulting from the study intervention.
Our study also found significantly higher self-reported satisfaction with office IEQ among participants exposed to indoor plants. This finding aligns with previous research, which reported a 10–12% increase in workplace satisfaction after introducing plants (species not mentioned) in offices [
44]. Similarly, office workers who had physical and visual access to potted plants in their individual offices and break-out spaces also showed improved satisfaction [
35]. Accordingly, the visibility of plants plays an important role in enhancing these perceptions [
17]. The appearance of indoor plants can also influence how they are perceived. An investigation involving images of 12 plant species found that people prefer plants with rounded canopy contours [
46]. Notably, the indoor plant used in our study, the
Sansevieria trifasciata, was positioned in the middle of the preference ranking. Moreover, plant appearance was shown to significantly affect aesthetic preferences and the extent to which individuals perceive benefits for their subjective well-being in offices [
47]. This observation suggests that selecting different species, not only through their potential influence on IAQ but also through more favourable aesthetics, could potentially increase satisfaction with IEQ.
However, this study also has limitations that should be acknowledged to better understand the uncertainties associated with the reported findings. For instance, the increase in remote working made it challenging to recruit the same participants from the pre-intervention phase for the second study phase, resulting in a smaller sample of eligible participants to assess the impacts of the intervention. Additionally, participant blinding was not possible because the presence of plants was clearly visible, potentially influencing participants’ expectations and subjective evaluations. Consequently, the Hawthorne effect cannot be excluded, as participants may have altered their perceptions or behaviours due to their awareness of being observed. Moreover, the intervention period was relatively short, which may have limited the ability to detect longer-term effects of indoor plants. While the fieldwork was always carried out on days representative of typical occupancy levels, each assessment phase was conducted over a single workday. Although plant size was considered during the intervention design, leaf area was not explicitly quantified, which may influence air-purification potential [
48]. Additionally, IEQ variables were not experimentally controlled. Therefore, IEQ differences between office groups may have acted as confounding variables, limiting the extent to which the observed effects can be attributed exclusively to the presence of indoor plants. This limitation is particularly relevant given that slight differences in thermal conditions were observed between intervention and control groups and may have contributed to the productivity outcomes. Overall, future studies with a longer assessment period and a greater number of offices involved, guaranteeing similar IEQ conditions, could enhance the representativeness and accuracy of the findings concerning the effects of indoor plants on office workers’ outcomes.