Systematic Review

Soil Property Monitoring in Africa via Spectroscopy: A Review

by
Mohammed Hmimou
1,2,*,
Ahmed Laamrani
1,3,
Soufiane Hajaj
1,4,*,
Faissal Sehbaoui
2 and
Abdelghani Chehbouni
1
1
Center for Remote Sensing Applications (CRSA), Mohammed VI Polytechnic University (UM6P), Ben Guerir 43150, Morocco
2
AgriEdge, UM6P, Ben Guerir 43150, Morocco
3
Department of Geography, Environment & Geomatics, University of Guelph, Guelph, ON N1G 2W1, Canada
4
Geomatics, Georesources and Environment Laboratory, Faculty of Sciences and Techniques, Sultan Moulay Slimane University, Beni Mellal 23000, Morocco
*
Authors to whom correspondence should be addressed.
Environments 2026, 13(4), 228; https://doi.org/10.3390/environments13040228
Submission received: 28 February 2026 / Revised: 9 April 2026 / Accepted: 14 April 2026 / Published: 21 April 2026
(This article belongs to the Topic Soil Quality: Monitoring Attributes and Productivity)

Abstract

Efficient soil fertility monitoring is essential for sustainable agriculture, food security, and environmental management across Africa, yet conventional laboratory methods remain prohibitively costly and slow for continental-scale applications. Soil spectroscopy is considered as a rapid, non-destructive alternative with transformative potential. This review provides a systematic synthesis of spectroscopic applications across Africa, encompassing laboratory, field, airborne, and satellite-based platforms, while examining major data sources including the Africa Soil Information Service (AfSIS) and GEO-CRADLE spectral libraries. We critically evaluate the evolution of modeling approaches, revealing that Partial Least Squares Regression (PLSR) dominates, but a shift toward advanced frameworks like hybrid physically based models, ensemble learning and deep neural networks is essential. Critically, we identify a pronounced imbalance wherein laboratory spectroscopy prevails while imaging and satellite-based approaches remain comparatively underutilized, despite their unparalleled potential for scaling point measurements to continental extents. The review consolidates findings on key soil properties, demonstrating consistent successes for primary constituents with direct spectral responses (i.e., organic carbon), while revealing relative uncertainty for properties inferred indirectly via covariance (e.g., available phosphorus, potassium). Despite significant local and regional progress, the absence of a standardized pan-African spectral library and the intractable transferability problem remain formidable barriers. Future research must pivot decisively toward imaging spectroscopy and satellite platforms, mitigating PLSR dominance through systematic adoption of ensemble methods, transfer learning, and model harmonization frameworks to fully operationalize these technologies in support of Africa’s sustainable development goals.

1. Introduction

Soil resources are a cornerstone of Africa’s socioeconomic fabric, fundamentally linked to food and nutritional security, economic development, and resilience to climate change. The sustainable management of these resources is not merely an agricultural priority but a core component of achieving several United Nations Sustainable Development Goals (SDGs [1]. In this context, soil spectroscopy has emerged as a powerful analytical tool capable of providing accurate, timely, and spatially explicit information on soil properties. Such information supports SDG 2 (Zero Hunger) by enabling precision agriculture practices and decision-support systems that guide optimized management strategies, including variable-rate fertilization, thereby enhancing agricultural productivity and food security in a sustainable manner. At the same time, spectroscopy contributes to SDG 13 (Climate Action) through its capacity to facilitate reliable carbon accounting and to monitor soil organic carbon dynamics, which are essential for assessing carbon sequestration and supporting climate mitigation efforts. Furthermore, the technology plays an important role in achieving SDG 15 (Life on Land) by enabling large-scale assessment of land degradation and continuous environmental monitoring, providing critical insights for sustainable land management and for protecting terrestrial ecosystems across diverse landscapes.
This review is motivated by a critical and timely need to consolidate the rapidly expanding yet fragmented body of research on soil spectroscopy applications across Africa [2]. While numerous studies have demonstrated the technique’s potential at local and sub-regional scales, the absence of comprehensive synthesis has limited our collective understanding of methodological progress, predictive capabilities, and persistent barriers to operational deployment. Here, we address this gap by providing a comprehensive synthesis that systematically evaluates the evolution of spectroscopic techniques, data sources, and modeling approaches specific to African contexts. Beyond cataloging past achievements, this review offers critical insights into the trajectory of the field by identifying emerging opportunities, particularly those arising from new-generation hyperspectral satellite missions and advances in artificial intelligence (AI), while explicitly delineating the research gaps that must be bridged to transition from proof-of-concept studies to operational soil monitoring systems. In doing so, we aim to provide both a foundational reference for researchers entering the field and a strategic roadmap for guiding future investments, perspectives, and collaborative initiatives.
African continent is characterized by a scarcity of high-resolution soil data. This gap is largely attributable to the profound limitations of traditional soil analysis methods, such as wet chemistry. These conventional techniques are prohibitively expensive, labor-intensive, and time-consuming, rendering large-scale or high-density soil survey campaigns impractical in many African contexts [3,4]. The result is a reliance on sparse, often outdated, soil information that fails to capture the continent’s immense pedological diversity and hinders the implementation of precision agriculture and effective environmental monitoring.
In response to this challenge, a technological shift is underway, driven by the adoption of soil spectroscopy. This suite of techniques, encompassing the Visible (VIS), Near-Infrared (NIR), Short-Wave Infrared (SWIR), and Mid-Infrared (MIR) regions of the electromagnetic spectrum, offers a fast, non-destructive, and affordable alternative solution for soil characterization [5,6,7,8,9]. By quantifying light interactions with soil materials, spectroscopy can infer physical and chemical parameters from a single scan, dramatically reducing the cost and time associated with soil analysis.
To ensure scientific rigor and transparency, this review was conducted following established guidelines for systematic scoping reviews, adapted to accommodate the methodological diversity inherent in spectroscopic research. A comprehensive literature search was performed across Scopus, as other databases yielded high duplication like Web of Science, and Google Scholar databases. Studies were included if they (i) focused on African soils, (ii) employed spectroscopic techniques (laboratory, field, or remote sensing), (iii) reported quantitative predictions of soil properties, and (iv) were published in peer-reviewed journals or authoritative technical reports. From an initial pool of studies met the inclusion criteria and were subjected to detailed analysis. Each study was evaluated for geographic location, spectral range, sensor type, preprocessing techniques, modeling algorithms, target soil properties, and reported performance metrics. This structured approach enables replicability of our synthesis and provides a transparent basis for the thematic organization of results presented herein, while the inclusion of recent publications up to 2025 ensures representation of the most current advances, including emerging applications of machine learning and new satellite sensors that are shaping the future trajectory of the field.
The objective of this systematic review is to present a comprehensive and up-to-date synthesis of soil spectroscopy applications across the African continent. By bringing together studies conducted in diverse environmental and agricultural contexts, this paper aims to examine the range of methodological approaches employed, including spectral analysis techniques, predictive modeling strategies, and data integration frameworks used for soil property assessment. In doing so, the review seeks to provide a structured overview of current developments, highlight emerging research trends, and discuss the main scientific and operational considerations associated with the implementation of soil spectroscopy in African landscapes. Through this synthesis, the study intends to support a clearer understanding of the methodological landscape and to contribute to advancing the effective use of spectroscopic techniques for soil and environmental monitoring across the region.

2. Material and Methods

This study conducted a systematic literature review in accordance with PRISMA 2020 guidelines [10] to evaluate 51 peer-reviewed publications addressing the application of soil spectroscopy and machine learning for predicting soil attributes across Africa. As the review does not involve clinical or health-related outcomes, protocol registration was not required. During the preparation of this manuscript, the Grammarly AI tool (v.1.2.236.1843) was used for the main purpose of enhancing the language of the manuscript.

2.1. Systematic Review Methodology Using PRISMA 2020

This review followed the PRISMA 2020 framework to systematically identify, screen, and evaluate peer-reviewed studies on soil property monitoring in Africa using spectroscopic techniques. In accordance with PRISMA 2020, the process comprised three stages: identification, screening, and inclusion. During identification, all potentially relevant records were retrieved prior to filtering. Screening involved title, abstract, and full-text assessments to eliminate irrelevant studies and refine the dataset. In the final inclusion stage, the set of eligible publications used to address the research questions was established. The completed checklist is provided as Supplementary Material: PRISMA checklist.

2.2. Search Strategy, Inclusion and Exclusion Criteria

The search strategy employed Boolean combinations of keywords related to:
  • Spectroscopic techniques: e.g., “hyperspectral,” “imaging spectroscopy,” “reflectance spectroscopy.”
  • Soil properties: e.g., soil fertility indicators, organic carbon, total nitrogen, available phosphorus, exchangeable potassium, texture, CEC, pH, EC, moisture.
  • Geographic scope: Terms covering all African regions and countries to ensure comprehensive coverage.
The search was restricted to peer-reviewed empirical studies published between 2002 and 2025 to capture both early foundational work and recent advances, including those integrating modern machine learning frameworks. The Web of Science database was omitted due to a high number of duplicate records already captured in Scopus. Accordingly, Scopus was selected as the primary source for this review.
To ensure the relevance and consistency of the review, a set of inclusion and exclusion criteria was established. Studies were included if they focused on African soils and applied laboratory, field, or remote-sensing spectroscopic techniques for the quantitative prediction of soil properties. Only peer-reviewed empirical articles indexed in Scopus and published between 2002 and 2025 were considered, thereby capturing both early developments and recent advances associated with machine learning–based approaches. Conversely, studies were excluded if they were not peer-reviewed, not indexed in Scopus, written in languages other than English, or if they fell outside the defined geographical or methodological scope. Publications that did not meet the required level of methodological rigor or that were published outside the specified timeframe were also excluded from the analysis.

2.3. Key Research Questions of This Systematic Review

The thematic analysis undertaken in this review was structured around the following specific research questions:
i.
What data sources and data acquisition methodologies have been investigated to date across Africa?
ii.
What soil properties have been examined in African studies employing spectroscopic approaches?
iii.
What modeling frameworks have been employed to estimate soil attributes using spectroscopic data from Africa?
iv.
What are the persistent methodological barriers to operationalizing these technologies, and what future research trajectories (e.g., model harmonization, etc.) are required to overcome them?

3. Results: Literature Data Screening and Trend Analysis

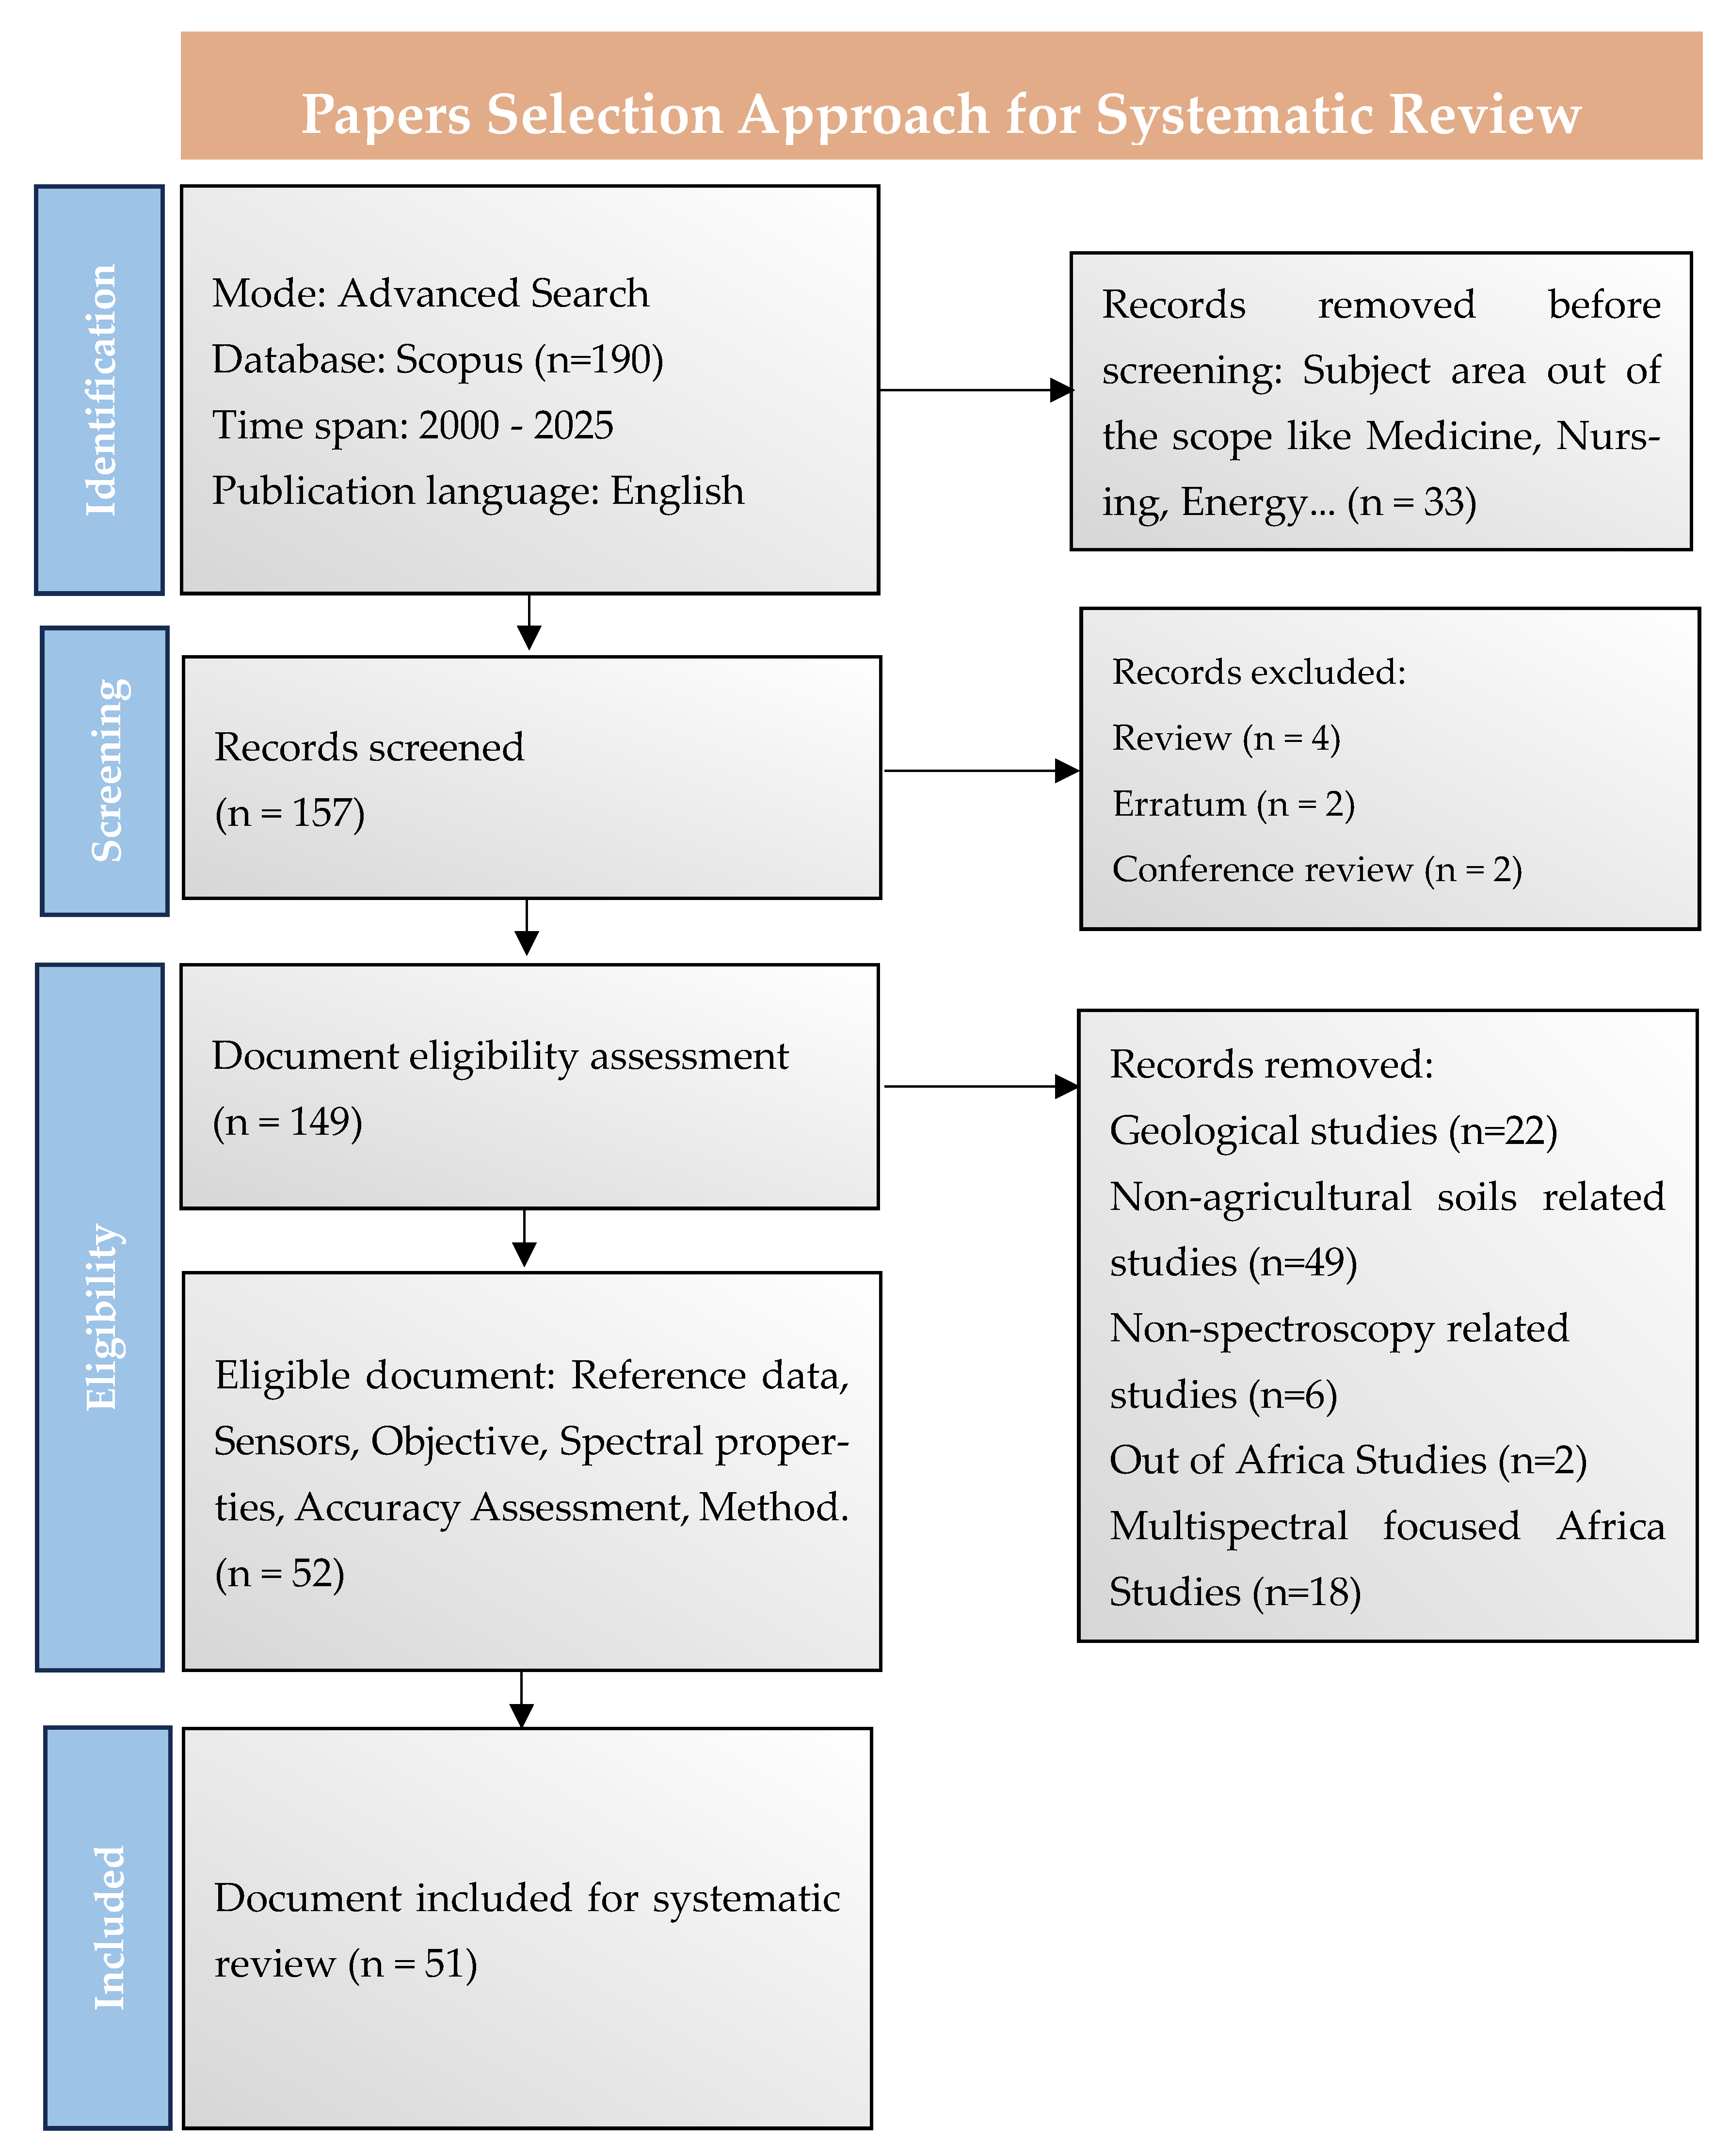
Figure 1 presents the workflow adopted to retrieve and refine the body of literature analyzed in this review. An advanced search strategy was conducted in the Scopus databases, focusing exclusively on peer-reviewed articles published in English between 2000 and 2025. The initial search yielded 190 records. During the preliminary screening stage, 33 documents were excluded because their disciplinary focus (i.e., as medicine or nursing) did not support the intended goals of the review. The remaining publications underwent a detailed eligibility assessment. At this stage, review articles, errata, and conference review papers were removed to ensure the inclusion of original research contributions only. After applying these criteria, 51 studies met all requirements and were retained for the final analysis, particularly because they reported key methodological information, including reference measurements, sensor specifications, and quantitative accuracy indicators.
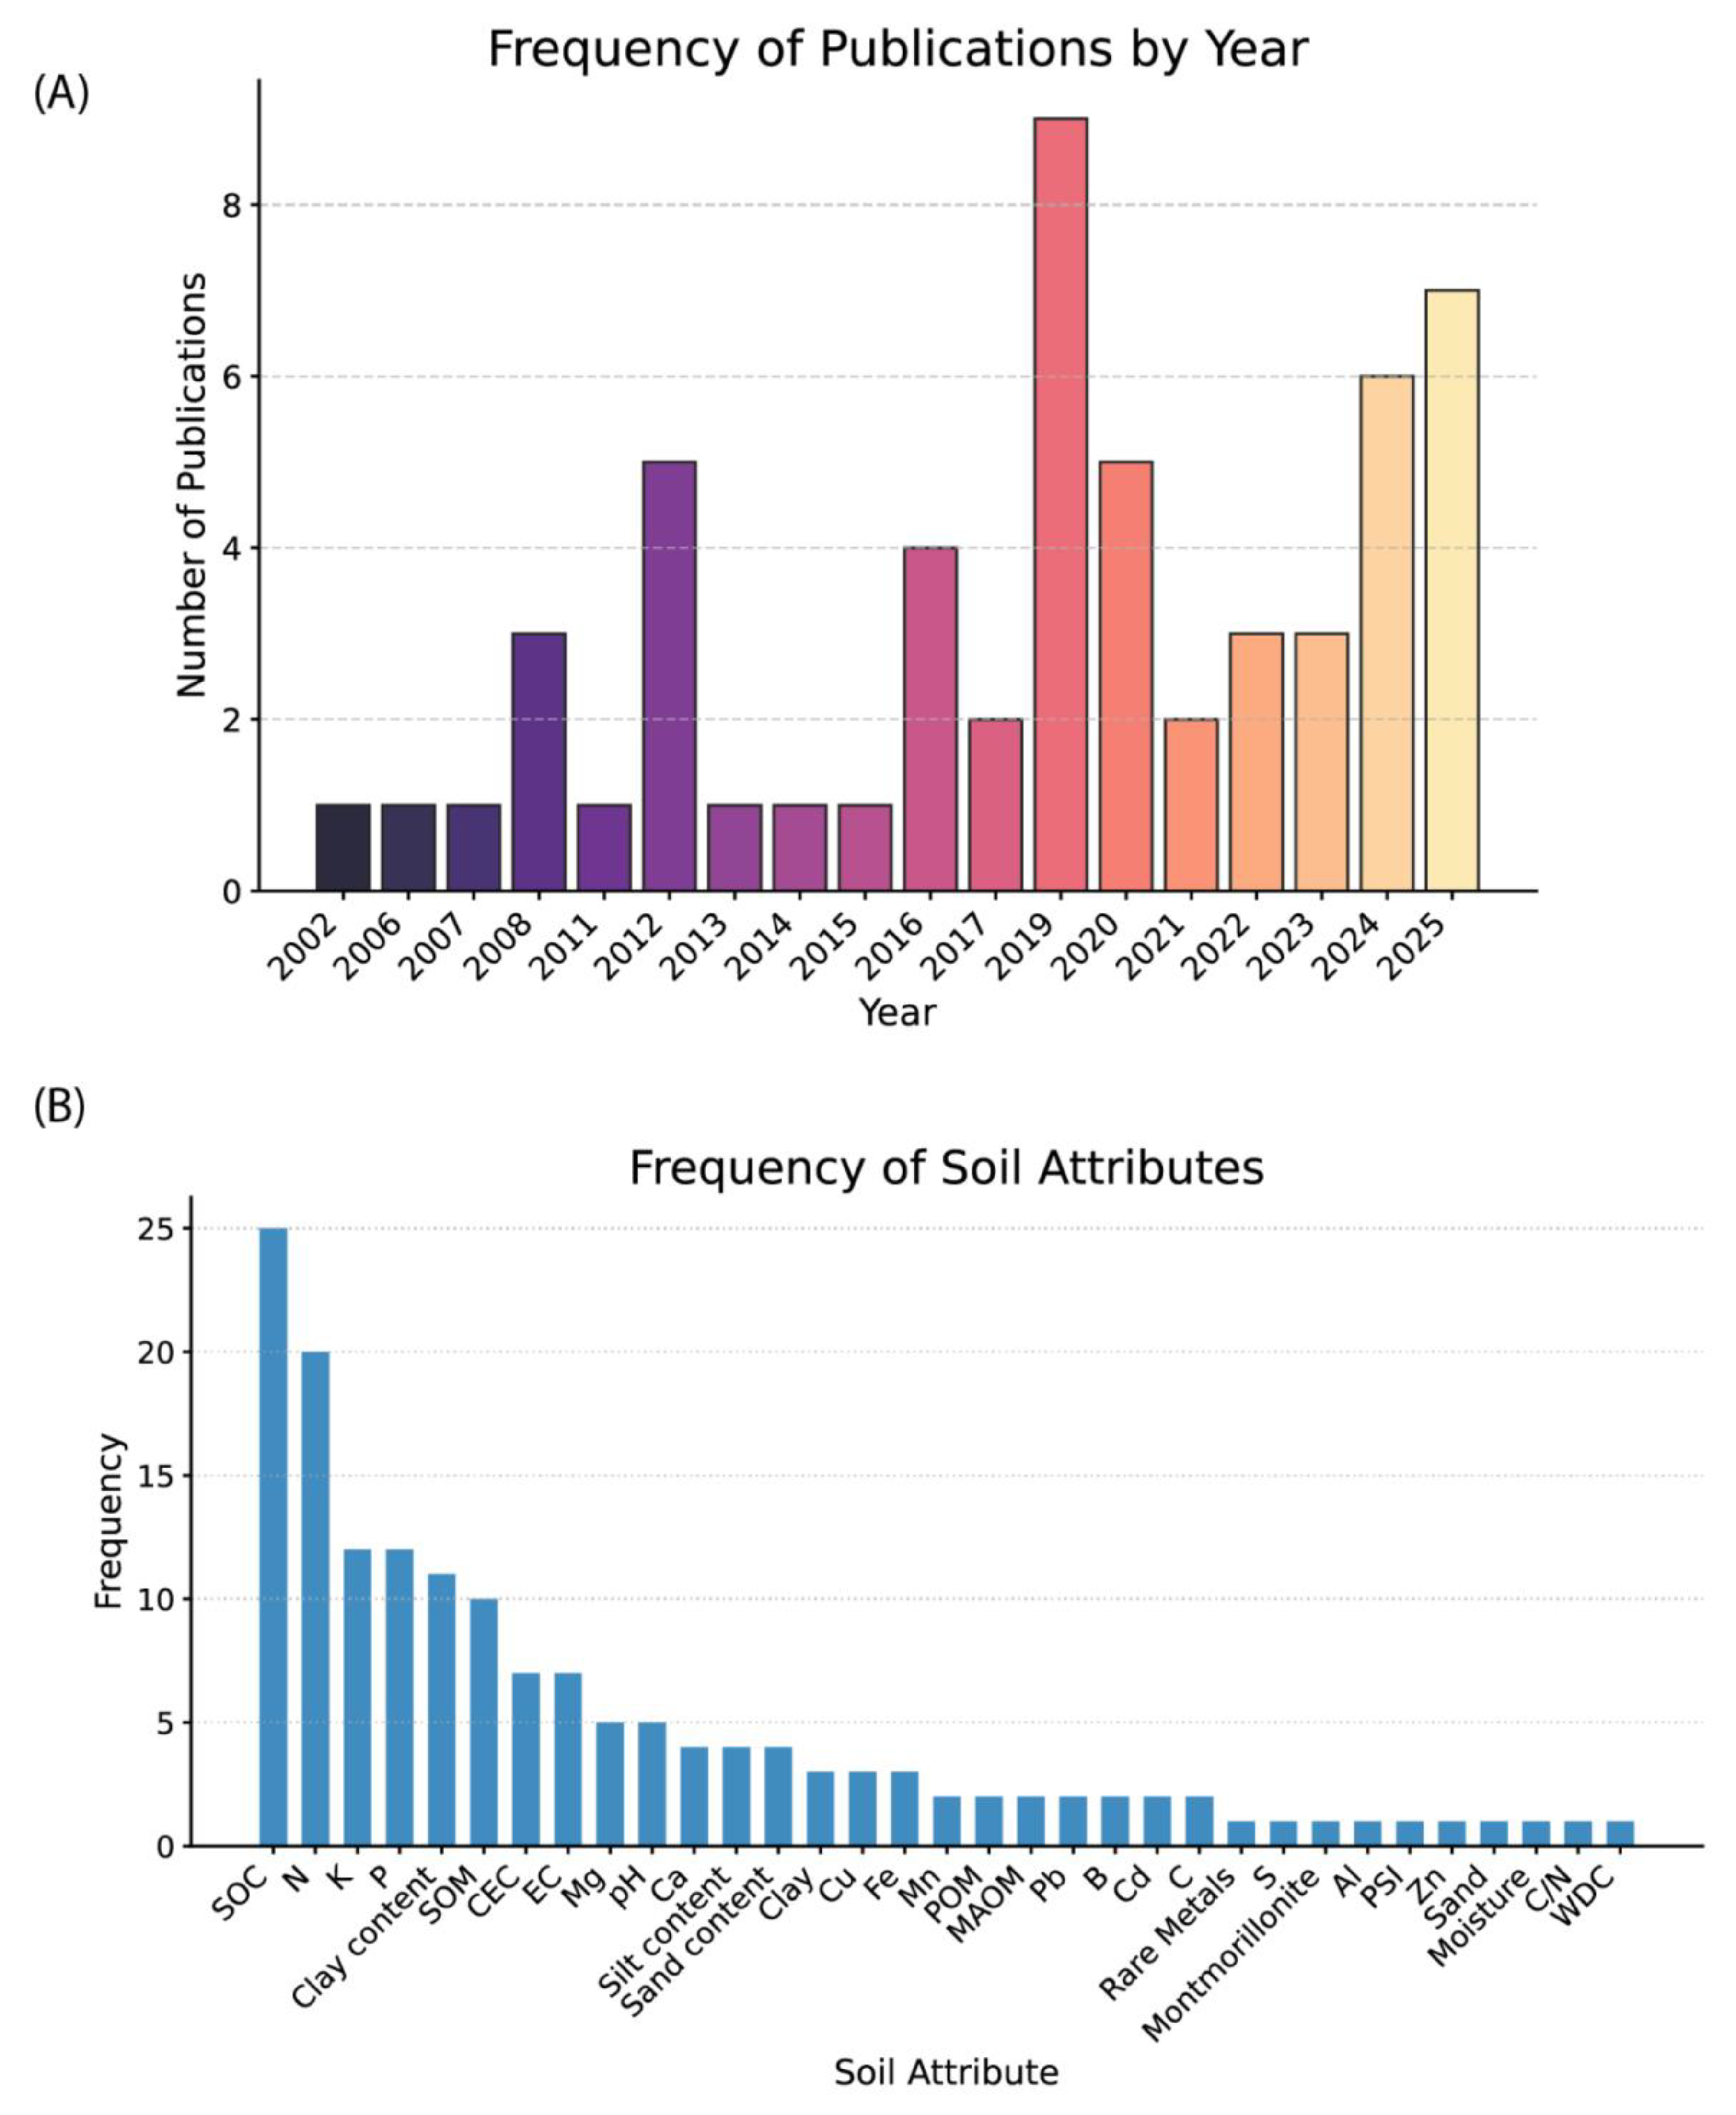
Figure 2 tracks the growth and thematic focus of soil spectroscopy research across the African continent. Panel (A) displays the frequency of scientific publications from 2002 to 2025, revealing a general upward trend with a notable peak of nine publications in 2019. Panel (B) illustrates the frequency of specific soil attributes studied; it shows that SOC and Nitrogen (N) are the most heavily researched properties, followed by Potassium (K), Phosphorus (P), and clay content.
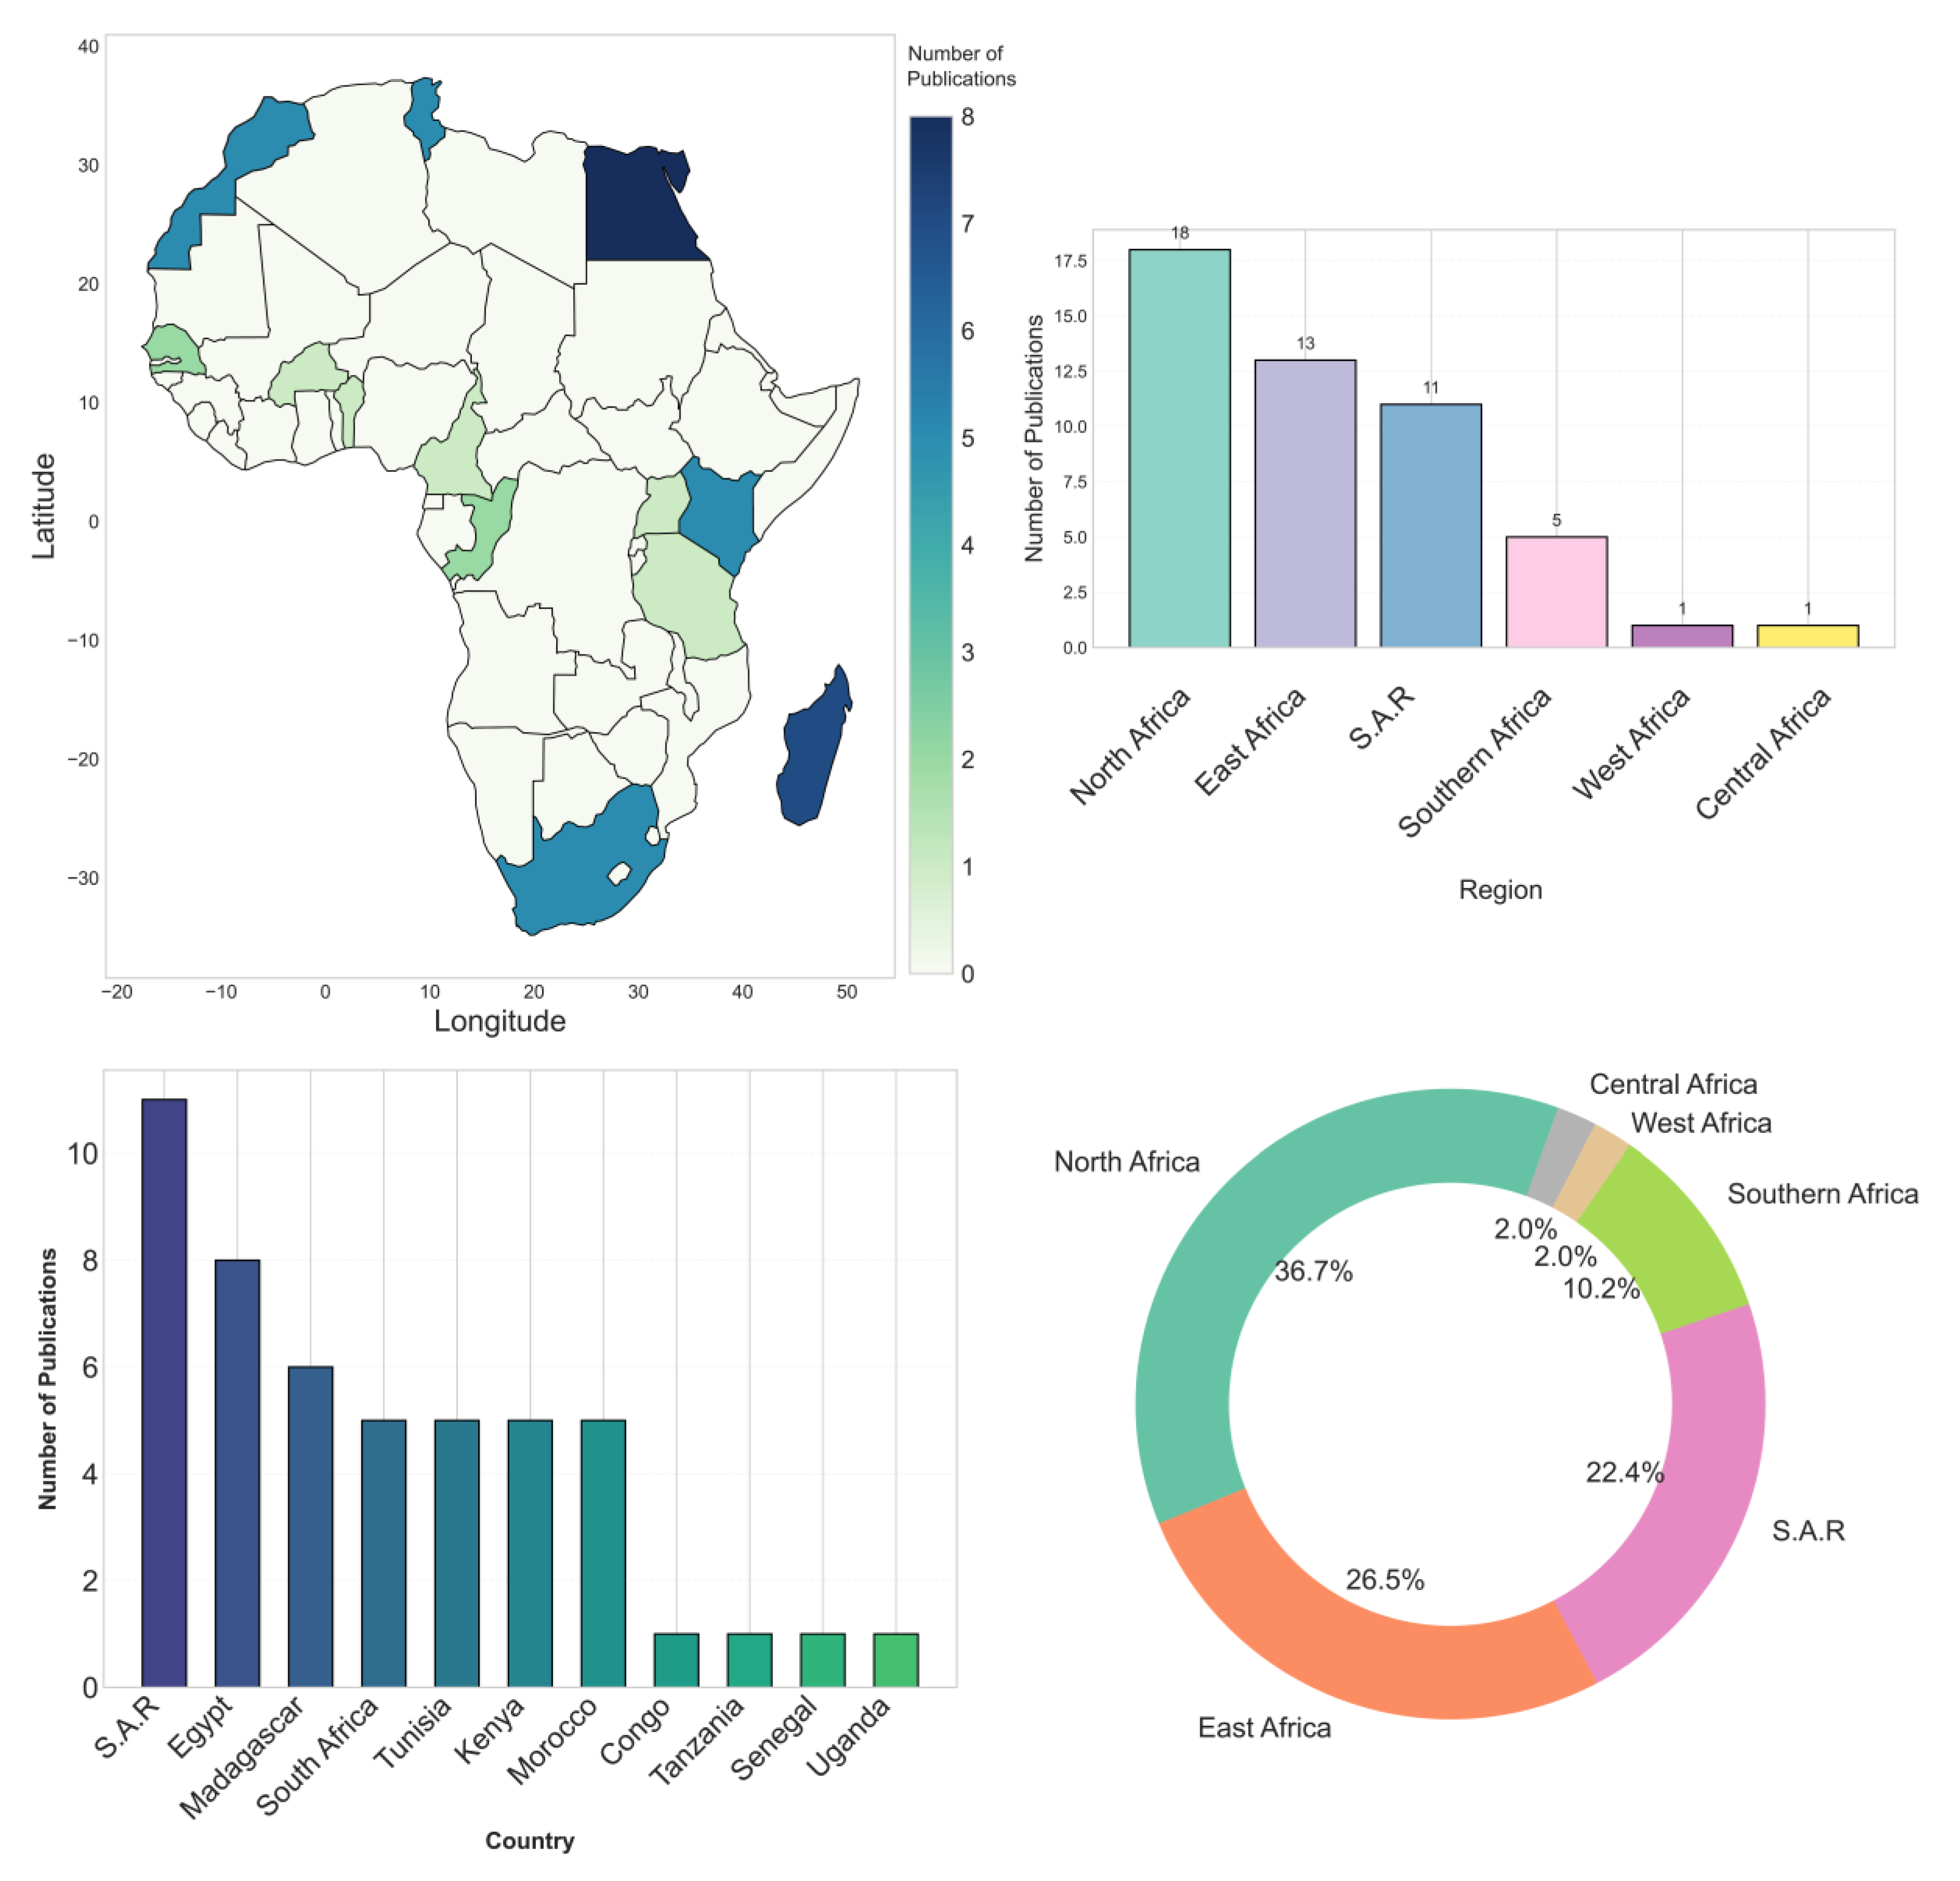
Figure 3 provides a comprehensive spatial assessment of soil spectroscopy studies conducted within African countries and regions. The multi-panel visualization indicates that Madagascar and Egypt are the most active countries in this field, each with seven publications. A regional breakdown reveals that North Africa accounts for the largest portion of research at 36.7%, followed by East Africa at 26.5%, while Central and West Africa remains the least represented region at 2.0%.
It is crucial to note that this corpus exhibits pronounced spatial bias. North and East Africa account for the vast majority of studies, whereas Central and West Africa remains critically underrepresented (2.0% of publications). Consequently, while this review identifies broad continental trends, claims of representativeness must be tempered, and conclusions should be extrapolated to under-researched regions with caution.

4. Spectroscopic Datasets and Acquisition Methodologies

This section details the foundational spectroscopic technologies, data processing techniques, and key soil spectral libraries (SSLs) that form the basis of modern soil analysis in Africa. The successful application of spectroscopy relies on a chain of processes, from data acquisition with specific instruments to rigorous pre-processing and the development of robust calibration datasets. Understanding these components is crucial for interpreting the performance of the predictive models that translate spectral signatures into quantitative soil property estimates, as will be discussed in subsequent sections.

4.1. Data Sources Landscape and Gaps in Africa

The advance and implementation of Soil Spectral Libraries (SSLs)—large, curated databases of soil spectra paired with conventional laboratory data—are fundamental to spectroscopic modeling. Several key datasets are relevant to the African continent:
AfSIS: This dataset represents a landmark continental-scale effort to map African soils. It provides a vast repository of soil samples with associated spectral and analytical data, serving as a foundational resource for developing and testing continent-wide predictive models, as demonstrated in the creation of a novel soil pH index [11]; GEO-CRADLE SSL: This regional library focuses on North Africa (specifically Egypt), the Middle East, and the Balkans. A key goal of the GEO-CRADLE project was to establish a standardized measurement protocol to ensure data from different countries and instruments could be merged and analyzed cohesively, addressing a major challenge in building large, diverse SSLs [12]; ISDA Soil Maps: The Innovated Solutions for Decision Agriculture (ISDA) initiative produced soil attributes, including nutrient maps for Africa at a 30 m resolution. These maps, derived from an ensemble machine learning framework, have been used as a source of extensive ground-truth data for calibrating remote sensing models, for instance, in studies mapping total nitrogen from satellite imagery in Morocco [13]; Project-Specific Datasets: In addition to these large-scale libraries, numerous large datasets have been generated through specific research projects. One representative initiative involved the sampling of rice plants and associated soils from 42 locations spanning 20 countries in Sub-Saharan Africa, conducted by the Africa Rice Center. These datasets were subsequently employed to construct reliable spectroscopic models aimed at assessing soil fertility within rice-based production systems [3,14].
Despite these efforts, a significant barrier to the widespread adoption of soil spectroscopy in Africa is data scarcity. As highlighted by Tziolas et al. [12], the development of comprehensive, high-quality SSLs is inadequate or completely lacking in parts of the Balkans, the Middle East, and particularly across large areas of North Africa. This inhomogeneous data landscape represents a fundamental limitation, hindering the development of reliable local, national, and regional calibration models. Overcoming these foundational data gaps requires a sophisticated methodological toolkit, from optimal spectral acquisition to advanced processing, which forms the basis of modern spectroscopic soil science.
The foundation of any spectroscopic modeling effort is the availability of well characterized Soil Spectral Libraries (SSLs), curated databases that link high-quality spectral measurements to conventionally measured soil property data from a diverse range of samples. The development and application of these libraries are central to advancing the technology’s utility, more specifically, when data are collected globally under varying soil conditions. For instance, soil spectroscopy research in Africa, while growing, has been geographically concentrated. Studies have been conducted across various regions, often driven by specific research projects and international collaborations. North African countries like Tunisia, Egypt, and Morocco have seen significant activity, alongside key research hubs in Sub-Saharan and West Africa, as summarized in Table 1.

4.2. Spectroscopic Platforms and Spectral Regions

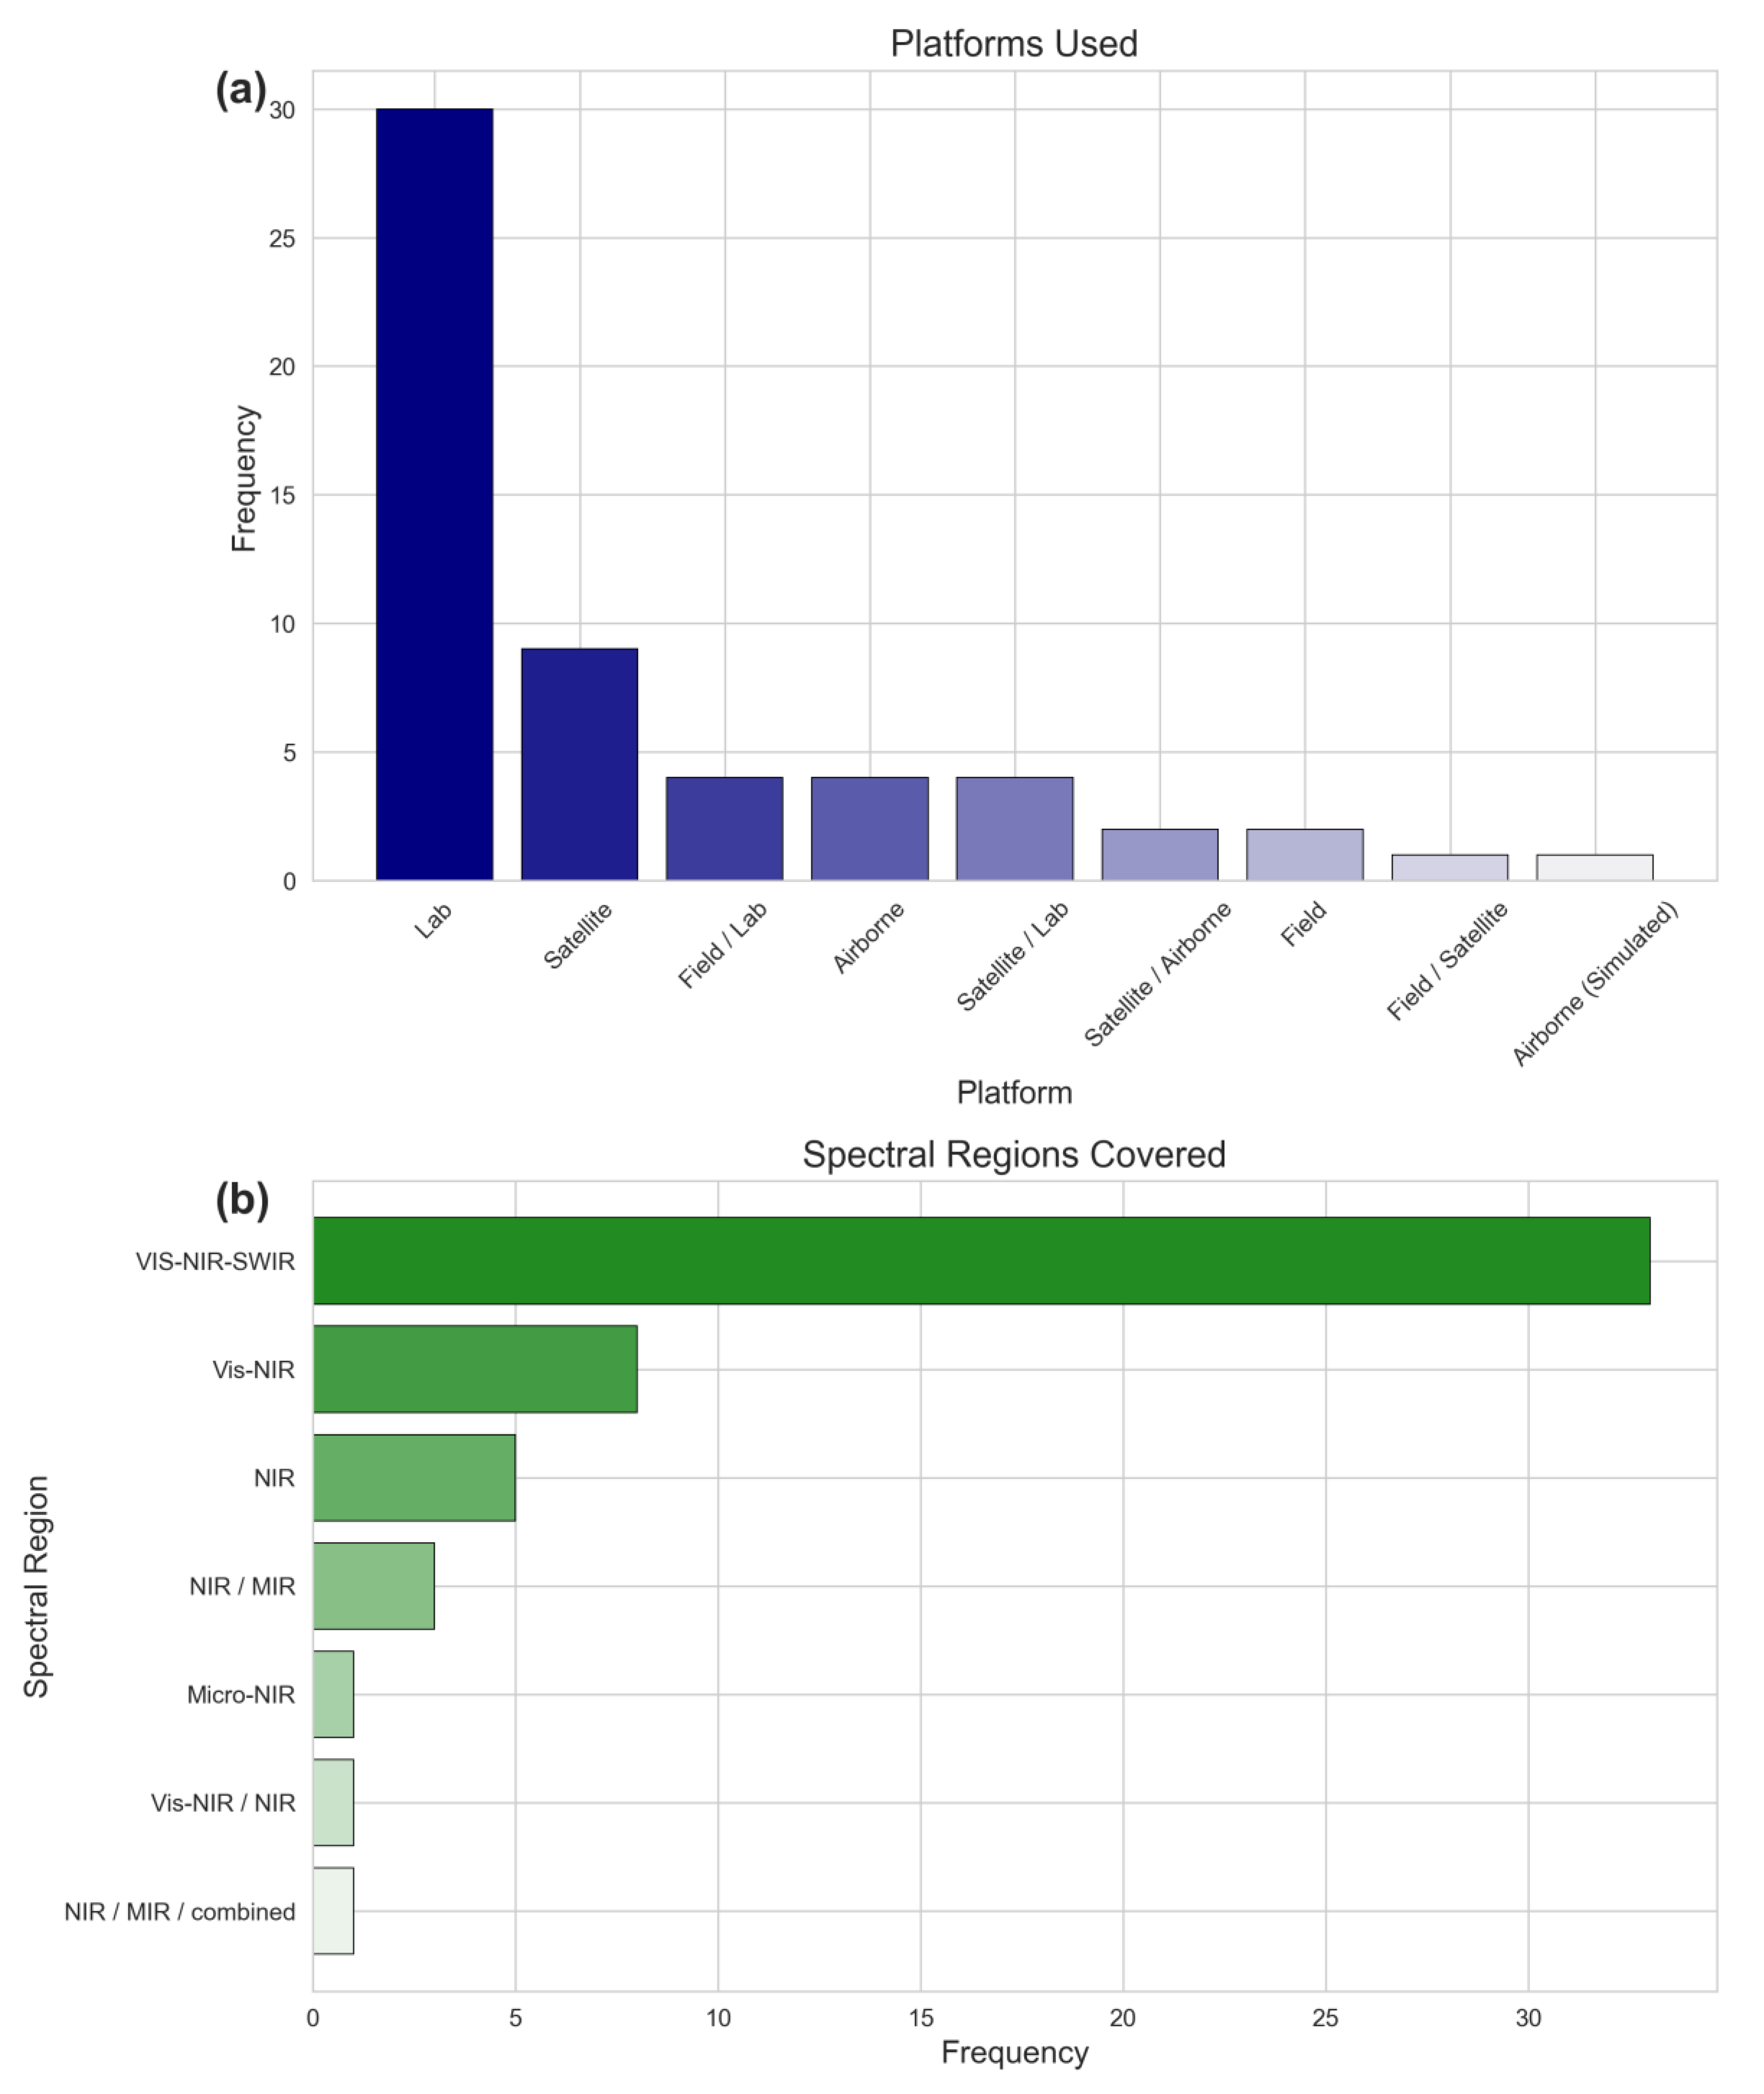
Spectroscopic soil analysis is conducted across multiple scales, each with distinct advantages and applications. These can be broadly categorized as laboratory, field, and remote sensing platforms (Figure 4 and Table 2).
Laboratory Spectroscopy: This is the most controlled environment, where dried and sieved soil samples are analyzed using bench-top spectrometers. This method provides high-quality, repeatable spectra and forms the basis for developing most foundational calibration models. Instruments like Fourier-transform infrared (FT-IR) spectrometers are commonly used in this setting [3].
Field (or in situ) Spectroscopy: This involves taking measurements directly on the soil surface in the field using portable spectroradiometers, such as the ASD FieldSpec or SVC HR-1024i [17,27]. This approach captures soil properties in their natural context but is subject to confounding environmental factors like moisture, surface roughness, and illumination conditions.
Imaging and Remote Sensing Spectroscopy: This technique scales up analysis from points to landscapes using sensors on airborne or satellite platforms. It provides spatially continuous data but faces significant challenges related to atmospheric interference and mixed signals from vegetation, soil, and shadow within a single pixel.
These platforms differ fundamentally in their physical principles and predictive capabilities. Laboratory Mid-Infrared (MIR) spectroscopy captures direct fundamental molecular vibrations, offering the highest accuracy for precise point-based soil health monitoring. Conversely, proximal and laboratory VIS-NIR rely on broader overtones, while remote sensing introduces complex atmospheric and spatial scaling challenges, reducing point-precision but enabling critical landscape-level spatial mapping (Table 2).
These platforms operate across several key spectral regions, each sensitive to different soil components: (i) VIS-NIR-SWIR ranging from 350 to 2500 nm, this region is sensitive to soil mineralogy (especially iron oxides), OM, and moisture. (ii) MIR, ranging 2500 to 16,670 nm, the MIR region captures fundamental molecular vibrations, providing rich information on clay mineralogy, carbonates, and the composition of OM.
The choice of instruments and spectral range has evolved with technology. Studies in Africa have employed a range of devices, from conventional bench-top spectrometers and portable field units to a new generation of miniaturized imaging spectrometers like the Specim IQ, which combines the benefits of spectroscopy and imaging for rapid field assessment, as demonstrated in recent work in Kenya [20,27]. Comparative studies, such as one in Madagascar, have evaluated the trade-offs between miniaturized and conventional spectrometers, paving the way for more accessible field deployment [22].
Figure 4 highlights a clear methodological hierarchy in soil spectroscopy research across Africa. Laboratory spectroscopy dominates, confirming its central role in calibration and algorithm development under controlled conditions. Satellite platforms follow closely, reflecting efforts to scale predictions to regional levels. In contrast, field and airborne approaches remain comparatively underrepresented. Integrated multi-platform studies account for fewer than 10 cases, indicating limited cross-scale methodological integration. This imbalance suggests fragmentation between calibration and operational mapping frameworks. The predominance of laboratory and satellite approaches, with limited intermediate-scale validation, constrains model transferability. Such patterns may limit the operational strength of new HSI missions, including EnMAP and PRISMA. Overall, the figure underscores the need for coordinated multi-scale strategies to enhance robustness and scalability in African soil monitoring initiatives.
The analysis of spectral region usage in African soil spectroscopy studies reveals a strong preference for broad spectral coverage (Figure 4). The VIS–NIR-SWIR range (350–2500 nm) is dominant, indicating that most studies rely on full-range optical data to capture diverse soil absorption features. This range enables detection of iron oxides and OM in the VIS, molecular overtones in the NIR, and clay minerals and carbonates in the SWIR. In contrast, Vis–NIR-only approaches are considerably less represented, reflecting recognition of the limitations associated with excluding longer wavelengths. The lack of MIR-based studies is notable, despite MIR’s known sensitivity to fundamental molecular vibrations relevant to soil organic carbon and mineralogy. This underrepresentation likely reflects higher costs and limited spectral libraries for African soils. Emerging micro-NIR applications suggest growing interest in portable systems. However, the lack of standardized spectral protocols limits comparability across studies. This fragmentation constrains model transferability and integration of datasets. Ultimately, the analysis of the sensors employed across the reviewed studies reveals a clear dominance of the VIS–NIR-SWIR spectral range, accompanied by a strong prevalence of laboratory-based measurements. This pattern highlights the continued reliance on controlled laboratory conditions for soil spectral acquisition and underscores the need to develop harmonized spectral strategies and standardized protocols capable of supporting reliable large-scale soil monitoring initiatives.
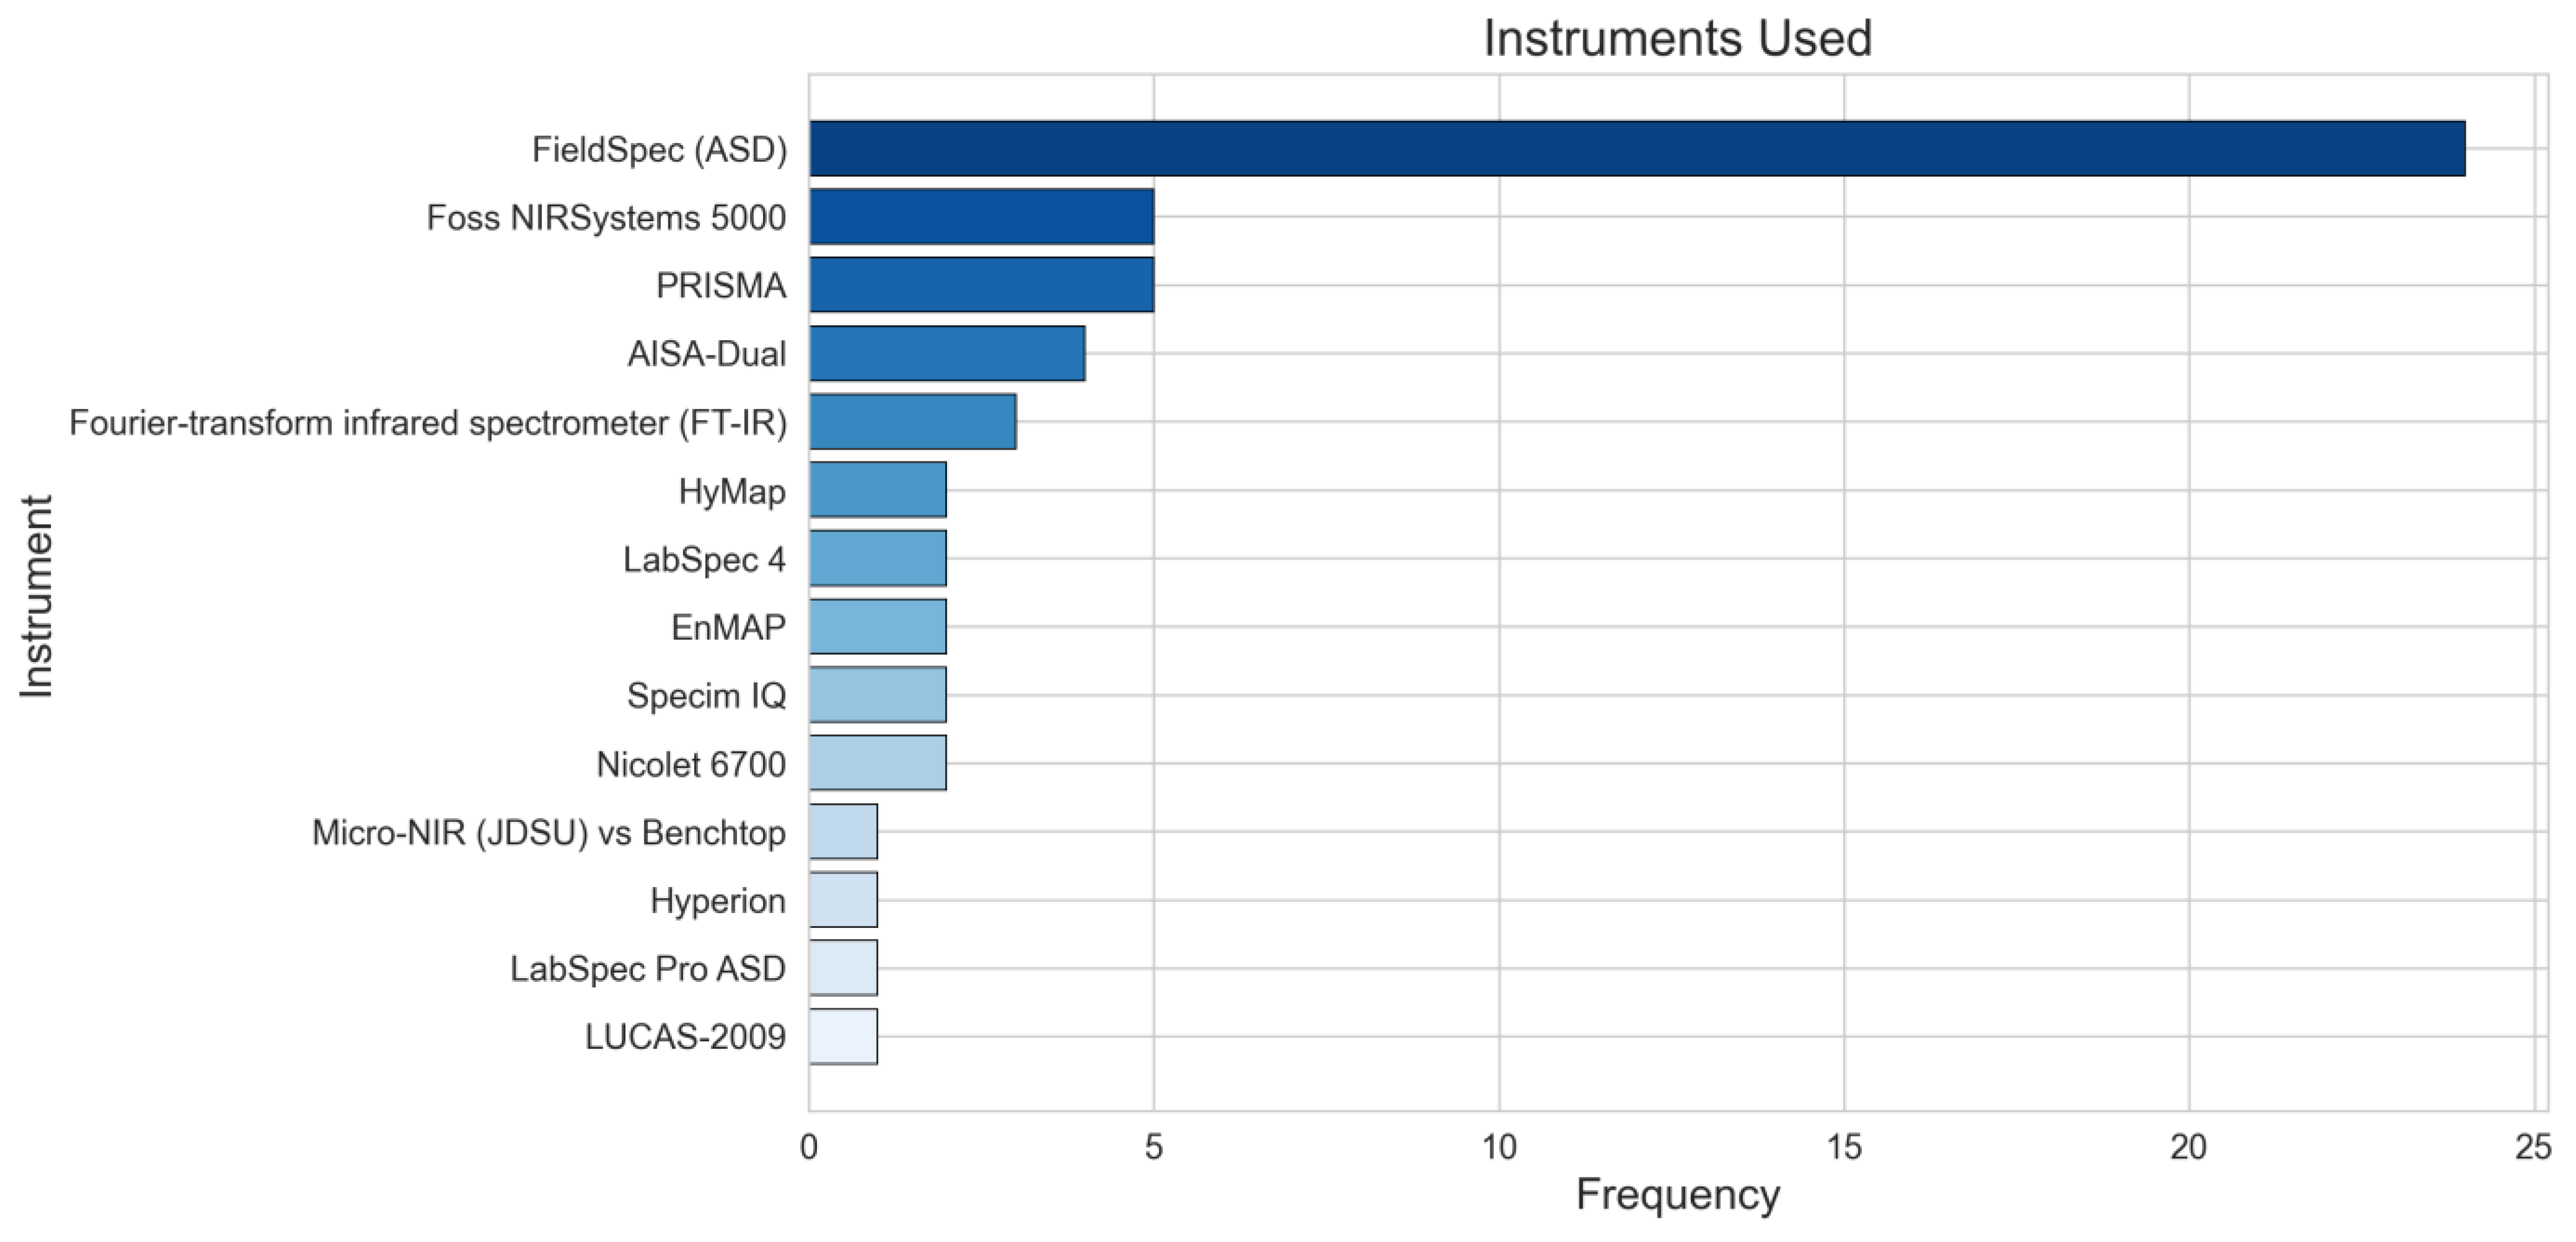
The distribution of instrument platforms employed across African soil spectroscopy studies reveals an operational landscape characterized by pronounced concentration around a few workhorse instruments, alongside emerging diversification driven by technological advances. The FieldSpec series from ASD dominates the field with an aggregate frequency of more than 20 (combining FieldSpec ASD, LabSpec 4, and LabSpec Pro ASD), establishing this instrument family as the de facto standard for soil spectral acquisition across the continent (Figure 5). This predominance reflects the instrument’s historical availability, established protocol development, and the accumulation of spectral libraries calibrated specifically to ASD instrument, a path dependency that carries both advantages and limitations for the field’s evolution. The substantial representation of the Foss NIRSystems 5000 indicates that dedicated bench-top NIR analyzers maintain an important role, particularly in laboratory settings where sample throughput and standardization outweigh portability considerations. The emergence of spaceborne hyperspectral sensors, e.g., PRISMA, EnMAP, and Hyperion as significant data sources signals a paradigm shift toward satellite-based soil property estimation, aligning with the review’s identification of new-generation hyperspectral missions as critical enablers of continental-scale soil monitoring. However, the modest frequencies of these platforms relative to laboratory instruments underscore the developmental stage of spaceborne applications, which remain constrained by challenges of atmospheric correction, mixed pixel effects, and validation data scarcity. The appearance of miniaturized and field-portable spectrometers such as Specim IQ and Micro-NIR JDSU that reflects a nascent but important trend toward democratized spectral acquisition, though their lower frequencies compared to established laboratory instruments suggest that validation and protocol standardization for these emerging tools remain ongoing endeavors.
Table 2. Comparison of spectral data acquisition sensors for soil analysis utilized in Africa. The table excluded studies with unspecified used sensors.
Platform TypeSensor/Instrument Example|Manufacturer|CountryTypical Spatial ResolutionSpectral RangeCommon AdvantagesCommon DisadvantagesCase ReferencesFrequency in Publications
Laboratory
/Field (In situ)
Bench-top FT-IR spectrometers (e.g., Bruker Tensor series)|Bruker Optics GmbH & Co. KG.|GermanyPoint-based1333–27,027 nm Controlled environment, high signal-to-noise ratio, highly accurate.Requires physical sample collection and preparation.[4,14,24,27]4
JDSU MicroNIR 2200|Viavi Solutions Inc.|USAPoint-based1150–2150 nm[20]1
ASD FieldSpec/LabSpec|Malvern Panalytical|USAPoint-based350–2500 nmRapid data collection in the field, minimal sample disturbance.Subject to environmental variability (moisture, lighting).[21,25,27,28,29,30]24
Specim IQ|Specim, Spec-tral Imaging Ltd.|FinlandPoint-based400–1000 nm[20,27]2
Agrispec|Malvern Panalytical|USAPoint-based350–2500 nm[31]1
SVC HR-1024i|Spectra Vista Corporation (SVC)|USAPoint-based350–2500 nm[27]1
Spectral Evolution PSR+|Spectral Evolution Inc.|USAPoint-based350–2500 nm[20]2
AirborneHyMap|Integrated Spectronics Pty Ltd.|AustraliaHigh spatial resolution
(3–10 m)
450–2500 nmLarge area coverage at fine detail, bridges field and satellite scales.High operational cost, complex data processing.[25,32]2
AISA-Dual|Specim, Spectral Imaging Ltd.|FinlandHigh spatial resolution
(1 m)
400–2500 nm[16,33]4
AisaFenix|Specim, Spectral Imaging Ltd.|FinlandHigh spatial resolution
(1 m)
380–2500 nm[1]1
SatelliteHyperspectral (PRISMA)|Leonardo|ItalyMedium spatial resolution (30 m)400–2500 nmGlobal/regional coverage, frequent revisit times, often free data.Limited spatial resolution (30 m, with 5 m panchromatic band), atmospheric interference.[13,15,34,35,36]5
Hyperspectral (EnMAP)|German Aerospace Center (DLR)|Germany Medium spatial resolution (30 m)420–2450 nm[37,38]2
The representation of airborne imaging spectrometers (HyMap, AISA-Dual) and spaceborne sensors indicates sustained interest in high-resolution proximal remote sensing as a bridge between laboratory precision and satellite coverage, though the operational and cost constraints of airborne campaigns likely limit their broader adoption. Notably, the FT-IR category and Nicolet 6700 together represent a modest but significant MIR spectroscopy presence, though their combined frequency remains substantially lower than ASD’s dominance, reinforcing the review’s observation that MIR applications, despite demonstrated superiority for certain soil properties remain underutilized in African contexts. This instrument diversity, while reflecting methodological richness, simultaneously exacerbates the model transferability challenge identified in the review: models calibrated on ASD FieldSpec spectra cannot be directly applied to PRISMA satellite data or Specim IQ field measurements without sophisticated calibration transfer protocols, which remain underdeveloped in the literature. The path toward operational soil monitoring will require not merely instrument deployment but deliberate harmonization efforts—such as those initiated by the GEO-CRADLE project to ensure that spectral data acquired across this heterogeneous instrument landscape can be integrated into unified, representative soil spectral libraries capable of supporting continent-wide predictive modeling.

4.3. Common Spectral Data Pre-Processing Techniques

Raw spectral data are often affected by physical phenomena (e.g., light scatter from different particle sizes) and instrument noise that can obscure the chemical information of interest. Pre-processing is therefore a critical step to enhance the underlying absorption features and improve model performance. A variety of mathematical transformations are commonly applied across African studies.
Once the spectral data are acquired and appropriately processed, they become inputs for computational models designed to predict the soil properties of interest.
Table 3 synthesizes the principal spectral pre-processing techniques applied in African soil spectroscopy studies to improve signal quality and predictive performance. Savitzky–Golay smoothing/filtering emerges as the most frequently implemented method, followed closely by spectral derivatives, while absorbance transformations and Standard Normal Variate (SNV) correction each appear lesser. These mathematical treatments are applied across both the Visible–Near Infrared–Short Wave Infrared (VNIR–SWIR; 350–2500 nm) and Mid-Infrared (MIR; 2500–16,667 nm) domains to enhance chemically relevant absorption features while minimizing physical scattering effects and baseline variability. Reported performance outcomes indicate that absorbance transformation achieved the highest coefficient of determination (R2 = 0.98) for cation exchange capacity (CEC), whereas Savitzky–Golay smoothing and spectral derivatives both reached R2 values of 0.97 for TOC. However, the wide range of reported R2 values (0.11–0.98) underscores the sensitivity of model accuracy to pre-processing strategy, emphasizing the critical role of appropriate spectral transformation in reliable soil property estimation.

5. Modeling Approaches for Spectroscopic Soil Analysis

This section surveys the spectrum of mathematical and machine learning models used to translate pre-processed spectral data into quantitative estimates of soil properties. The choice of modeling algorithm is a critical factor that dictates the accuracy, robustness, and interpretability of spectroscopic predictions. While simple linear models have historically dominated the field, recent research in Africa has increasingly embraced more sophisticated machine learning and ensemble approaches to handle the complexity and non-linearity inherent in soil-spectral relationships.

5.1. Predictive Modeling Algorithms

A wide array of algorithms has been employed in African case studies, ranging from foundational chemometric methods to advanced artificial intelligence models. Table 4 compiles the principal modeling approaches employed in soil spectroscopy research conducted across Africa. It presents the underlying modeling techniques, indicates how frequently they are applied. This overview clarifies the range of analytical strategies currently used for spectroscopic soil assessment in the region.
PLSR: This is the most common and foundational chemometric method used for spectroscopic soil analysis. Its strength lies in its ability to handle high-dimensional, collinear data (i.e., thousands of correlated spectral bands) by projecting them onto a smaller number of orthogonal latent variables, making it uniquely suited for hyperspectral datasets. It has been the workhorse algorithm in the majority of the cited studies across the continent, used for predicting everything from soil salinity [17] to soil fertility in SSA rice fields [14].
Machine Learning (ML) and Artificial Intelligence (AI) Models: As computational power has increased, so has the adoption of more flexible and powerful ML models:
Support Vector Regression (SVR): A powerful algorithm that works well with high-dimensional data and is robust to overfitting. It has been used in ensemble models for mapping total nitrogen in Morocco [13].
Random Forest (RF): An ensemble method based on aggregating hundreds of decision trees, Random Forest is highly effective for complex, non-linear relationships and is less prone to overfitting than a single decision tree. It has been successfully applied to map soil nutrients and organic carbon from satellite imagery in Morocco [15,34].
Gaussian Process Regression (GPR): A non-parametric, Bayesian approach that provides not only predictions but also a measure of uncertainty. It has been used as part of ensemble models for nutrient mapping [13].
Artificial Neural Networks (ANN) and Convolutional Neural Networks (CNN): These deep learning (DL) models are capable of learning complex, hierarchical features directly from spectral data. ANNs and CNNs have been applied to large datasets like AfSIS for estimating soil pH and organic carbon [11].
Multivariate Adaptive Regression Splines (MARS): A non-parametric regression technique that models non-linearities by fitting piecewise linear regressions. In the arid conditions of the El-Tina Plain, north-western Sinai Peninsula, the MARS approach demonstrated clear advantages for predicting soil properties from VNIR spectra [45]. The model effectively handled the spectral variability associated with saline and heterogeneous soils typical of this 175 km2 coastal plain. Its superior performance compared with PLSR and SVR highlights its suitability for complex environmental settings characterized by low rainfall and high evaporation. MARS utilizations (SOM, Clay, EC prediction) underline the relevance of flexible, nonlinear calibration strategies for soil assessment in dryland regions [17,30,45]. It is crucial to note that more complex ML architectures do not systematically provide significant predictive improvements over linear chemometrics. PLSR remains a robust, computationally efficient baseline that often performs comparably to or better than ML on smaller, localized datasets. The added value of ML models (e.g., RF, SVR) is highly dataset-dependent, typically emerging only when modeling complex, non-linear relationships across large, heterogeneous spectral libraries.

5.2. Advanced Modeling and Feature Selection Strategies

Beyond the choice of a single algorithm, researchers have employed advanced strategies to boost model performance, improve interpretability, and reduce computational complexity.
Ensemble Modeling: This approach combines the predictions from multiple individual models (base-learners) to produce a single, often more accurate and robust, final prediction. A stacking algorithm, where a meta-learner is trained on the outputs of base-learners, has been shown to improve SOM and total nitrogen predictions in Morocco [13]. Similarly, a genetic algorithm (GA)-based stacking approach was developed to optimize the combination of models for predicting SOM using the GEO-CRADLE library. This approach is powerful not because it simply averages the best models, but because it intelligently combines models with complementary strengths, where weaker models may excel at predicting specific subsets of data that the strongest single model misses [12].
Local Regression: In contrast to global models built from an entire dataset, local or memory-based learning (MBL) approaches build a unique model for each new sample to be predicted. This is done by selecting a subset of the most similar samples from the spectral library, based on spectral and/or geographical proximity. The Local Gaussian Regression (LGR) approach, which incorporates geographical distance into its sample selection, was shown to improve prediction accuracy with the diverse GEO-CRADLE library, e.g., [46].
Feature (Waveband) Selection: Hyperspectral data can contain thousands of correlated bands, which can lead to model overfitting and high computational costs [48]. Feature selection aims to identify the most informative wavebands for predicting a given soil property. Methods cited in the African context include Genetic Algorithms (GA-PLS), which use evolutionary principles to find optimal band combinations [24]; Recursive Feature Elimination (RFE) [34]; and Correlation-based Feature Selection (CFS) [15].
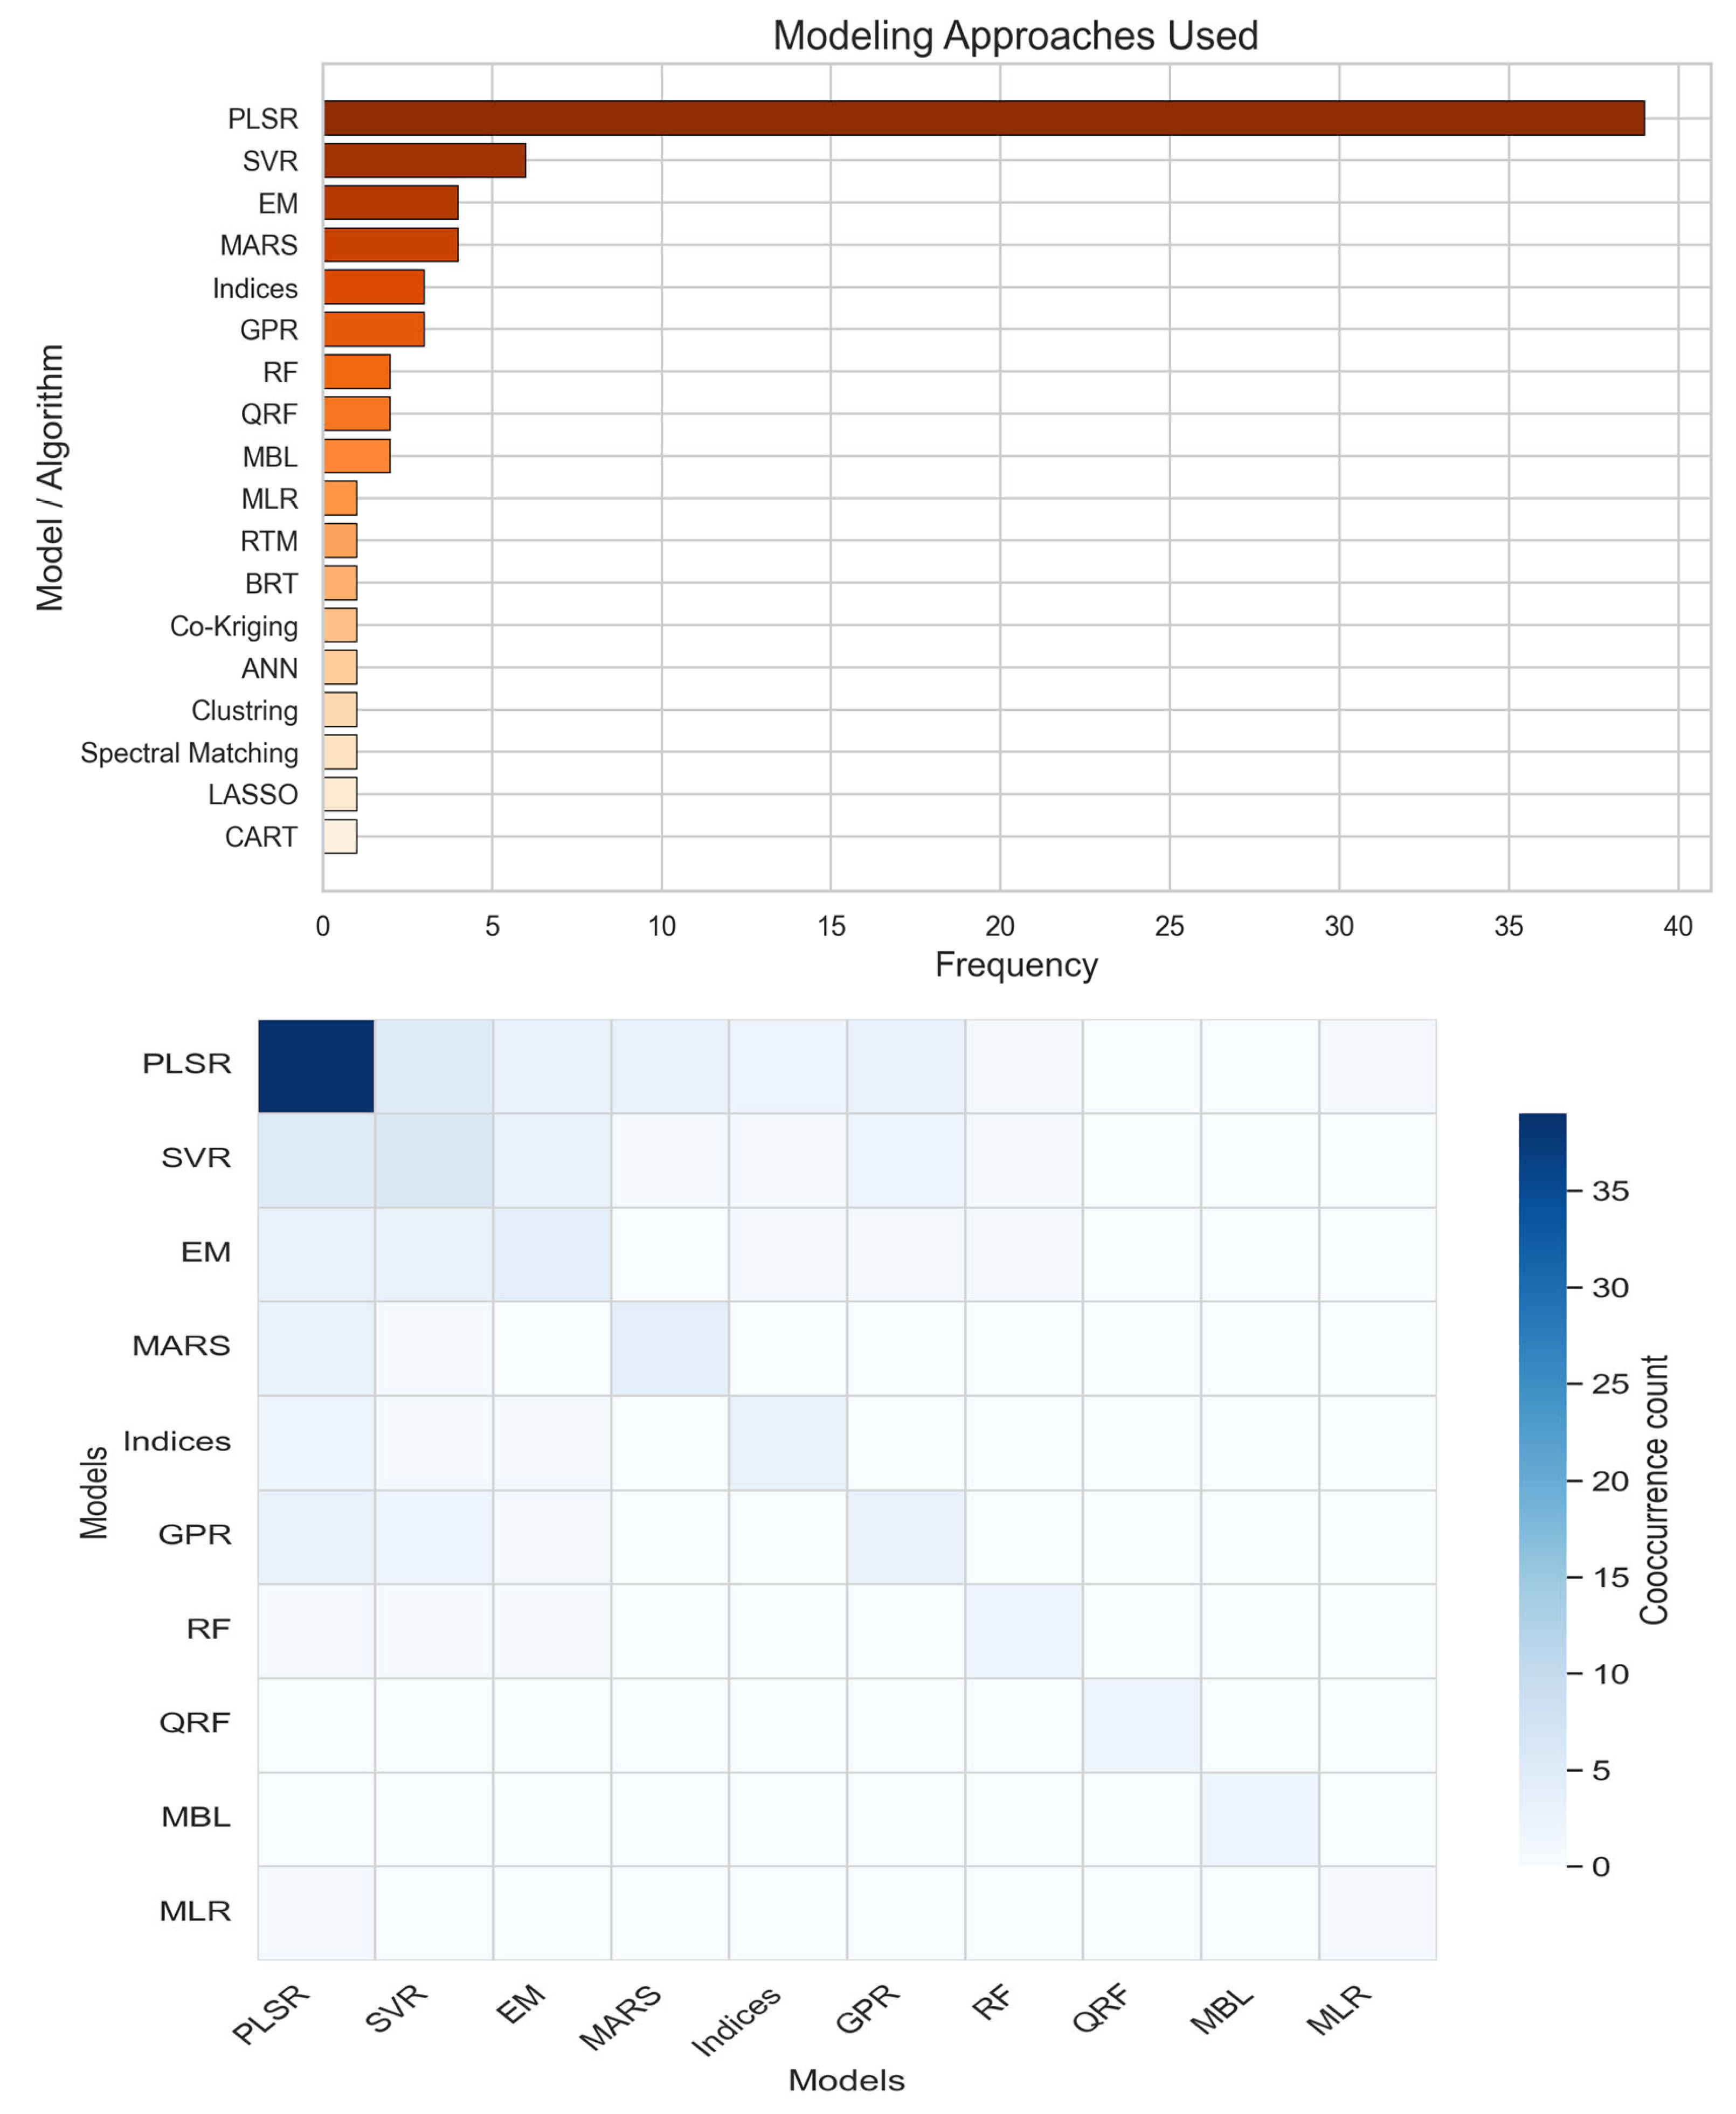
The distribution of modeling approaches employed across African soil spectroscopy studies reveals a pronounced methodological hierarchy that reflects both the field’s historical development and its ongoing evolution toward increasingly sophisticated analytical frameworks. PLSR emerges as the overwhelmingly dominant algorithm (Figure 6) establishing this technique as the foundational workhorse of spectroscopic soil analysis across the continent. This predominance is hardly surprising given PLSR’s unique suitability for hyperspectral data, its capacity to handle high-dimensional, collinear predictor sets by projecting thousands of correlated spectral bands onto a smaller number of orthogonal latent variables renders it uniquely adapted to the spectroscopic context, where neighboring wavelengths exhibit near-perfect multicollinearity. The substantial representation of SVR, and EM represents the second most frequent category, signaling a critical methodological shift toward combining multiple predictive algorithms to leverage their complementary strengths. This trend aligns with the review’s identification of ensemble approaches, including stacking algorithms and meta-learners, as consistently outperforming single-model frameworks, particularly in studies from Morocco [13,34] where ensemble configurations improved soil organic carbon and total nitro-gen predictions compared to any constituent model alone.
The appreciable frequencies of RF and Tree-based modeling reflect the growing adoption of machine learning algorithms capable of modeling non-linear relationships without the parametric constraints inherent to PLSR. Their presence alongside GPR indicates that researchers increasingly prioritize algorithms offering either enhanced predictive flexibility (RF, SVR) or probabilistic uncertainty quantification (GPR), the latter being particularly valuable for risk-aware decision-making in agricultural and environmental management contexts. The continued but diminished representation of traditional linear approaches, MLR suggests that while these simpler methods maintain utility for specific applications or preliminary analyses, they no longer represent the cutting edge of spectroscopic prediction. Notably, the near absence of DL approaches despite their theoretical promise indicates that the substantial calibration data requirements of neural networks remain a barrier in the African context, where well-characterized spectral libraries remain spatially sparse. The presence of specialized techniques including MBL and Co-Kriging reflects targeted efforts to address the transferability challenge through local regression approaches that select spectrally similar samples from libraries rather than applying global models, a methodological innovation directly responsive to the review’s identified gap regarding model generalizability across diverse pedoclimatic zones.
Table 4. Summary of predictive modeling algorithms used in African soil spectroscopy.
Model/AlgorithmSpecific Application|Country|Prediction Accuracy|Reference
PLSRNutrients (NPK)|SSA|R2 > 0.7|[14]; EC|Egypt||R2 = 0.77|[17]; Heavy metals|Egypt|R2 = 0.69|[18]; Nutrients (N, P, K, Ca, Mg)|SSA|0.7 < R2 < 0.92|[3];
TN|Morocco|R2 = 0.7|[13]; SOC and N|Kenya|R2 = 0.76|[20]; SOC and N|Madagascar|R2 = 0.88 (SOC), 0.77 (N)|[22]; SOC|Madagascar|R2 = 0.98|[23]; SOC|West Africa|R2val = 0.82|[26]; SOC and N|Kenya|R2 = 0.83 (SOC), 0.7 (N)|[27];
Total C, TN and EC|Kenya|R2val > 0.90|[28]; EC|Egypt|R2 = 0.77|[30]; SOM|Morocco|R2 = 0.5|[34]; SOC|Morocco|R2 = 0.53|[36]; SOC and N|Madagascar|R2 = 0.972|[44]; Clay and SOM|Senegal|R2 = 0.52–0.72 (Clay) 0.50–0.79 (SOM)|[45]; SOC and N|Senegal|R2val = 0.87|[47];
SOM|GEO-CRADLE (North Africa)|R2 = 0.50|[46]; SOC, TN, CEC|Madagascar|R2 = 0.94 (SOC), 0.96 (TN), 0.80 (CEC)|[49];
EC|South Africa|R2val = 0.85|[50]; N, P, K, pH and SOM|Egypt|R2cal = 0.89 (N), 0.72 (P), 0.91 (K), 0.65 (pH), and 0.75 (SOM)|[51];
CEC|Egypt|R2 = 0.98|[52]; soil oxalate phosphorus|Madagascar|R2 = 0.90|[53]
SVRSOC and pH|AfSIS and LUCAS libraries|R2 = 0.74|[11]; SOM|Egypt|R2 = 0.88 [45]
SOM|Morocco|R2 = 0.27|[34]; SOM|GEO-CRADLE (North Africa)|R2 = 0.65|[46];
Tree-Based Models SOM|Morocco|R2val = 0.50, RMSEP = 0.43%|[15]; SOC and N|Kenya|R2 = 0.78|[20];
Clay|Uganda|R2 = 0.52|[21]; wet aggregation indices|Kenya|Relative error (RE) = 0.71|[43]
GPRSOC and SN|Kenya|R2 = 0.75 [20];
OC, pH, EC, Texture, CaCO3|GEO-CRADLE (North Africa)|R2 = 0.72 (OC), 0.86 (pH), 0.74 (EC), 0.64–0.84 (Texture), 0.93 (CaCO3)|[12]
MARSexchangeable Ca (ex-Ca), effective cation exchange capacity (ECEC), exchangeable Mg (ex-Mg), organic C concentration, clay content, sand content, and pH|Eastern and Southeastern Africa|R2 = 0.88 (ex-Ca), 0.88 (ECEC), 0.81 (ex-Mg), 0.8 (Organic C), 0.8 (Clay), 0.76 (Sand), 0.7 (pH)|[42];
Clay and SOM|Egypt|R2 = 0.9 (Clay), 0.85 (SOM)|[45]
ANNSOC and pH|AfSIS and LUCAS libraries|R2 = 0.963 (SOC), 0.860–0.945 (pH)|[11]
EMSOM|Morocco|R2 = 0.65|[34]; TN|Morocco|R2 = 0.84, RMSE = 0.082 g/kg|[13]
Geostatistical Modeling CEC|Egypt|R2 = 0.88–0.96|[52]
RLRSOC|Kenya|R2cv = 0.8|[20]; SOC and N|Kenya|R2 = 0.83 (SOC), 0.7 (N)|[27]; SOM|GEO-CRADLE (North Africa)|R2 = 0.65|[46]
Logistic Regression Soil condition|Kenya|p < 0.0001|[28]; Soil fertility index|Madagascar|p = 0.003|[49]; SOM|GEO-CRADLE (North Africa)|R2 = 0.76|[46]
DB Models SOC|AfSIS and LUCAS libraries|R2 = 0.72|[11]; SOM|GEO-CRADLE (North Africa)|R2 = 0.76|[46]
Abbreviations: Partial Least Squares Regression (PLSR); Support Vector Regression (SVR); Tree-Based Models (Random Forest, QRF, Cubist, Boosted Regression Trees, CART). Gaussian Process Regression (GPR); Multivariate Adaptive Regression Splines (MARS); Convolutional Neural Networks (CNN); Ensemble/Meta-Learner Algorithms (EM), Geostatistical Modeling (Ordinary Kriging, Co-kriging. Regularized Linear Regression RLR (LASSO, Ridge, Elastic Net); Other models include: Distance-Based DB/Evolutionary/Clustering Models (k-NN, Genetic Expression, Fuzzy c-means).
The relatively low frequencies of LASSO, CART, and BRT suggest that regularization and tree-based methods, while theoretically attractive for variable selection and interpretability, have not yet achieved widespread adoption in African applications (Figure 6), potentially due to the absence of standardized implementation protocols or limited computational infrastructure in some research contexts. The inclusion of Spectral Matching alongside more conventional chemometric approaches reflects the persistence of knowledge-driven, library-based methods alongside data-driven statistical learning, though their lower frequency indicates the field’s decisive shift toward empirical modeling over pure spectral matching. This methodological distribution carries profound implications for the review’s central argument: the path toward operational soil monitoring requires not merely algorithmic sophistication but deliberate harmonization of modeling frameworks to ensure that predictions generated via PLSR in one study, RF in another, and ensemble methods in a third can be meaningfully compared, validated, and ultimately integrated into continental-scale assessments. The emergence of ensemble methods as the second-most-frequent category offers particular promise, as these frameworks provide natural pathways for model harmonization through their capacity to incorporate diverse algorithmic perspectives into unified predictive structures as a capability that, if systematically developed, could substantially address the transferability challenge that remains the field’s most persistent obstacle to operational deployment across Africa’s heterogeneous landscapes.
The co-occurrence matrix highlights PLSR as the methodological backbone of African soil spectroscopy research. Its consistently high co-occurrence with Ensemble Methods, Indices, MARS, RF, and SVR shows that it is not only the most widely used standalone approach but also the primary reference model against which other algorithms are compared and integrated. In particular, the strong PLSR–Ensemble association suggests that ensemble frameworks are frequently constructed using PLSR as a base learner, reflecting stacking and hybrid modeling strategies rather than isolated algorithm deployment. At the same time, strong interconnections among ML algorithms (SVR, RF, GPR) reveal the emergence of a comparative modeling culture, where multiple non-linear approaches are systematically benchmarked to address the variability of soil properties and pedoclimatic conditions across Africa. This indicates a methodological shift from single-model reliance to multi-model evaluation and hybridization.
Conversely, physically based approaches such as RTM show limited integration with data-driven methods, suggesting that knowledge-driven and ML paradigms largely remain separate research streams. This fragmentation highlights an important opportunity for future research, particularly in developing hybrid-ML frameworks that combine physical constraints with statistical learning. The strong association between spectral indices and both PLSR and ensemble methods further demonstrates the continued importance of interpretable features alongside full-spectrum modeling.
The matrix suggests that while the field has developed a robust and diverse methodological toolkit (Figure 6), progress toward operational soil monitoring will depend on harmonizing these co-occurring approaches through standardized validation protocols, calibration transfer strategies, and ensemble frameworks capable of improving transferability across instruments, laboratories, and ecological zones.

5.3. Model Performance and Evaluation Metrics

To objectively assess and compare the performance of these models, a standard set of statistical metrics is used across the literature. The most common metrics are summarized below.
These diverse methodologies and robust evaluation frameworks (i.e., in Table 5) have been applied to estimate a wide range of critical soil properties across various African ecosystems.

6. Applications: Spectroscopic Estimation of Key Soil Properties in Africa

This section synthesizes the results from numerous spectroscopic studies conducted across Africa, organized by key soil properties. The goal is to evaluate the current predictive capabilities for different soil constituents, drawing on specific case studies to highlight both the significant successes and the persistent limitations of these technologies in the African context. Table 6 summarizes in a concise way the studies reviewed.
It is critical to distinguish the spectroscopic basis of these predictions. Properties such as SOC, clay content, and certain minerals exhibit direct, physically based spectral absorption features. Conversely, properties like available P, K, and heavy metals lack direct spectral activity in the VNIR-SWIR range; their prediction relies entirely on indirect inference through secondary covariance with spectrally active constituents (e.g., OM). Consequently, while direct predictions are generally robust, indirect predictions are inherently site-specific and less generalizable.

6.1. Soil Organic Carbon (SOC) and Total Nitrogen (TN)

Across diverse African ecosystems, SOC and TN are consistently the most successfully predicted properties, owing to their strong and distinct absorption features in the infrared spectrum. High predictive accuracy has been demonstrated in a variety of contexts. For instance, “good prediction” accuracy (R2 = 0.83, RMSE = 0.36%, RPD = 2.0–2.5) was achieved for SOC in Kenyan agricultural soils [27], in South African thicket biomes using both lab and field spectroscopy (R2 = 0.84, RPD = 2–2.4) [4], and in Morocco using advanced meta-learners applied to satellite data (R2 = 0.84, RPD = 2.53) [13].
The choice of spectral range is a decisive factor in model performance, with studies consistently showing that the SWIR and MIR regions are superior to VNIR alone for these properties. Mahmud et al. [27] demonstrated in Kenya that while models using the full-wave-range and the SWIR region yielded high accuracy for TN (R2 = 0.70, RMSE = 0.07%), those based solely on the VNIR region performed poorly. This reinforces findings from a study across 20 Sub-Saharan African countries by Johnson et al. [14], which concluded that combined NIR-MIR spectroscopy often provides the most robust results for a wide suite of soil fertility properties, including SOC (R2 = 0.75–0.86, RPIQ = 1.36–3.78) and TN (R2 = 0.84, RPIQ = 2.31).
Table 6. Summary of key Soil Properties estimated across Africa using spectroscopy via instance of current research. (Supplementary File S1 showcases the whole used literature).
Target Soil PropertyRegion/CountrySpectral RegionModeling AlgorithmReported PerformanceReference
SOC and TNKenyaVNIR-SWIR GPR and PLSRSOC: R2 = 0.83, RMSE = 0.36%, RPD = 2.0–2.5
TN: R2 = 0.70, RMSE = 0.07%
[27]
SOCSouth AfricaVIS-NIRPLSRR2 = 0.84, RPD = 2.0–2.4[4]
TNMoroccoVIS-NIRAdvanced meta-learnersR2 = 0.84, RPD = 2.53[13]
SOC, TN, CEC, Texture (Clay, Silt, Sand), pH, Ca, Mg, K20 SSA countriesCombined NIR-MIRPLSRSOC: R2 = 0.82, RMSE = 0.49%, RPIQ = 2.09
TN: R2 = 0.75, RMSE = 0.06%, RPIQ = 1.83
Clay/Silt: R2 = 0.76, RMSE = 8.07–8.56%, RPIQ = 2.41–3.14
Sand: R2 = 0.67, RMSE = 18.26%, RPIQ = 2.41
CEC: R2 = 0.76, RMSE = 5.57 cmolc/kg, RPIQ = 1.68
pH: R2 = 0.80, RMSE = 0.39, RPIQ = 3.09
Mg/Ca: R2 = 0.75, RMSE = 1.6–3.10, RPIQ = 1.29–1.58
Exchangeable K: R2 = 0.59, RMSE = 0.15, RPIQ = 1.01
[14]
SOC in particle-size fractionsWest AfricaNIRPLSRNon-fractionated: RPIQval = 2.4–2.5
Finest fraction (<20 µm): RPIQval = 2.2–2.3
[26]
Wet Aggregation IndicesKenyaNIRTree analysisMWD: R2 = 0.72, RMSE = 0.16 mm
GMD: R2 = 0.71, RMSE = 0.14 mm
[43]
CECEgypt (arid soils)VIS-NIRPLSRR2 = 0.81, RMSE = 1.86, RPD = 2.32[19]
Soil Salinity (EC)EgyptVIS-NIRPLSR and MARSR2 = 0.73–0.89, RPD = 1.96–2.0[17,30]
Soil pHContinental (AfSIS)VIS-NIRSoil pH index (SPI)R2 = 0.86, RMSE = 0.41[11]
oxalate-extractable phosphorus (P)MadagascarVarious spectroscopic techniquesVarious modeling techniquesP: R2 = 0.796, RPD = 2.211[24]
Heavy Metals (Pb, Zn, Ni, Cd)EgyptVNIR-SWIR (indirectly)Prediction by proxyPb/Zn: R2 = 0.66;
Ni: R2 = 0.69;
Cd: R2 = 0.52
[18]
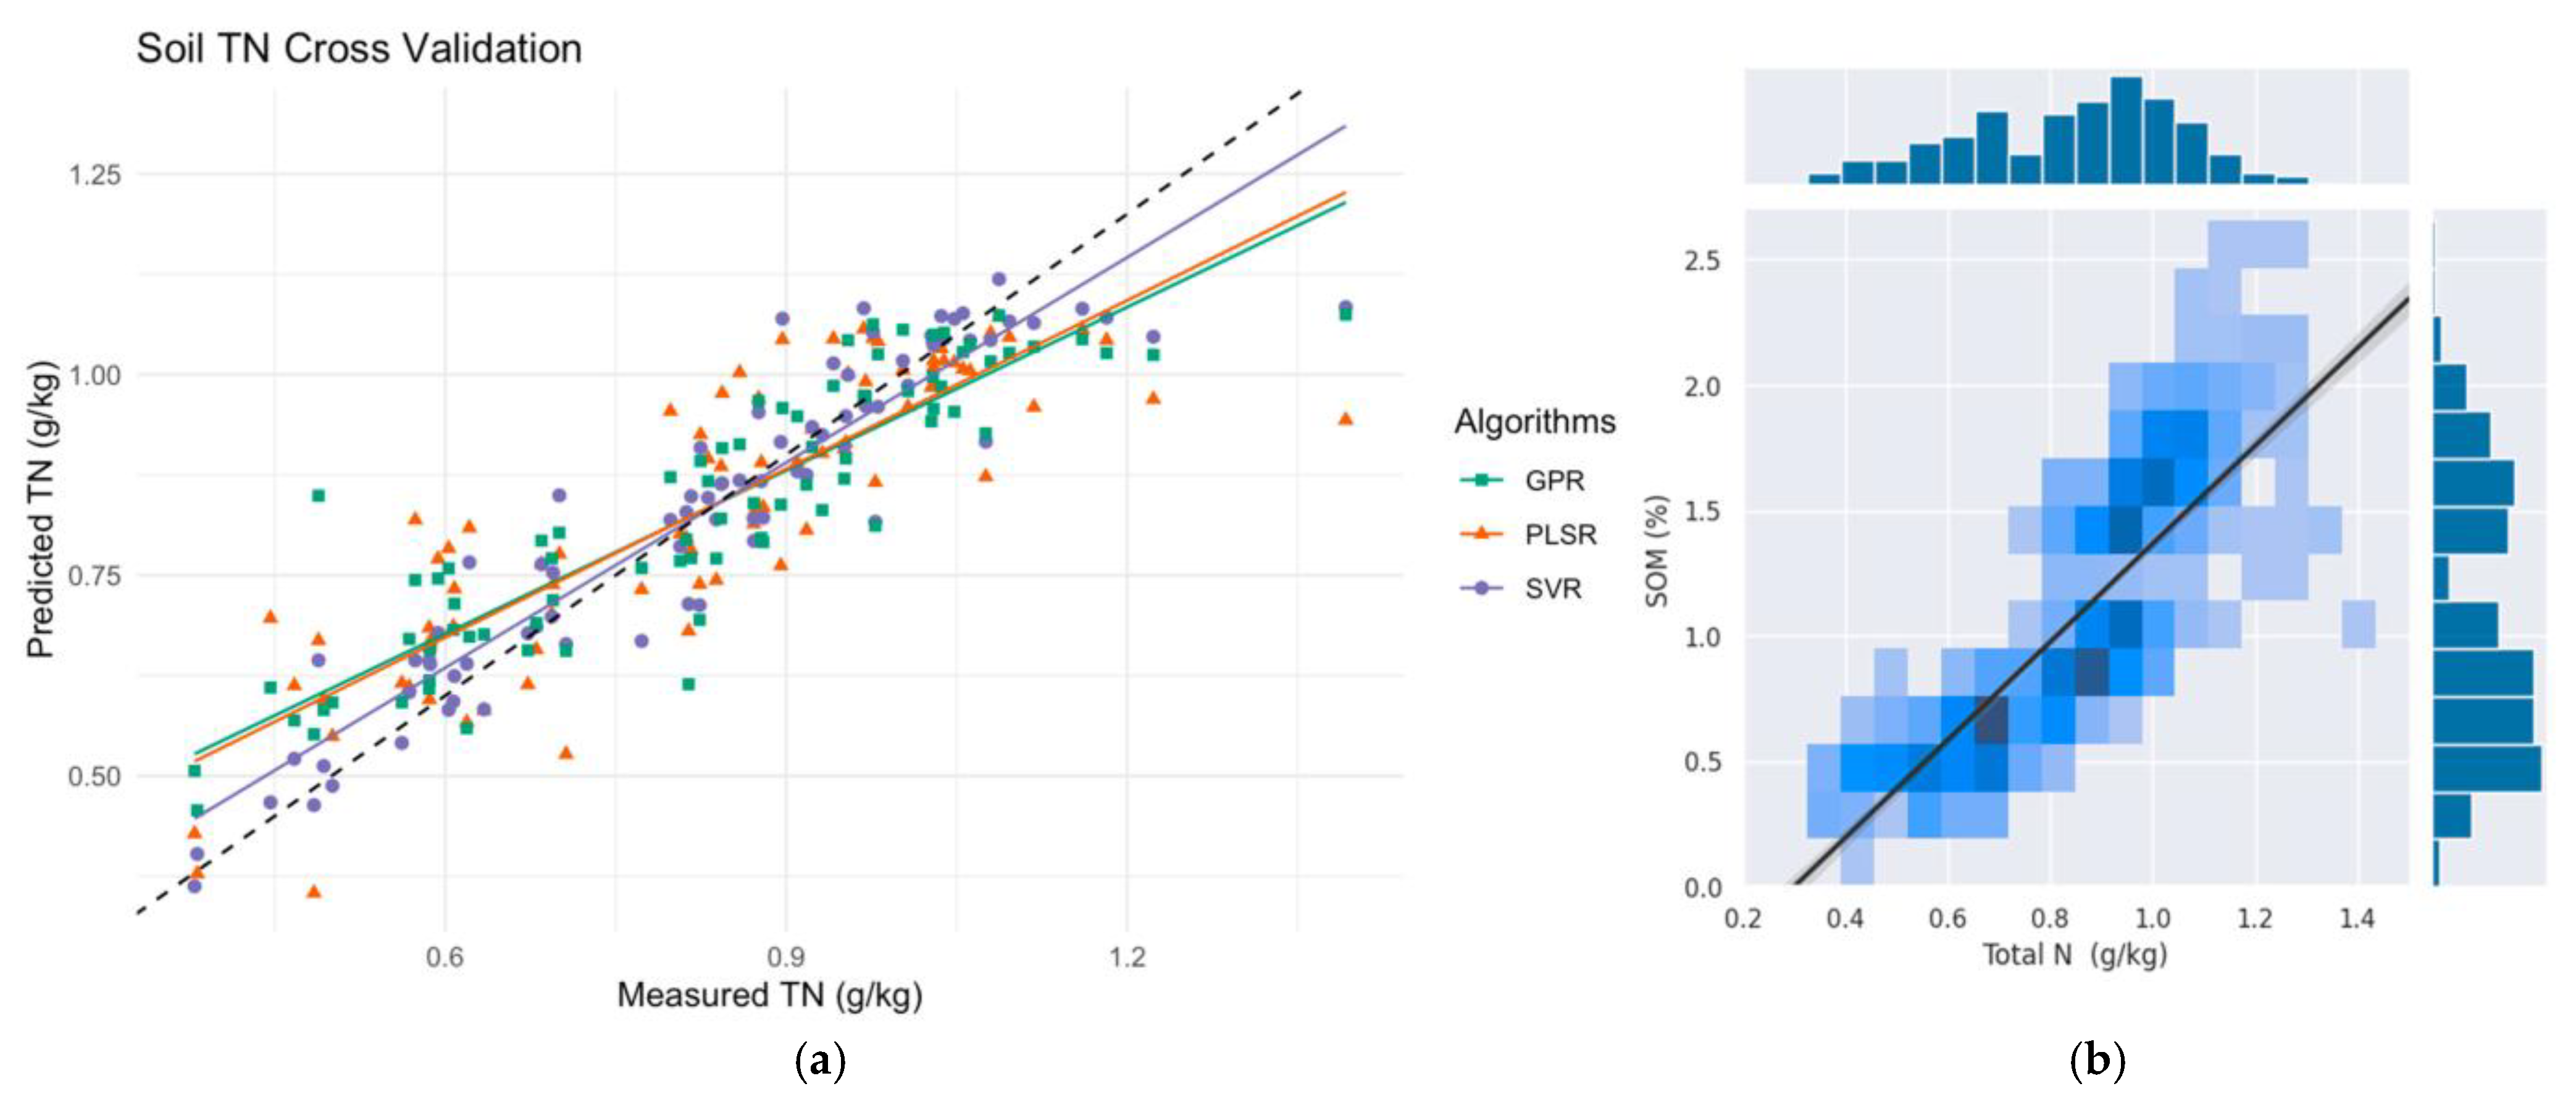
Research is also moving beyond total SOC to finer levels of detail, offering deeper insights into carbon stabilization dynamics. For example, recent work in West Africa has successfully quantified SOC for non-fractionated soil ( R P I Q v a l = 2.4–2.5) and the finest fraction (<20 µm) ( R P I Q v a l = 2.2–2.3) using NIR spectroscopy, demonstrating the potential to differentiate between labile and more stable carbon pools [26] (Figure 7). These advancements underscore the maturity of spectroscopic methods for C and N assessment.

6.2. Soil Texture, and Physical Properties

Soil texture is the relative proportions of clay, sand, and silt. It is a fundamental physical property that governs water retention, nutrient availability, and soil structure. Spectroscopic methods have shown considerable success in its estimation. For rice fields across Sub-Saharan Africa, a combination of NIR and MIR spectroscopy provided fair predictions classified as “good” models for clay and silt (R2 = 0.75–0.86, RPIQ 1.36–3.78) and sand as “satisfactory” (R2 = 0.53–0.75, RPIQ = 0.59–2.56) [14]. Beyond texture, spectroscopy has also been applied to estimate measures of soil structure and stability. A study by [43] demonstrated the potential to estimate wet aggregation indices, which are indicators of a soil’s resistance to erosion, using near-infrared spectroscopy. It shows showed an R2 = 0.72 and RMSE = 0.16 mm for Mean Weight Diameter (MWD), and an R2 = 0.71 and RMSE = 0.14 mm for Geometric Mean Diameter (GMD).

6.3. Soil Chemical Properties: pH, CEC, and Salinity

Key chemical indicators of soil fertility and health have also been successfully predicted.
Cation Exchange Capacity (CEC): This property, which measures a soil’s ability to hold essential positively charged nutrients, is highly correlated with clay and OM content, making it spectrally predictable. In arid Egyptian soils, PLSR models combined with various spectral transformations achieved a good predictive capability (R2 = 0.81, RMSE = 1.86, RPD = 2.32) [19]. In the diverse soils of SSA rice fields, CEC was also well-predicted, achieving values of R2 (0.75–0.86) and RPIQ (1.36–3.78), classified as “good” prediction models [14].
Soil Salinity (EC): The accumulation of soluble salts is a major threat to agricultural productivity in arid and semi-arid regions. Studies in Egypt have successfully used MARS models on laboratory spectra to estimate and map soil electrical conductivity (EC), achieving validation R2 values of 0.89–0.73 and an RPD of 1.96–2.0 [17,30].
Soil pH: This crucial property, which influences nutrient availability and microbial activity, has been reliably estimated. Good predictions (R2 = 0.75–0.86, RPIQ = 1.36–3.78) were achieved across SSA rice fields [14]. A novel approach using the continental AfSIS dataset led to the development of a specific soil pH index (SPI), which demonstrated high accuracy (R2 = 0.86, RMSE = 0.41) and robustness [11].

6.4. Soil Nutrients and Heavy Metals

The prediction of individual plant nutrients, minerals, and contaminants presents a more mixed picture.
Essential Plant Nutrients: Good-to-satisfactory predictions have been reported for several essential nutrients. Across SSA, exchangeable cations (like Calcium, Magnesium) have been estimated with good predictions (0.75 < R2 < 0.86; 1.36 < RPIQ < 3.78), while satisfactory predictions were achieved for exchangeable Potassium (0.53 < R2 < 0.75; 0.59 < RPIQ < 2.56) [14,24,49]. In Madagascar, they achieved good accuracy for predicting oxalate-extractable phosphorus (R2 = 0.796; RPD = 2.211) [14,24,49].
Heavy Metals: Unlike OM or Clay, heavy metals such as lead (Pb), Cadmium (Cd), nickel (Ni), and copper (Cu) are not directly spectrally active in the VNIR-SWIR range. However, they can be predicted indirectly. A study in Egypt demonstrated that heavy metal concentrations can be estimated with moderate success (R2 = 0.66 (Pb), 0.66 (Zn), 0.52 (Cd), 0.69 (Ni)) because they are often adsorbed onto or correlated with spectrally active soil components like iron oxides, clay minerals, and OM [18]. The models, therefore, predict heavy metals via their relationship with these surrogate properties. While ingenious, this ‘prediction by proxy’ approach is inherently limited; its accuracy is entirely dependent on the strength and stability of the correlation between the target metal and the spectrally active surrogates (e.g., clay, OM), a relationship that may vary significantly between different soil types and contamination sources.

7. Bridging the Scale: From Point Data to Landscape Mapping

A primary goal of soil spectroscopy is to move beyond point-based measurements to generate spatially explicit, continuous soil maps that are useful for practical applications like precision agriculture, land use planning, and environmental modeling. This up-scaling process requires the integration of point spectroscopic data (from lab or field) with wall-to-wall remote sensing imagery and geostatistical methods. This section reviews the platforms and methodologies used to bridge this critical scale gap in African contexts.

7.1. Remote Sensing Platforms for Soil Mapping

A variety of airborne and satellite sensors have been employed in African soil mapping studies, differing in their spatial and spectral resolutions.
These sensors capture data in hundreds of narrow, contiguous spectral bands, providing much richer spectral detail for identifying and quantifying soil constituents. Key platforms include spaceborne sensors e.g., PRISMA, EnMAP, and the historical Hyperion sensor, and airborne sensors as HyMap and AISA-Dual, which provide very high spatial resolution data for local-scale studies.

7.2. Critical Challenges in Up-Scaling

Direct application of models calibrated with laboratory or proximal field spectra to satellite imagery remains challenging due to scale mismatches and environmental interferences affecting the satellite signal. Several confounding factors alter the spectral response recorded at the pixel level, reducing the transferability of soil prediction models from controlled conditions to spaceborne observations.
Mixed Pixels: Mixed pixels constitute one of the primary limitations in satellite-based soil property estimation. A single pixel (e.g., 30 m × 30 m) frequently contains a heterogeneous combination of bare soil, green vegetation, crop residues (non-photosynthetic vegetation), and shadow. The sensor therefore records an integrated spectral response rather than a pure soil signature. In South Africa, Bayer et al. [25] addressed this issue using spectral mixture analysis to decompose pixel reflectance into constituent fractions. By isolating and removing vegetation and shadow components, a residual soil spectrum was derived for each pixel, enabling improved soil organic carbon prediction. This spectral unmixing strategy enhances the retrieval of soil-specific information from mixed satellite observations.
Additional Confounding Factors: Beyond spectral mixing, several environmental and physical factors further complicate model transferability. Soil moisture variations significantly modify reflectance by darkening the surface and attenuating diagnostic absorption features. Surface roughness influences bidirectional reflectance properties and alters light scattering behavior. Moreover, inadequate atmospheric correction can introduce distortions in the recorded signal, masking subtle soil spectral characteristics. These factors collectively highlight the need for rigorous pre-processing and correction procedures when applying laboratory-calibrated models to satellite imagery.
While the primary evidentiary corpus of this review is restricted to African soils, the challenge of environmental confounding factors is universal. To methodologically illustrate how integrating spectral indices and terrain attributes mitigates these effects, we draw on a contextual example from the Songnen Plain in Northeast China (Bao et al. [54]). Bao et al. [54] demonstrated that incorporating spectral indices, terrain attributes, and spectral texture features significantly improves the prediction of soil organic carbon from hyperspectral imagery, accounting for environmental confounding factors. The resulting SOC map illustrates these effects, highlighting enhanced spatial representation across different soil classes, as illustrated in the Graphical abstract of [54].
Scientific progress is increasingly anticipated to arise from integrated frameworks that combine multiple sensors, platforms, and analytical methods. By fusing optical data with microwave and thermal-infrared observations, it becomes possible to more effectively disentangle soil salinity from transient moisture variations and surface-state influences. Where available, hyperspectral measurements can be incorporated to enhance the specificity and accuracy of diagnostic assessments, providing complementary spectral detail that strengthens soil property characterization [55].

7.3. Methodologies for Large-Area Digital Soil Mapping

To overcome these challenges, researchers in Africa have developed and applied several innovative strategies for generating large-area soil maps.
Time-series compositing provides an effective methodological solution to mitigate the limitations imposed by vegetation cover and mixed pixels in optical soil mapping. This approach exploits multi-temporal satellite imagery acquired over several seasons or years to identify periods when soils are temporarily exposed, such as post-harvest or pre-sowing stages. By isolating these bare soil observations across multiple acquisition dates, pixels can be aggregated into a composite bare-soil image that substantially increases spatial coverage compared to any single-date scene.
Geostatistical integration represents a robust framework for large-area digital soil mapping by combining sparse, high-accuracy field observations with spatially exhaustive auxiliary variables derived from remote sensing.
Lagacherie et al. [16] and Ciampalini et al. [33] showed that incorporating spectrally derived surface information significantly improves the spatial prediction of deeper soil properties by exploiting cross-correlations between surface reflectance patterns and subsurface variability. This approach strengthens the methodological framework for large-area digital soil mapping in data-scarce environments.
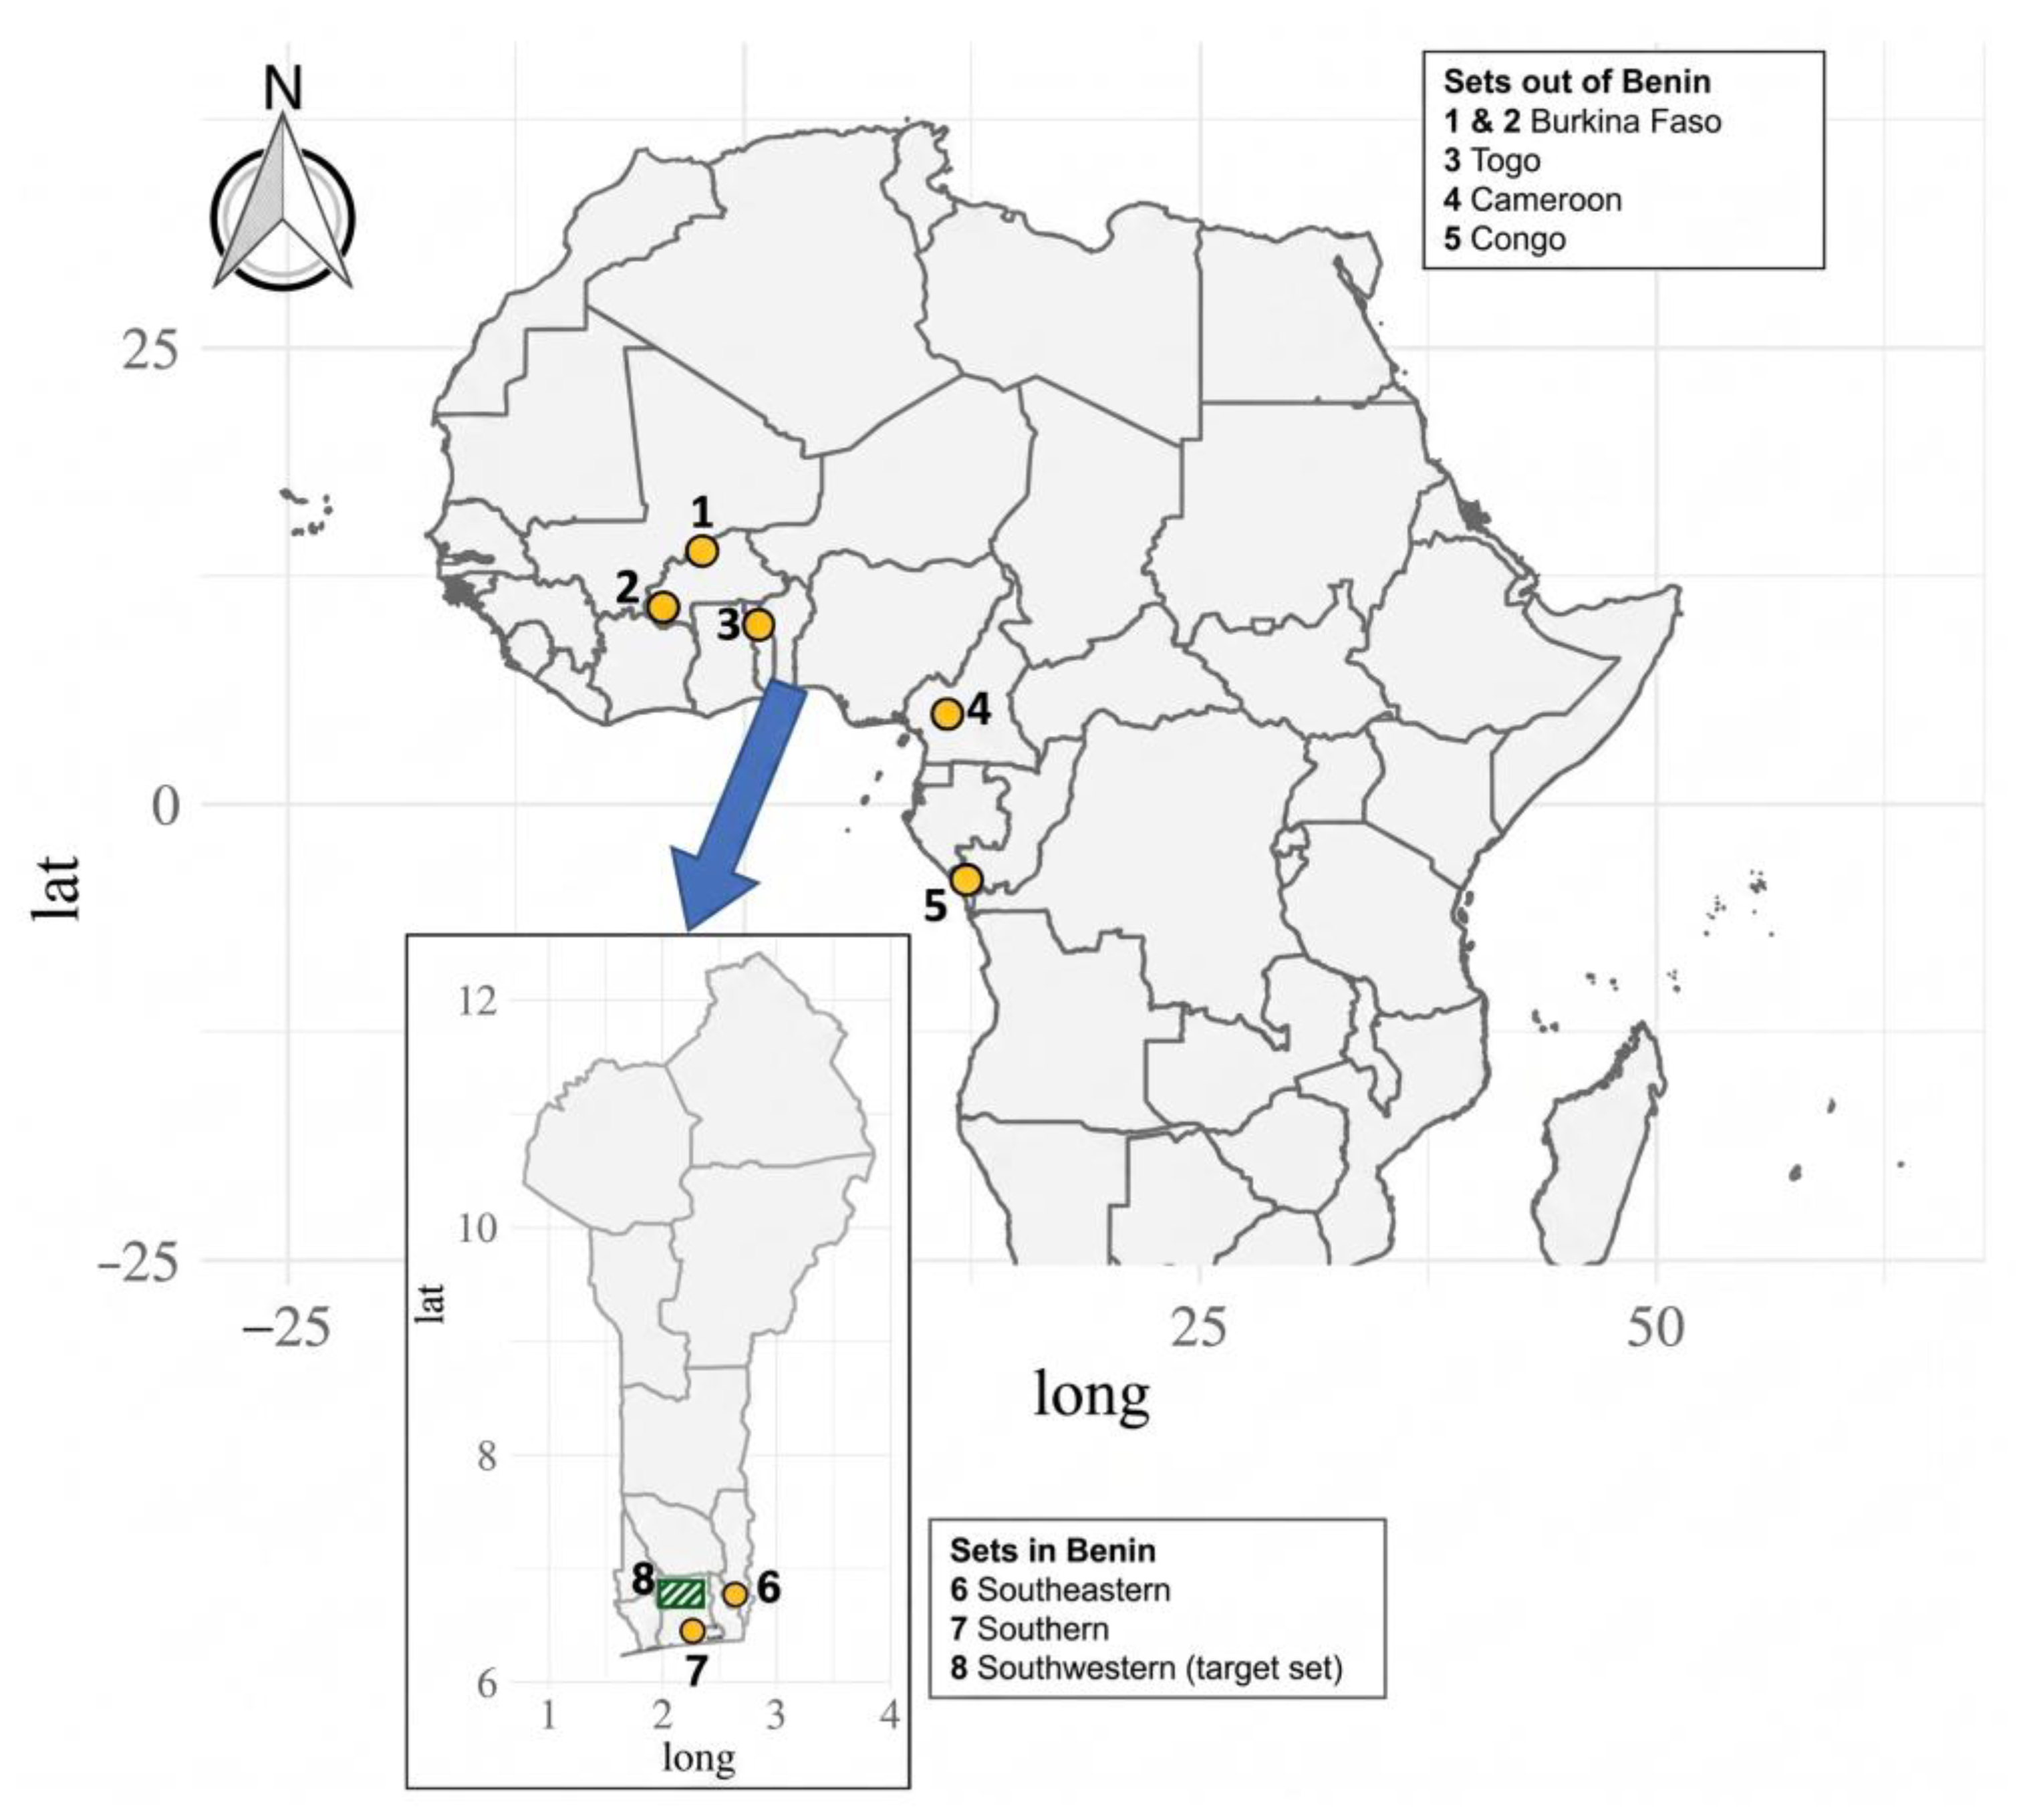
With the increasing availability of high-quality hyperspectral satellite data, predictive models calibrated with field spectra can now be directly transferred to image pixels for spatially continuous soil property mapping. Misbah et al. [13] applied ensemble band selection to PRISMA imagery, linking ground-measured soil samples with corresponding pixel spectra and subsequently extending the calibrated model across the full scene to quantify soil total nitrogen (Figure 8). Likewise, Bouslihim and Bouasria [38] evaluated EnMAP hyperspectral data for SOM prediction, combining spectral preprocessing, feature selection, and Partial Least Squares Regression to generate landscape-scale maps directly from satellite pixels. Using PRISMA imagery over Khouribga (northern Morocco), Gasmi et al. [15] demonstrated that Random Forest with embedded feature selection improved the prediction of SOM, P2O5, and K2O, with further accuracy gains achieved through RF–residual kriging integration. These studies exemplify the operational workflow of direct model application in satellite-based soil property estimation.
These applications reveal the clear potential of integrated spectroscopic and remote sensing approaches for digital soil mapping, but they also highlight significant gaps and challenges that need to be addressed for these technologies to become fully operational.

7.4. Mapping Subsurface Properties

Optical remote sensing is limited to the top few millimeters of the soil. An innovative approach to map properties at depth was demonstrated in Tunisia by Lagacherie et al. [16]. The method involved calibrating surface-to-subsurface transfer functions using a database of legacy soil profiles to learn the relationship between surface properties and those at various depths (e.g., 30–60 cm, 60–100 cm). Applying these functions to hyperspectral-derived surface soil maps allowed for the creation of predictive maps for subsurface clay and CEC, effectively extending the 2D surface information into the third dimension.

8. Discussion: Synthesis, Persistent Gaps, and Future Directions

The preceding sections have detailed the methods, applications, and scaling strategies for soil spectroscopy in Africa. This section provides a critical synthesis of these findings, explicitly defines the most significant remaining research gaps, and proposes a forward-looking agenda for research and development. The evidence demonstrates a technology with immense potential, but one that is still facing fundamental hurdles on the path to widespread operational deployment across the continent.

8.1. Synthesis of the State of the Art

A clear picture of capabilities emerges from this review. Certain soil properties are now predicted with high confidence, while others remain challenging.
Predictive Performance: Properties that are major soil constituents or are strongly correlated with them, such as Soil Organic Carbon (SOC), clay content, and Cation Exchange Capacity (CEC), are consistently predicted with good to excellent accuracy across many studies. In contrast, properties that are present in low concentrations or are less directly linked to spectrally active components, such as available Phosphorus (P), Potassium (K), and some micronutrients, remain more difficult to estimate reliably.
Spectral Regions: The choice of spectral region is critical. While the VNIR region has utility for some properties, many studies conclude that incorporating the SWIR and MIR regions significantly improves predictive power. Combined NIR-MIR spectroscopy often yields the best performance for a wide range of properties [14], while the SWIR region is particularly critical for robust SOC estimation [27].
Modeling Choices: In soil spectroscopy, PLSR remains a widely used and robust linear approach for predicting soil properties from spectral data [56,57]. However, its linear formulation may limit predictive accuracy when the relationship between spectral reflectance and target nutrients becomes nonlinear [58]. In such cases, ML algorithms including SVR, ANNs, and ensemble models can better capture nonlinear patterns, sometimes resulting in improved predictive performance [59,60,61].
Nevertheless, the advantage of machine learning is not systematic. These models are particularly beneficial when soil–spectral relationships are strongly nonlinear, when the feature space is high-dimensional and affected by multicollinearity, or when interactions among soil constituents influence spectral responses [62,63,64]. Conversely, their performance may decline when training datasets are small, since complex models require sufficient data to avoid overfitting [58]. When soil–spectral relationships are approximately linear—such as for certain clay or moisture estimations in relatively homogeneous soils—PLSR can provide comparable or even better generalization with lower computational demand and greater interpretability [65,66]. In addition, machine learning models may offer limited benefit when applied to spectral domains or soil conditions that differ substantially from the calibration data without appropriate transfer learning or domain adaptation [67]. Therefore, model selection should consider dataset size, the degree of nonlinearity, and the intended application context rather than systematically favoring more complex algorithms. In the current review, PLSR remains a robust and reliable workhorse, particularly for smaller datasets. However, where sufficient calibration data are available, advanced machine learning algorithms (e.g., Random Forest, SVR) and especially ensemble methods (e.g., stacking, meta-learners) consistently outperform single-model approaches by leveraging the complementary strengths of different algorithms.

8.2. The Research Gap for Soil Spectroscopy in Africa

Despite these successes, several fundamental gaps are hindering the transition from localized research projects to operational, continent-wide soil monitoring systems. Furthermore, while this review adopts a continental perspective, the current literature is characterized by significant spatial bias. Among the evaluated studies, research is heavily skewed toward North Africa (36.7%) and East Africa (26.5%), while Central Africa (2.0%) remains vastly underrepresented. Consequently, generalizations regarding model performance across the entire continent must be made with caution until data from these underrepresented regions are integrated.
Lack of Standardized, Representative African SSLs: This is arguably the most significant barrier. While initiatives like AfSIS and GEO-CRADLE represent crucial first steps, Africa still lacks a comprehensive, standardized, and open-access Soil Spectral Library that adequately covers its vast pedoclimatic diversity. This fragmentation is perpetuated by a lack of standardized measurement protocols, which makes it difficult to merge regional datasets into a cohesive, continental-scale library, a core challenge that initiatives like GEO-CRADLE sought to address [12].
Model Transferability: Closely related to the SSL gap is the “transferability problem.” Models developed in one region, with a specific soil type, and using a particular sensor often fail when applied to another region or a different sensor. Differences in soil mineralogy, climate, land use, and instrument specifications mean that calibrations are often not robust enough to be transferred. This lack of transferability is a major barrier to operational use, as it implies that extensive local calibration is always required. Given the extreme well recognized pedoclimatic heterogeneity of African soils, the development of a singular, robust continental predictive model remains highly challenging. Future large-scale applications may be more successful by focusing on regional, biome-specific models or localized memory-based learning approaches rather than forcing a universal fit.
The deficiency of multi-source sensor implementation: The analysis of platform utilization highlights a clear methodological hierarchy in soil spectroscopy research across Africa. Laboratory spectroscopy remains dominant, reflecting its central role in developing high-precision calibration models under controlled conditions. Satellite-based approaches constitute the second major group (Figure 4), demonstrating strong interest in scaling soil property estimation to regional extents. In contrast, field spectroscopy and airborne platforms are comparatively less represented, despite their potential to bridge laboratory accuracy and satellite coverage. Integrated multi-platform strategies remain limited, with combined approaches accounting for fewer than 10 studies. This imbalance indicates a fragmented methodological landscape, where calibration and validation datasets are rarely developed across scales. Such fragmentation directly affects model transferability and operational deployment. The limited integration of intermediate-scale datasets may constrain the full exploitation of recent hyperspectral missions such as EnMAP and PRISMA. Overall, the results reveal a need for more coordinated, multi-scale observational frameworks to enhance robustness and scalability of soil spectroscopy applications in Africa.
Despite significant progress in African soil spectroscopy, a critical methodological rift persists regarding model transferability across laboratory, proximal, and spaceborne platforms. Our synthesis reveals a stark hierarchy that prioritizes controlled-condition calibration over operational cross-scale validation, with integrated multi-platform studies accounting for fewer than ten cases. This fragmentation is driven by three systemic dimensions: 1st, an increasing instrumental heterogeneity between high-fidelity spectroradiometers and emerging hyperspectral missions (Table 2) lacking standardized calibration transfer protocols; 2nd, a dearth of explicit inter-platform experiments that utilize source-target sensor validation under African pedoclimatic contexts; and 3rd, the failure to quantify environmental confounding factors, such as variable moisture and surface roughness, via physically based transfer learning or domain adaptation frameworks. Consequently, current spaceborne mapping efforts (e.g., [13,15]) often adopt a pragmatic but evasive strategy by recalibrating models directly on image pixels, bypassing the fundamental requirement for spectral harmonization. Until transferability is transitioned from a recognized limitation to a main design criterion supported by co-located (to ensure harmonized studies), multi-scale measurements, the deployment of spectroscopy for continental-scale monitoring in Africa will remain functionally constrained.
Subsurface Property Estimation: Spectroscopy is fundamentally a surface technique, with an effective penetration depth of only a few millimeters. Mapping the properties of subsurface soil horizons, which are critical for root growth and water storage, remains a major challenge. While geostatistical methods can help extrapolate surface information downwards using legacy soil profile data [16], such profile data are extremely scarce across much of Africa.
Integration with Proximal and Remote Sensing: There are still significant challenges in seamlessly integrating data from different scales and platforms. Harmonizing spectra from in-situ field sensors, airborne campaigns, and a growing constellation of satellite platforms requires advanced calibration transfer and data fusion techniques that are still in active development.
Variability in Laboratory Reference Methods: A frequently overlooked barrier to spectral harmonization is the variability inherent in the traditional laboratory reference methods used for calibration. Because spectroscopic models are entirely empirical, discrepancies in wet chemistry analytical protocols across various African laboratories introduce significant baseline errors. This variability strongly affects model performance and limits the comparability of spectral libraries across different studies.

8.3. Future Directions and Recommendations

The descriptive synthesis reveals that while traditional linear models like PLSR are effective for localized, single-sensor studies, they fundamentally fail to address the ‘transferability problem’ across Africa’s diverse pedoclimatic zones. Consequently, achieving continental-scale operationalization necessitates a prescriptive shift toward AI, domain adaptation, and transfer learning, which are uniquely suited to harmonize disparate data sources. Addressing these gaps requires a coordinated, forward-looking research agenda. The following directions are proposed:
Collaborative SSL Development: A pan-African, multi-institutional initiative is needed to build a unified, open-access SSL. This effort must prioritize the adoption of standardized measurement protocols and the strategic sampling of Africa’s diverse soil landscapes to ensure the library is truly representative. Institutional partnerships (e.g., national geological surveys, agricultural research institutions, international consortia) and potential funding mechanisms shall operationalize the SSL development.
Leveraging New Hyperspectral Missions: The recent and forthcoming availability of public hyperspectral satellite missions, including EnMAP, PRISMA, and HISUI, presents an unprecedented opportunity. These sensors can move digital soil mapping from a local to a regional and even continental endeavor. Research should focus on developing robust methods to exploit these rich datasets.
Advanced AI and Model Harmonization: Prioritize research into model harmonization and calibration transfer methods to develop sensor-agnostic predictive models. This includes exploring advanced AI approaches like transfer learning and domain adaptation, which are designed to improve model generalizability across different instruments, regions, and data acquisition conditions.
Operational Integration: The ultimate goal is to translate predictive models into practical tools. The focus should shift towards developing user-friendly decision-support systems that integrate spectroscopic soil predictions into actionable recommendations for farmers (e.g., for variable-rate fertilization), land managers, and policymakers. This will enable the use of spectroscopic data for applications such as carbon accounting and land degradation monitoring, thereby providing a direct mechanism for monitoring and achieving progress towards SDGs 2, 13, and 15.

8.4. Limitations and Recommendations for Future Review

A key limitation of this review is the highly uneven geographical distribution of the 51 included studies. Despite our systematic and strict inclusion criteria, the available peer-reviewed literature is heavily biased toward certain regions, with a pronounced lack of data from West and Central Africa. Consequently, our synthesis cannot support definitive continent-wide generalizations about soil spectral properties (direct or indirect). Future reviews and primary research should prioritize targeted soil spectroscopy data collection in West and Central Africa, focusing on under-represented soil types (e.g., tropical Ferralsols) and land uses. Concurrently, establishing publicly available soil spectral libraries from these regions would directly reduce geographic bias in subsequent meta-analyses. Multi-institutional sampling campaigns (e.g., through AfSIS) are needed to explicitly fill spatial gaps before new continental-scale reviews are attempted.

9. Conclusions and Recommendations

Soil spectroscopy provides a highly scalable and rapid alternative for soil assessment across the African continent. This comprehensive review has systematically synthesized nearly two decades of research, demonstrating unequivocally:
  • A clear methodological dominance is highlighted, where laboratory-based VIS–NIR spectroscopy and PLSR overwhelmingly dominate the current African research landscape.
  • The predictive performance of soil spectroscopy largely depends on the intrinsic spectral responsiveness of the targeted soil properties. Attributes with direct spectral signatures, e.g., SOC, Clay are generally estimated with relatively high reliability at local to sub-regional scales when appropriate spectroscopic configurations and robust modeling frameworks are applied. In contrast, properties that lack direct spectral expression, including available phosphorus and certain heavy metals, are inferred indirectly through correlations with spectrally active constituents, resulting in prediction accuracies that are strongly dependent on local soil conditions and dataset characteristics.
  • Platform Imbalance and unstandardized analytical protocol is pinpointed. There is a critical scaling gap caused by an overreliance on point-based laboratory studies and a lack of intermediate airborne or field-based frameworks to bridge the transition to satellite mapping.
  • Structural Barriers: The absence of a standardized, open-access pan-African Soil Spectral Library (SSL) fundamentally restricts model transferability across diverse pedoclimatic zones.
The ultimate realization of soil spectroscopy’s transformative potential in Africa hinges upon the research community’s capacity to transition from these isolated predictive successes toward the development of decision-support systems that integrate spectroscopic predictions into actionable recommendations for farmers, land managers, and policymakers. Such systems must be co-designed with end-users to ensure that soil information is delivered at spatial scales, temporal frequencies, and levels of interpretability that meaningfully inform variable-rate fertilization, carbon sequestration monitoring, land degradation assessment, and progress tracking toward the SDGs that depend fundamentally upon healthy soils. The path forward is demanding, requiring sustained investment, institutional commitment, and scientific creativity, yet the foundational work synthesized in this review demonstrates unequivocally that the underlying technology possesses the requisite capabilities. What remains is the collective will to forge the collaborative infrastructure, methodological harmonization, and operational frameworks that can translate these capabilities into the data-rich edaphic intelligence that Africa’s sustainable development imperatives so urgently demand and so richly deserve.
Clear recommendations have been pinpointed, where addressing these foundational gaps demands a coordinated, multi-institutional research agenda that transcends the episodic and project-specific collaborations that have characterized the field to date:
  • To address the severe data fragmentation and platform imbalances identified in our evaluation of data sources, the priority must be the deliberate construction of a pan-African soil spectral library through strategic partnerships that unite national geological surveys, agricultural research institutions, and international consortia around standardized measurement protocols, rigorous quality assurance frameworks, and open-data principles that ensure accessibility and long-term sustainability.
  • Concurrently, the research community must capitalize upon the unprecedented opportunity presented by new-generation hyperspectral satellite missions, including EnMAP and PRISMA, by developing robust methodologies for atmospheric correction, mixed-pixel decomposition, and scale-aware modeling that can translate the spectral richness of spaceborne observations into reliable soil property estimates across the continent’s vast and often inaccessible terrains.
  • Finally, to overcome the analytical limitations identified in our review of modeling frameworks specifically the historical overreliance on linear models like PLSR, these efforts must be complemented by advances in AI and ML that move beyond algorithm benchmarking toward genuine model harmonization, employing transfer learning, domain adaptation, ensemble frameworks, and DL is essential to rendering predictions robust across the instrument heterogeneity and pedoclimatic diversity that currently preclude operational deployment.

Supplementary Materials

The following supporting information can be downloaded at: https://www.mdpi.com/article/10.3390/environments13040228/s1, Table S1: Database of included and excluded studies used in this review; Table S2: PRISMA 2020 Checklist [10].

Author Contributions

All the authors have contributed substantially to the submitted manuscript. Conceptualization, M.H. and A.L.; methodology, M.H., A.L. and S.H.; software, M.H. and S.H.; validation, M.H.; formal analysis, M.H. and S.H.; investigation, M.H.; resources, A.L. and A.C.; data curation, M.H. and S.H.; writing—original draft preparation, M.H. and A.L.; writing—review and editing, A.L., S.H., F.S. and A.C.; visualization, M.H. and S.H.; supervision, A.L. and A.C.; project administration, A.L.; funding acquisition, A.L. and A.C. All authors have read and agreed to the published version of the manuscript.

Funding

This research was funded by the Mohammed VI Polytechnic University (UM6P). through AgriEdge. The lead author received financial support from AgriEdge-UM6P.

Data Availability Statement

The original contributions presented in this study are included in the article/Supplementary Material. Further inquiries can be directed to the corresponding author.

Acknowledgments

This study was conducted within the framework of AgriEdge-UM6P PhD program, financially supported by the OCP Foundation UM6P. The authors acknowledge all the technical support of those who helped in initiating and developing this work. During the preparation of this manuscript/study, the authors used Grammarly v.1.2.236.1843 for the purposes of language enhancement, grammar correction, and improving the readability of the text. The authors have reviewed and edited the output and take full responsibility for the content of this publication.

Conflicts of Interest

The authors declare no conflicts of interest.

Abbreviations

The following abbreviations are used in this manuscript:
AfSISAfrica Soil Information Service
AfricaRiceAfrica Rice Center
AIArtificial Intelligence
ANNArtificial Neural Network
ASDAnalytical Spectral Devices
CECCation Exchange Capacity
CFSCorrelation-based Feature Selection
CNNConvolutional Neural Network
CRContinuum Removal
DTDe-trending
DLDeep Learning
ECElectrical Conductivity
EnMAPEnvironmental Mapping and Analysis Program
FT-IRFourier-Transform Infrared
GAGenetic Algorithm
GA-PLSGenetic Algorithm-Partial Least Squares
GISGeographic Information System
GPRGaussian Process Regression
HSIHyperspectral Imaging
HISUIHyperspectral Imager Suite
ISDAInnovated Solutions for Decision Agriculture
LGRLocal Gaussian Regression
LUCASLand Use and Coverage Area Frame Survey
MARSMultivariate Adaptive Regression Splines
MBLMemory-Based Learning
MIRMid-Infrared
MIRSMid-Infrared Spectroscopy
MLMachine Learning
MLRMultiple Linear Regression
NIRNear-Infrared
OMOrganic Matter
PLSRPartial Least Squares Regression
PRISMAPRecursore IperSpettrale della Missione Applicativa
PRISMA 2020Preferred Reporting Items for Systematic Reviews and Meta-Analyses
RBFRadial Basis Function
RFRandom Forest
RFERecursive Feature Elimination
RMSERoot Mean Square Error
RPDRatio of Performance to Deviation
RPIQRatio of Performance to Interquartile Range
SDGSustainable Development Goal
SGSavitzky-Golay
SNSoil Nitrogen
SNVStandard Normal Variate
SOCSoil Organic Carbon
SOMSoil Organic Matter
SPISoil pH Index
SSASub-Saharan Africa
SSLSoil Spectral Library
SVRSupport Vector Regression
SWIRShort-Wave Infrared
TATerrain Attribute
TFTexture Feature
TMThematic Mapper
TNTotal Nitrogen
UM6PMohammed VI Polytechnic University
VISVisible
VNIRVisible and Near-Infrared

References

  1. Tziolas, N.; Tsakiridis, N.; Ogen, Y.; Kalopesa, E.; Ben-Dor, E.; Theocharis, J.; Zalidis, G. An integrated methodology using open soil spectral libraries and Earth Observation data for soil organic carbon estimations in support of soil-related SDGs. Remote Sens. Environ. 2020, 244, 111793. [Google Scholar] [CrossRef]
  2. El Bouanani, N.; Laamrani, A.; Hajji, H.; Bourriz, M.; Bourzeix, F.; Ait Abdelali, H.; El-Battay, A.; Amazirh, A.; Chehbouni, A. Estimating soil attributes for yield gap reduction in Africa using hyperspectral remote sensing data with artificial intelligence methods: An extensive review and synthesis. Remote Sens. 2025, 17, 1597. [Google Scholar] [CrossRef]
  3. Johnson, J.-M.; Sila, A.; Senthilkumar, K.; Shepherd, K.D.; Saito, K. Application of infrared spectroscopy for estimation of concentrations of macro- and micronutrients in rice in sub-Saharan Africa. Field Crops Res. 2021, 270, 108222. [Google Scholar] [CrossRef]
  4. Nocita, M.; Kooistra, L.; Bachmann, M.; Mueller, A.; Powell, M.; Weel, S. Predictions of soil surface and topsoil organic carbon content through the use of laboratory and field spectroscopy in the Albany Thicket Biome of Eastern Cape Province of South Africa. Geoderma 2011, 167–168, 295–302. [Google Scholar] [CrossRef]
  5. Pudełko, A.; Chodak, M.; Roemer, J.; Uhl, T. Application of FT-NIR spectroscopy and NIR hyperspectral imaging to predict nitrogen and organic carbon contents in mine soils. Measurement 2020, 164, 108117. [Google Scholar] [CrossRef]
  6. Raj, A.; Chakraborty, S.; Duda, B.M.; Weindorf, D.C.; Li, B.; Roy, S.; Sarathjith, M.; Das, B.S.; Paulette, L. Soil mapping via diffuse reflectance spectroscopy based on variable indicators: An ordered predictor selection approach. Geoderma 2018, 314, 146–159. [Google Scholar] [CrossRef]
  7. Shi, T.; Chen, Y.; Liu, H.; Wang, J.; Wu, G. Soil organic carbon content estimation with laboratory-based visible–near-infrared reflectance spectroscopy: Feature selection. Appl. Spectrosc. 2014, 68, 831–837. [Google Scholar] [CrossRef]
  8. Yu, B.; Yan, C.; Yuan, J.; Ding, N.; Chen, Z. Prediction of soil properties based on characteristic wavelengths with optimal spectral resolution by using Vis-NIR spectroscopy. Spectrochim. Acta Part A Mol. Biomol. Spectrosc. 2023, 293, 122452. [Google Scholar] [CrossRef]
  9. Zhang, Z.; Ding, J.; Zhu, C.; Wang, J. Combination of efficient signal pre-processing and optimal band combination algorithm to predict soil organic matter through visible and near-infrared spectra. Spectrochim. Acta Part A Mol. Biomol. Spectrosc. 2020, 240, 118553. [Google Scholar] [CrossRef]
  10. Page, M.J.; McKenzie, J.E.; Bossuyt, P.M.; Boutron, I.; Hoffmann, T.C.; Mulrow, C.D.; Shamseer, L.; Tetzlaff, J.M.; Akl, E.A.; Brennan, S.E. The PRISMA 2020 statement: An updated guideline for reporting systematic reviews. BMJ 2021, 372, n71. [Google Scholar] [CrossRef]
  11. Jain, S.; Sethia, D.; Tiwari, K.C. Developing novel spectral indices for precise estimation of soil pH and organic carbon with hyperspectral data and machine learning. Environ. Monit. Assess. 2024, 196, 1255. [Google Scholar] [CrossRef]
  12. Tziolas, N.; Tsakiridis, N.; Ben-Dor, E.; Theocharis, J.; Zalidis, G. A memory-based learning approach utilizing combined spectral sources and geographical proximity for improved VIS-NIR-SWIR soil properties estimation. Geoderma 2019, 340, 11–24. [Google Scholar] [CrossRef]
  13. Misbah, K.; Laamrani, A.; Voroney, P.; Khechba, K.; Casa, R.; Chehbouni, A. Ensemble Band Selection for Quantification of Soil Total Nitrogen Levels from Hyperspectral Imagery. Remote Sens. 2024, 16, 2549. [Google Scholar] [CrossRef]
  14. Johnson, J.-M.; Vandamme, E.; Senthilkumar, K.; Sila, A.; Shepherd, K.D.; Saito, K. Near-infrared, mid-infrared or combined diffuse reflectance spectroscopy for assessing soil fertility in rice fields in sub-Saharan Africa. Geoderma 2019, 354, 113840. [Google Scholar] [CrossRef]
  15. Gasmi, A.; Gomez, C.; Chehbouni, A.; Dhiba, D.; El-Gharous, M. Using PRISMA Hyperspectral Satellite Imagery and GIS Approaches for Soil Fertility Mapping (FertiMap) in Northern Morocco. Remote Sens. 2022, 14, 4080. [Google Scholar] [CrossRef]
  16. Lagacherie, P.; Sneep, A.-R.; Gomez, C.; Bacha, S.; Coulouma, G.; Hamrouni, M.H.; Mekki, I. Combining Vis-NIR hyperspectral imagery and legacy measured soil profiles to map subsurface soil properties in a Mediterranean area (Cap-Bon, Tunisia). Geoderma 2013, 209–210, 168–176. [Google Scholar] [CrossRef]
  17. Nawar, S.; Buddenbaum, H.; Hill, J.; Kozak, J. Modeling and mapping of soil salinity with reflectance spectroscopy and landsat data using two quantitative methods (PLSR and MARS). Remote Sens. 2014, 6, 10813–10834. [Google Scholar] [CrossRef]
  18. Omran, E.-S.E. Inference model to predict heavy metals of Bahr El Baqar soils, Egypt using spectroscopy and chemometrics technique. Model. Earth Syst. Environ. 2016, 2, 1–17. [Google Scholar] [CrossRef]
  19. Omran, E.-S.E. Rapid soil analyses using modern sensing technology: Toward a more sustainable agriculture. In Sustainability of Agricultural Environment in Egypt: Part II; The Handbook of Environmental Chemistry; Springer: Cham, Switzerland, 2019; Volume 77, pp. 3–29. [Google Scholar] [CrossRef]
  20. Pellikka, P.; Luotamo, M.; Sädekoski, N.; Hietanen, J.; Vuorinne, I.; Rasanen, M.; Heiskanen, J.; Siljander, M.; Karhu, K.; Klami, A. Tropical altitudinal gradient soil organic carbon and nitrogen estimation using Specim IQ portable imaging spectrometer. Sci. Total Environ. 2023, 883, 163677. [Google Scholar] [CrossRef] [PubMed]
  21. Brown, D.J. Using a global VNIR soil-spectral library for local soil characterization and landscape modeling in a 2nd-order Uganda watershed. Geoderma 2007, 140, 444–453. [Google Scholar] [CrossRef]
  22. Barthès, B.G.; Kouakoua, E.; Clairotte, M.; Lallemand, J.; Chapuis-Lardy, L.; Rabenarivo, M.; Roussel, S. Performance comparison between a miniaturized and a conventional near infrared reflectance (NIR) spectrometer for characterizing soil carbon and nitrogen. Geoderma 2019, 338, 422–429. [Google Scholar] [CrossRef]
  23. Ramifehiarivo, N.; Barthès, B.G.; Cambou, A.; Chapuis-Lardy, L.; Chevallier, T.; Albrecht, A.; Razafimbelo, T. Comparison of near and mid-infrared reflectance spectroscopy for the estimation of soil organic carbon fractions in Madagascar agricultural soils. Geoderma Reg. 2023, 33, e00638. [Google Scholar] [CrossRef]
  24. Kawamura, K.; Tsujimoto, Y.; Nishigaki, T.; Andriamananjara, A.; Rabenarivo, M.; Asai, H.; Rakotoson, T.; Razafimbelo, T. Laboratory visible and near-infrared spectroscopy with genetic algorithm-based partial least squares regression for assessing the soil phosphorus content of upland and lowland rice fields in Madagascar. Remote Sens. 2019, 11, 506. [Google Scholar] [CrossRef]
  25. Bayer, A.D.; Bachmann, M.; Mueller, A.; Kaufmann, H. A Comparison of feature-based MLR and PLS regression techniques for the prediction of three soil constituents in a degraded South African Ecosystem. Appl. Environ. Soil Sci. 2012, 2012, 971252. [Google Scholar] [CrossRef]
  26. Cambou, A.; Houssoukpèvi, I.A.; Chevallier, T.; Moulin, P.; Rakotondrazafy, N.M.; Fonkeng, E.E.; Harmand, J.-M.; Aholoukpè, H.N.S.; Amadji, G.L.; Tabi, F.O.; et al. Quantification of soil organic carbon in particle size fractions using a near-infrared spectral library in West Africa. Geoderma 2024, 443, 116818. [Google Scholar] [CrossRef]
  27. Mahmud, A.; Luotamo, M.; Karhu, K.; Pellikka, P.; Tuure, J.; Heiskanen, J. Comparison of field and imaging spectroscopy to optimize soil organic carbon and nitrogen estimation in field laboratory conditions. Catena 2024, 243, 108180. [Google Scholar] [CrossRef]
  28. Awiti, A.O.; Walsh, M.G.; Shepherd, K.D.; Kinyamario, J. Soil condition classification using infrared spectroscopy: A proposition for assessment of soil condition along a tropical forest-cropland chronosequence. Geoderma 2008, 143, 73–84. [Google Scholar] [CrossRef]
  29. Dkhala, B.; Mezned, N.; Gomez, C.; Abdeljaouad, S. Hyperspectral field spectroscopy and SENTINEL-2 Multispectral data for minerals with high pollution potential content estimation and mapping. Sci. Total Environ. 2020, 740, 140160. [Google Scholar] [CrossRef]
  30. Nawar, S.; Buddenbaum, H.; Hill, J. Estimation of soil salinity using three quantitative methods based on visible and near-infrared reflectance spectroscopy: A case study from Egypt. Arab. J. Geosci. 2015, 8, 5127–5140. [Google Scholar] [CrossRef]
  31. Kühnel, A.; Bogner, C.; Huwe, B. In situ prediction of soil chemical properties with visible and near infrared spectroscopy in an African savannah. In Proceedings of the GlobalSoilMap: Basis of the Global Spatial Soil Information System-Proceedings of the 1st GlobalSoilMap Conference, Orleans, France, 7–9 October 2013; CRC Press: Boca Raton, FL, USA, 2014; pp. 409–413. [Google Scholar]
  32. Bayer, A.D.; Bachmann, M.; Rogge, D.; Müller, A.; Kaufmann, H. Combining field and imaging spectroscopy to map soil organic carbon in a semiarid environment. IEEE J. Sel. Top. Appl. Earth Obs. Remote Sens. 2016, 9, 3997–4010. [Google Scholar] [CrossRef]
  33. Ciampalini, R.; Lagacherie, P.; Monestiez, P.; Walker, E.; Gomez, C. Co-kriging of soil properties with Vis-NIR hyperspectral covariates in the Cap Bon region (Tunisia). In Digital Soil Assessments and Beyond; CRC Press: Boca Raton, FL, USA, 2012; pp. 393–398. [Google Scholar]
  34. Misbah, K.; Laamrani, A.; Casa, R.; Voroney, P.; Dhiba, D.; Jamal, J.; Chehbouni, A. Spatial Prediction of Soil Attributes from PRISMA Hyperspectral Imagery Using Wrapper Feature Selection and Ensemble Modeling. PFG-J. Photogramm. Remote Sens. Geoinf. Sci. 2025, 93, 197–215. [Google Scholar] [CrossRef]
  35. Moursy, A.R.A.; El-Sayed, M.A.; Fadl, M.E.; Abd El-Azem, A.H. PRISMA-Driven Hyperspectral Analysis for Characterization of Soil Salinity Patterns in Sohag, Egypt. Egypt. J. Soil Sci. 2025, 65, 15–31. [Google Scholar] [CrossRef]
  36. Bouslihim, Y.; Bouasria, A.; Minasny, B.; Castaldi, F.; Nenkam, A.M.; El Battay, A.; Chehbouni, A. Soil organic carbon prediction and mapping in Morocco using PRISMA hyperspectral imagery and meta-learner model. Remote Sens. 2025, 17, 1363. [Google Scholar] [CrossRef]
  37. Mahmoud, A.S.; Fathy, A.; Masoud, A.A.; Abdelhameed, A.M.; Azer, M.K. Integrating EnMAP hyperspectral data and geochemical analysis for rare metal exploration: A case study in Abu Rushied granite, Southeastern Desert, Egypt. Adv. Space Res. 2025, 76, 4162–4182. [Google Scholar] [CrossRef]
  38. Bouslihim, Y.; Bouasria, A. Potential of EnMAP hyperspectral imagery for regional-scale soil organic matter mapping. Remote Sens. 2025, 17, 1600. [Google Scholar] [CrossRef]
  39. Barthès, B.G.; Brunet, D.; Hien, E.; Enjalric, F.; Conche, S.; Freschet, G.T.; D’Annunzio, R.; Toucet-Louri, J. Determining the distributions of soil carbon and nitrogen in particle size fractions using near-infrared reflectance spectrum of bulk soil samples. Soil Biol. Biochem. 2008, 40, 1533–1537. [Google Scholar] [CrossRef]
  40. Singh, K.; Majeed, I.; Panigrahi, N.; Vasava, H.B.; Fidelis, C.; Karunaratne, S.; Bapiwai, P.; Yinil, D.; Sanderson, T.; Snoeck, D.; et al. Near infrared diffuse reflectance spectroscopy for rapid and comprehensive soil condition assessment in smallholder cacao farming systems of Papua New Guinea. Catena 2019, 183, 104185. [Google Scholar] [CrossRef]
  41. Singh, K.; Vasava, H.B.; Snoeck, D.; Das, B.S.; Yinil, D.; Field, D.J.; Sanderson, T.; Fidelis, C.; Majeed, I.; Panigrahi, N. Assessment of cocoa input needs using soil types and soil spectral analysis. Soil Use Manag. 2019, 35, 492–502. [Google Scholar] [CrossRef]
  42. Shepherd, K.D.; Walsh, M.G. Development of reflectance spectral libraries for characterization of soil properties. Soil Sci. Soc. Am. J. 2002, 66, 988–998. [Google Scholar] [CrossRef]
  43. Waruru, B.K.; Shepherd, K.D.; Ndegwa, G.M.; Sila, A. Estimation of wet aggregation indices using soil properties and diffuse reflectance near infrared spectroscopy: An application of classification and regression tree analysis. Biosyst. Eng. 2016, 152, 148–164. [Google Scholar] [CrossRef]
  44. Kawamura, K.; Tsujimoto, Y.; Rabenarivo, M.; Asai, H.; Andriamananjara, A.; Rakotoson, T. Vis-NIR spectroscopy and PLS regression with waveband selection for estimating the total C and N of paddy soils in Madagascar. Remote Sens. 2017, 9, 1081. [Google Scholar] [CrossRef]
  45. Nawar, S.; Buddenbaum, H.; Hill, J.; Kozak, J.; Mouazen, A.M. Estimating the soil clay content and organic matter by means of different calibration methods of vis-NIR diffuse reflectance spectroscopy. Soil Tillage Res. 2016, 155, 510–522. [Google Scholar] [CrossRef]
  46. Tsakiridis, N.; Tziolas, N.; Theocharis, J.; Zalidis, G. A genetic algorithm-based stacking algorithm for predicting soil organic matter from vis–NIR spectral data. Eur. J. Soil Sci. 2019, 70, 578–590. [Google Scholar] [CrossRef]
  47. Cambou, A.; Barthès, B.G.; Moulin, P.; Chauvin, L.; Faye, E.H.; Massé, D.; Chevallier, T.; Chapuis-Lardy, L. Prediction of soil carbon and nitrogen contents using visible and near infrared diffuse reflectance spectroscopy in varying salt-affected soils in Sine Saloum (Senegal). Catena 2022, 212, 106075. [Google Scholar] [CrossRef]
  48. Hajaj, S.; El Harti, A.; Pour, A.B.; Jellouli, A.; Adiri, Z.; Hashim, M. A review on hyperspectral imagery application for lithological mapping and mineral prospecting: Machine learning techniques and future prospects. Remote Sens. Appl. Soc. Environ. 2024, 35, 101218. [Google Scholar] [CrossRef]
  49. Vågen, T.-G.; Shepherd, K.D.; Walsh, M.G. Sensing landscape level change in soil fertility following deforestation and conversion in the highlands of Madagascar using Vis-NIR spectroscopy. Geoderma 2006, 133, 281–294. [Google Scholar] [CrossRef]
  50. Mashimbye, Z.E.; Cho, M.A.; Nell, J.P.; de Clercq, W.P.; Van Niekerk, A.; Turner, D.P. Model-Based Integrated Methods for Quantitative Estimation of Soil Salinity from Hyperspectral Remote Sensing Data: A Case Study of Selected South African Soils. Pedosphere 2012, 22, 640–649. [Google Scholar] [CrossRef]
  51. Said Mohamed, E.S.; El Baroudy, A.A.; EL-Beshbeshy, T.; Amin, M.; Belal, A.A.; Elfadaly, A.; Aldosari, A.A.; Ali, A.M.; Lasaponara, R. Vis-nir spectroscopy and satellite landsat-8 oli data to map soil nutrients in arid conditions: A case study of the northwest coast of egypt. Remote Sens. 2020, 12, 3716. [Google Scholar] [CrossRef]
  52. Mustafa, A.-R.A.; Abdelsamie, E.A.; Said Mohamed, E.S.; Rebouh, N.Y.; Shokr, M.S. Modeling of Soil Cation Exchange Capacity Based on Chemometrics, Various Spectral Transformations, and Multivariate Approaches in Some Soils of Arid Zones. Sustainability 2024, 16, 7002. [Google Scholar] [CrossRef]
  53. Rakotonindrina, H.; Kawamura, K.; Tsujimoto, Y.; Nishigaki, T.; Razakamanarivo, H.; Andrianary, B.H.; Andriamananjara, A. Prediction of soil oxalate phosphorus using visible and near-infrared spectroscopy in natural and cultivated system soils of madagascar. Agriculture 2020, 10, 177. [Google Scholar] [CrossRef]
  54. Bao, Y.; Ustin, S.; Meng, X.; Zhang, X.; Guan, H.; Qi, B.; Liu, H. A regional-scale hyperspectral prediction model of soil organic carbon considering geomorphic features. Catena 2021, 403, 115263. [Google Scholar] [CrossRef]
  55. Ouzemou, J.-E.; Laamrani, A.; EL Battay, A.; Whalen, J.K.; Chehbouni, A. Integrating Post-Rainfall Multispectral Satellite-Derived Features and Multi-Source Datasets to Enhance Soil Salinity Mapping Accuracy. Remote Sens. Appl. Soc. Environ. 2026, 41, 101896. [Google Scholar] [CrossRef]
  56. Guo, P.; Li, T.; Gao, H.; Chen, X.; Cui, Y.; Huang, Y. Evaluating calibration and spectral variable selection methods for predicting three soil nutrients using Vis-NIR spectroscopy. Remote Sens. 2021, 13, 4000. [Google Scholar] [CrossRef]
  57. Xu, S.; Zhao, Y.; Wang, M.; Shi, X. Comparison of multivariate methods for estimating selected soil properties from intact soil cores of paddy fields by Vis–NIR spectroscopy. Geoderma 2018, 310, 29–43. [Google Scholar] [CrossRef]
  58. Cheng, H.; Wang, J.; Du, Y. Combining multivariate method and spectral variable selection for soil total nitrogen estimation by Vis–NIR spectroscopy. Arch. Agron. Soil Sci. 2021, 67, 1665–1678. [Google Scholar] [CrossRef]
  59. Mulder, V.; De Bruin, S.; Schaepman, M.E.; Mayr, T. The use of remote sensing in soil and terrain mapping—A review. Geoderma 2011, 162, 1–19. [Google Scholar] [CrossRef]
  60. Li, H.; Jia, S.; Le, Z. Quantitative analysis of soil total nitrogen using hyperspectral imaging technology with extreme learning machine. Sensors 2019, 19, 4355. [Google Scholar] [CrossRef] [PubMed]
  61. Morellos, A.; Pantazi, X.-E.; Moshou, D.; Alexandridis, T.; Whetton, R.; Tziotzios, G.; Wiebensohn, J.; Bill, R.; Mouazen, A.M. Machine learning based prediction of soil total nitrogen, organic carbon and moisture content by using VIS-NIR spectroscopy. Biosyst. Eng. 2016, 152, 104–116. [Google Scholar] [CrossRef]
  62. Bian, X.; Wang, K.; Tan, E.; Diwu, P.; Zhang, F.; Guo, Y. A selective ensemble preprocessing strategy for near-infrared spectral quantitative analysis of complex samples. Chemom. Intell. Lab. Syst. 2020, 197, 103916. [Google Scholar] [CrossRef]
  63. Ali, M.A.; Dong, L.; Dhau, J.; Khosla, A.; Kaushik, A. Perspective—Electrochemical sensors for soil quality assessment. J. Electrochem. Soc. 2020, 167, 037550. [Google Scholar] [CrossRef]
  64. Zhang, Y.; Li, M.; Zheng, L.; Zhao, Y.; Pei, X. Soil nitrogen content forecasting based on real-time NIR spectroscopy. Comput. Electron. Agric. 2016, 124, 29–36. [Google Scholar] [CrossRef]
  65. Bulan, R.; Sitorus, A. Vis-NIR spectra combined with machine learning for predicting soil nutrients in cropland from Aceh Province, Indonesia. Case Stud. Chem. Environ. Eng. 2022, 6, 100268. [Google Scholar] [CrossRef]
  66. Chen, W.; Ding, Y. Comparative Study of PLSR and SVR Using MLP Feature Extraction for Quantitative Analysis of Steel Alloy Elements by Laser-Induced Breakdown Spectroscopy. Photonics 2026, 13, 186. [Google Scholar] [CrossRef]
  67. Kashyap, B.; Kumar, R. Sensing methodologies in agriculture for soil moisture and nutrient monitoring. IEEE Access 2021, 9, 14095–14121. [Google Scholar] [CrossRef]
Figure 1. Diagram showing literature search process for paper selection.
Environments 13 00228 g001
Figure 2. The evolution of scientific publications in soil spectroscopy in Africa by year (A) and Frequency of soil attributes (B). NB: Frequency bar plot highlights the soil properties investigated in each publication, where those attributes could be studied individually or alongside others in the same publication.
Environments 13 00228 g002
Figure 3. Geographical assessment of soil spectroscopy studies in African countries and the percentage of publications by African regions. NB: Two studies were excluded from this analysis following the use of global datasets in assessing soil attributes in Africa. Abbreviations: SAR: Several African Regions.
Environments 13 00228 g003
Figure 4. Platform type used in soil spectroscopy including Space-air and ground-based sensors (a) and specific spectral regions (b). NB: VIS–NIR spectral range (typically ~400–1000 nm) and VIS–NIR–SWIR configurations (approximately ~400–2500 nm).
Environments 13 00228 g004
Figure 5. Sensors used in soil spectroscopy in current studies.
Environments 13 00228 g005
Figure 6. The processing and prediction techniques used in current research in soil spectroscopy.
Environments 13 00228 g006
Figure 7. Studied sites by Cambou et al. [26]. Adapted and redrawn under a CC license.
Environments 13 00228 g007
Figure 8. Panel (a) presents scatter plots of measured versus predicted soil TN values obtained using PLSR, SVR, and GPR models within a multimethod ensemble framework. The results correspond to one-fold of a 10-fold cross-validation scheme. The dashed 1:1 line represents perfect agreement between observations and predictions, providing a visual benchmark for evaluating model accuracy and dispersion; Panel (b) illustrates the relationship between soil total nitrogen (TN, g/kg) and soil organic matter (SOM). Point density is conveyed through a blue color gradient, with darker shades indicating higher concentrations of samples. The fitted regression line reveals a strong positive association, indicating that higher SOM levels correspond to increased TN content. adapted from Misbah et al. [13] under a CC license.
Environments 13 00228 g008
Table 1. Summary of key soil spectroscopy projects and study locations across Africa.
RegionCountryFocus/ProjectKey Source
North AfricaTunisia, EgyptGEO-CRADLE SSL Development[12]
North AfricaTunisiaClay and CEC mapping (surface & subsurface)[15]
North AfricaTunisiaClay and CEC mapping (surface & subsurface)[16]
North AfricaEgyptSalinity, CEC, and heavy metal prediction[17]
North AfricaEgyptSalinity, CEC, and heavy metal prediction[18,19]
North AfricaMoroccoTN mapping with satellite data[13]
Sub-Saharan Africa20 SSA CountriesSoil fertility property estimation[14]
Sub-Saharan AfricaKenyaSOC and SN estimation[20]
Sub-Saharan AfricaUgandaLocal characterization using global SSLs[21]
Sub-Saharan AfricaMadagascarSOC, TN, and P prediction[22]
Sub-Saharan AfricaMadagascarSOC, TN, and P prediction[23]
Sub-Saharan AfricaMadagascarSOC, TN, and P prediction[24]
Sub-Saharan AfricaSouth AfricaSOC mapping and prediction[4]
Sub-Saharan AfricaSouth AfricaSOC mapping and prediction[25]
West AfricaBenin, Burkina Faso, etc.Spiking SSLs for local prediction[26]
Table 3. Summary of key techniques used in pre-processing.
TechniquePurposeInstance of PropertyFrequencyCase Studies
Pseudo-absorbance (Abs)Converts reflectance (R) to absorbance (−log10(R)) to linearize the relationship between spectral response and the concentration of soil constituents.CEC, EC, SOC17[1,19,20,28,39,40,41]
Scatter-CorrectionReduces baseline shifts and other effects caused by variations in particle size and surface texture. A common method is the Standard Normal Variate (SNV).SOC, SOM17[4,40,42,43]
Spectral DerivativesRemoves additive and multiplicative baseline effects and enhances subtle absorption features. TOC, CEC, TN 20[12,42,44]
Continuum Removal (CR)Normalizes reflectance spectra to a common baseline (the convex hull) to isolate and compare the depth and shape of specific absorption features.CaCO3 Clay, ECe5[1,2,12,18,42]
De-trending (DT)Removes low-frequency background signals or linear trends from the spectra, often by fitting a polynomial and retaining the residuals.CaCO3, TN, pH8[3,12,45,46]
Savitz-ky-Golay (SG) Smoothing/FilteringFits a low-degree polynomial to successive subsets of spectral data points to reduce random noise while maintaining the integrity of absorption peaks.
Widely applied as a preprocessing step to improve signal quality before derivative analysis.
TOC, Exchangeable Ca SOM22[25,30,46,47]
Table 5. Summary of key metrics used in model performance evaluation.
MetricDescription
Coefficient of Determination (R2)Measures the proportion of the variance in the dependent variable (measured soil property) that is predictable from the independent variable (spectral data). Values range from 0 to 1, with higher values indicating better model fit. Used in several studies, e.g., [29,45].
Root Mean Squared Error (RMSE)Represents the standard deviation of the prediction errors (residuals). It is in the same units as the soil property and indicates the absolute magnitude of prediction error. Lower values are better. Used in several studies, e.g., [33,46].
Ratio of Performance to Deviation (RPD)Computed as the ratio of the standard deviation of the observed values to the RMSE. It is a standardized measure of model performance. An RPD value greater than 2 is generally considered to indicate an accurate and reliable prediction model [4].
Ratio of Performance to Interquartile Range (RPIQ)Computed as the ratio of the interquartile range of the observed values to the RMSE. It is considered more robust than RPD for datasets with skewed distributions or outliers. Higher values indicate better performance. Used in several studies, e.g., [1,12].
Disclaimer/Publisher’s Note: The statements, opinions and data contained in all publications are solely those of the individual author(s) and contributor(s) and not of MDPI and/or the editor(s). MDPI and/or the editor(s) disclaim responsibility for any injury to people or property resulting from any ideas, methods, instructions or products referred to in the content.