1. Introduction
Air pollution consists of a mixture of complex harmful substances derived from anthropogenic and natural sources and represents a serious threat to health worldwide. It is associated with more than 7 million premature deaths each year globally, including both environmental and household air pollution. [
1,
2,
3]. The most common air pollutants with the highest health impact are particulate matter (PM), ozone (O
3), sulfur dioxide (SO
2), carbon monoxide (CO) and nitrogen dioxide (NO
2) [
2].
PM consists of microscopic solid and/or liquid particles of various sizes and shapes in hundreds of different chemicals. PM often originates directly from combustion processes such as fires (e.g., forest fires and grassland fires), road dust and vehicle exhausts, among others [
4]. However, most particles are formed in the atmosphere through chemical reactions involving other pollutants [
5]. PM is usually classified according to particle size as PM
10 (aerodynamic diameter ≤ 10 μm, known as thoracic particles) and PM
2.5 (aerodynamic diameter ≤ 2.5 μm, known as fine particles) to ensure proper management and regulation [
6,
7]. These classes are not entirely independent, since PM
2.5 is included within PM
10. To distinguish them, particles with an aerodynamic diameter larger than 2.5 µm but no greater than 10 µm are defined as coarse thoracic particles (PM
10–2.5) [
7]. PM
10 can enter the lungs, trigger inflammation and contribute to heart-related issues, whereas PM
2.5 can infiltrate deeper into the lungs than PM
10, settling in the alveolar areas, where it may be absorbed into the bloodstream and cause cardiovascular complications [
8]. Additionally, PM can cause nervous system issues, increasing the incidence of cardiac arrhythmias and cardiovascular morbidity and mortality [
8]. In [
9], it was found that adolescents and children present higher risks of developing the aforementioned health issues compared to adults when exposed to pollutants due to the ongoing development of their bodies. Meanwhile, older adults, due to age-related deterioration, and people with cardiorespiratory disorders, are at high risk because of the inflammation and respiratory complications resulting from air pollution [
9,
10].
Calibration chambers are necessary in the laboratory evaluation of low-cost air quality sensors, as they enable performance testing under controlled and reproducible conditions [
11]. In [
12,
13,
14], calibration chambers were developed for other pollutants (e.g., CO
2, SO
2, etc.), each requiring a different and specialized methodology. In [
11,
12,
13,
14,
15,
16,
17], the actuators involved in maintaining the environmental conditions to perform the calibration have no programmable immediate control, operating in an automated manner. In [
18], a simulation was conducted for the development of a PM calibration test chamber; however, there was no mention of a graphical interface or connectivity type. Furthermore, [
15] implemented a system that filters and recirculates air back to the chamber, while in the calibration chambers in [
16,
19,
20], no particle extraction system was included. This system is used to clean the chamber from PM before and after sampling, as the presence of residual PM can affect the measurements and compromise the results. In addition, in [
11,
12,
13,
14,
15,
16,
17], communication is achieved using serial connectivity, either directly from the devices or through a microcontroller, while in [
19,
21], wireless connectivity is implemented, with Bluetooth used in [
19] and Wi-Fi used in [
21].
The aim of this work is to design a calibration chamber for particle sensors under controlled environmental conditions with wireless connectivity. The chamber consists of different stages to control the internal environment. Given the health risks posed by exposure to ultrafine PM (PM
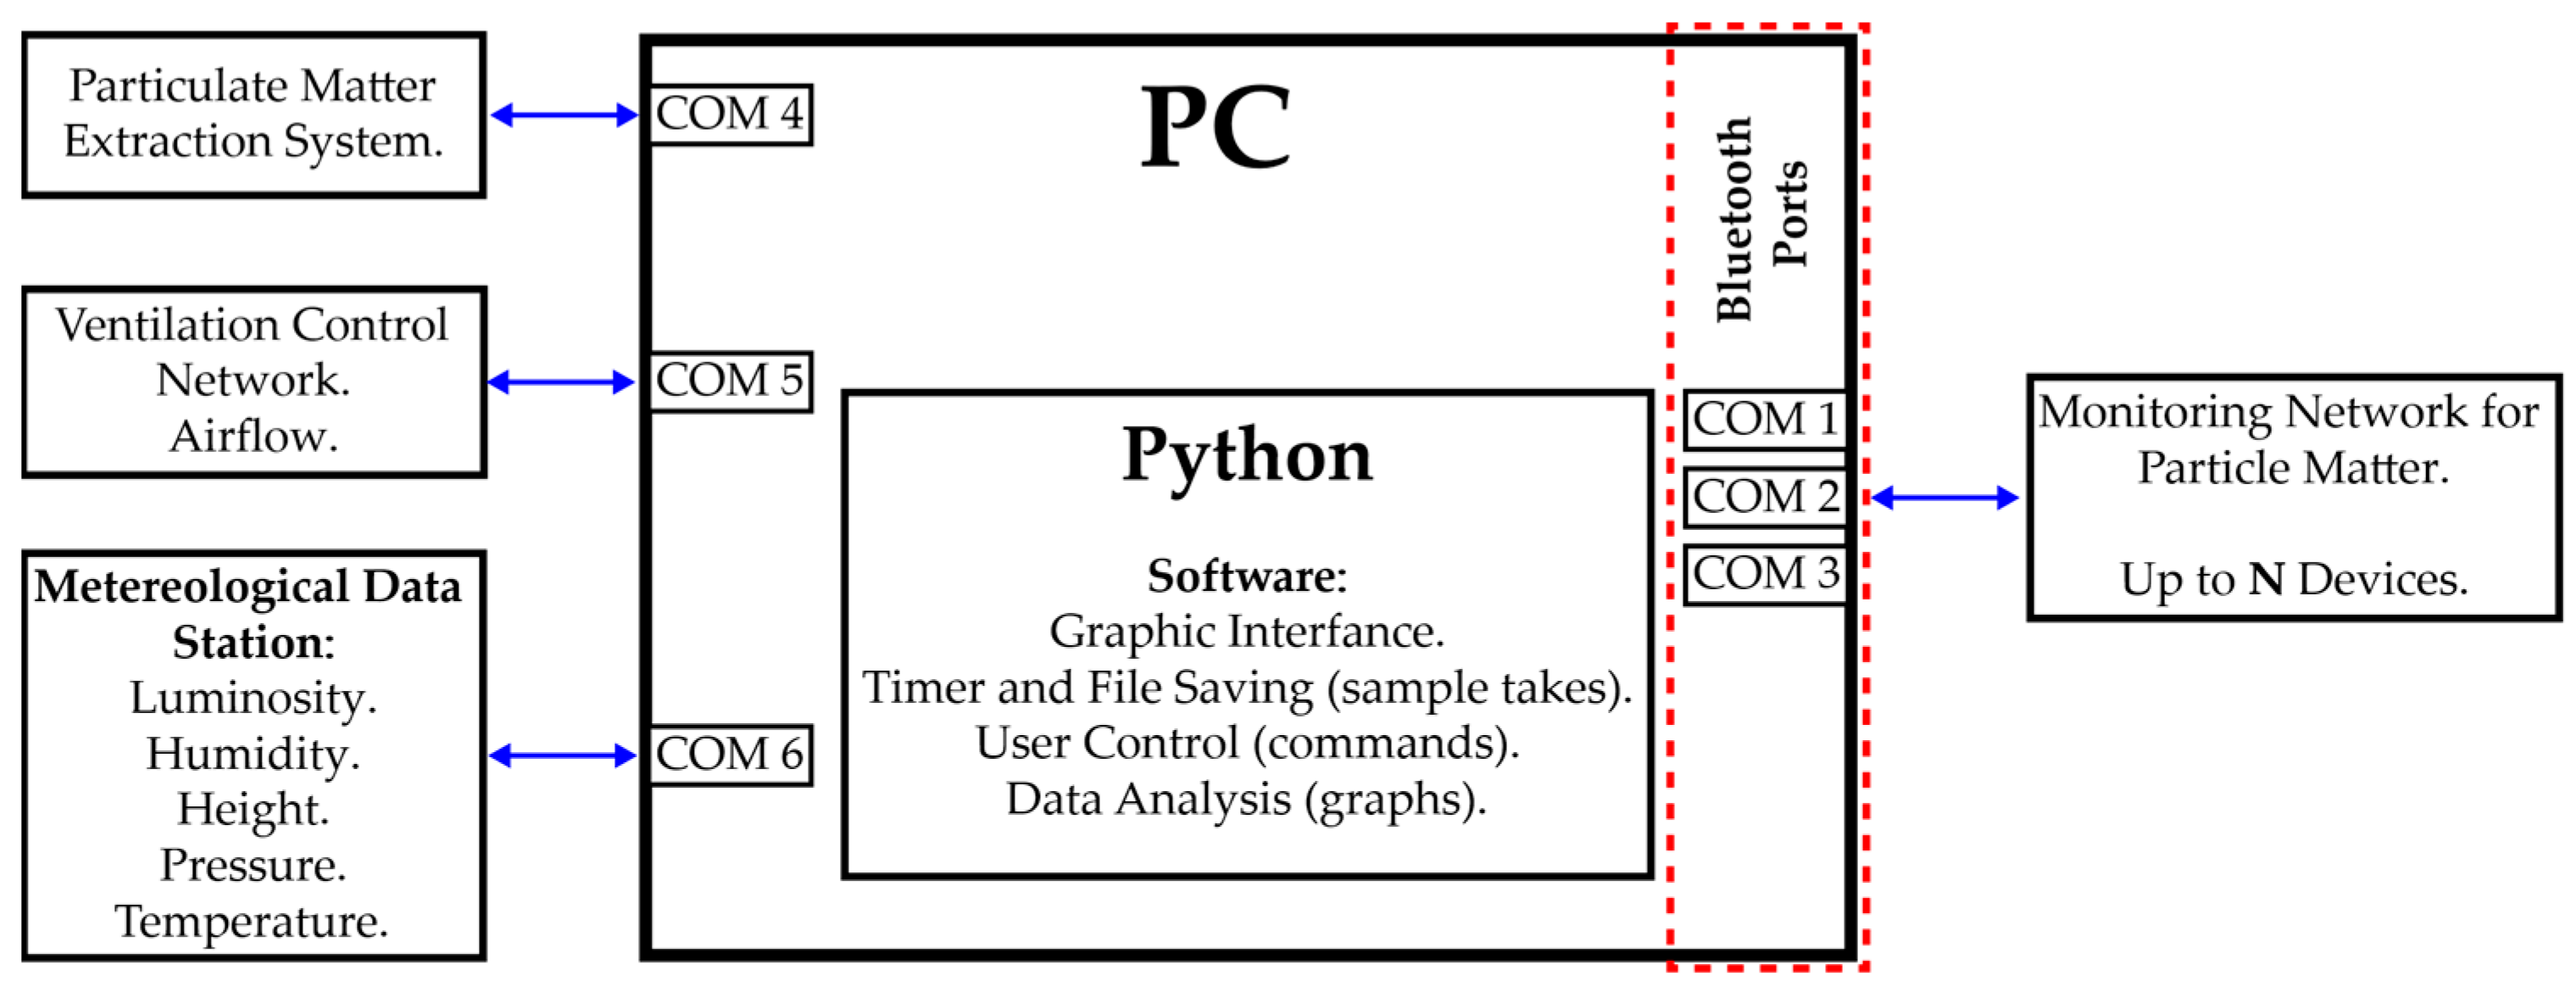
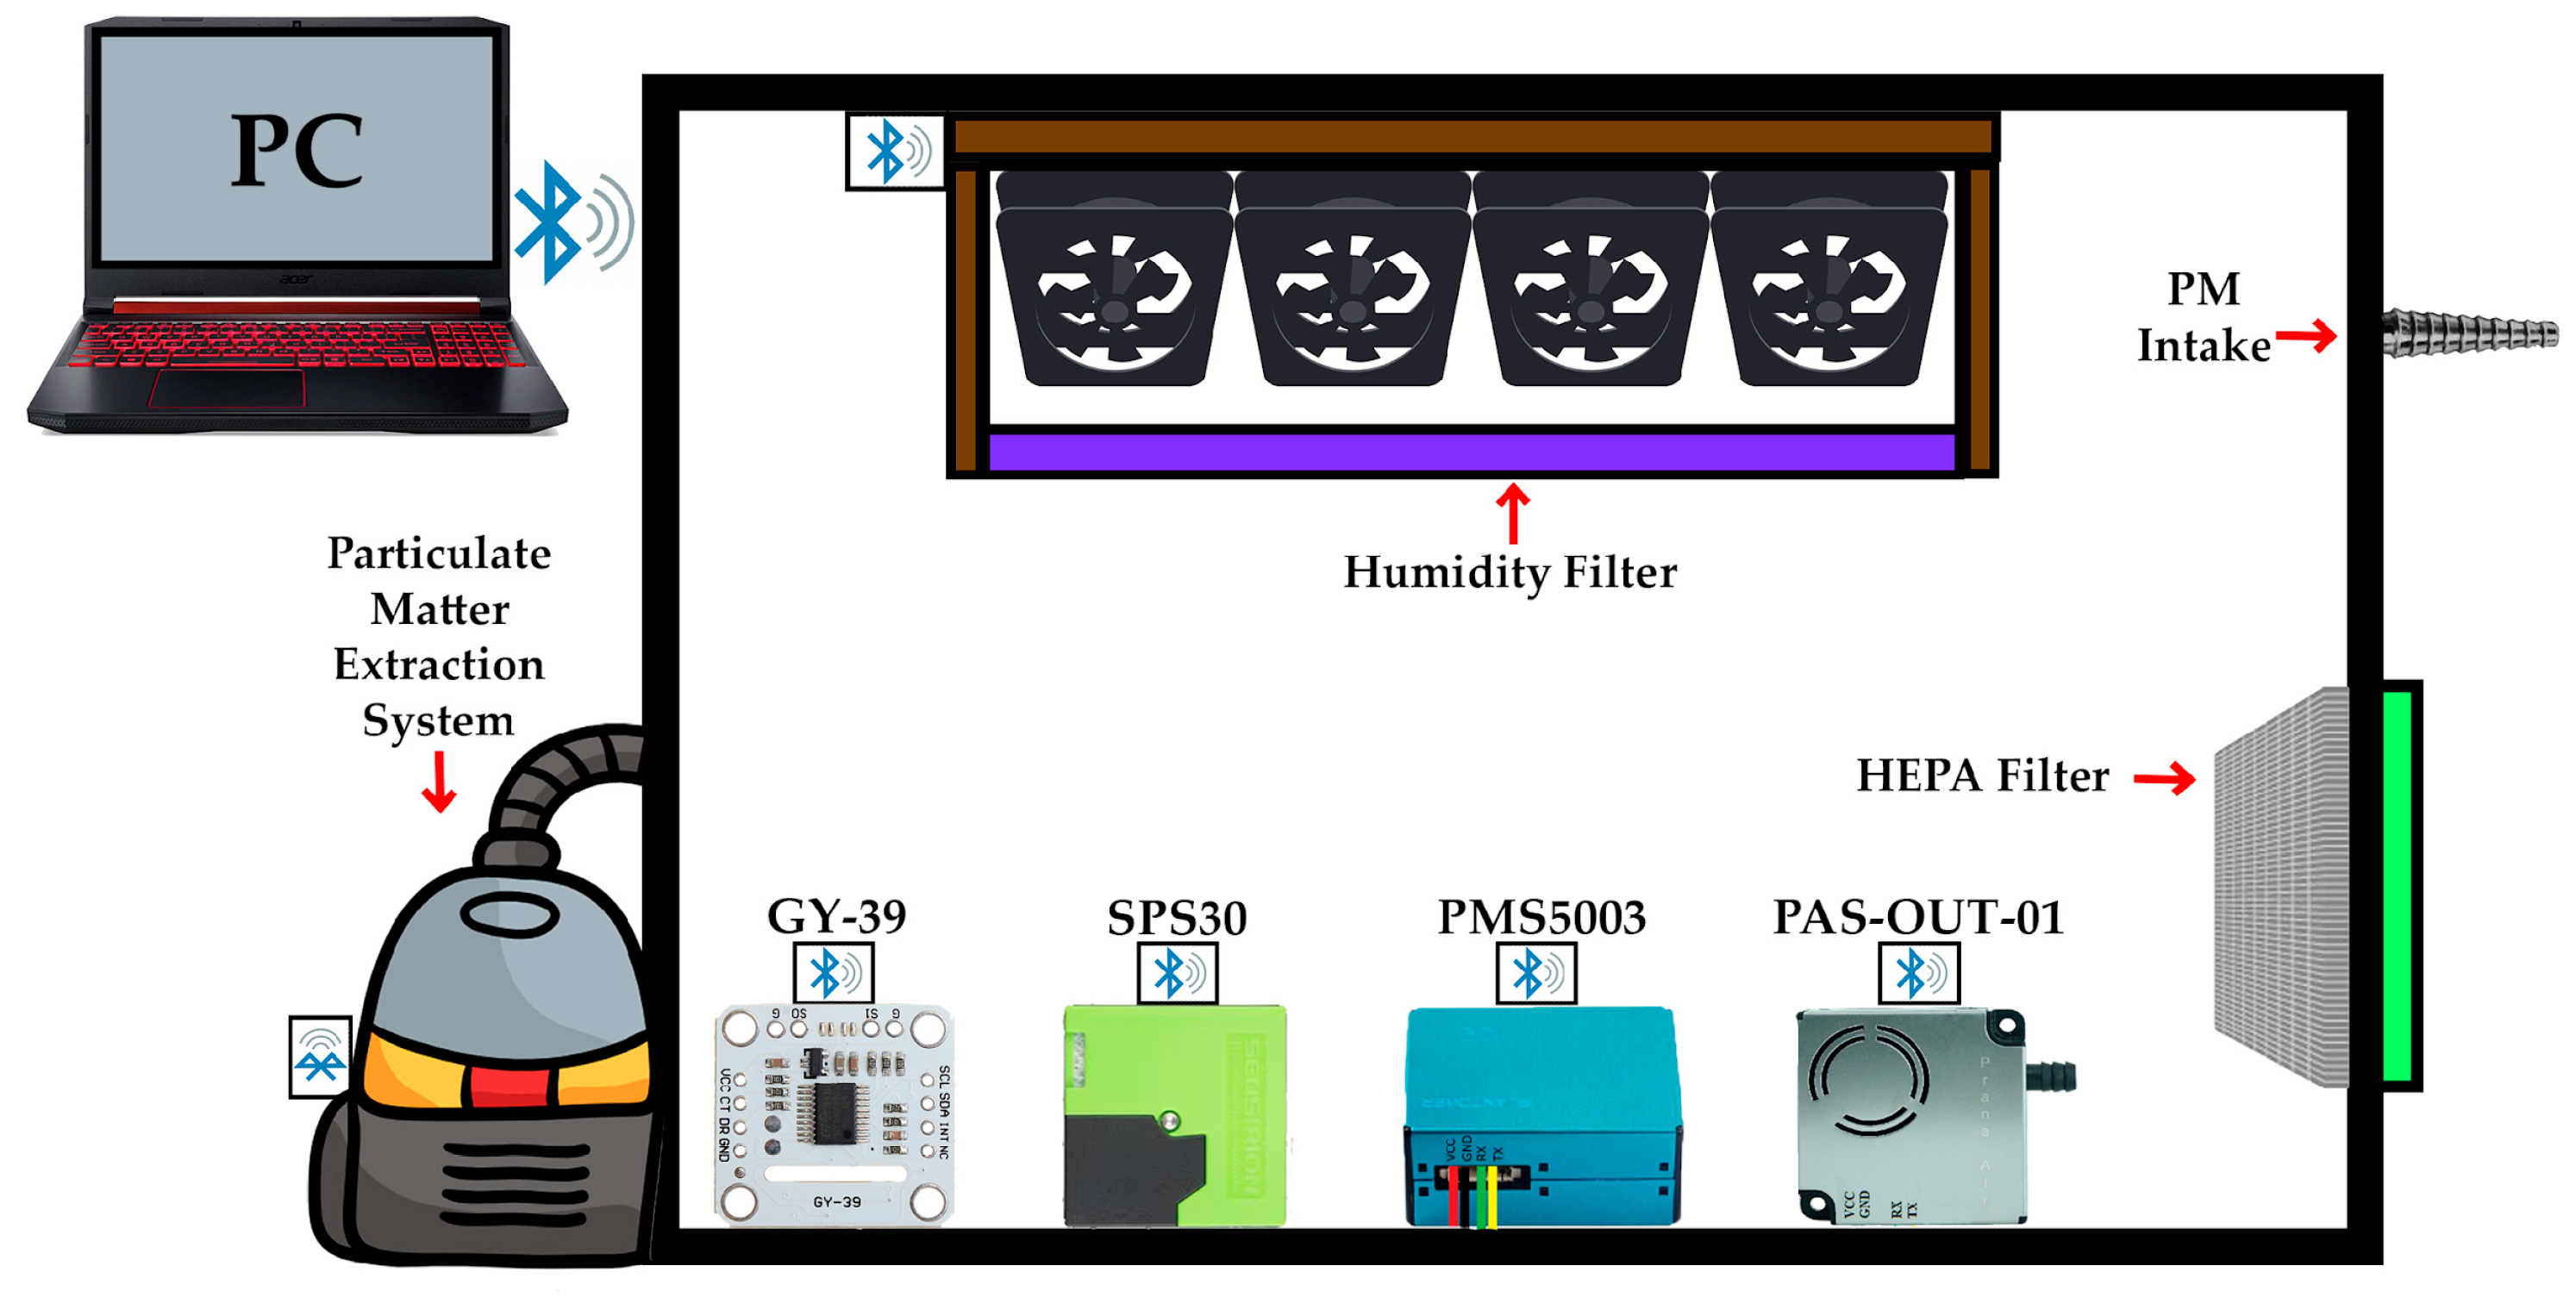
1.0) in high concentrations to the cardiorespiratory system, as well as the risk of developing cancer, the calibration chamber was equipped with Bluetooth wireless connectivity to prevent users from being exposed to PM during calibration. Furthermore, an air quality monitoring control software was developed to interface with the following air monitoring devices, environmental sensors, and control tools: particulate matter extraction system, ventilation system, a monodisperser’s three-way valve, GY-39 environmental sensor, SENSIRION SPS30 sensor, Prana Air PAS-OUT-01 sensor and the Plantower PMS5003 sensor, each connected through a COM (Component Object Model) port via Bluetooth to communicate with the control system (see
Figure 1 and
Figure 2). Moreover, the software allows the use of any sensor or device connected via Bluetooth to the computer, enabling the devices or sensors to be updated as required by the user. The software stores data from each device in a comma-separated values (CSV) file, along with the date and time for each measurement read by the monitoring device or environmental sensor (e.g., luminance sensor, relative humidity sensor, temperature sensor, etc.).
2. Materials and Methods
This section will address the methodology used to construct the test chamber and the experimentation involved in this work. As shown in the diagram in
Figure 1, the prototype is divided into five modules, which are: the particle extraction system, the ventilation control network, the meteorological data station (environmental sensor), the particulate matter monitoring network, and the control software (software with a graphical interface), which are responsible for controlling the actuators and monitoring devices (PM and environmental condition monitoring). A 20-gallon translucent polypropylene waterproof container with a hermetic seal was used. The dimensions of the container used as a calibration chamber are 40.64 cm width, 38.73 cm height and 76.2 cm length. The final weight of the calibration chamber, including the ventilation system, filters, and sensors, was approximately 5.89 kg.
2.1. Particulate Matter Monodisperse System
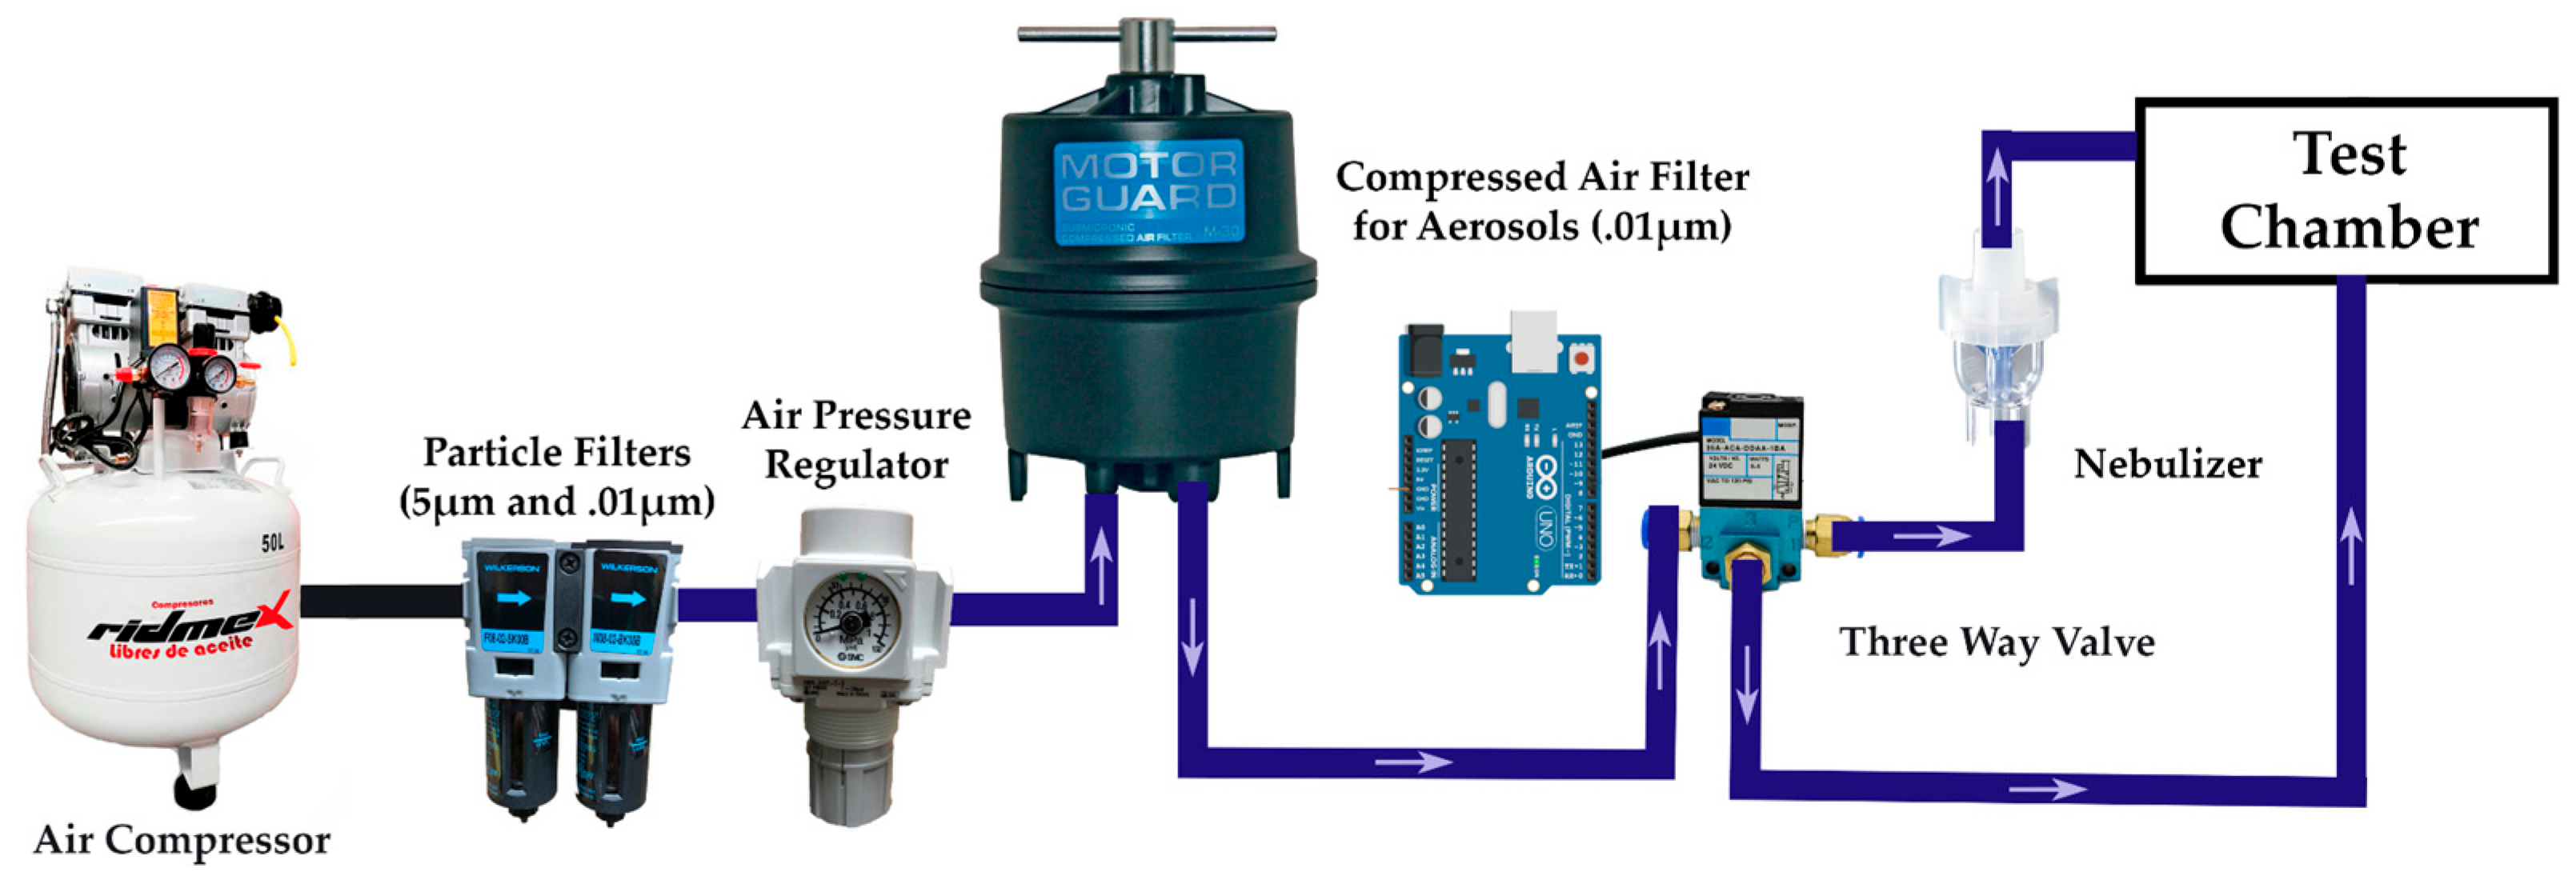
A monodisperse system was created to introduce PM into the test chamber (see
Figure 3). This monodisperse system consists of four stages. The first stage uses a RIM-SHW750X1X50L compressed air pump that injects ambient air into the monodisperse system.
In the second stage, various submicron compressed air filters and an air regulator are used to control the flow rate of the monodisperse system. The filtration system consists of the following: a Wilkerson (Richland, MI, USA) 08-02-SK00B filter, which removes moisture and particles ≥ 5 μm; a Wilkerson M08-02-BK00B and a Motor Guard M-30 filter, both capable of removing moisture and particles down to 0.01 μm; and an SMC (Yorba Linda, CA, USA) AR25-N02E-Z-B air regulator, which regulates air pressure up to 150 PSI. The combination of these filters ensures that the air supplied into the chamber is free of moisture and contaminants when a test is performed or when the chamber needs to be cleaned. The Motor Guard M-30 filter is used as a backup filter in case any particle passes through the primary filter.
In the third stage, an Arduino Uno board and an HC-06 module are used to control the direction of the filtered air flow via Bluetooth, triggering a MAC (Wixon, MI, USA) 35A-ACA-DDAA-1BA three—way valve. This stage allows the clean air to be either directed to the calibration chamber for cleaning or to the final stage.
In the final stage, PM is introduced into the test chamber for calibration testing by dispersing it into clean air using a Hudson RCI (Temecula, CA, USA) Micro Mist Nebulizer.
2.2. Open-Source Hardware
For this work the Arduino Uno board R3 version, based on the ATmega328P microcontroller with a 16 MHz ceramic resonator was used together with a Bluetooth connection via the HC-06 module, and a power jack connector to power the Arduino Uno board which is used to control the ventilation control network fans, the particle extraction system, the Prana Air (Delhi, India) PAS-OUT-01 sensor, the Plantower (Nanchang, Jiangxi, China) PMS5003 sensor and the SENSIRION (Stäfa, Switzerland) SPS30 sensor.
2.2.1. Ventilation Control Network
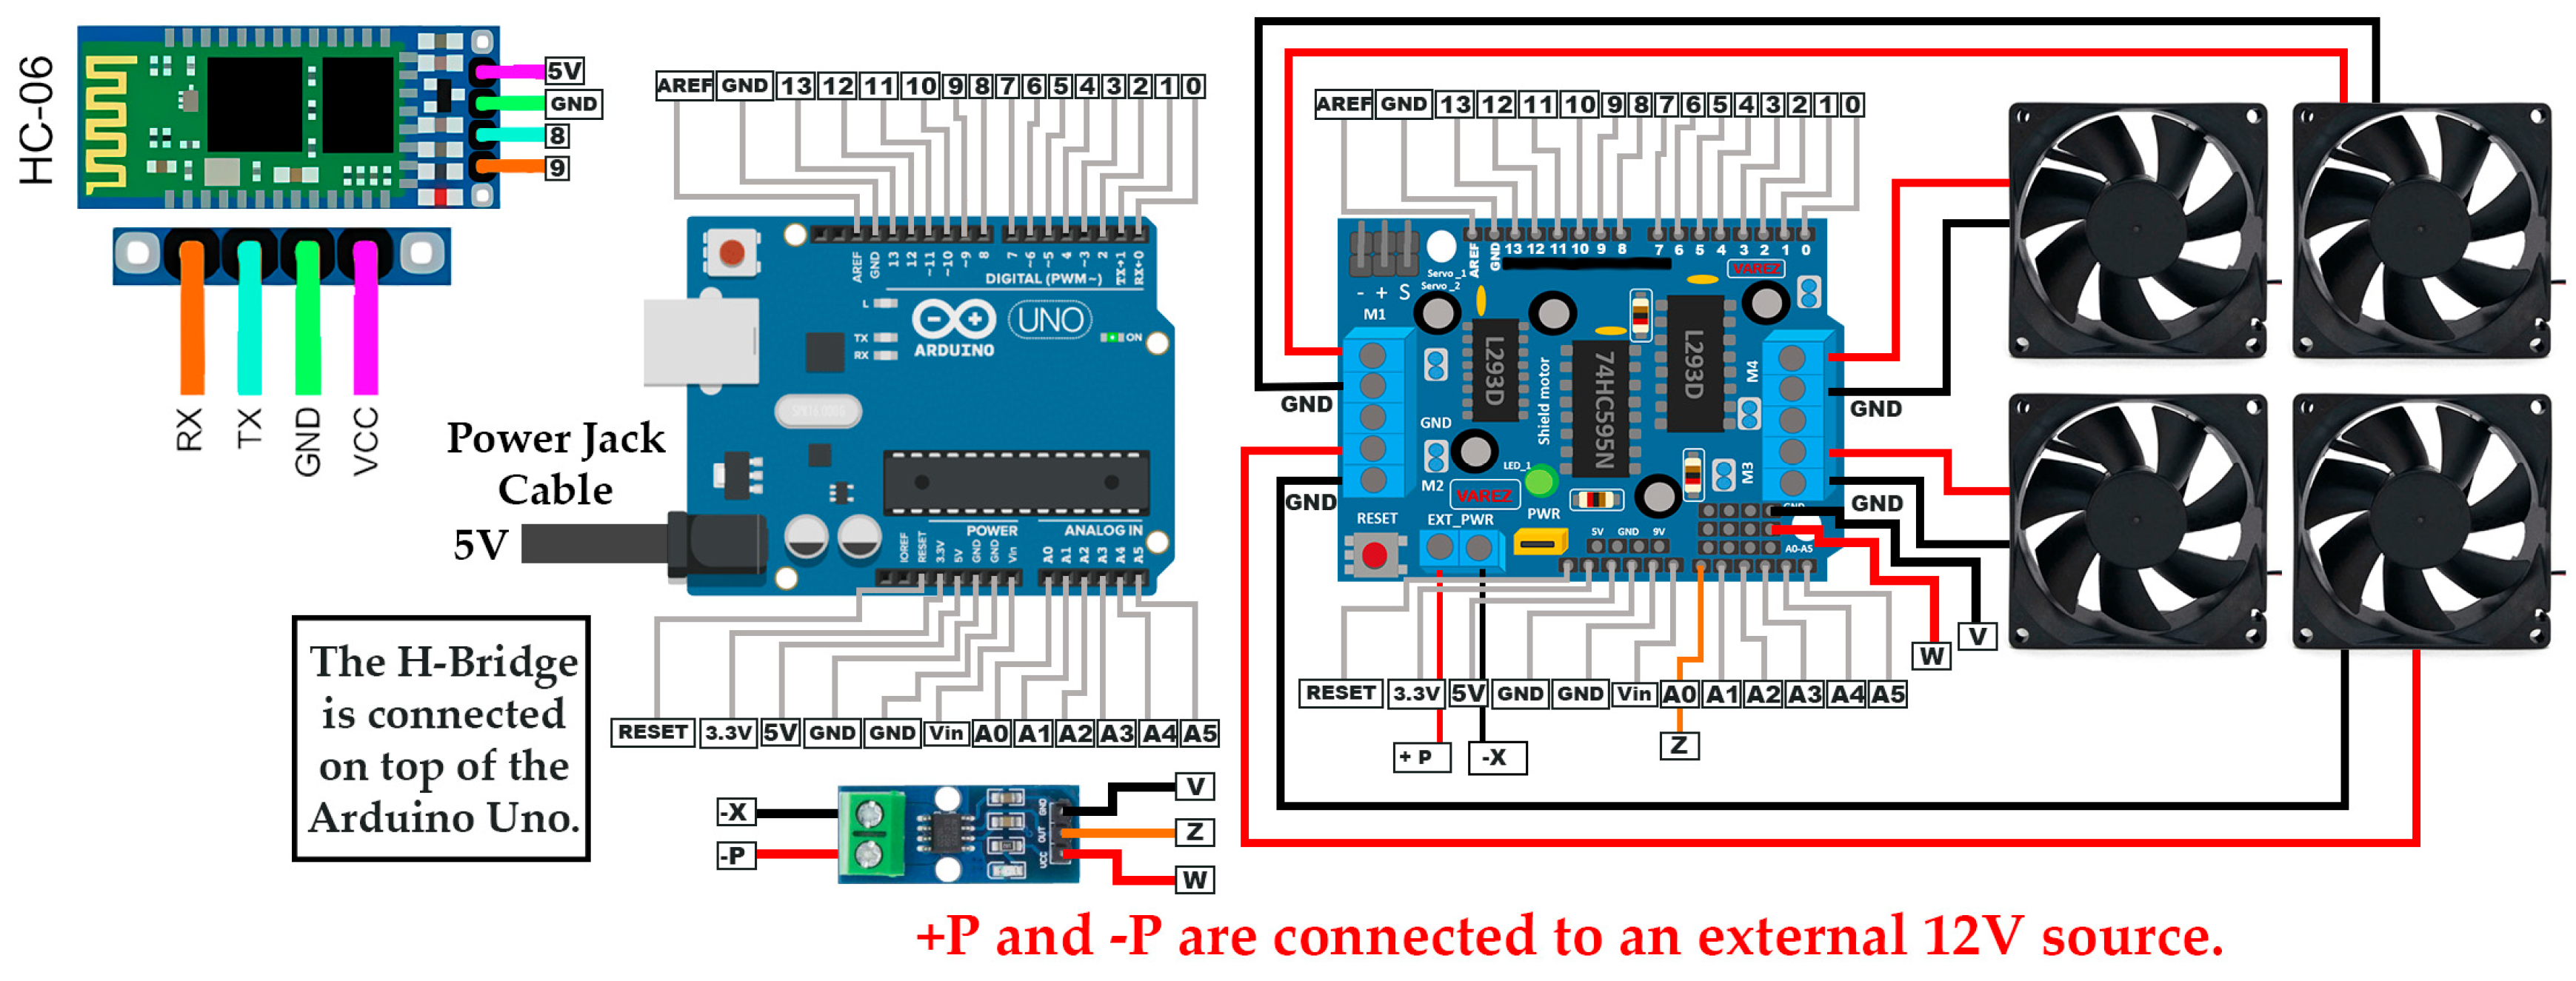
The ventilation control network consists of four fans that generate airflow inside the chamber to ensure that PM reaches the PM sensors. An Arduino L293d motor shield module was used in conjunction with the Arduino Uno board (being mounted on top of the board) to control each fan within the network individually (see
Figure 4). The Arduino board was programmed to receive operating commands from the computer, which was connected via Bluetooth.
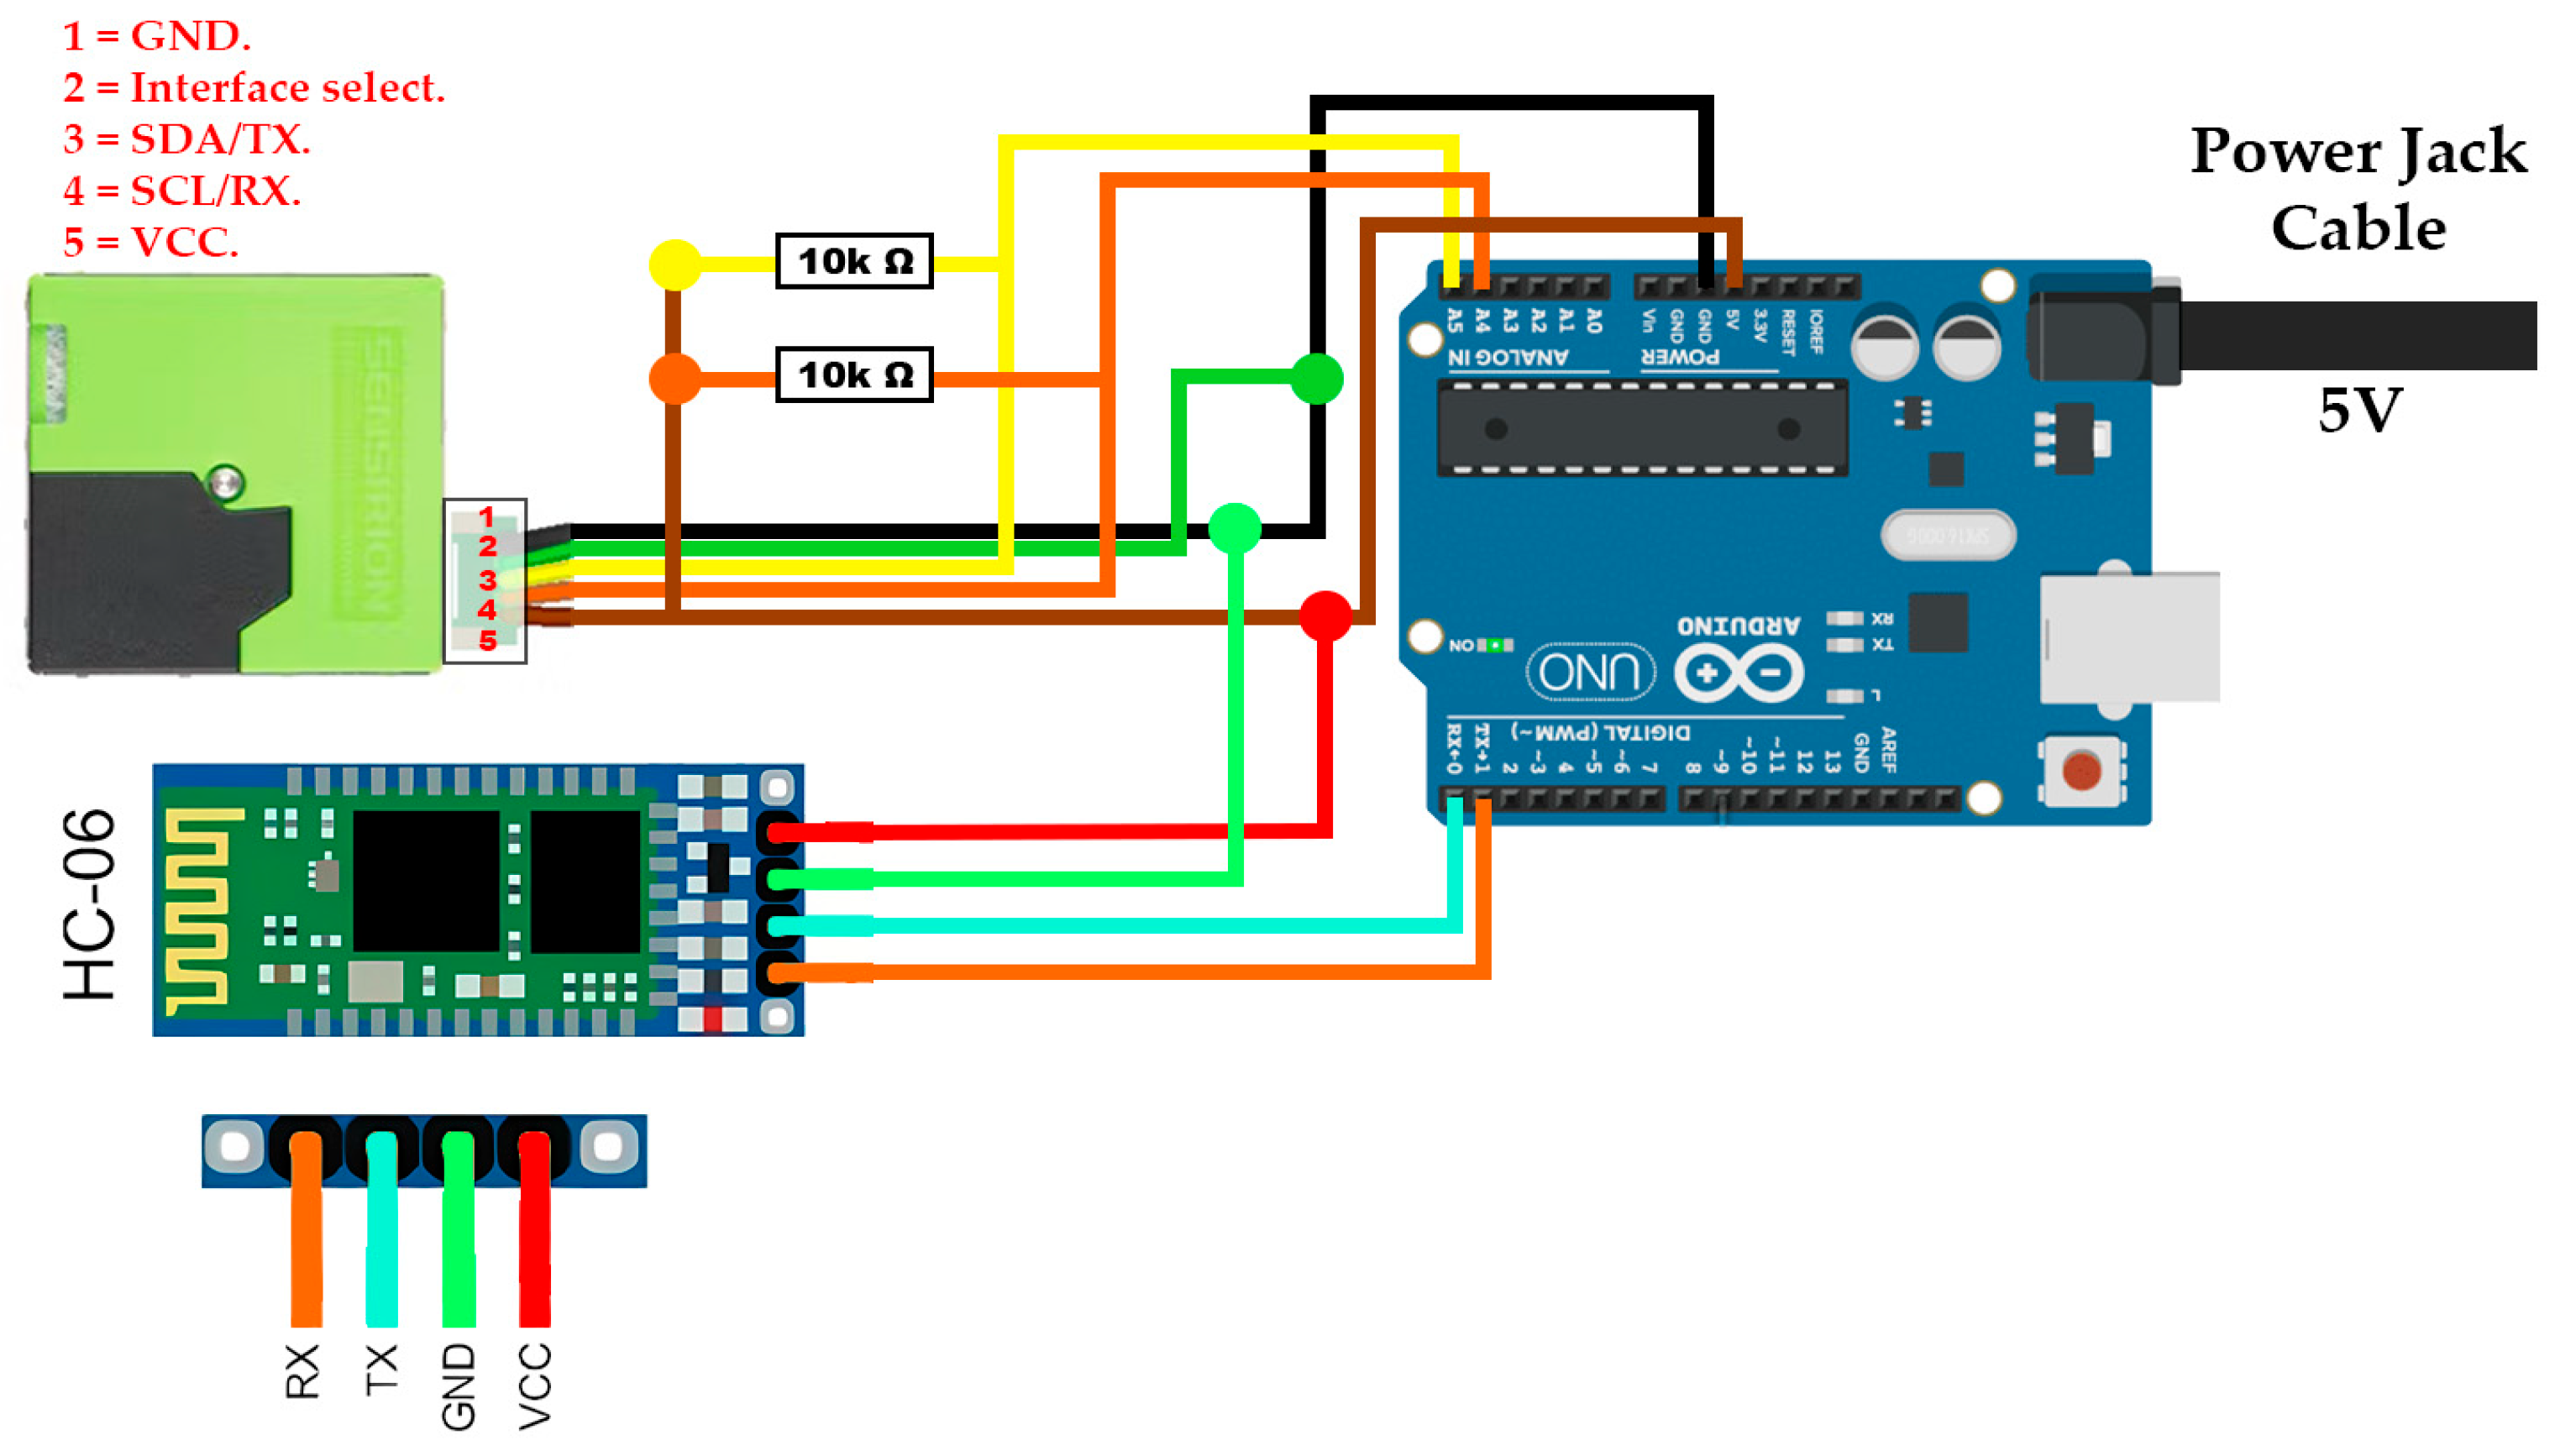
2.2.2. Sensor SENSIRION SPS30
The SENSIRION SPS30 sensor was used for the calibration tests. The code recommended by the manufacturer was implemented to operate the device with an Arduino UNO board (see
Figure 5) [
22]. The operation code initializes the device by sending each reading result at a 9600 baud rate configured in the code, and in case of any error inside the device, information about the error is sent in text messages indicating the type of error, such as a wiring connection error. Modifications were made to the manufacturer’s code to incorporate an HC-06 module that enabled wireless communication between the software and the device.
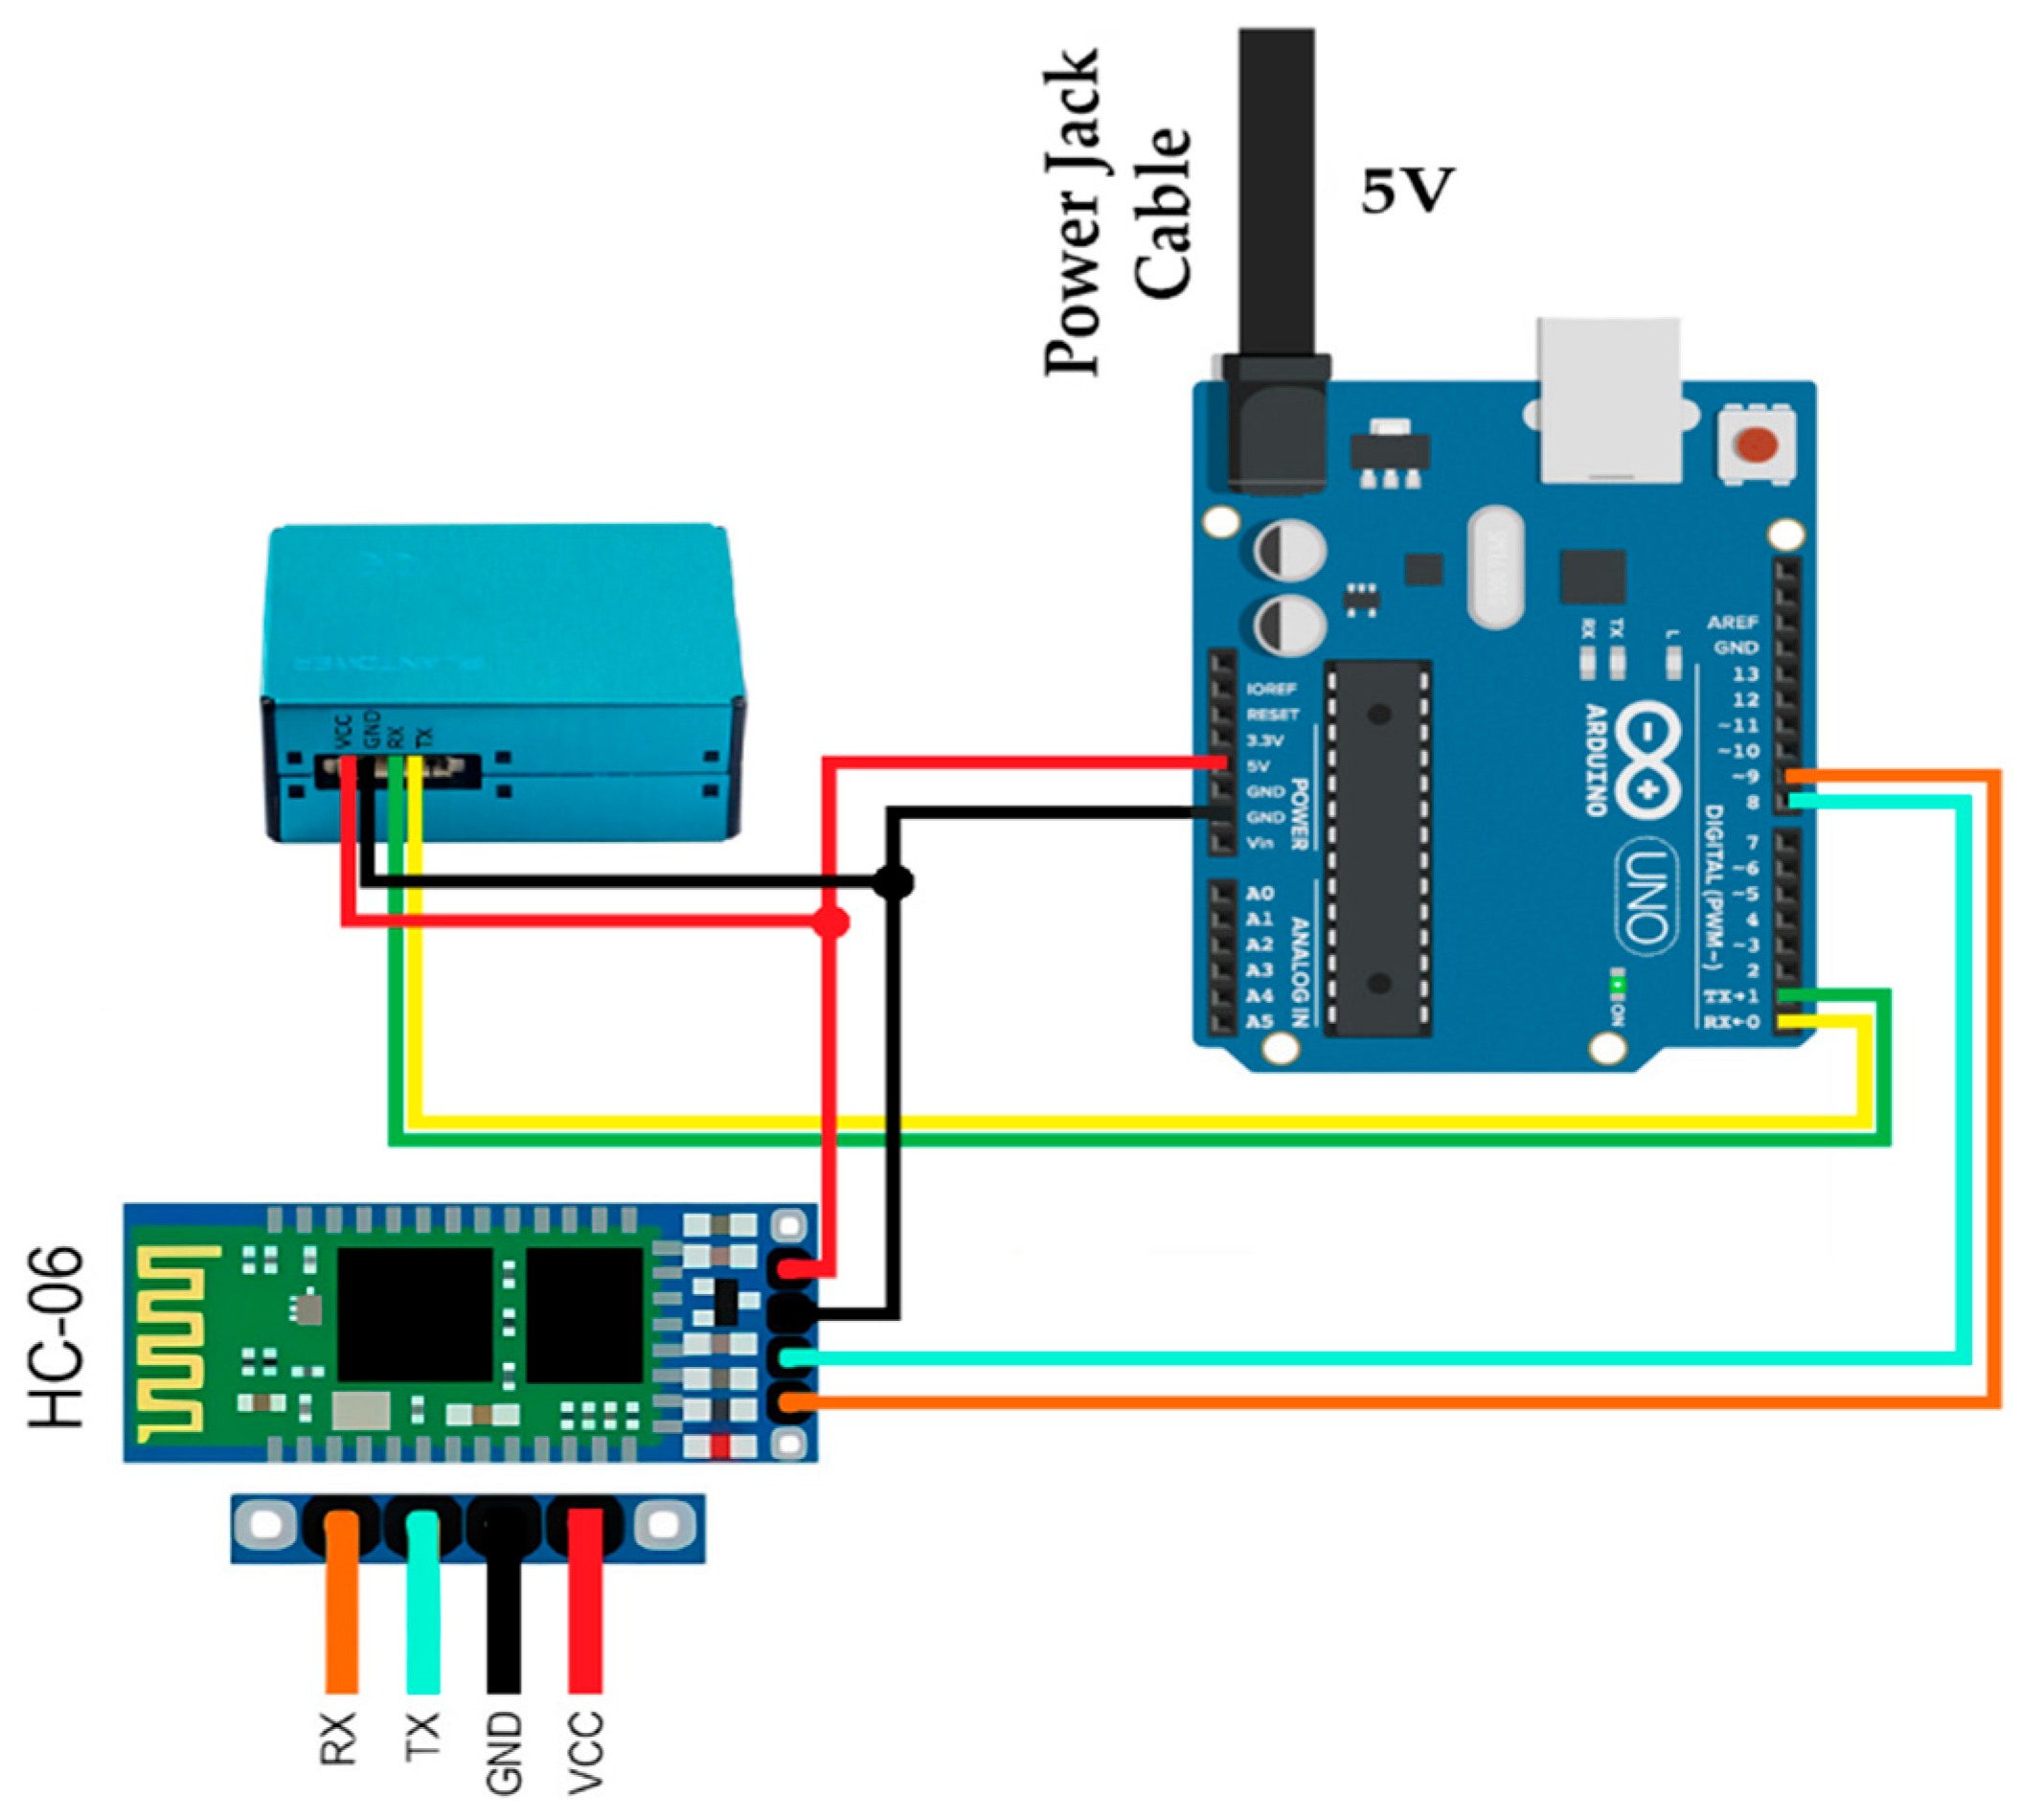
2.2.3. Sensor Plantower PMS5003
The Plantower PMS5003 sensor was used for calibration testing in which modifications were made to the Arduino library code for the sensor, enabling measurements of PM
2.5 environmental concentration and data transmission via Bluetooth through the HC-06 module, with the Arduino Uno board operating the device (see
Figure 6). The operation code initializes the device by sending the data from each reading at a 9600 baud rate (configured in the code), and in case of any error within the device, information about the error is sent in text messages indicating the type of error (e.g., wiring connection error).
2.2.4. Prana Air PAS-OUT-01 Sensor
The Prana Air PAS-OUT-01 sensor was used as a reference to calibrate the SPS30 and PMS5003 particulate matter sensors. The reason that this sensor was chosen to serve as a reference is that this sensor has been recently released into the market, and the manufacturer provides a factory calibration that usually lasts about 6 to 12 months, while the tests were performed within that time window (one year) [
23,
24]. The calibration duration depends on the use of the sensor and the environmental conditions to which it was exposed [
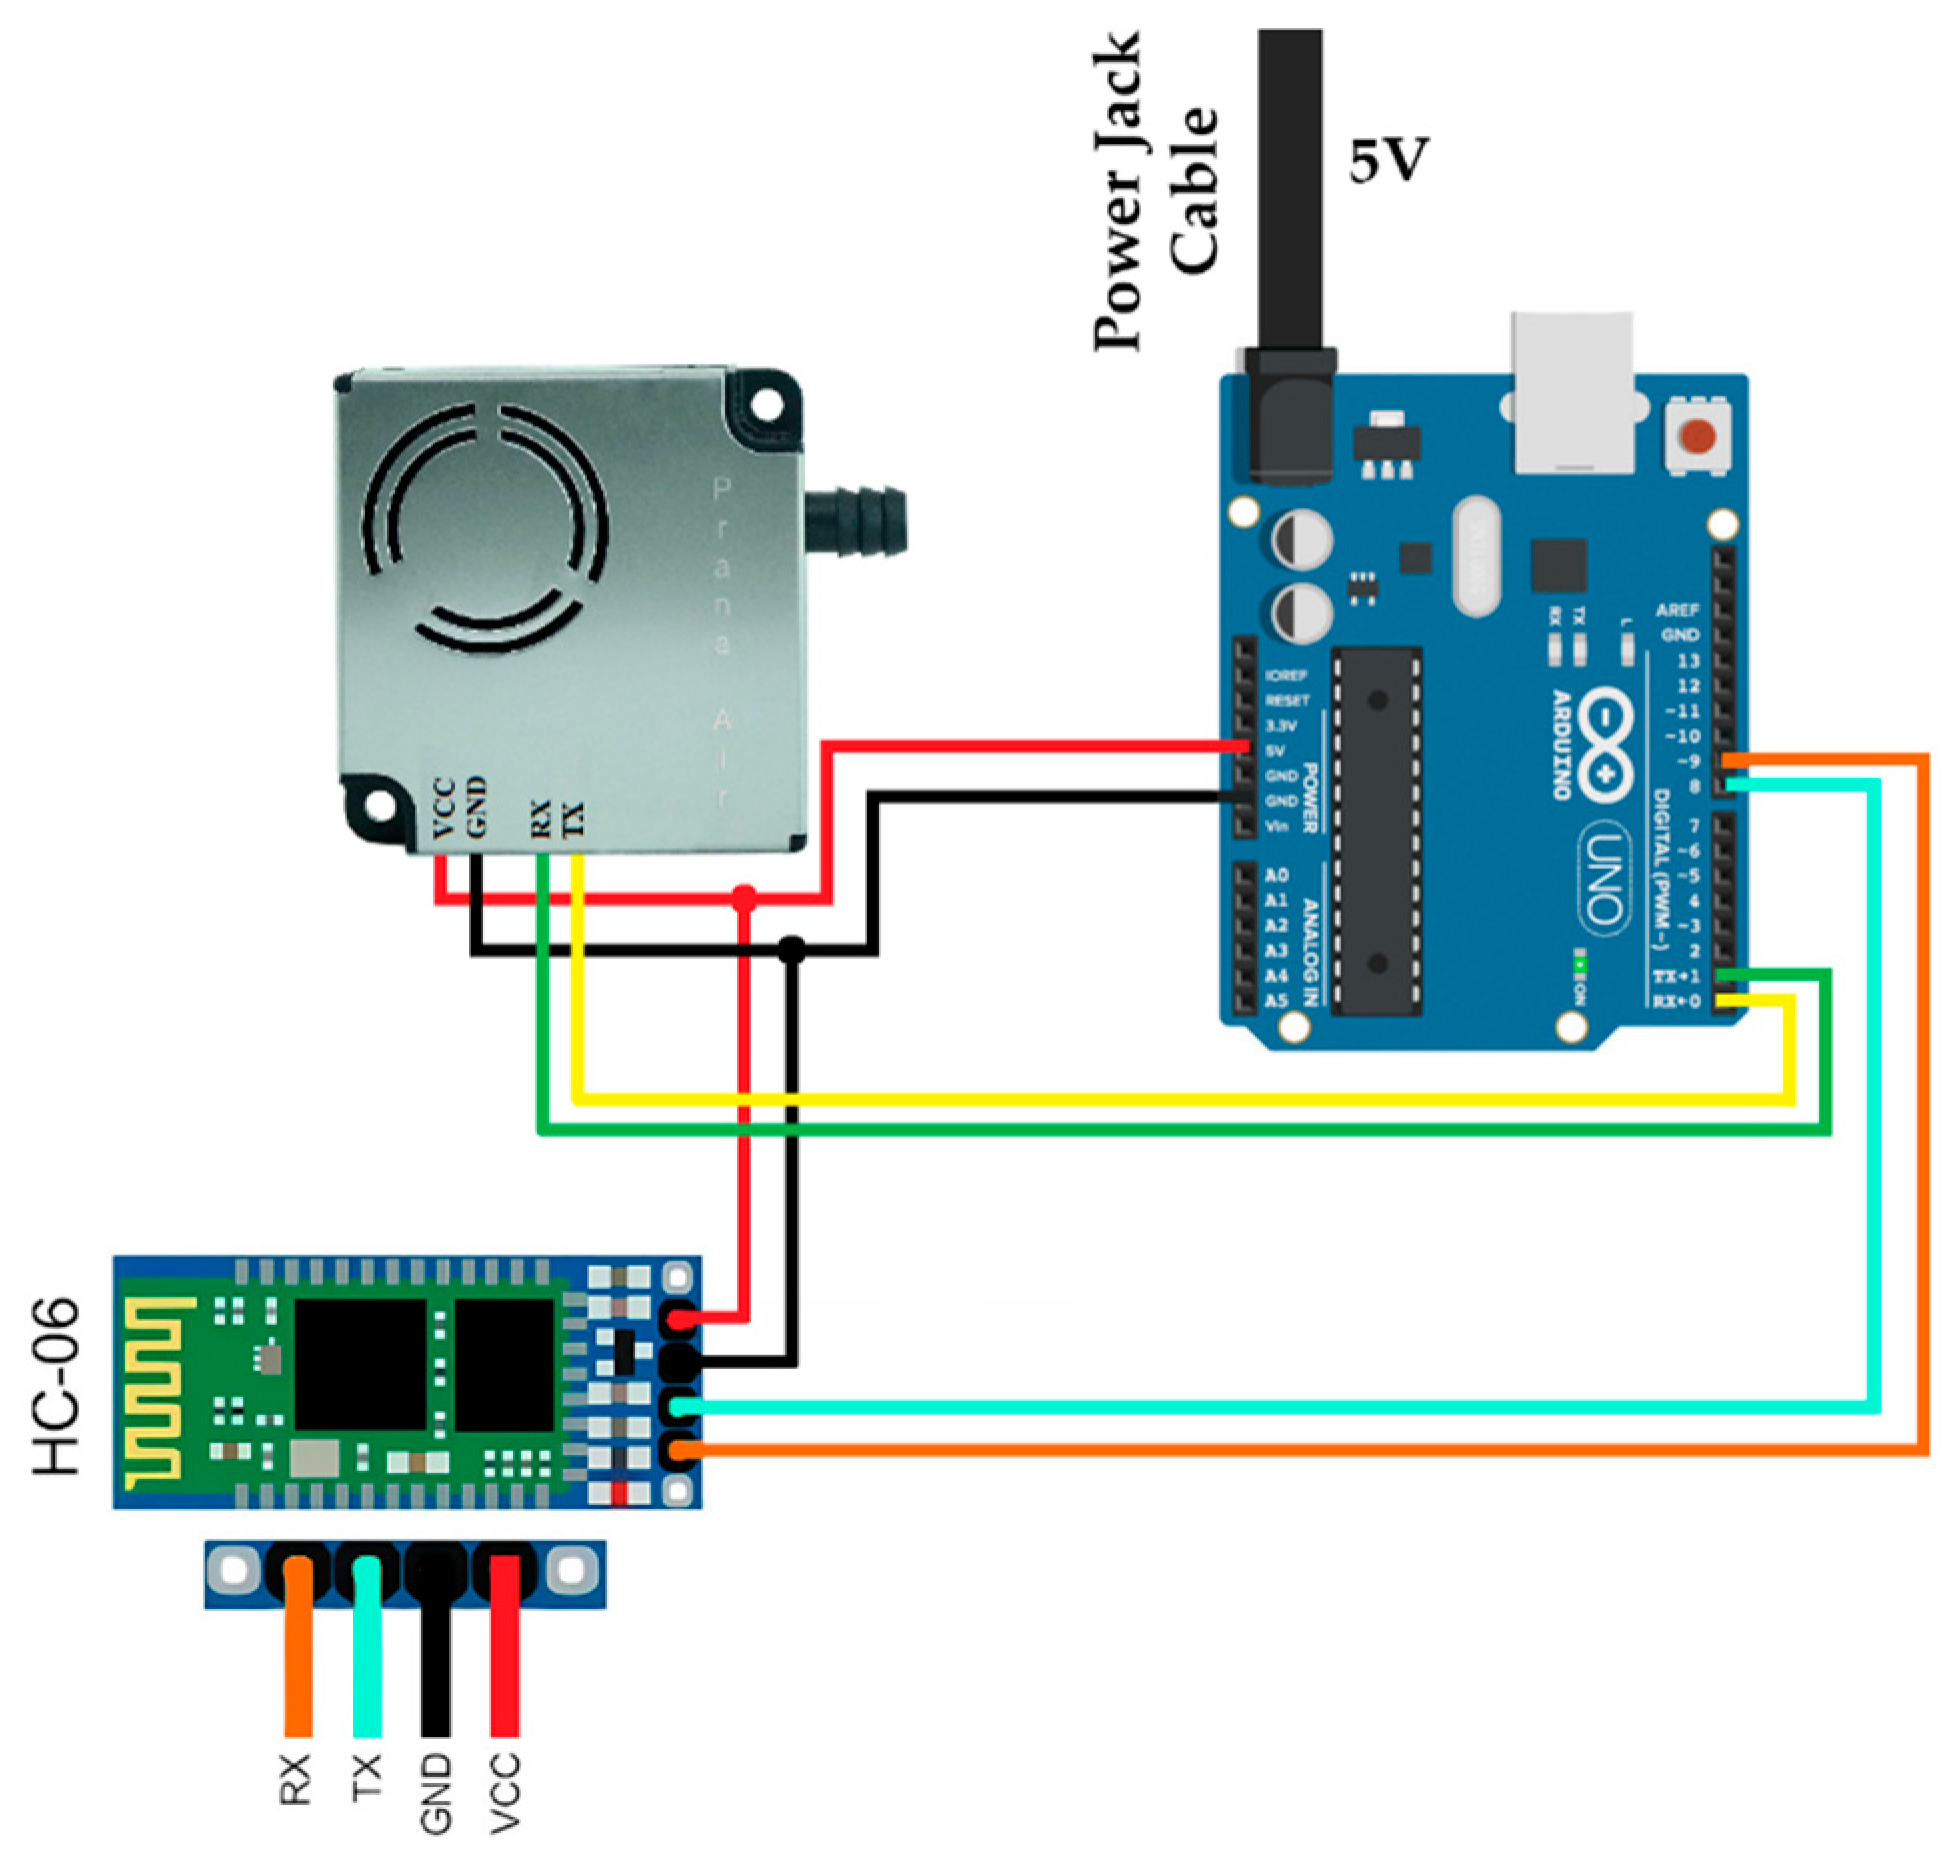
24]. The commands provided in the manufacturer’s datasheet were adapted to both operate the device and utilize an Arduino Uno board (see
Figure 7). The operation code initializes the device by sending the information of each reading at a baud rate of 9600 configured in the code, and in case of any error within the device, information about the error is sent in text messages indicating the type of error (e.g., wiring connection error). The communication was established via Bluetooth connection using an HC-06 module.
2.2.5. Particulate Matter Extraction System
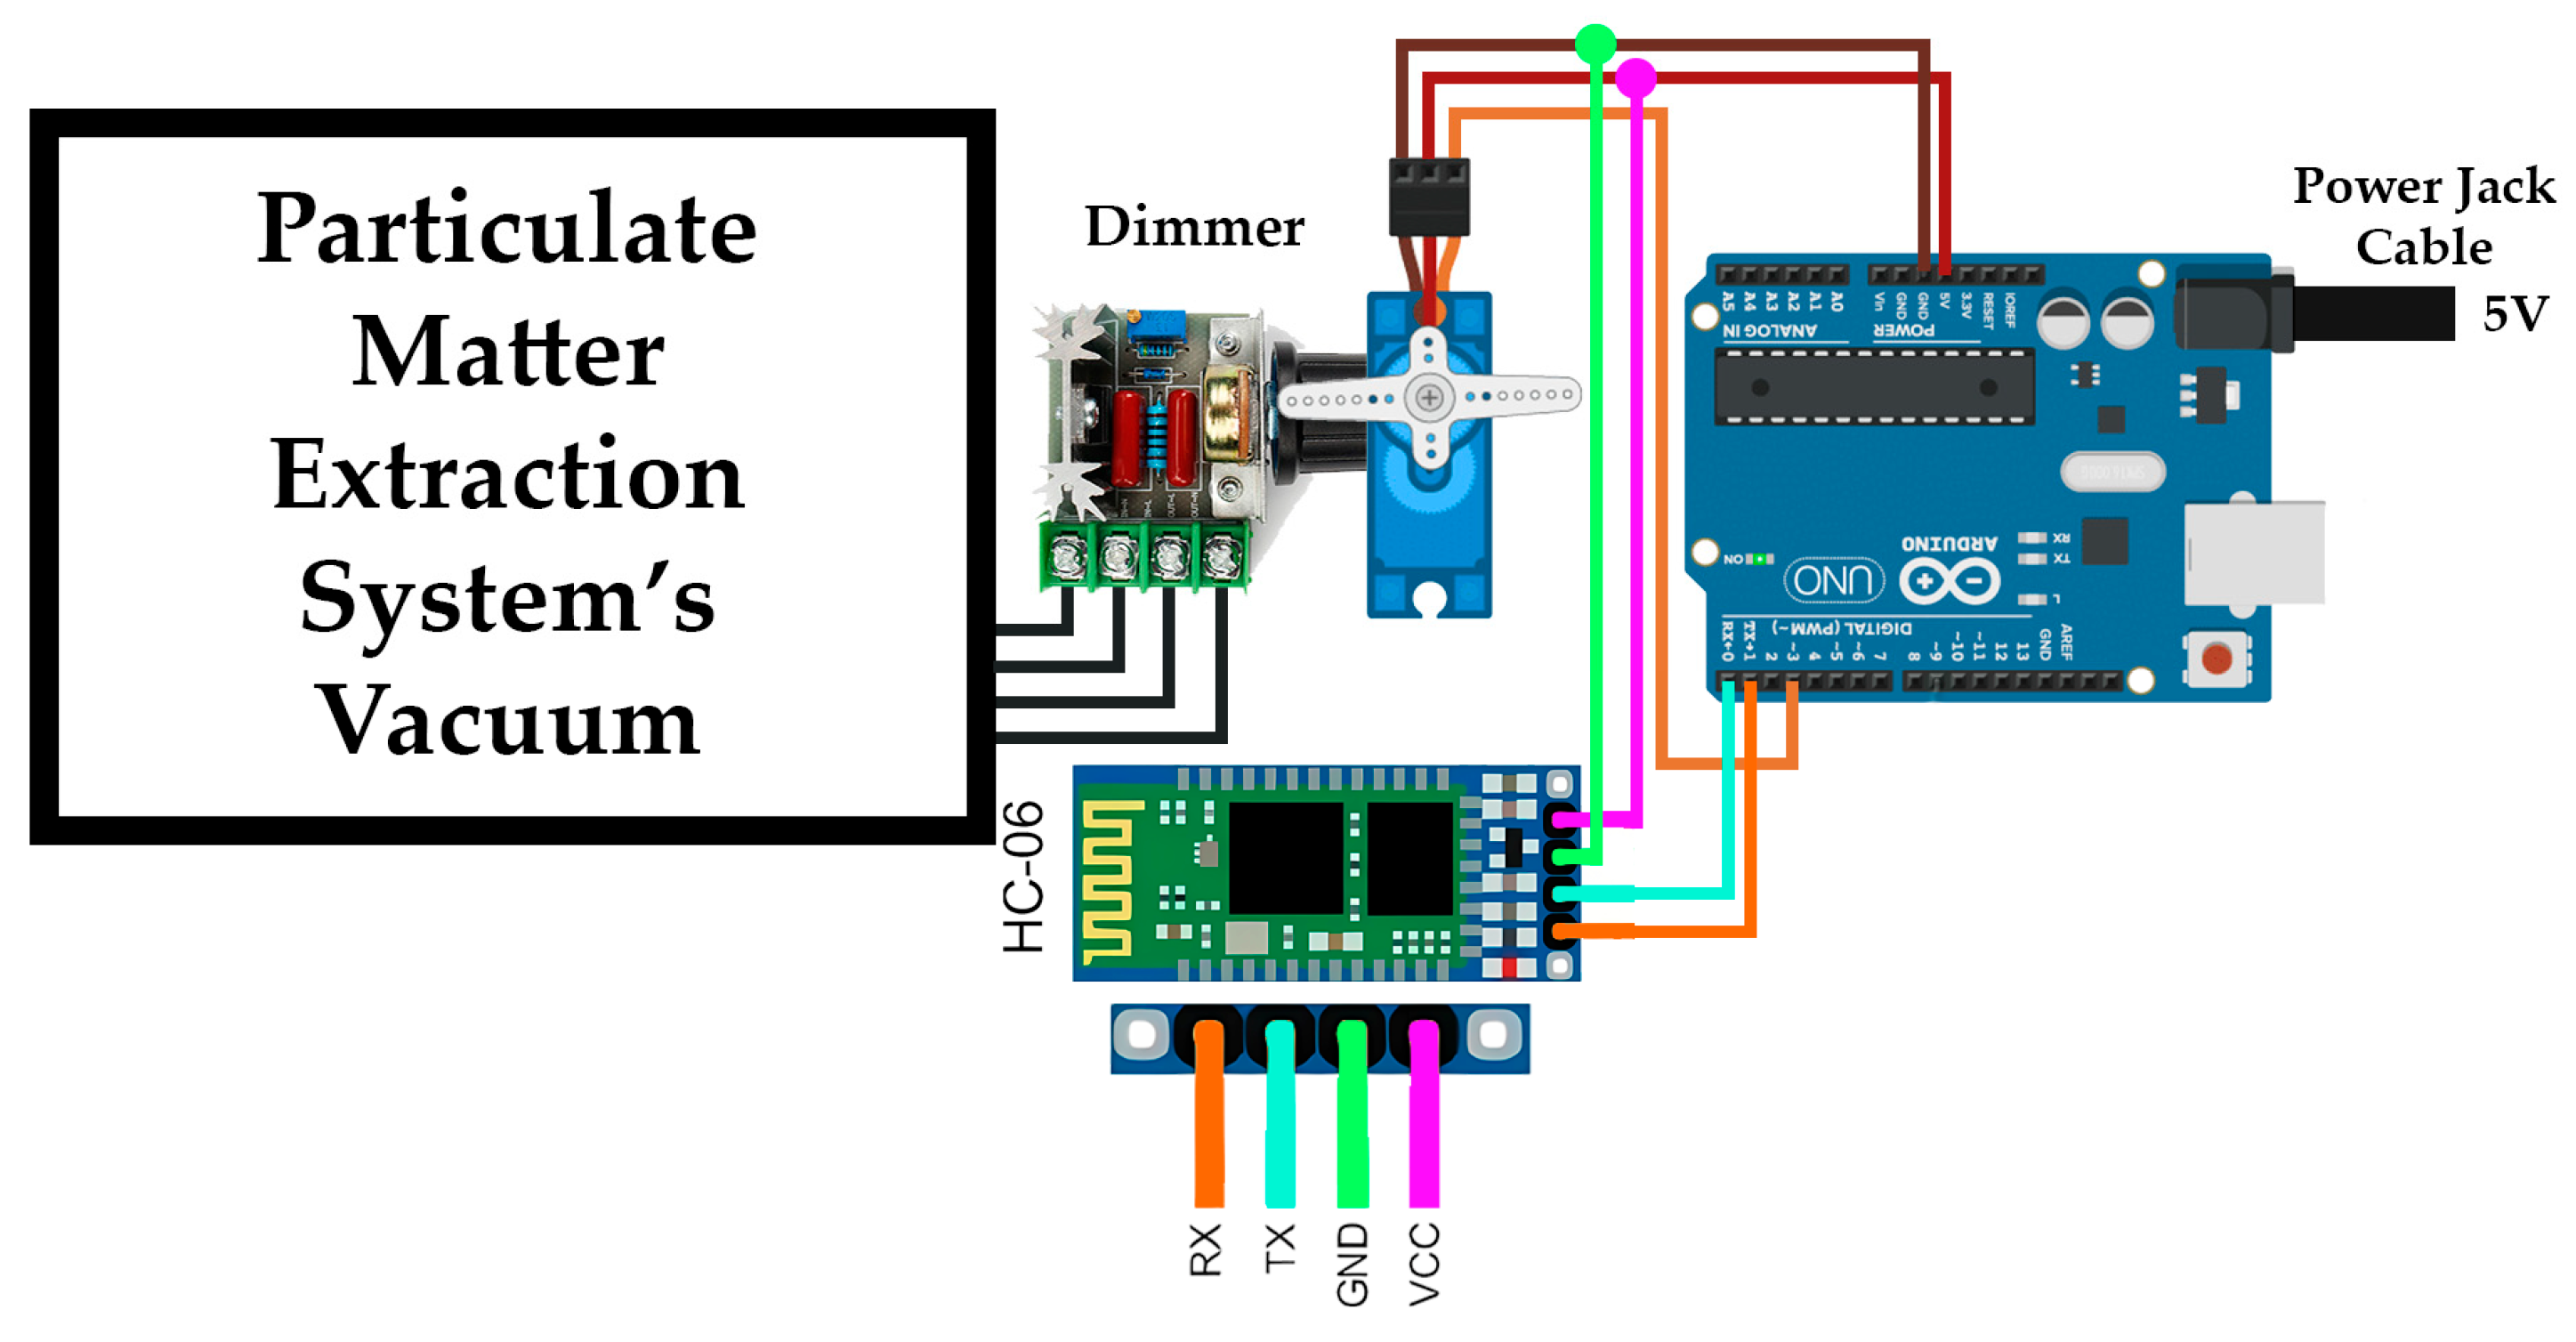
The particle extraction system is controlled by an Arduino Uno board, which is programmed to control the extraction power of a Koblenz vacuum cleaner using a servo motor to rotate a dimmer (see
Figure 8). The control is implemented through commands with predefined values for each intensity level: low, medium and maximum. To enable communication between the Arduino Uno board and a computer, a Bluetooth wireless connection module was used (HC-06 module).
2.2.6. GY-39 Environmental Sensor
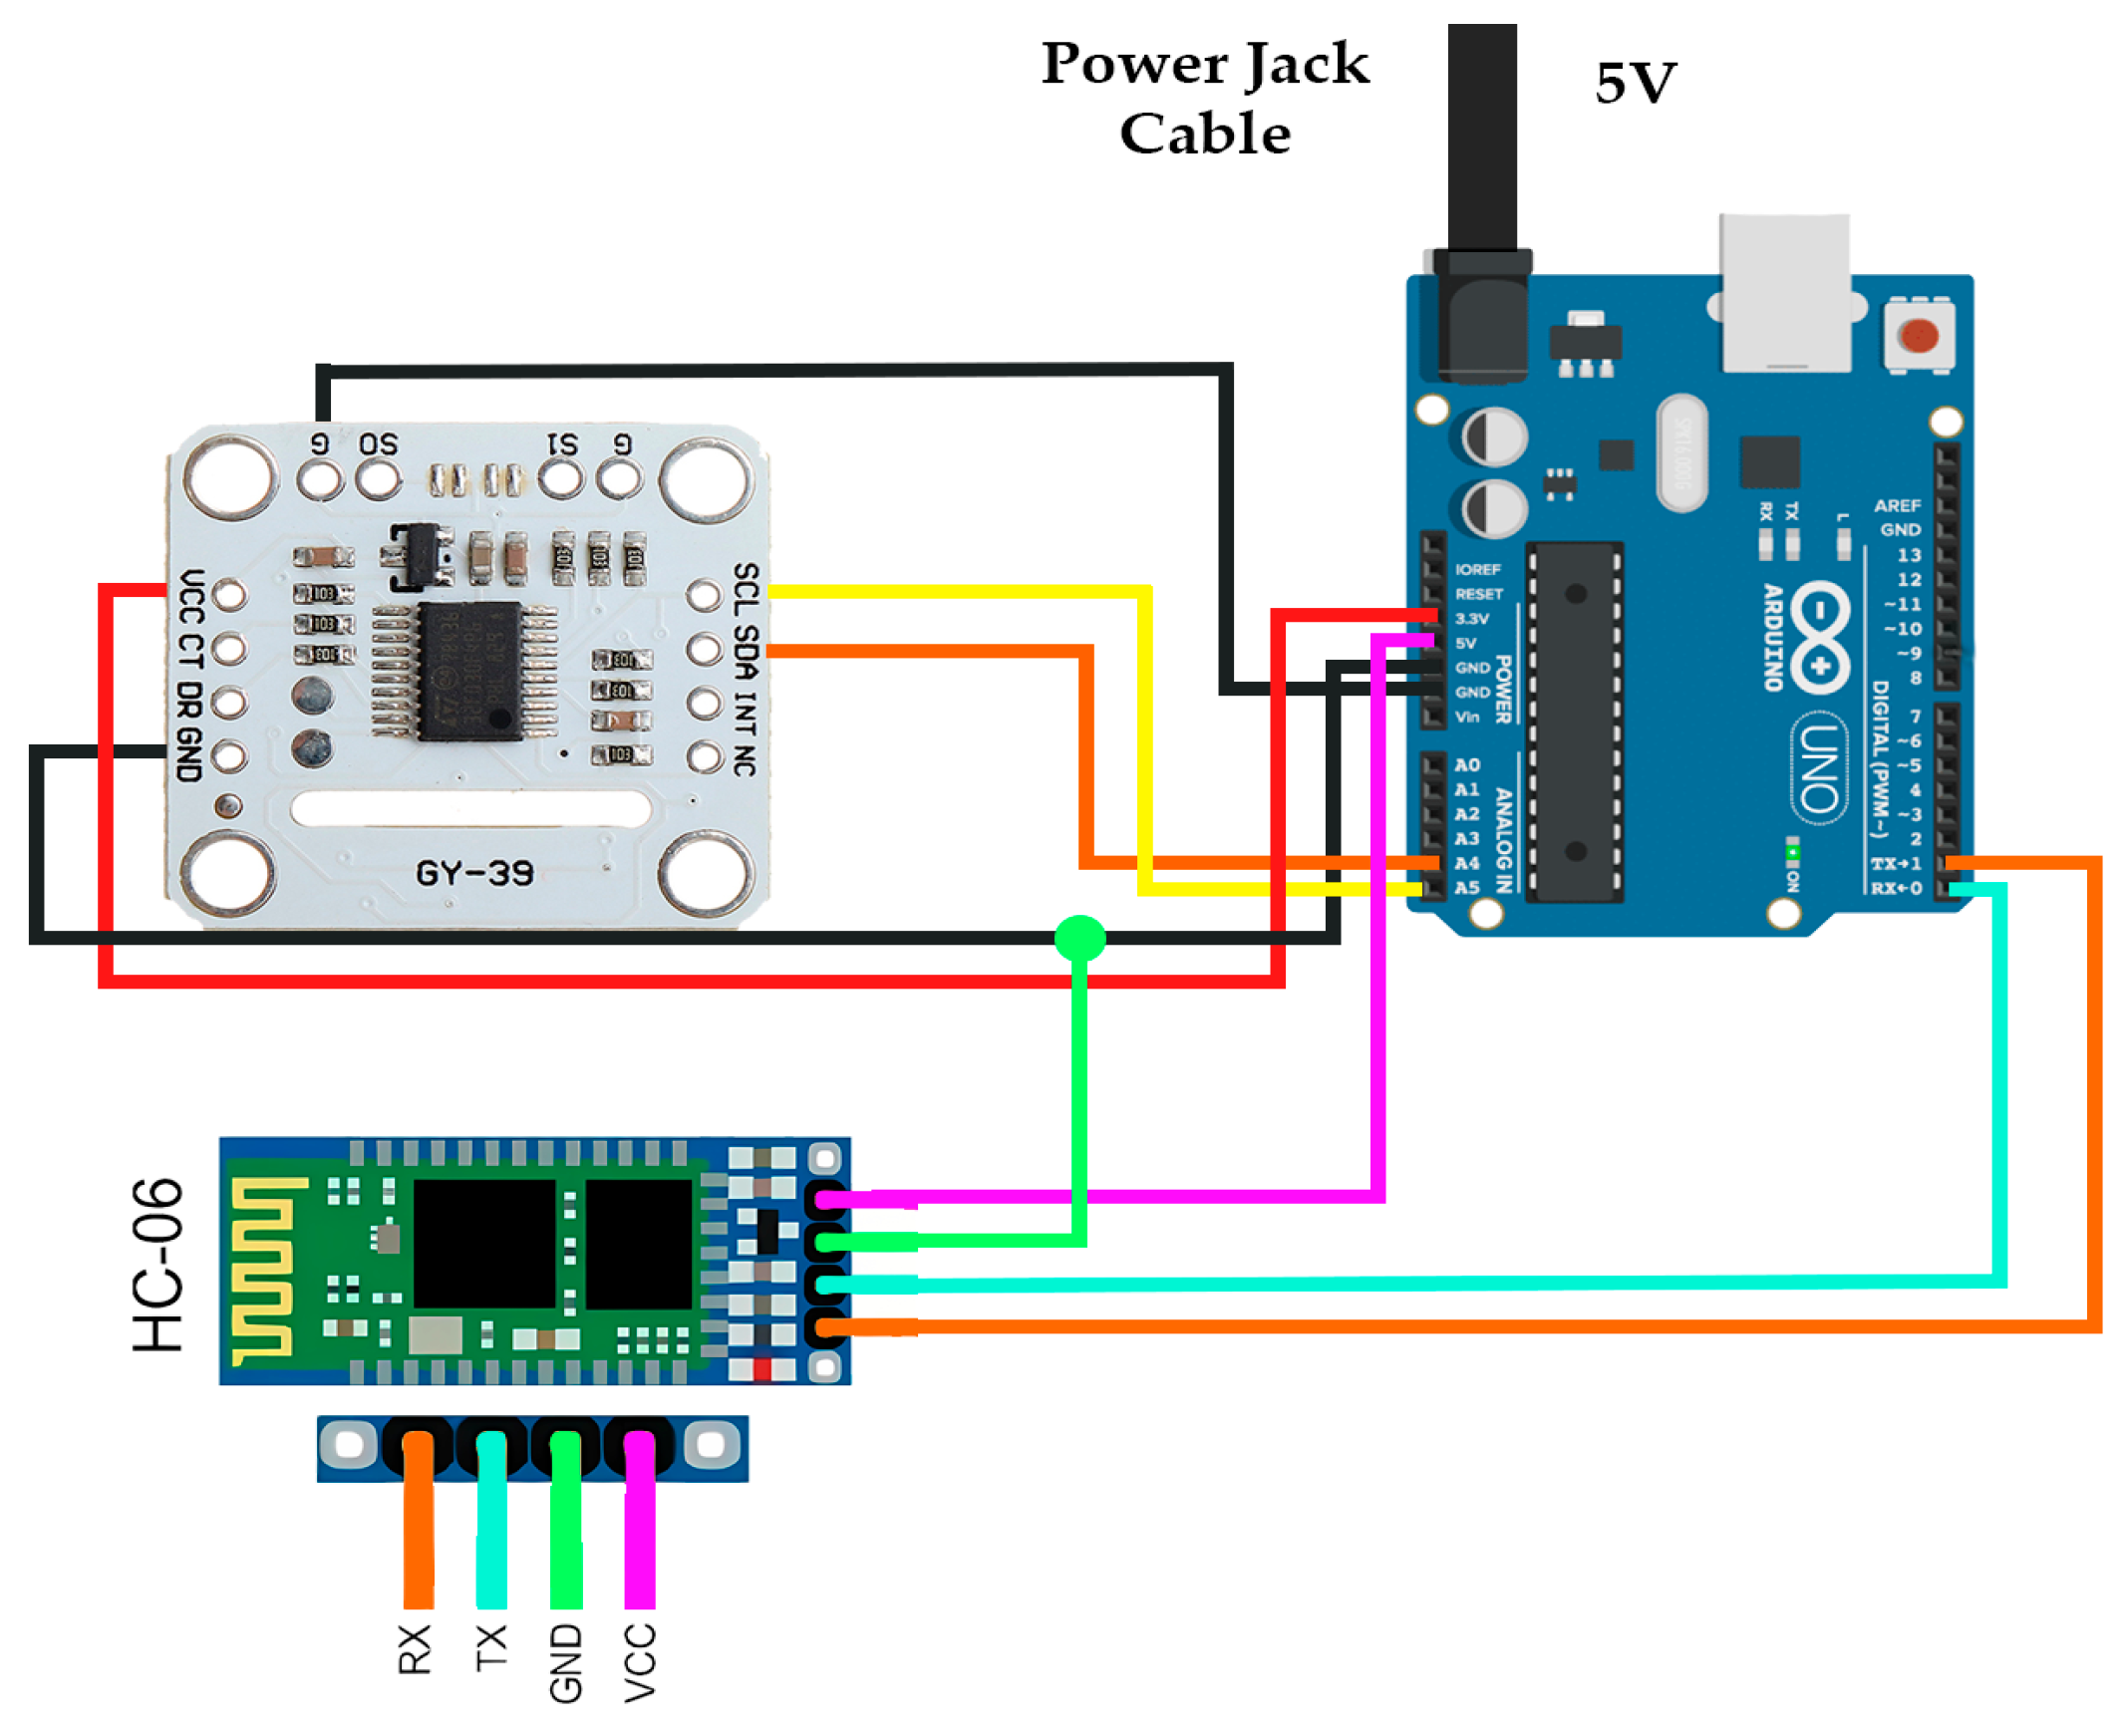
The GY-39 environmental sensor is controlled by an Arduino Uno board (see
Figure 9); the sensor has the capability to monitor temperature (°C), relative humidity (%), atmospheric pressure (hPa), altitude (m) and illuminance (lux). The HC-06 module was used to transmit sensor measurements via Bluetooth. The data is collected and recorded in real time on a computer using the software developed in Python.
2.3. Software Description
A software was developed to monitor PM in the air to calibrate PM sensors. This was achieved by controlling the sensors and monitoring devices in a real-time controlled environment, through actuators to control the intake of PM and clean air into the chamber, the airflow inside the chamber using a ventilation network and the extraction of PM.
The software was developed using Python version 3.10.2 and the libraries listed in
Table 1.
2.4. Software Architecture
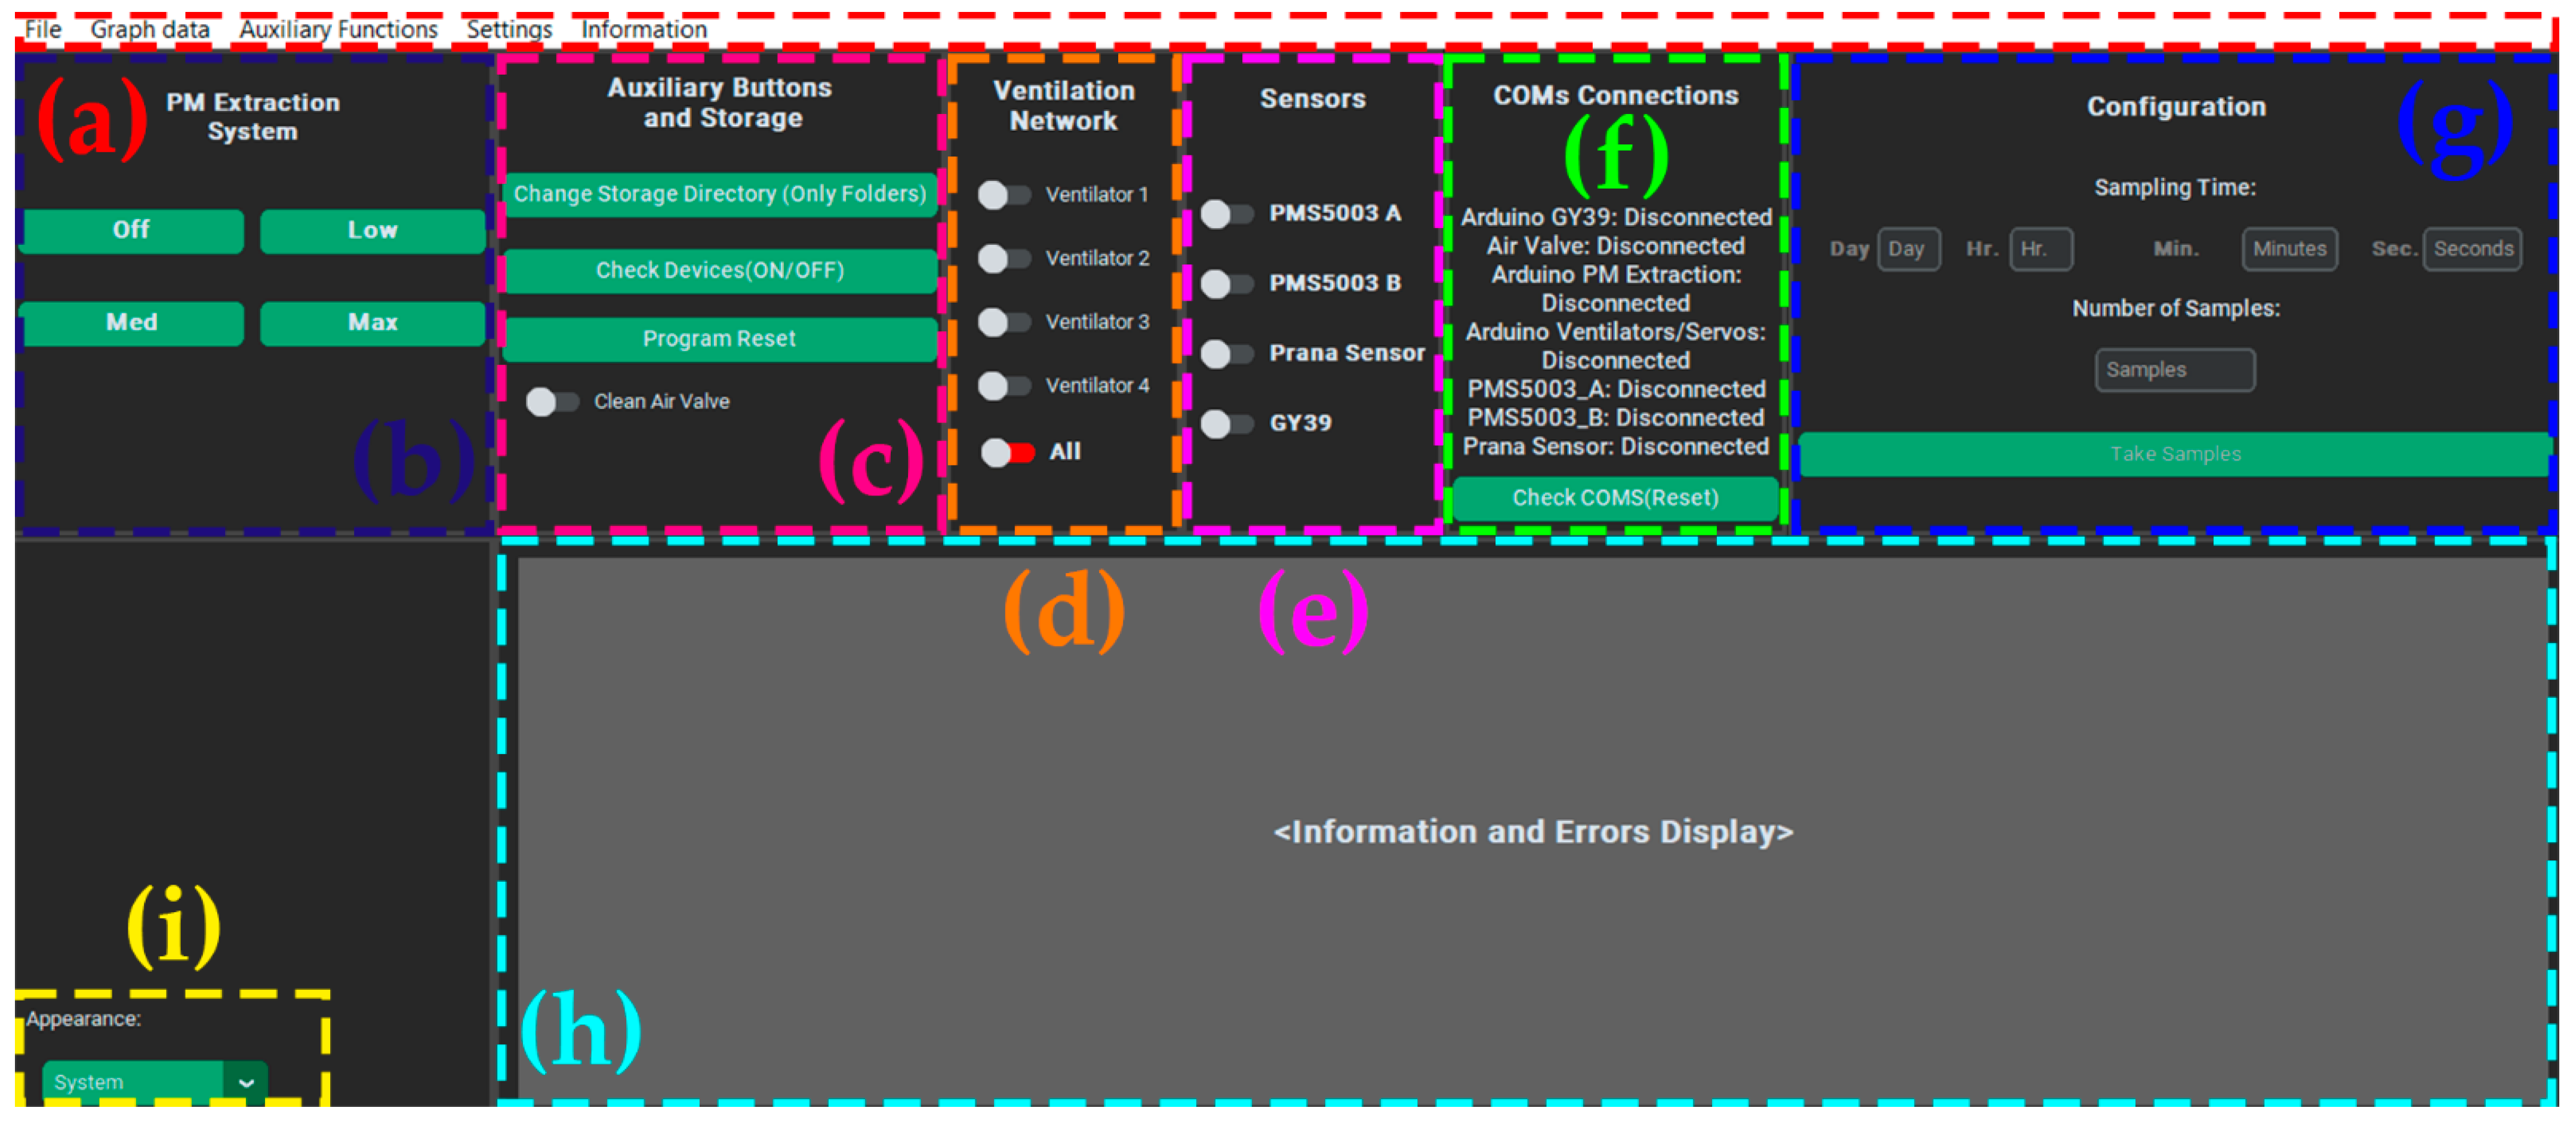
The software comprises different libraries for the control of sensors (GY-39, PAS-OUT-01, PMS5003 and SPS30), actuators (ventilation network, particle extraction system, monitoring devices and environmental sensors), auxiliary and storage buttons, configuration of the appearance of the graphical environment, COM ports for connection of sensors and devices, sampling configuration and display of information.
Figure 10 shows the graphical environment.
2.5. Software Functionalities
This subsection provides an overview of the software and the functions of each module presented below (see
Figure 10 to visualize the control buttons of each module).
2.5.1. Particulate Matter Extraction System Software Module
This module controls an adapted extraction device with a dimmer to control the power through an Arduino Uno board, which establishes the power that the device will receive according to the commands received through a computer (which communicates with the Arduino). The control sets one of four modes: off, low, medium and maximum.
2.5.2. Environmental Sensors and Monitoring Devices
The code incorporates a delay with a timer to wait for devices that need to be turned on or off using a servo motor to initialize correctly, preventing connection errors with the code. While the monitoring device is being initialized, the code disables all the switches of each sensor and device, since turning off a device immediately after turning it on may cause connectivity errors, which will require restarting the program.
2.5.3. Ventilation Control Network Software Module
This module controls 4 fans either individually or all at once. An L293d motor shield board is connected to the top of an Arduino Uno board, which controls the power and direction of each fan. The speed of the fans is not modulated and therefore remains constant. In addition, the L293d motor shield board also controls the servo motors mounted on monitoring devices that require a button to be pressed to turn on.
2.5.4. Sensor’s COM Check
This module displays all devices and sensors, indicating whether they are connected (showing their COM number) or disconnected; the scanning process is performed upon software startup. This module also has a “Check COMs” button that re-scans the devices and sensors and the corresponding COM number on the computer, as well as whether they are disconnected (showing the label information on the screen).
2.5.5. Sampling Configuration
This module controls the sampling frequency (samples/time) established by the user in the software, configuring the number of samples and their intervals. In this module, the minimum sampling rate is 1 Hz. In addition, it disables the number of samples and the sampling time entries while recording.
This prototype measures and records data over extended periods of time, which often leads to errors in the recordings, resulting in data loss known as missing data. Additionally, another issue that occurs during sampling is invalid data, which includes empty spaces or random characters. To mitigate erroneous or missing data, the program includes an algorithm that acts as a filter to prevent these from occurring.
2.5.6. Auxiliary Buttons and Storage
The aim of this module is to provide more tools to help the user when encountering problems within the software or hardware; it has a button to select the folder where the documents will be saved in a CSV file for each device or sensor. The button labeled “Change Storage Directory (Folders Only)” lets you select the folder where the files will be saved. The button labeled “Check Devices (ON/OFF)” verifies once again that the monitoring devices that require servo motors have been correctly turned off or on, correcting them if an error occurs. In addition, the button labeled “Program Reset” resets the calibration chamber control center software.
2.6. Graph Data
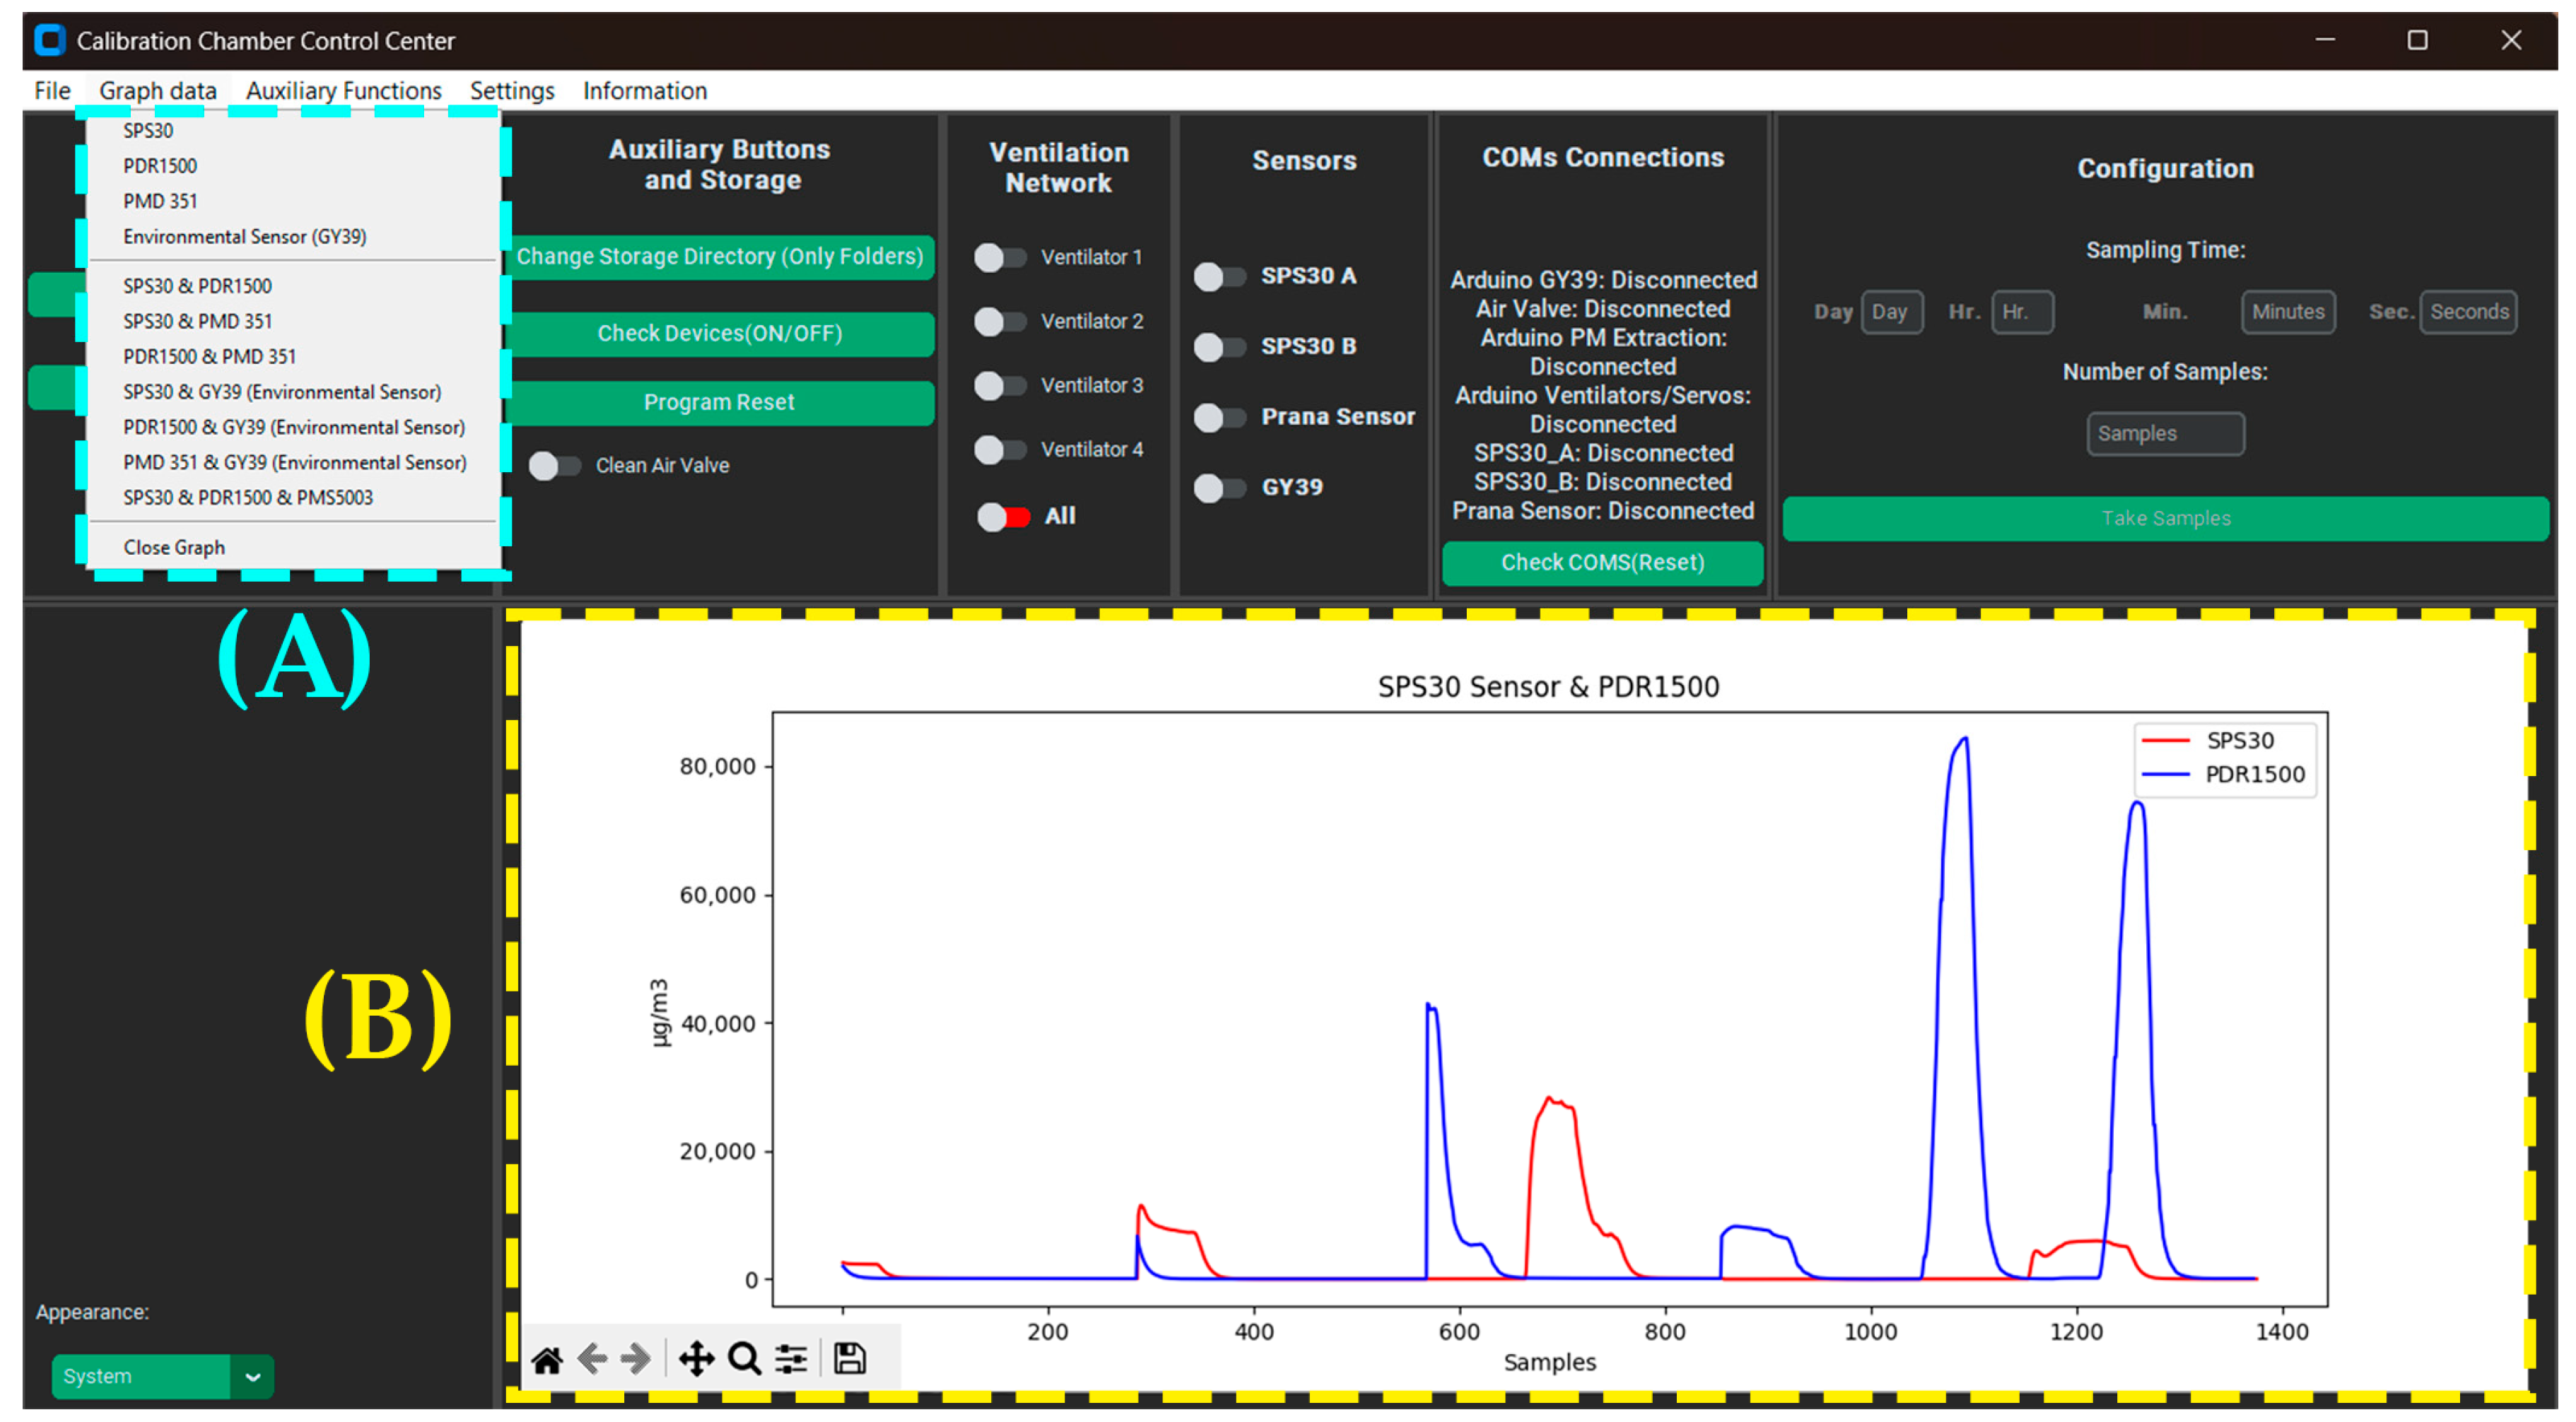
This function is located in the toolbar with the label “Graph Data”. It allows graphing the CVS files from the sampling performed by the program. This function allows comparison between different parameters, sensor readings, and is able to save the graph in PDF (Portable Document Format) format. The graph and the function options can be viewed in
Figure 11.
2.7. Software Structure and Python Programming
The software was programmed using Python version 3.10.2 with the CustomTkinter graphical user interface (GUI) (custom library based on Tkinter). The program employed several libraries/modules, as shown in
Table 1, that allow monitoring, taking measurements and saving the information in CSV format according to the sampling frequency (specified by the user).
2.8. Calibration of the Sensors SENSIRION SPS30 and Plantower PMS5003
As a pollution source, 0.46 μm latex and polystyrene beads were used in aqueous suspension. An aqueous suspension with a 5.0 × 10⁻⁶ percent concentration was created by diluting a 50 μL aliquot from a 10% aqueous suspension in 1 L of distilled water. These particles were introduced into the calibration chamber using a monodisperse system that includes a nebulizer to suspend the particles in the air. These particles were used to observe the behavior of the sensors with ultrafine particles; however, any particle size could be used to perform tests as long as their size is within the sensor’s range.
Two calibration tests were performed, which consisted of calibrating two SENSIRION SPS30 sensors and two PMS5003 sensors using the Prana Air PAS-OUT-01 sensor as a reference. Both tests are performed in three steps:
Tests with both sensors uncalibrated: This test has the purpose of obtaining information to calibrate the sensors. Linear regression is used to create a correction to the code of the sensor using the PAS-OUT-01 sensor as a reference. In addition, Pearson (r) correlations for each uncalibrated sensor were determined.
Test with both sensors calibrated: This test consists of comparing both calibrated sensors with the reference sensor. The Pearson (r) correlation was determined between the reference sensor and the calibrated sensors.
To perform the aforementioned tests, the use of KN95 masks, vinyl gloves, a lab coat and an extraction bell is required to reduce the possible health risks while managing PM.
The process for conducting the tests is as follows:
Turn on the extraction bell and put on the vinyl gloves and KN95 mask to avoid being exposed to PM.
Turn on all the devices and actuators of the calibration chamber.
Start the control center software GUI and confirm that every device and actuator is properly connected to the computer.
With caution, pour the PM solution into the nebulizer in the monodisperse system.
Turn on the air pump to introduce the PM into the calibration chamber. The monodisperse system pressure was adjusted to 10 PSI with a flow rate of 2 LPM (liters per minute).
Turn on the ventilation system to circulate the PM particles through the chamber.
Wait for 3 min before starting the sampling, in order to allow the chamber to fill with PM. Sampling is performed for 10 min, recording a total of 200 samples (1 sample every three seconds).
After sampling is completed, activate the three-way valve on the monodisperse system to stop introducing PM into the chamber and introduce clean air instead.
Wait 3 min and then turn off the air pump (Note: Turn off the air valve once the air pump is turned off).
Turn on the particle extraction system to extract the polluted air from inside the calibration chamber. It usually takes around 3 min to remove all the particles from inside the calibration chamber. The pollutant particles are collected in the extraction system to be later delivered to a specialist waste management company for proper disposal.
A linear regression model was used since linear calibration is the most common calibration method for low-cost sensors and provides similar results compared to calibrations done using more complex regression models, according to the Joint Research Centre of the European Commission [
36].
3. Results
Fifty 10-min measurement tests were conducted to verify that the files are error-free. The effectiveness of the recordings was evaluated by calculating the percentage of invalid data for each variable measured by each sensor. The three PM sensors tested (PAS-OUT-01, PMS5003, and SENSIRION SPS30) consistently measured PM2.5 with an average of 100% successfully measured data, while the GY-39 environmental sensor also achieved 100% successful recordings for pressure, temperature, relative humidity, luminescence, and height.
During calibration tests of the PMS5003 sensors, the mean environmental values presented by the GY-39 sensor were 34.06 °C for temperature, 989.88 hPa for atmospheric pressure, 36.66% for relative humidity and 22.50 lux for illuminance. Regarding the calibration tests of the SENSIRION SPS30 sensors, the mean environmental values presented by the GY-39 sensor were 34.16 °C for temperature, 990.34 hPa for atmospheric pressure, 34.16% for relative humidity and 20.14 lux for illuminance.
The Prana Air PAS-OUT-01 sensor was used as a reference to validate the precision of the sensors SENSIRION SPS30 (SPS) and Plantower PMS5003 (PMS). The calibration chamber was controlled through a computer using software with a GUI and connected wirelessly through an HC-06 Bluetooth module.
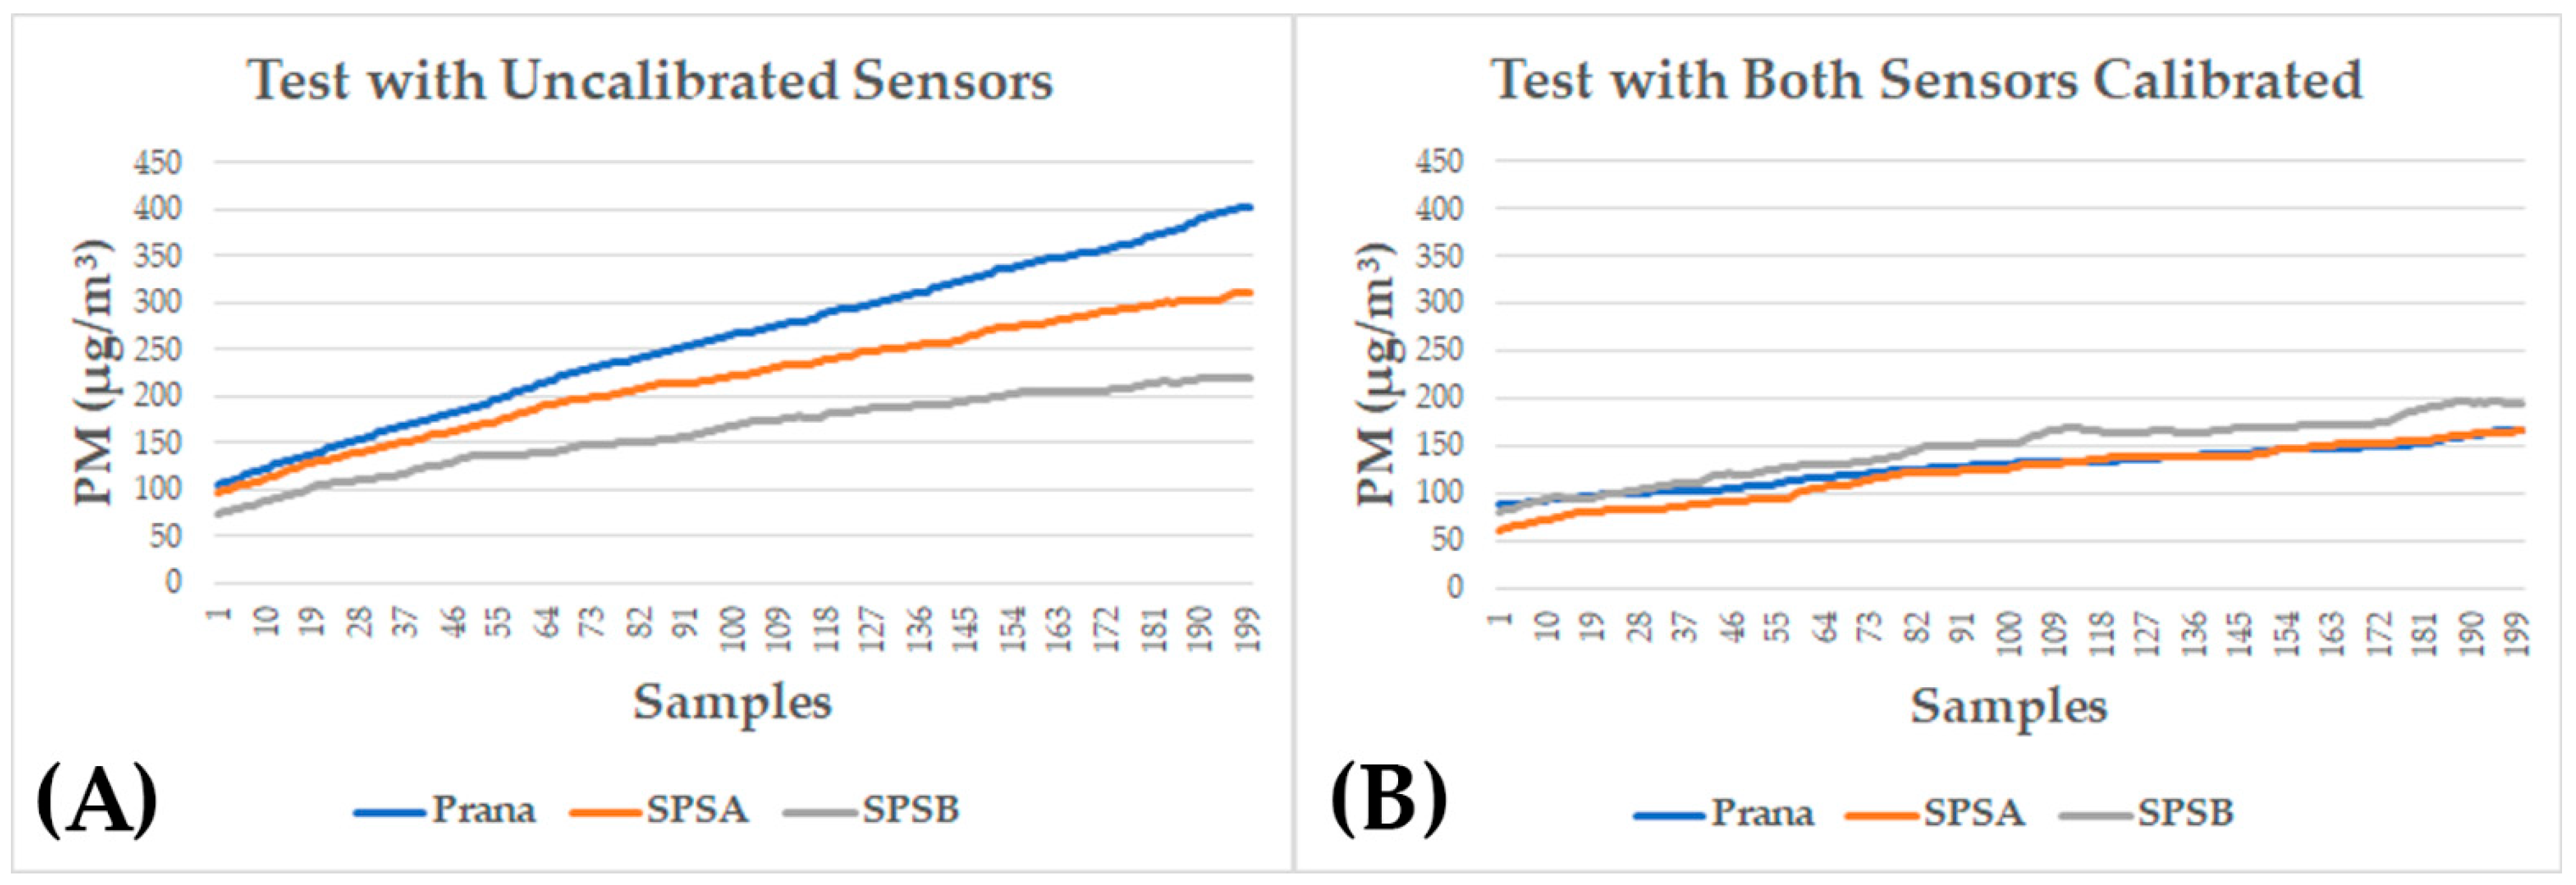
In the first calibration test of the SENSIRION SPS30 sensors, the behavior of the sensors is observed in
Figure 12A in relation to the particulate matter concentration. Subsequently, from this test, linear regression models were determined for the two SPS30 sensors with respect to the reference sensor PAS-OUT-01, using Python to determine the correction equation for each SPS30 sensor. The model consists of the form:
where “y” represents the corrected value and “x” represents the sensor’s reading. The linear regression model for the SPS30 A sensor was y = 1.384x + (−40.834), while the linear regression model for the SPS30 B sensor was y = 2.035x + (−69.805). In addition, Pearson correlation tests (r) were performed using Python between each of the SPS30 sensors and the Prana Air PAS-OUT-01 sensor.
The descriptive statistics of the sensors, both in calibrated and non-calibrated conditions, together with the reference sensor Prana Air PAS-OUT-01, are presented in
Table 2. For each test, the minimum, maximum, mean, and standard deviation of the measurements are reported. Additionally, the mean difference (Δ) and the standard deviation of the differences (SD Δ) between each sensor and the reference are shown. These statistics provide a complementary view of the calibration tests, showing a quantitative description of the measurement’s ranges, the central tendency, and the variability of each sensor, as well as the difference between each sensor and its reference instrument and the amount of variability in those changes.
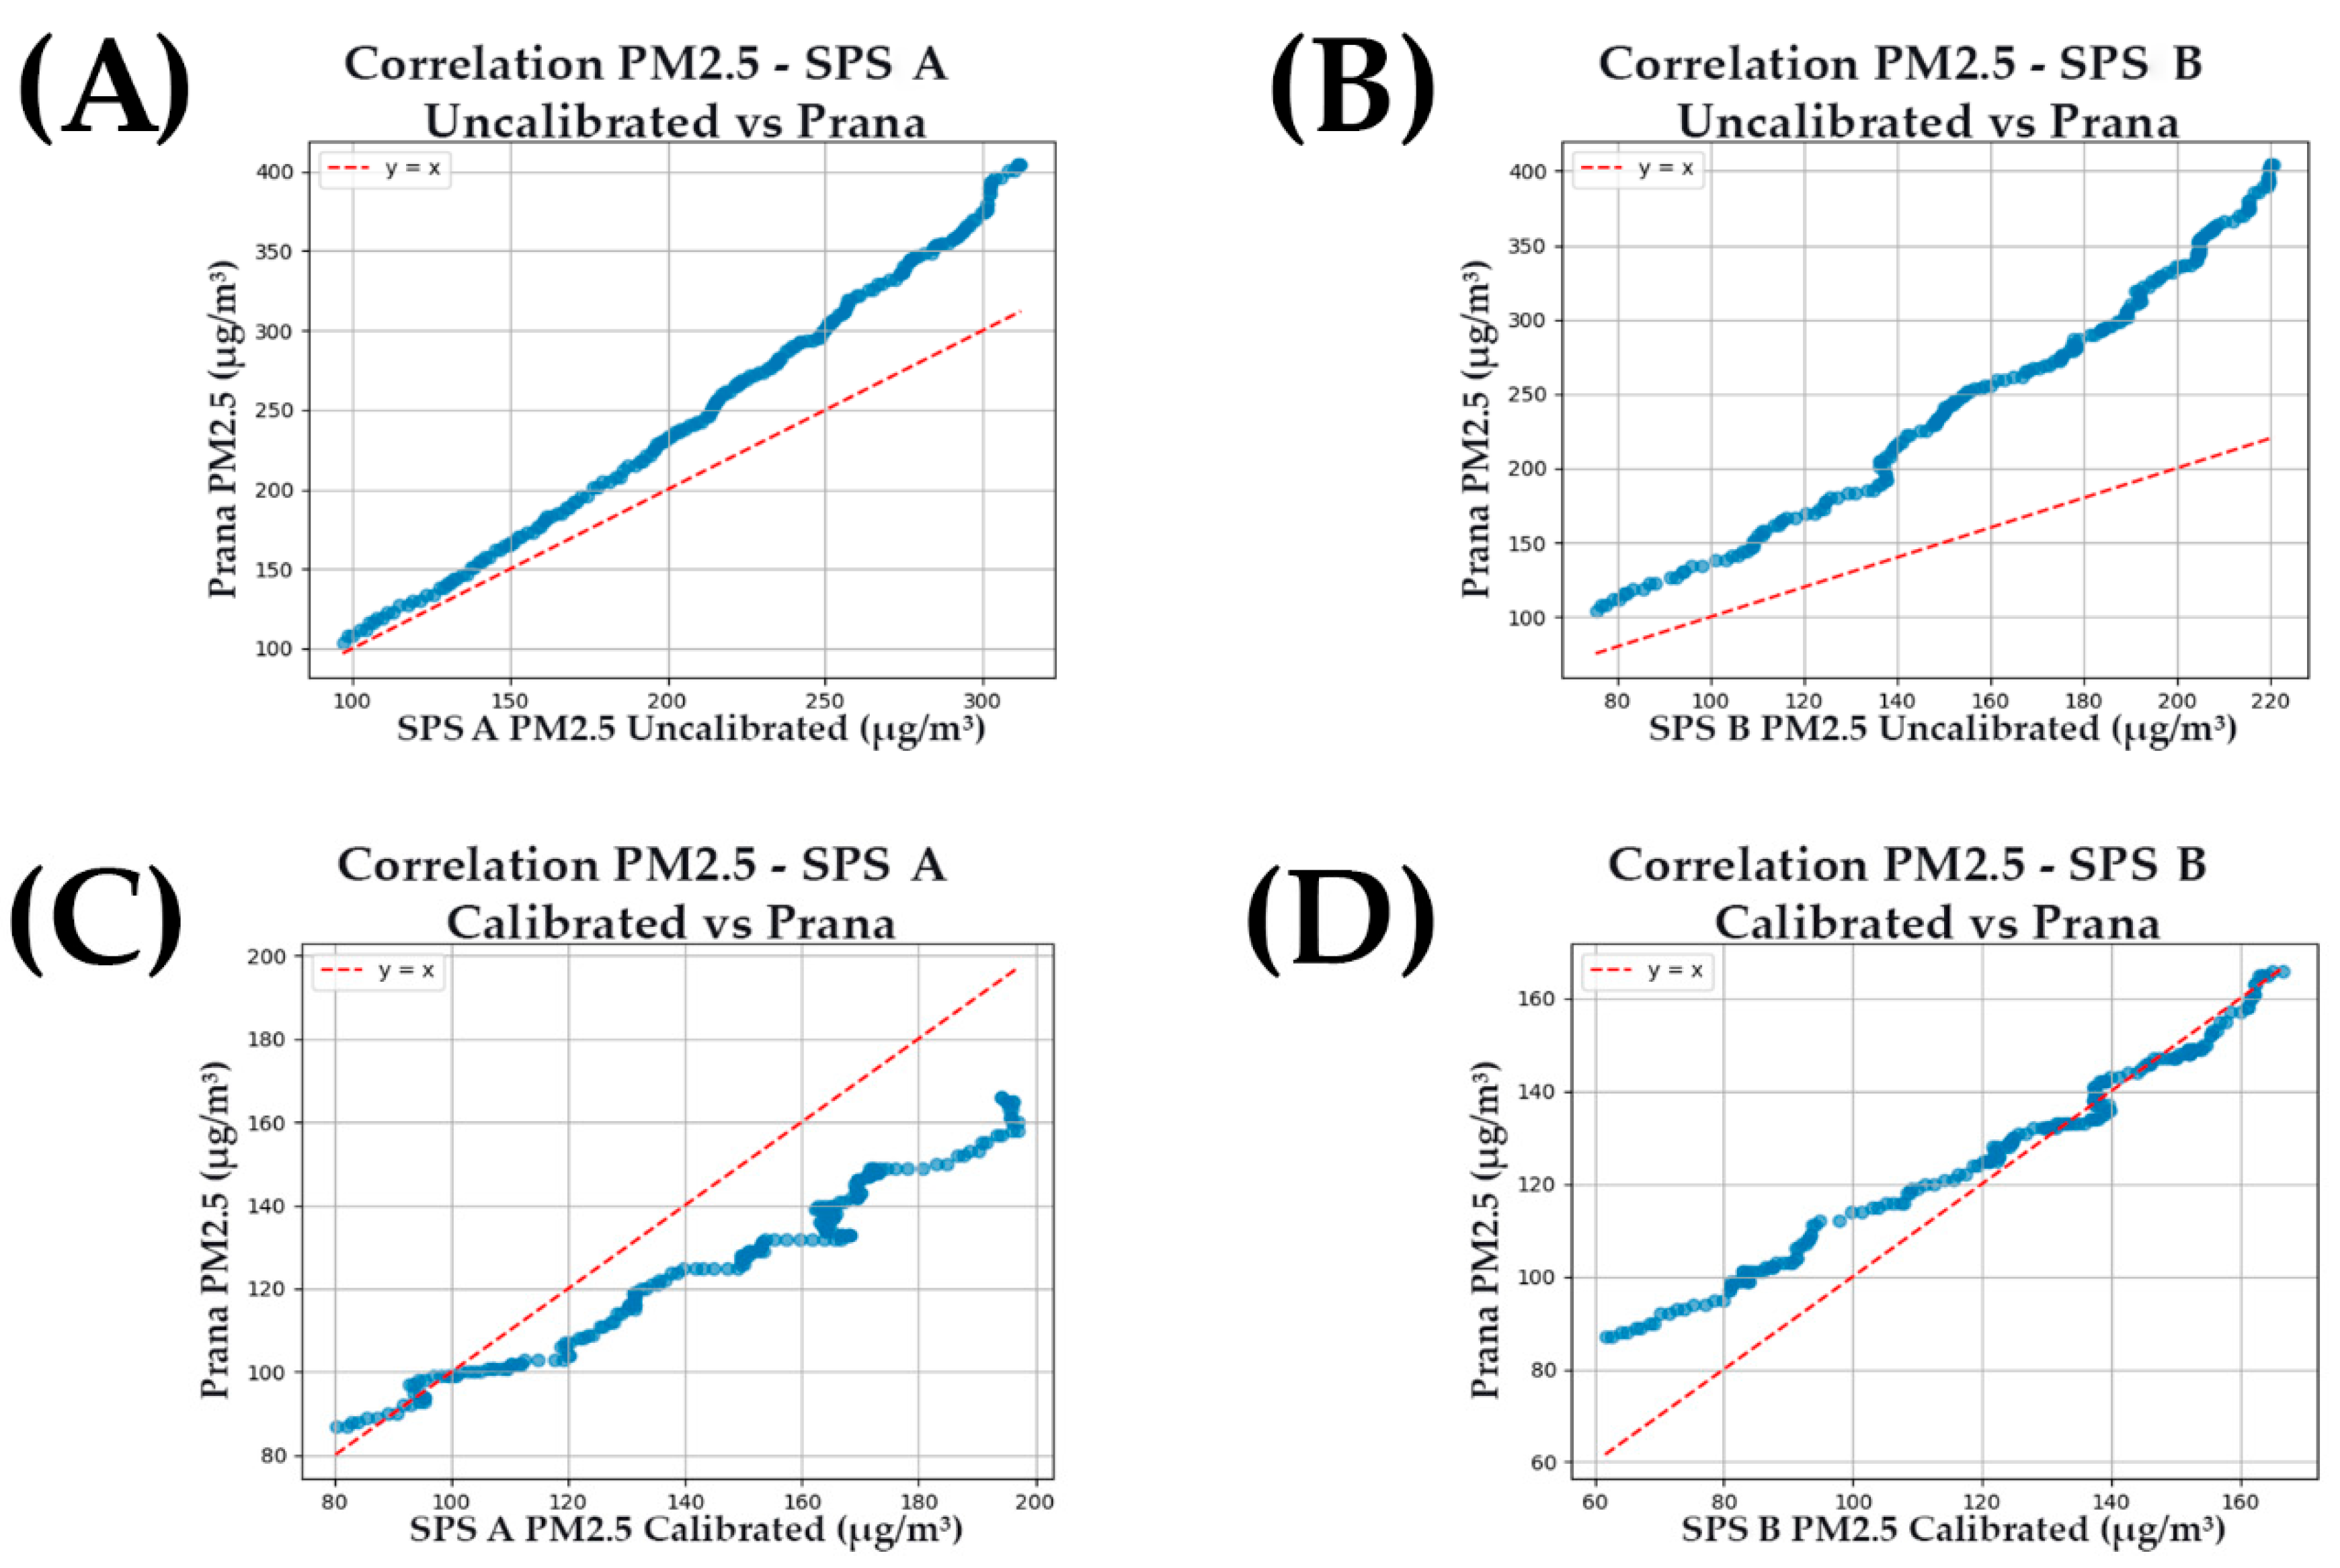
In the first calibration test, the correlation between the SPS30 A sensor and the PAS-OUT-01 reference sensor was 0.9981 (see
Figure 13A), while the correlation for the SPS30 B sensor was 0.9930 (see
Figure 13B). In the second test, both calibrated SPS30 sensors were used, and a Pearson correlation test (r) was performed in relation to the Prana Air PAS-OUT-01 sensor (see
Figure 12B). The SPS30 A sensor presented a correlation of 0.9878 (see
Figure 13C), while the SPS30 B sensor presented a correlation of 0.9942 (see
Figure 13D).
Similarly to the first and second tests, in the third test, the Prana Air PAS-OUT-01 sensor was used as a reference to validate the accuracy of the PMS5003 sensor. It is observed in
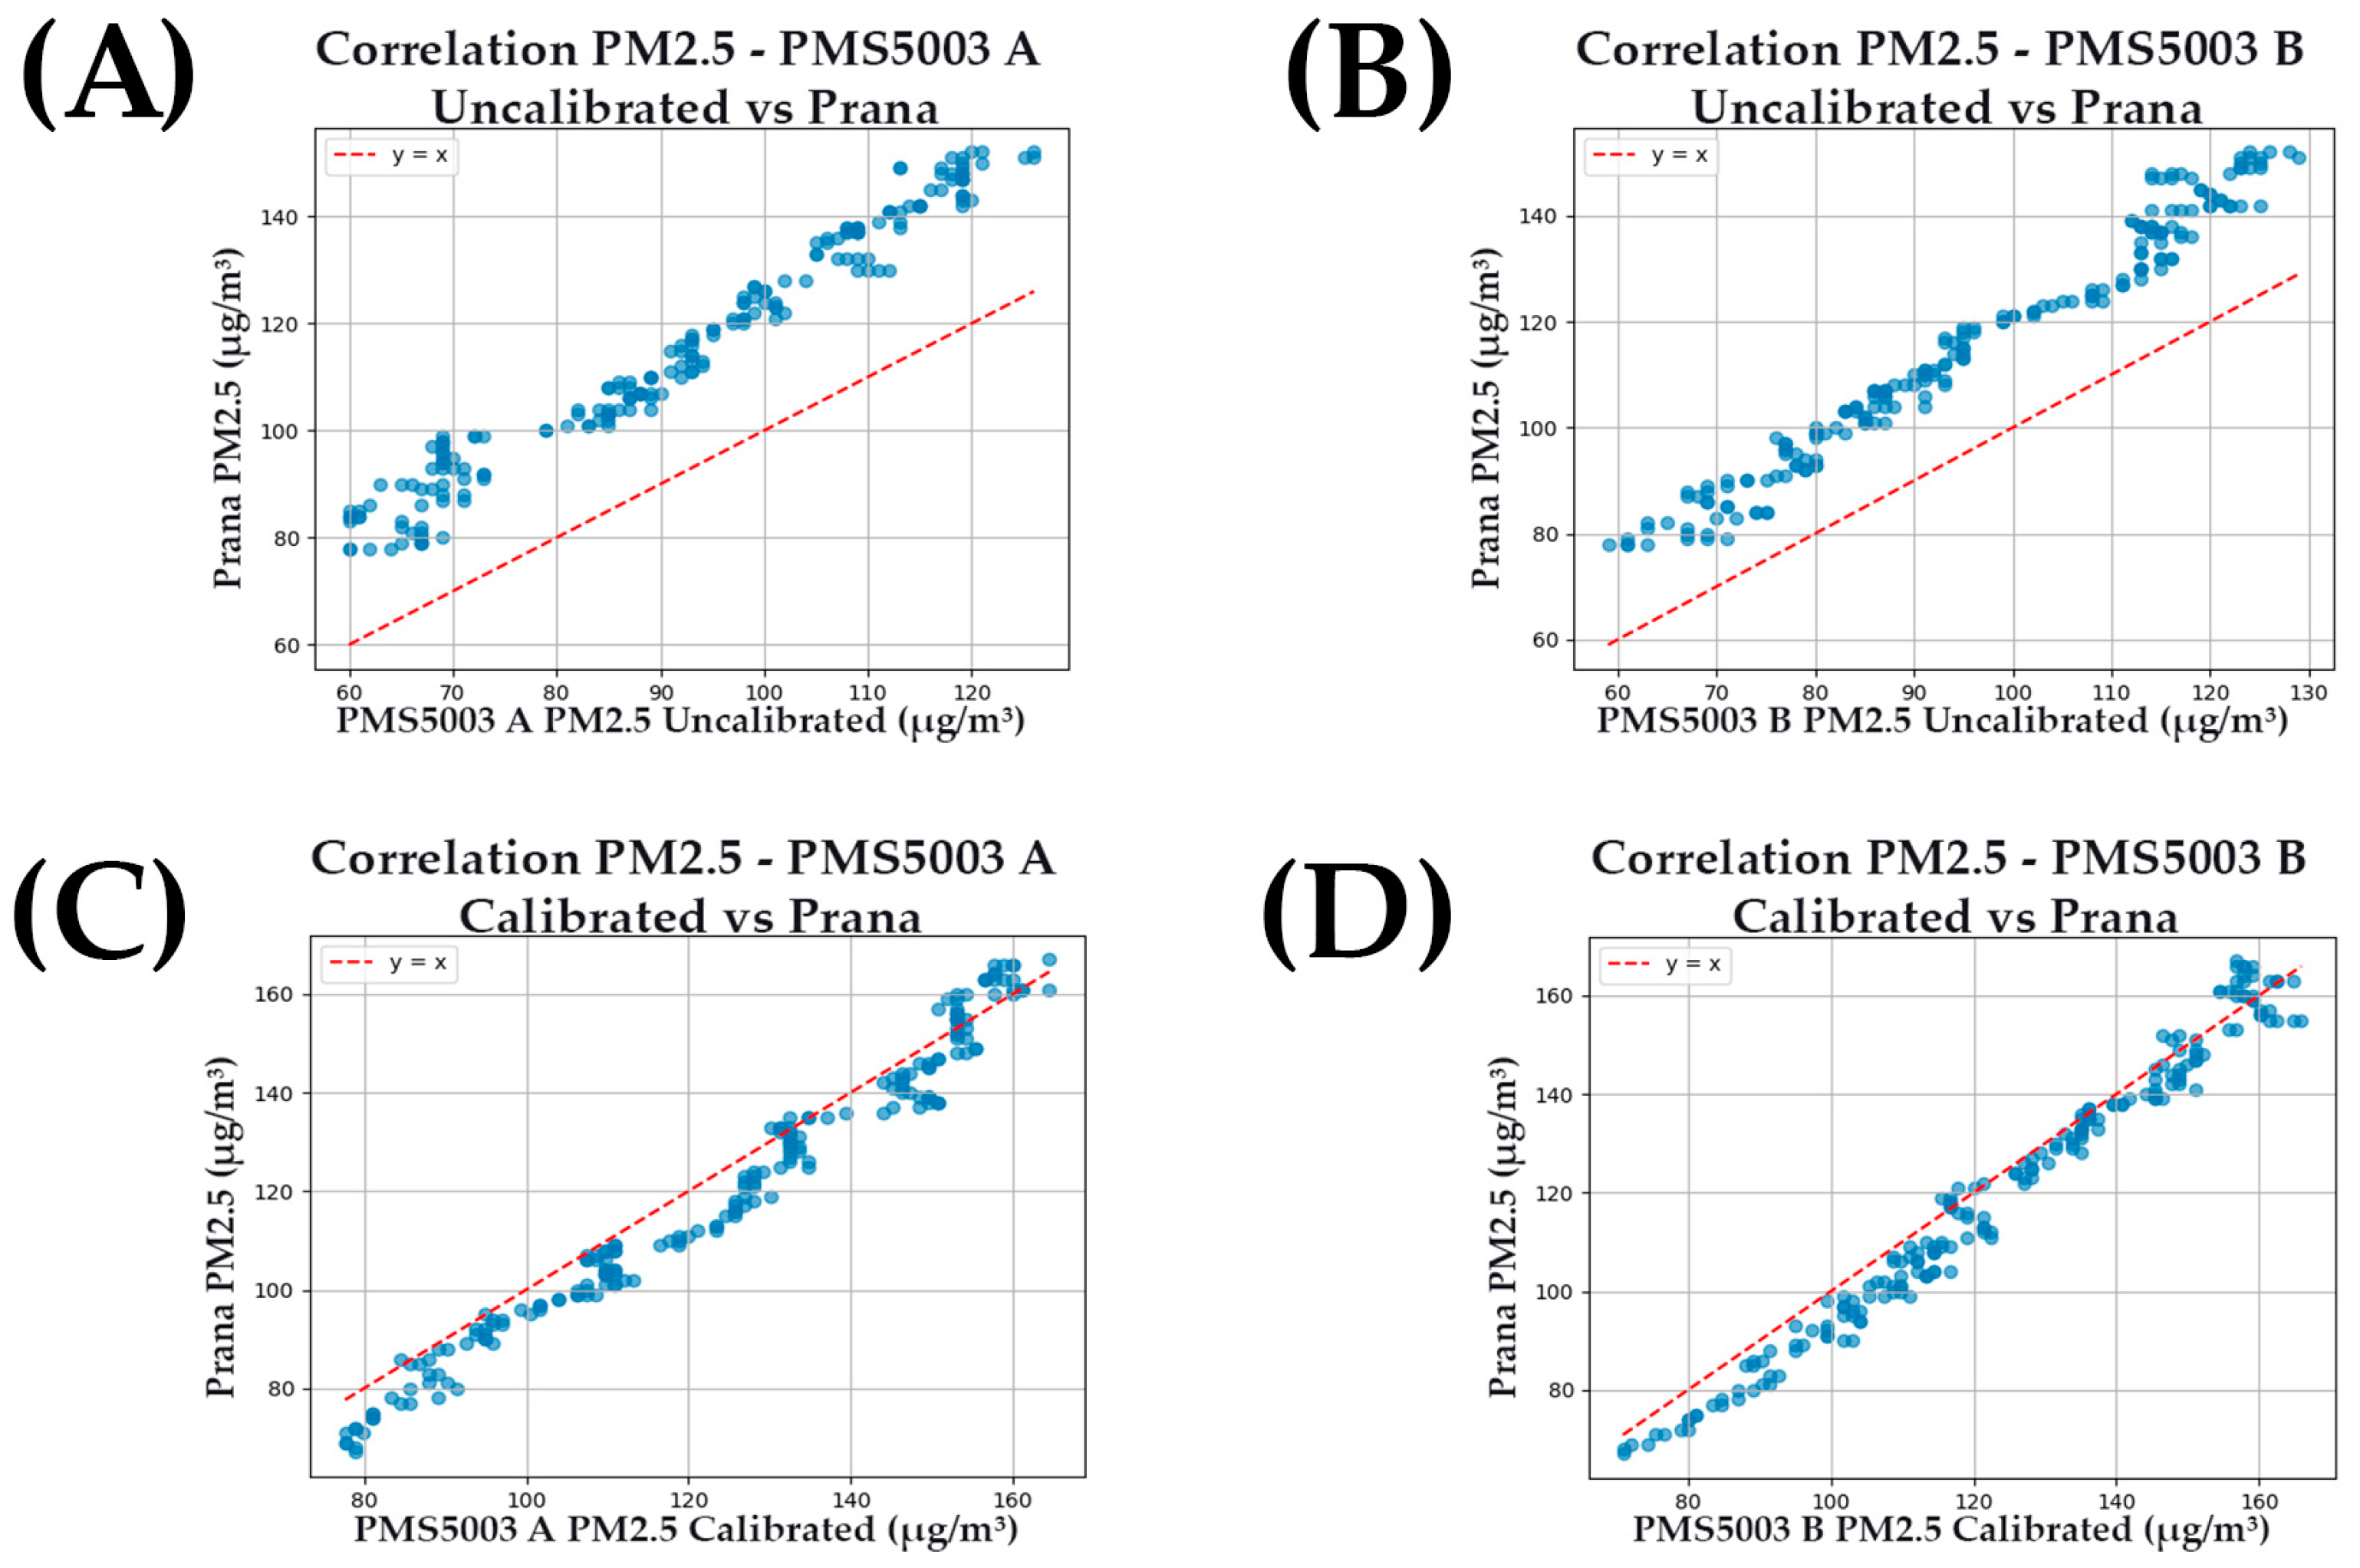
Figure 14A that the behavior of the sensors in relation to the particulate matter. Subsequently, from this test, linear regression models were determined for both PMS5003 sensors with respect to the reference PAS-OUT-01 sensor, using Python to determine the linear regression model for each PMS5003 sensor. The linear regression model for the PMS5003 A sensor was y = 1.143x + 10.216, while the linear regression model for the PMS5003 B sensor was y = 1.146x + 5.510. In addition, Pearson correlation tests (r) for each PMS5003 sensor and the Prana Air PAS-OUT-01 sensor were performed using Python. The PMS5003 A sensor presented a correlation of 0.9828 (see
Figure 15A), while the PMS5003 B sensor presented a correlation of 0.9863 (see
Figure 15B). In the fourth test, a Pearson correlation test (r) was performed between each calibrated PMS5003 sensor and the Prana Air PAS-OUT-01 sensor (see
Figure 14B). The PMS5003 A sensor presented a correlation of 0.9846 (see
Figure 15C), while the PMS5003 B sensor presented a correlation of 0.9898 (see
Figure 15D).
4. Discussion
This prototype addresses the challenges of calibration of personal PM monitors due to the complexity and expensive process. As mentioned above, the calibration of personal PM monitoring devices requires the intervention of a specialized technician, as well as calibration facilities, which are often very expensive and can take months. Therefore, the use of this prototype reduces the complexity of the calibration process and allows it to be transported to any location where it is needed to perform measurement tests or quick calibrations. The exposure of the user operating the prototype to PM is another problem that has been solved by using wireless connectivity (Bluetooth) to control the actuators inside the test chamber at a safe distance for the user.
In addition, in the 11 articles mentioned in the introduction [
11,
12,
13,
14,
15,
16,
17,
18,
19,
20,
21], only 2 use wireless connectivity [
19,
20]. Moreover, only [
19] incorporates a particle extraction system, which indicates opportunities for improvement to protect the user’s health.
As mentioned in the
Section 3, all the measurements were correctly performed without errors, indicating that Bluetooth communication is stable and the filters in our GUI prevent erroneous data, improving data acquisition.
Regarding the measurements performed by the Prana Air PAS-OUT-01 sensor and the SENSIRION SPS30 dust sensors, during the first test with the uncalibrated sensors, an interesting phenomenon was observed. For the SENSIRION SPS30 A sensor, which already had a high correlation greater than 0.99, the calibration process had a negative effect, decreasing its correlation index in tests performed before and after calibration. In the initial tests, the SPS30 A sensor (before calibration) showed a correlation of 0.9981 with respect to the Prana Air PAS-OUT-01 sensor, as observed in
Figure 12A, which shows very similar behavior from both sensors. The Y-intercept (b) of the correction equation of each SPS30 sensor presents a difference value due to the variations that the sensors present in the measurements, which is shown in
Figure 12A. After performing the calibration (see
Figure 12B), the correlation value decreased to 0.9878. However, although correlation decreased after calibration, the descriptive statistics shown in
Table 2 indicate that measurements after calibration present a lower difference compared to the reference sensor (PAS-OUT-01) measurements. Meanwhile, the SPS30 B sensor in the initial tests without calibration presented a lower Pearson correlation index, and after calibrating it, the correlation tests presented an improvement, going from a correlation of 0.9930 to 0.9942. In addition, it can be observed in
Figure 12A that the readings of the SPS30 B sensor are further away from the readings of the PAS-OUT-01 sensor compared to
Figure 12B, where the calibration process was already performed.
As shown in
Table 2, the descriptive statistics demonstrate that the use of the calibration chamber results in a clear improvement in sensor performance. For the PMS5003 sensors, the uncalibrated devices underestimate the reference sensor by approximately −20 to −23 µg/m
3, while after calibration, the difference between the mean of the sensors was reduced, showing an overestimation of only 4 µg/m
3 with a low variability of 4.5–4.8 µg/m
3; this indicates that the calibration process effectively aligned the PMS5003 sensors close to the reference values. In the case of the SPS30 sensors, the uncalibrated data showed a large difference with the reference values, particularly the SPS30 B, which presented a large negative bias (–98 µg/m
3) and high variability (SD Δ = 43.40). After calibration, both SPS30 sensors showed reduced deviations relative to the reference (−5.98 µg/m
3 for SPS30 A and 19.73 µg/m
3 for SPS30 B) and lower variability (SD Δ ≈ 8–11 µg/m
3), confirming an improvement compared to their uncalibrated performance.
In
Figure 13A,B, which correspond to the uncalibrated SPS30 sensors’ performance tests, it is observed that the graphs do not intercept the y = x line. In
Figure 13C,D, which correspond to the calibrated SPS30 sensors’ performance tests, the graphs intercept the y = x line at low concentrations in the case of the SPS30 A sensor, and at high concentrations for the SPS30 B sensor. This indicates that the SPS30 measurements are more similar to the reference sensor measurements after calibration. However, sensor SPS30 A performs better at low PM concentrations, while sensor SPS30 B performs better at high PM concentrations, showing a variation among sensors of the same model.
In the calibration tests of the PMS5003 sensors, both sensors presented positive results, considering that in the first test, where the sensors are not calibrated, the PMS5003 sensors presented correlation coefficients lower than 0.99, which are significant, but could still be improved.
Figure 14B clearly shows the result of the calibration of the sensors when compared with
Figure 14A of the uncalibrated sensors.
Finally, the size of the calibration chamber presents a limitation, as some robust PM monitor devices require a simulation of an environment that requires a higher particle flow without saturating the PM chamber. This limitation complicates performing tests with lower concentrations to which the population is normally exposed, such as in urban areas or those found in road traffic. Another limitation is the manual filling of the PM solution into the nebulizer, which could be avoided by incorporating a system that is responsible for refilling the nebulizer with a reserve of PM solution, preventing the user from having to constantly refill the solution. The lack of temperature control could present a limitation as well; however, controlling humidity inside the chamber using silica gel, in addition to filtering the air from the compressor, as well as removing possible particles and humidity from the air that is introduced into the calibration chamber, calibrations can be performed.
5. Conclusions
This work contributes to solving issues associated with personal and portable PM monitors by addressing the costly and time-consuming calibration process of commercial monitors. Furthermore, with the increasing demand for the development of new portable or low-cost PM sensors, it also contributes to the validation and evaluation of these new devices.
The calibration chamber is designed to eliminate the risk of user exposure to PM during testing due to its Bluetooth wireless connectivity. This design is important to reduce potential user exposure to PM while operating the prototype (e.g., leaks inside the chamber contaminating the area where the prototype is located).
Another feature of this prototype is its portability, which allows it to be transported to locations where calibration and measurement testing are particularly challenging.
Furthermore, although temperature was not controlled, humidity was regulated with silica gel filters inside the chamber as well as submicronic compressed air filters in the monodisperse system, allowing the sensors to be successfully calibrated.
In future work, we will consider incorporating a larger calibration chamber capable of maintaining constant PM flows for the calibration of more robust PM monitors. In addition, we will consider incorporating an automatic filling system for the nebulizer. Additionally, a parameter will be determined to indicate to the user whether the sensor needs calibration or not. It is recommended that calibration be performed at least every 12 months or when the sensor is moved to a different location [
37]. In addition, testing with PM of different particle sizes should be considered in order to calibrate the PM sensors. Finally, another proposal for future work is to extend the capacity of the prototype to calibrate devices that monitor other gases, such as greenhouse gases like carbon dioxide (CO
2), methane (CH
4), nitrous oxide (N
2O), among other pollutants.
