Article

Multivariate and Machine Learning-Based Assessment of Soil Elemental Composition and Pollution Analysis

by
Wael M. Badawy
1,2,*,
Fouad I. El-Agawany
3,
Maksim G. Blokhin
4,
Elsayed S. Mohamed
5,
Alexander Uzhinskiy
6 and
Tarek M. Morsi
1
1
Radiation Protection and Civil Defense Department, Nuclear Research Center, Egyptian Atomic Energy Authority, Cairo 13759, Egypt
2
Frank Laboratory of Neutron Physics, Joint Institute for Nuclear Research, 141980 Dubna, Russia
3
Department of Physics, Faculty of Science, Menoufia University, Shebin El-Koom 32511, Egypt
4
Far East Geological Institute of the Far Eastern Branch of the Russian Academy of Sciences, 690022 Vladivostok, Russia
5
National Authority for Remote Sensing and Space Sciences (NARSS), Cairo 1564, Egypt
6
Laboratory of Information Technology, Joint Institute for Nuclear Research, 141980 Dubna, Russia
*
Author to whom correspondence should be addressed.
Environments 2025, 12(8), 289; https://doi.org/10.3390/environments12080289
Submission received: 17 July 2025 / Revised: 9 August 2025 / Accepted: 18 August 2025 / Published: 21 August 2025

Abstract

The present study provides a comprehensive characterization of soil elemental composition in the Nile Delta, Egypt. The soil samples were analyzed using Inductively Coupled Plasma Atomic Emission Spectrometry (ICP-AES), highly appropriative for the major element determination and Inductively Coupled Plasma Mass Spectrometry (ICP–MS), outstanding for the trace element analysis. A total of 55 elements were measured across 53 soil samples. A variety of statistical and analytical techniques, including both descriptive and inferential methods, were employed to assess the elemental composition of the soil. Bivariate and multivariate statistical analyses, discriminative ternary diagrams, ratio biplots, and unsupervised machine learning algorithms—such as Principal Component Analysis (PCA), t-Distributed Stochastic Neighbour Embedding (t-SNE), and Hierarchical Agglomerative Clustering (HAC)—were utilized to explore the geochemical similarities between elements in the soil. The application of t-SNE for soil geochemistry is still emerging and is characterized by the fact that it preserves the local distribution of elements and reveals non-linear relationships in geochemical research compared to PCA. Geochemical background levels were estimated using Bayesian inference, and the impact of outliers was analyzed. Pollution indices were subsequently calculated to assess potential contamination. The findings suggest that the studied areas do not exhibit significant pollution. Variations in background levels were primarily attributed to the presence of outliers. The clustering results from PCA and t-SNE were consistent in terms of accuracy and the number of identified groups. Four distinct groups were identified, with soil samples in each group sharing similar geochemical properties. While PCA is effective for linear data, t-SNE proved more suitable for nonlinear dimensionality reduction. These results provide valuable baseline data for future research on the studied areas and for evaluating their environmental situation.

1. Introduction

The Nile Delta, covering approximately 22,000 km2, contributes two-thirds of Egypt’s agricultural output and is the country’s main hub for gas and oil production. Its formation began in the late Pliocene, with major development during the Pleistocene due to fluctuating sea levels during ice ages. The chemical industry is the largest source of hazardous waste in the region, while water pollution primarily arises from raw sewage, industrial runoff, and agricultural pesticides [1]. The Delta also faces serious challenges, including land reclamation, coastal erosion, soil salinization, pollution, and the impacts of climate change, such as rising sea levels [1,2].
The Nile Delta, home to over half of Egypt’s 80 million people, supports 63% of the country’s agricultural land. Its coastline features the Rosetta and Damietta headlands, coastal flats, dunes, and four brackish lakes: Mariut, Edku, Borullus, and Manzalah [2,3]. As the global population increases and per capita resource consumption continues to increase, the demand for food, resources, and arable land has increased [4,5]. Consequently, this demand is driven by the rapid expansion of agricultural areas worldwide. Furthermore, great efforts are being made to transform the desert into agricultural areas [4].
The expansion of agricultural land, coupled with a growing population and rapid urbanization, has placed significant pressure on soil quality in the Nile Delta. The intensive use of fertilizers further exacerbates the problem, degrading soil health and increasing the accumulation of waste. This excessive agricultural activity and urban sprawl not only strain natural resources but also contribute to higher levels of pollution, including runoff of chemicals and improper waste disposal, ultimately threatening the long-term sustainability of the region’s ecosystem [6,7].
Currently, the monitoring of the environmental situation in the Nile Delta, particularly concerning the elemental composition of agricultural soil, remains limited and outdated. Most existing studies focus on specific, localized areas, with little comprehensive or recent data available. While there is considerable interest among researchers in examining the elemental content of the Delta’s soils, these efforts have largely been fragmented, lacking widespread coverage or a coordinated approach. As a result, there is a need for more systematic, up-to-date, and region-wide studies to better understand the evolving environmental challenges and soil health in this critical region. This study aims to provide a comprehensive overview of the environmental situation in the Nile Delta, especially along the two branches of the Nile, by employing integrated analytical methods. This study fills a critical gap by utilizing advanced analytical techniques (ICP-MS and ICP-AES) and sophisticated statistical and machine learning approaches to provide an integrated, region-wide assessment of soil elemental composition. The establishment of baseline data and identification of pollution sources will directly support environmental management strategies, inform policy decisions, and promote sustainable development and public health protection efforts in Egypt.
The elemental composition of various components within ecosystems is investigated through a range of advanced analytical techniques. Common methods include neutron activation analysis (NAA), which detects and quantifies elements by measuring gamma rays emitted after neutron capture; X-ray fluorescence (XRF), which utilizes X-rays to excite atoms and measure their characteristic fluorescent emissions; inductively coupled plasma mass spectrometry (ICP-MS), a highly sensitive method that ionizes samples and detects trace and ultra-trace elements with precision; inductively coupled plasma atomic-emission spectrometry (ICP-AES); and atomic absorption spectroscopy (AAS). These techniques, alongside others, allow for comprehensive multi-elemental analysis, providing critical insights into the distribution and behavior of elements in environmental studies [3,8,9,10]. In this study, inductively coupled plasma mass spectrometry (ICP-MS) and inductively coupled plasma atomic-emission spectrometry (ICP-AES) were employed to quantify the elemental mass fractions in soil samples.
Throughout this research, the following objectives have been pursued: (i) characterize the soil samples in terms of their elemental composition; (ii) conduct bivariate and multivariate statistical analyses, discriminative ternary diagrams and ratio biplots, and unsupervised machine learning algorithms (principal component analysis PCA, t-distributed Stochastic Neighbour Embedding t-SNE, and Hierarchical Agglomerative Clustering HAC) to clarify the geochemical similarity of soil; (iii) analysis of the geochemical background of the determined elements using Bayesian inference methods; (iv) assess the degree of pollution and the contamination extent using various indices and elucidate the common pollution sources; and (vi) establish baseline data on geochemical elements that can provide a reference point for monitoring potential future changes.

2. Materials and Methods

2.1. Sampling Strategy

A total of 53 agricultural soil samples were collected from the Nile Delta region of Egypt, primarily from areas under cultivation. The specific sampling locations, along with the number of samples collected, are illustrated on the map in Figure 1. Geographically, the sampling area is bordered by the Mediterranean Sea to the north, with the southern boundary marking the edge of the cultivated land in the Delta. The soil texture across the region ranges from clayey to loamy. Samples were spaced at intervals of approximately 15 to 20 km between consecutive locations. All the samples were gathered following IAEA TECDOC-1415 [11] and recommendations of the Egyptian Geological Survey and Mining Authority [12]. The samples were collected at a depth of 10–15 cm, using Polyvinyl Chloride (PVC, Misr El-Hegaz Group, Cairo, Egypt) pipes to minimize the risk of contamination. Prior to sampling, surface grass and vegetation were cleared. The soil samples were then air-dried and gently mixed to ensure homogeneity. Later, the samples were transported to the laboratory for analysis using inductively coupled plasma mass spectrometry (ICP-MS, Agilent Technologies Inc., Tokyo, Japan) and inductively coupled plasma atomic emission spectrometry (ICP-AES, Thermo Scientific Inc., Waltham, MA, USA).

2.2. Sample Preparation for Analysis Using ICP-MS and ICP-AES

Elemental composition analysis of the soil samples was conducted in the Analytical Chemistry Laboratory at the Centre for Collective Use, “Primorsky Centre for Local Elemental and Isotopic Analysis”, part of the Far East Geological Institute in Vladivostok, Russia. To remove plant debris and rock particles, air-dried soil samples were pre-sifted through a sieve with a pore diameter of 2 mm and then ground to a powder in an agate mortar.
An open acid digestion method, as described by NSAM [13], with minor laboratory modification, was employed for the calcined to constant weight at 105 °C, 0.05 g samples step by step digestion process using a mixture of HNO3, HF, and HClO4 (“suprapur”, Merck).
To prevent possible hydrolysis and polymerization of highly charged ions (such as Zr, Nb, Hf, Ta, Mo, and W), traces of HF were added. The final dilution factor was 1:1000. Before ICP-MS analysis, the solutions were further diluted with 2% HNO3 to achieve a final dilution factor of 1:5000.
High-purity nitric acid was distilled using a Milestone dry distillation unit (Millipore, Burlington, MA, USA). Major elemental composition was analyzed with an iCAP 7600 Duo ICP-AES (Thermo Scientific Inc, Waltham, MA, USA), operating in radial plasma observation mode. Trace element concentrations were determined using an Agilent 8800 quadrupole ICP-MS (Agilent Technologies Inc, Tokyo, Japan), enabling the detection of a broad spectrum of trace elements. Further details on the ICP analytical methodology can be found in NSAM [13], Badawy, et al. [14]. The content of Si was found by the gravimetric method after decomposition of samples (0.2 g) by the fusion technique with anhydrous sodium carbonate (Na2CO3) and subsequent treatment with hydrofluoric acid and distillation of volatile silicon compounds.

2.3. Quality Control of (ICP-MS and ICP-AES)

Certified reference materials (CRMs) SCHT-3 (GSO 2509-83, typical black soil, Russian CRM) and JA-3 (andesite powder, Geological Survey of Japan) were used to assess the repeatability and accuracy of the obtained results [15]. The measurement on the CRMs demonstrated accurate data on average (10–15%, 2σ) for trace elements, as well as reproducibility with 2σ < 5% for major ones. The amount of material analyzed for both studied soil specimens and CRMs was sufficient to prepare representative samples of homogeneous composition.

3. Statistical Data Analysis

The statistical analysis of the data obtained was performed with R: A Statistical Computing Language and Environment (version 4.3.1) [16], Python Language Reference, Version 3.12 [17], and the data were structured in MS Excel. The data obtained for the soil samples was examined for normality with 95% probability (p ≤ 0.05) using the Shapiro–Wilk test [18]. The normality test is beneficial if the results obtained must be statistically evaluated prior to further analysis. The p-values for all the elements were calculated and the normal distribution of the obtained data was specified. The outliers were identified and sorted aside based on the Mahalanobis distance probability [19,20]. The correlation matrix using the Pearson method was designed to explore more information on the relationship between variables.
Despite the removal of outliers, the data distribution remained non-normal. Therefore, before performing multivariate statistical analysis, all variables in the dataset were scaled using the min–max method to mitigate large discrepancies in mass fractions, particularly for major, trace, and rare earth elements (REE).
Principal Component Analysis (PCA) and t-distributed Stochastic Neighbour Embedding (t-SNE), both widely recognized and effective dimensionality reduction techniques, were applied to the data to assess sample similarities and identify potential common geochemical characteristics [21,22,23]. Both approaches are used mainly for reducing dimensionality. For example, PCA provides a linear dimensionality reduction, but t-SNE performs a non-linear dimensionality reduction. PCA is explained in detail in our previous work [14,24]. In this research, however, t-SNE was used because it minimizes the divergence between distributions and fits complex and non-linear data better [25].
After the dimensionality reduction was performed using PCA and t–SNE, the unsupervised learning machine (ML) methods are employed to acquire more insights about the similarities of the samples examined and the best presentation will be used for further clustering. In the present work, Hierarchical Cluster Analysis (HCA), specifically using the agglomerative method, was performed to check the similarities between observations. This approach, also known as Hierarchical Agglomerative Clustering (HAC), begins with each sample in its own cluster. As the algorithm progresses, pairs of clusters are merged step by step, moving upward in the hierarchy, which is why it is often referred to as “bottom-up” clustering [26,27,28]. HCA was performed using the Euclidean method as a metric and ward as a grouping method; a more detailed description of HCA can be found in Müllner [29], Bar-Joseph, et al. [30]. The results of the model were examined using Silhouette and Davies–Bouldin scores.

4. Background and Pollution Analysis

To assess metal pollution and distinguish between anthropogenic and geogenic influences, geochemical background levels must be considered [31,32]. The background refers to the natural mass fractions of metals in sediments unaffected by human activities, while “enrichment” measures how much metal concentrations exceed natural levels. The geochemical background can be determined either by directly using regional or global reference values for the elemental mass fractions or by employing statistical methods to estimate it indirectly. For instance, the background can be calculated using various statistical analyses. In the current work, another approach is using the Just Another Gibbs Sampler (JAGS) in combination with the Markov Chain Monte Carlo (MCMC) method to apply Bayesian inference (BIM) will be applied [33]. In this approach, a Bayesian inference using Gibbs sampling was implemented. Bayesian inference is the process of fitting a probability model to a set of data and summarizing the result by a probability distribution on the parameters of the model and on unobserved quantities such as predictions for new observations. In Bayesian statistics, the aim is to estimate the posterior distribution of parameters based on observed data and a specified model. This involves updating prior beliefs about the parameters with observed data to derive the posterior distribution. However, deriving the exact posterior distribution is often computationally infeasible for complex models, which is why MCMC is used [33,34,35]. More in-depth information on Bayesian inference can be found in Kruschke [36], Park, et al. [37], Plummer, et al. [38].
In this study, background values from the computed data using the BIM method will be deployed. To avoid overestimating or underestimating pollution indices, individual indices (SPI) below one were excluded from the calculations [14,39].

4.1. Single Pollution Index (SPI)

The single pollution index is used to estimate the ratio of pollution by dividing the mass fractions obtained for each element by the corresponding background value. It can be expressed as follows:
S P I = C s a m p l e C b a c k g r o u n d
where Csample is the mass fraction of the element in the sample. Whereas Cbackground is the mass fraction of the corresponding element in the background.

4.2. Enrichment Factor (EF)

The enrichment factor (EF), which describes the characteristics of the elements in terms of enrichment or depletion in the samples studied, can be used to distinguish between the extent of anthropogenic and natural metal contamination [31,32,39,40,41,42,43,44]. EF is calculated using Equation (1):
E F = C x / C F e s o i l / C x / C F e b a c k g r o u n d  
where (Cx/CFe)soil is the ratio between the mass fractions of the element in the sample and the mass fractions of Fe in the sample, while (Cx/CFe)background is the ratio of the corresponding element in the computed background values.

4.3. Pollution Load Index (PLI)

The Pollution Load Index (PLI) serves as a reliable indicator of soil degradation caused by the accumulation of heavy metals. This index provides a simple yet informative method for evaluating the pollution load from accumulated metals, offering a comprehensive assessment of contamination levels across the studied sites. The PLI (Pollution Load Index) is calculated by taking the nth root of the product of n individual pollution indices (SPI), providing an assessment of soil quality [45].
P L I = i = 1 n S P I i n
In this context, the value n refers to the total number of metals being assessed. When (PLI) > 1, it means that pollution exists. Otherwise, if (PLI) < 1, there is no metal pollution.

4.4. Total Pollution Index TPI (Zc)

The evaluation of chemical pollution levels in soil serves as an indicator of potential adverse effects on public health. This assessment is conducted using indicators developed through integrated geochemical and geohygienic studies in urban areas with active pollution sources. The Total Pollution Index (TPI) approach closely resembles the Pollution Load Index (PLI) and can be calculated by comparing the chemical mass fractions of an element in soil, denoted as Ci (mg/kg), to the regional background concentration. The coefficient of the chemical mass fractions of the determining elements is Kc and given as:
K c = C i / C b i
The sum of the coefficients of (pollutants) is the TPI and it is given as:
T P I = i = 1 n K c i ( n 1 )
where n is the number of the determined elements and Kci is the concentration coefficient, which is higher than 1 for the i element [46,47,48].

5. Results and Discussion

5.1. Elemental Abundances

A total of 53 agricultural soil samples were collected from the Nile Delta, Egypt and analyzed using ICP-MS (Inductively Coupled Plasma-Mass Spectrometry) and ICP-AES (Inductively Coupled Plasma-Atomic Emission Spectroscopy) to determine elemental content in mg/kg. The analysis revealed the presence of 55 different elements.
After applying the Mahalanobis distance to remove outliers and reduce the noise in the dataset, four elements were identified as outliers and discussed separately. Descriptive statistical analysis (mean, median, minimum, maximum, coefficient of variation, skewness, kurtosis) was performed and is presented in Table 1.
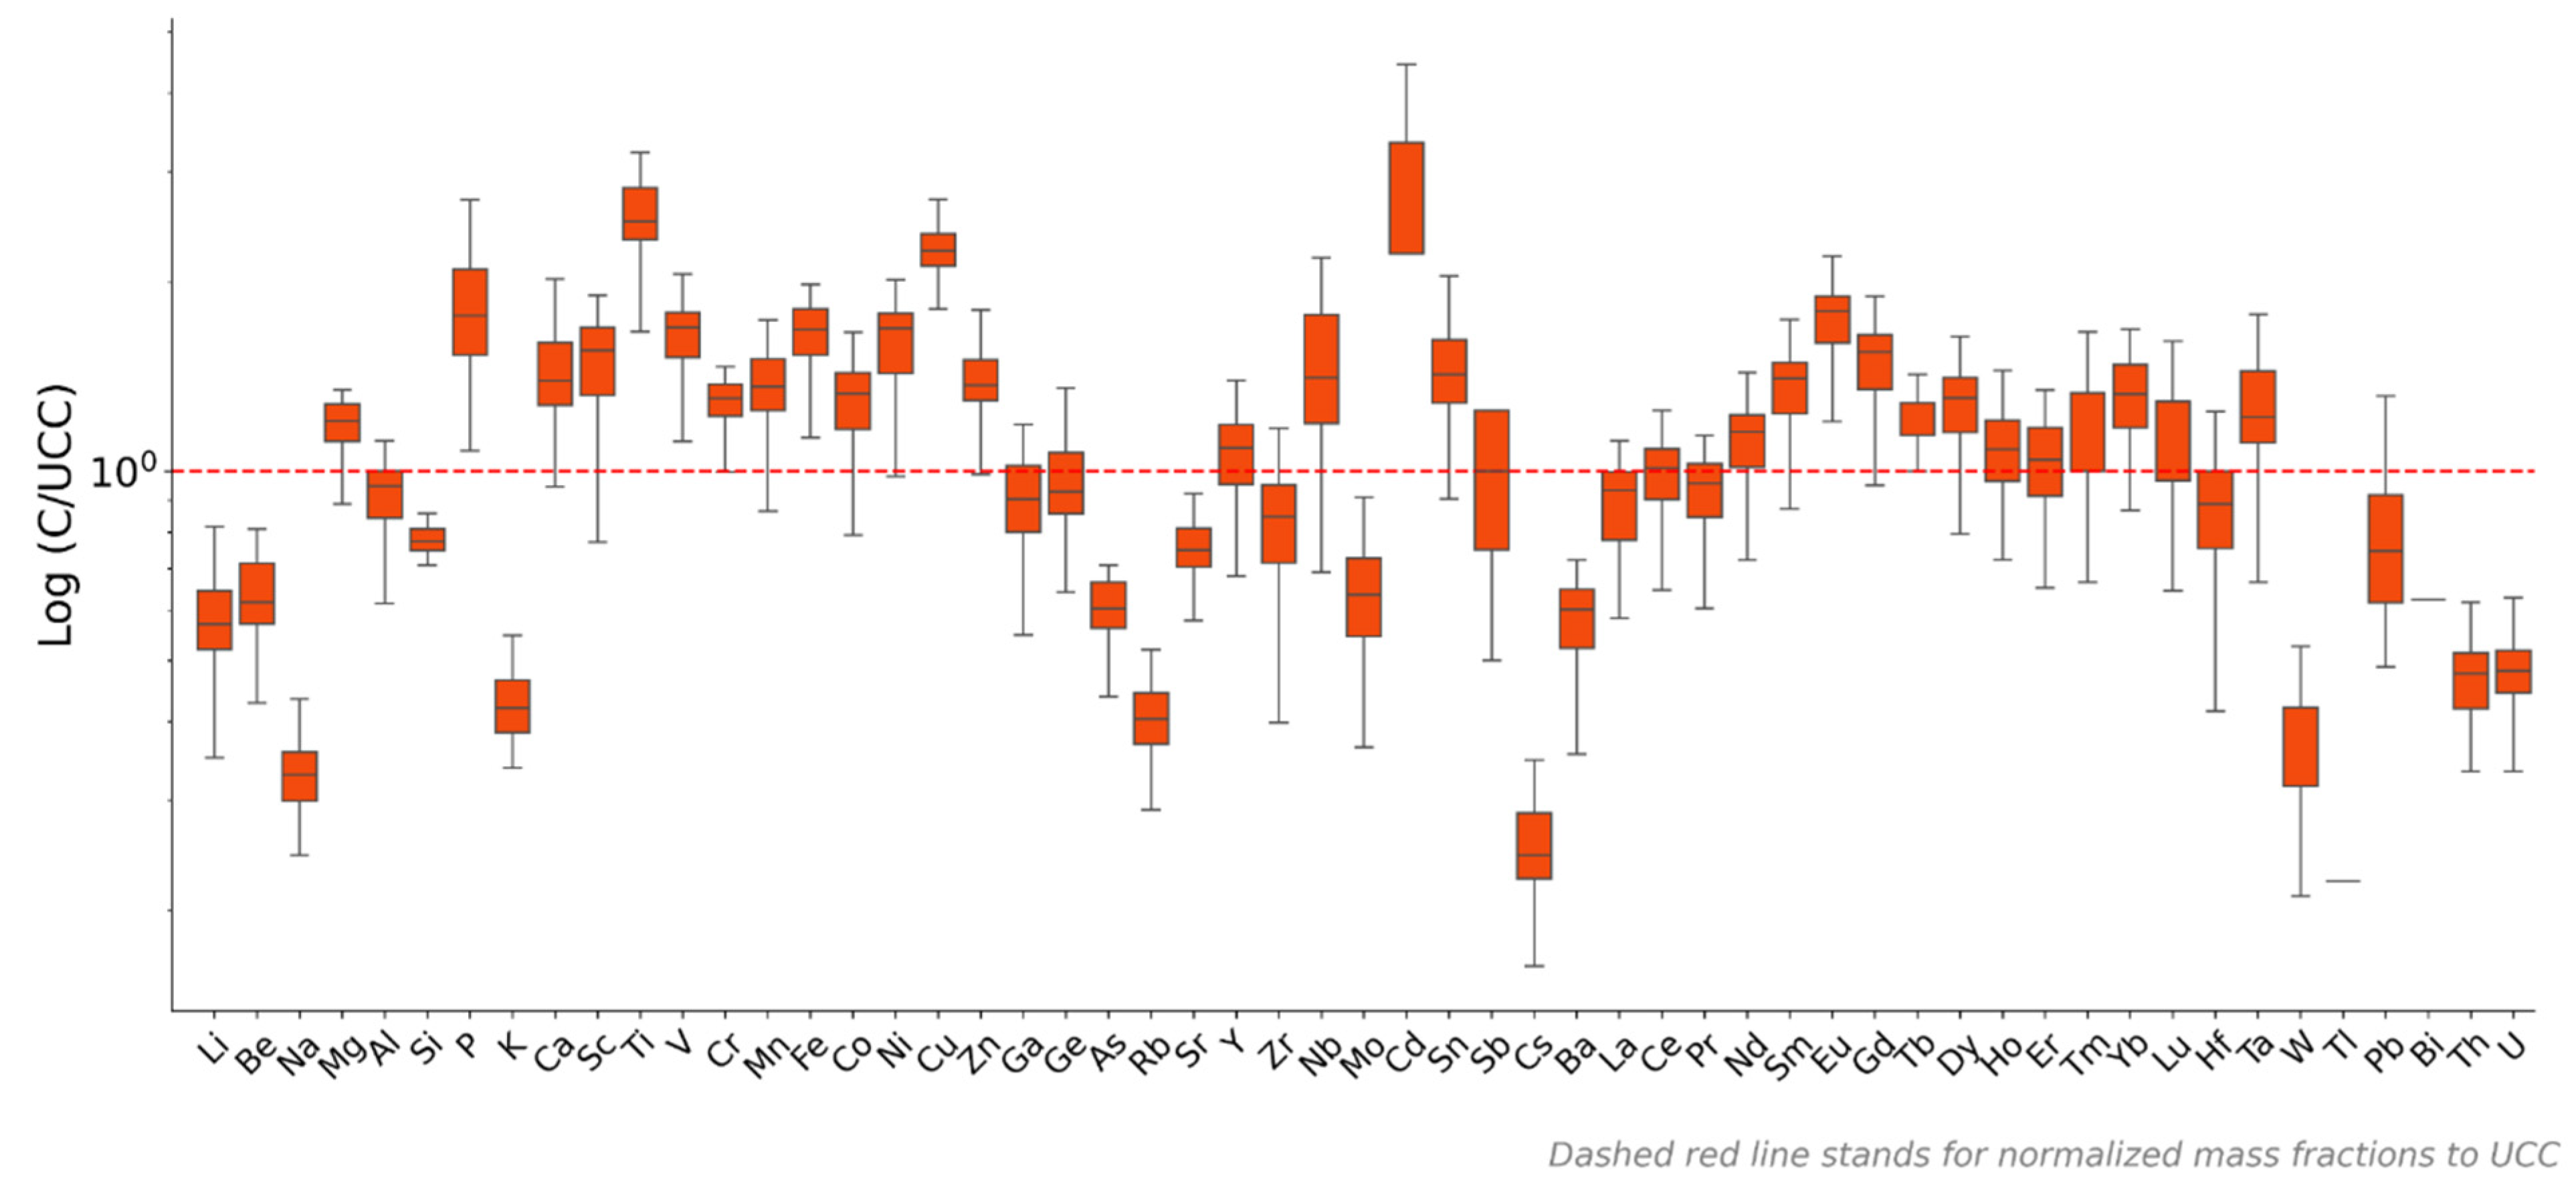
The results obtained show that Si has the maximum value with an average value of 245,000 ± 2640 mg/kg and ranges from a minimum of 221,000 to 309,000 mg/kg for locations #51 and 41, respectively. On the other hand, the minimum values were measured for Bi with an average value of 0.112 ± 0.006 mg/kg and the mass fractions ranged from 0.1 to 0.3 mg/kg for locations #51 and 19, respectively. The obtained results were compared with the corresponding values for the upper continental crust UCC by [49]. The logarithmic normalized results to UCC were calculated and are illustrated in Figure 2. From the figure, it is obvious that there are some elements that are slightly higher than those reported for UCC by Rudnick and Gao [49]. The elements whose mass fractions are slightly above the UCC can be presented in descending order as follows: Cd (4.4%) > Ti (4.1%) > Cu (3.7%) > P (3.2%) > Eu (2.8%) > V (2.7%) > Fe (2.7) > Ni (2.7%) > Ca (2.6%). The comparison of the mass fractions with the equivalent value from the UCC shows that there is an anthropogenic influence on soil, which is understandable as these are agricultural and densely populated regions. These peculiarities can be attributed to the excess use of fertilizers, domestic waste disposal, and the exponential increment of roads and urbanization, as this is a highly populated region [31]. The results obtained in this study are compared with those reported by Arafa, Badawy, Fahmi, Ali, Gad, Duliu, Frontasyeva and Steinnes [3]. Although different analytical techniques were used, the findings are consistent and demonstrate strong alignment between the two datasets.
The coefficient of variation (CV%) reflects the variability of the data, which falls within the range of 7% to 38%, well below the threshold of 75%. Since CV% is determined by both the standard deviation and the mean, a higher CV% indicates a significant level of dispersion in the data, suggesting that a statistical approach is essential for analysis. In contrast, a lower CV% signifies minimal variability. Additionally, we assessed the distribution patterns of the results for each element, revealing that in most instances, the distributions are negatively skewed. This indicates that the mean is situated below the median, with extreme values occurring more frequently on the lower end than on the upper end of the distribution. A distribution is considered nearly symmetrical when the skewness falls between −0.5 and 0.5; however, in the present study, skewness ranges from −2.0 to 3.7. As a result, the mean value may not provide meaningful insights, and it is suggested to perform statistical analyses prior to engaging in inferential statistics. Similarly, the kurtosis values higher than 3 indicate significant variability of the results obtained [14,50,51].
In the same way, the wt% of the oxides were normalized to the corresponding values of UCC and the results showed that TiO2 has the highest mean value of 2.47 wt% and the lowest value was calculated for Na2O with an average value of 0.32 wt%. The results of the normalized values for soil oxides are presented and shown in Figure S1.
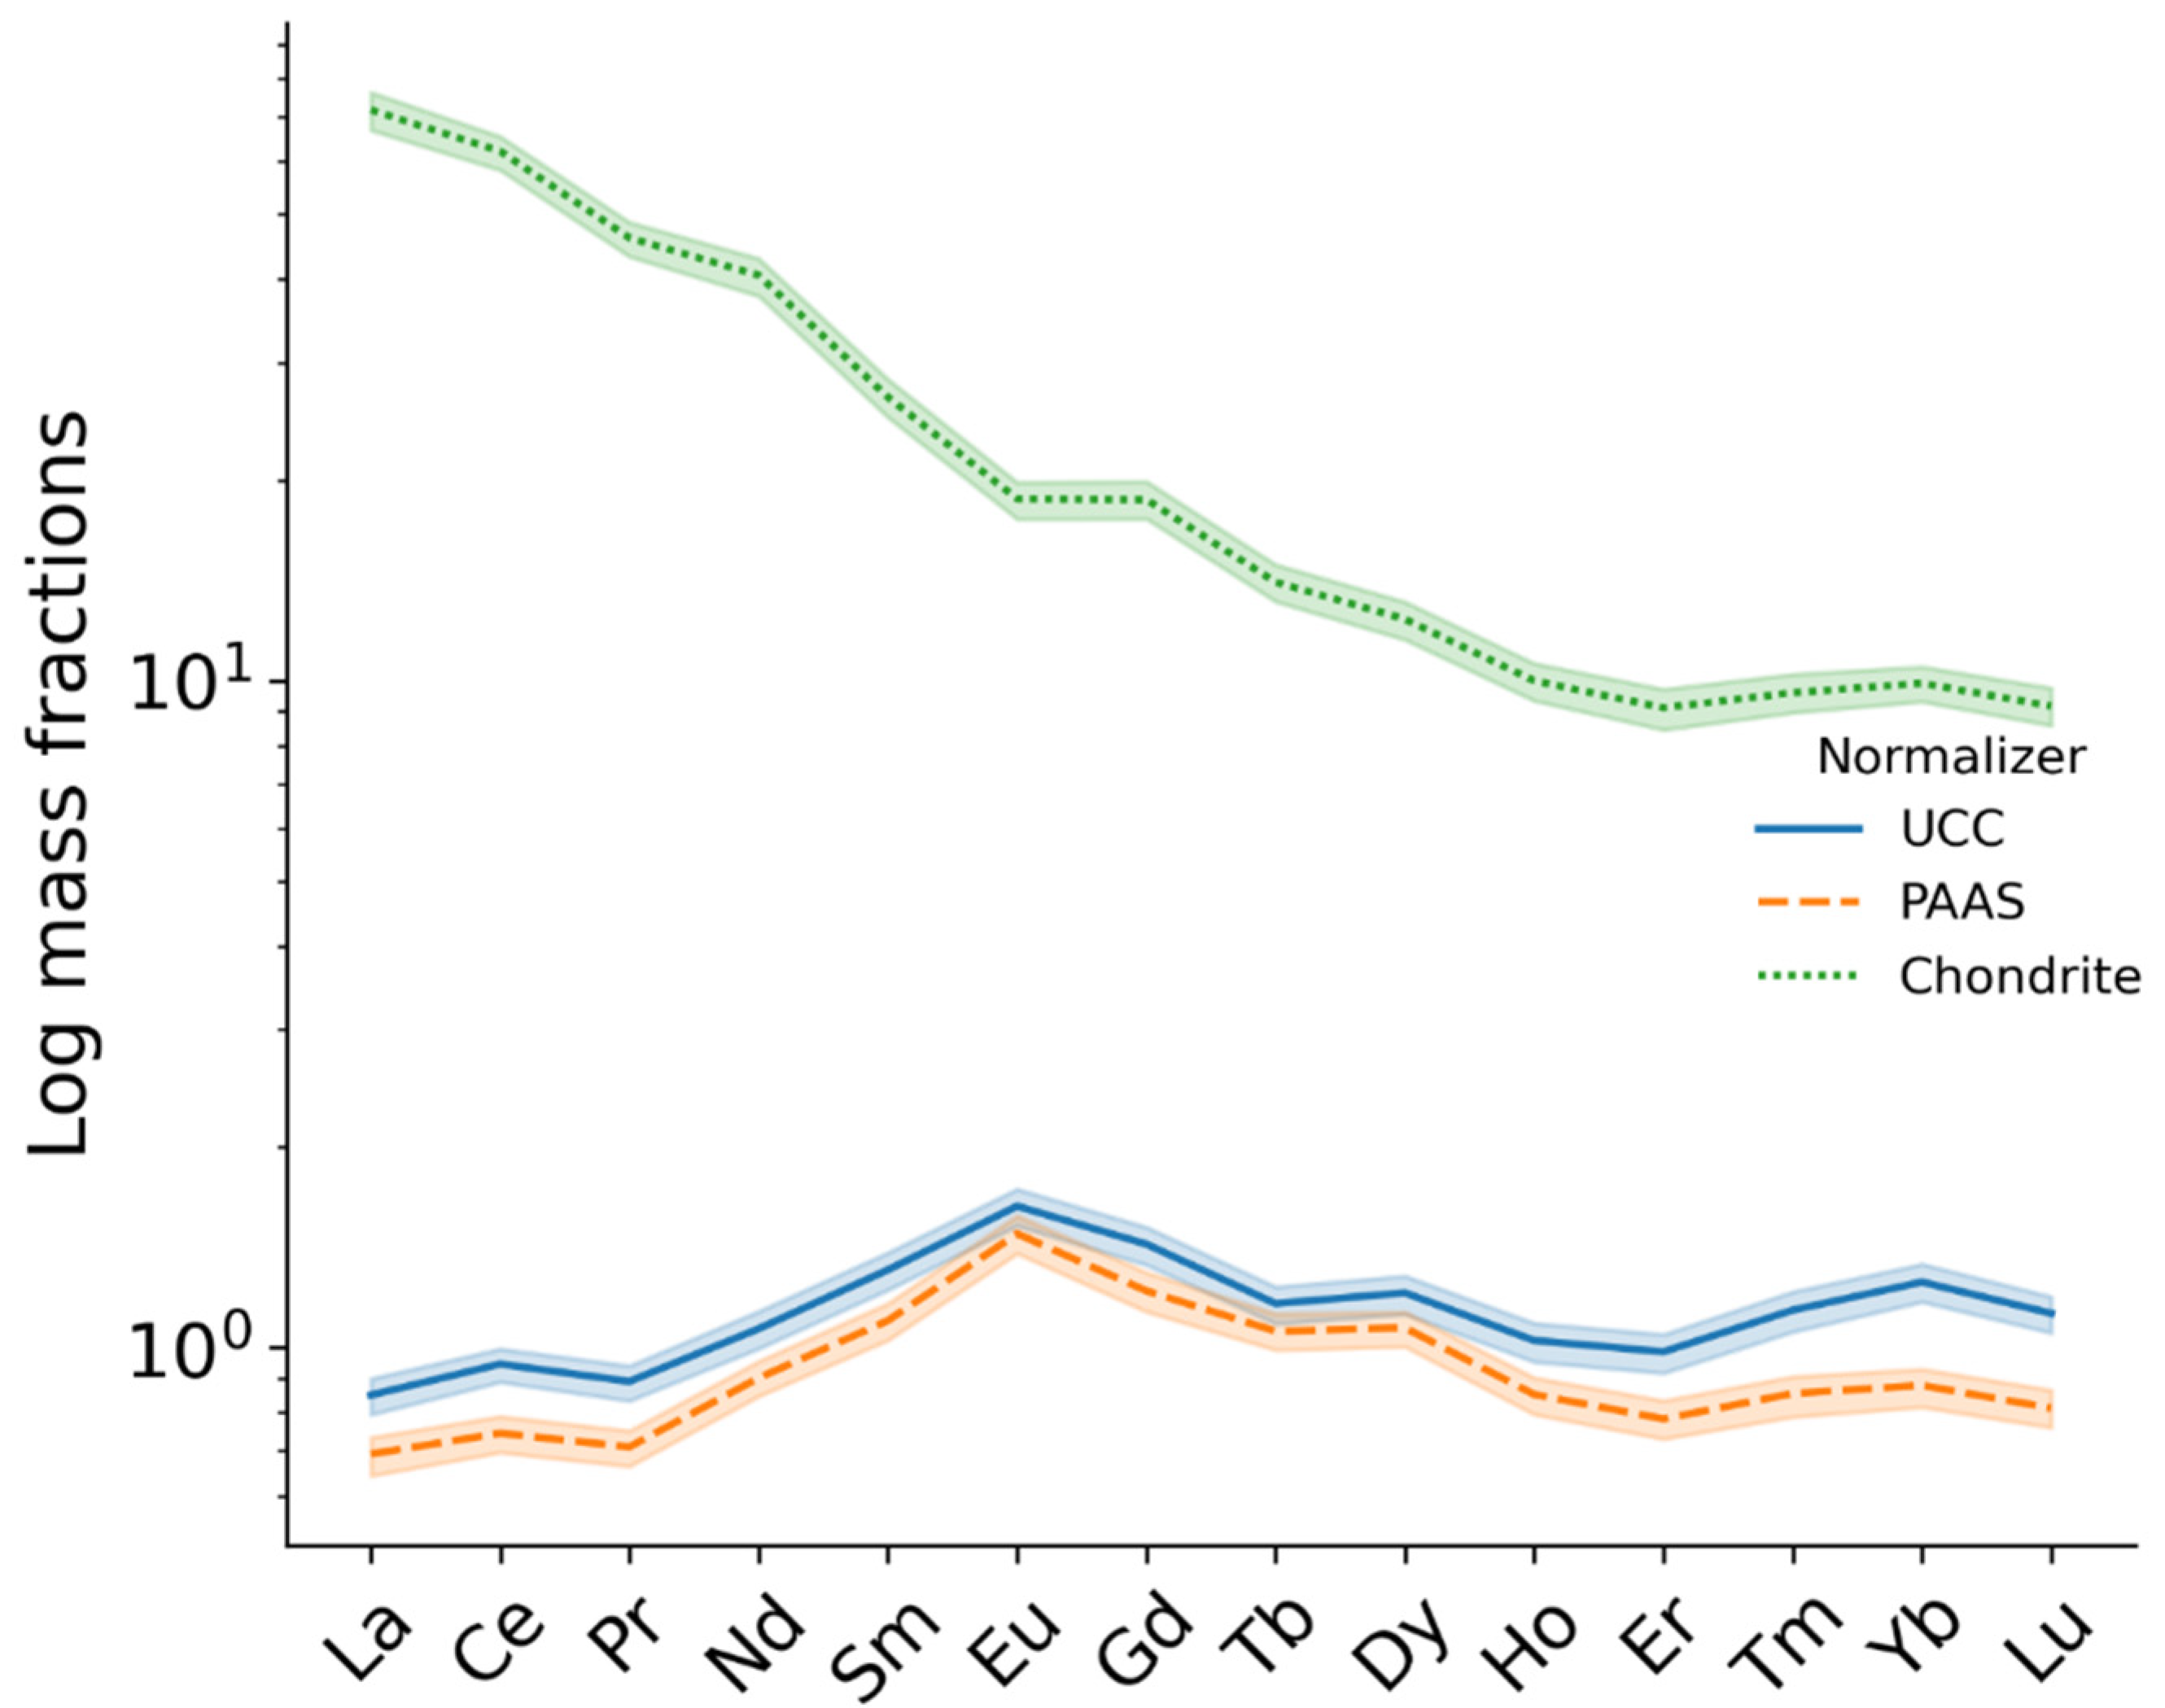
The mass fractions of the rare earth elements (REEs) were normalized to the corresponding values for UCC by Rudnick and Gao [49], Post Archean Australian Shale (PAAS) by Taylor and McLennan [52], and Chondrites by Taylor and McLennan [52], as clearly shown in Figure 3. The data clearly indicate that the Chondrites normalizer exhibits the highest values compared to the other two normalizers, PAAS and UCC, which generally align closely with one another. Notably, a negative europium (Eu) anomaly was observed in the Chondrites normalizer, indicating lower concentrations of Eu relative to other rare earth elements (REEs). This negative anomaly may be attributed to specific agricultural practices that could cause Eu depletion through runoff or erosion. Understanding these patterns is crucial for assessing soil quality, particularly concerning erosion and weathering processes. In contrast, when comparing the mass fractions of REEs to UCC and PAAS, the results demonstrate a positive Eu anomaly, suggesting that the soil contains higher levels of Eu relative to these two normalizers [31,53].

5.2. Normality Test and Intercorrelation

After the removal of the outliers using Mahalanobis distance probability, the new data were subjected to the assessment of normality using a Shapiro–Wilk normality test [18]. The results showed that the mass fractions of certain elements deviated from a normal distribution. A correlation matrix was generated, and correlation coefficients were calculated using the Pearson method to identify key trends and relationships among the elements, as illustrated in Figure S2.
At a glance, it is evident that Si, P, K, Ca, Sr, and Sb exhibit negative correlations with other elements. The strongest correlations were observed among the rare earth elements (REE), with coefficients nearing 1. No correlation patterns were identified for the following pairs: Co vs. U, Sb vs. Lu, and Sn vs. U. Notably, a strong negative correlation was found between Ca and Cr, Sc, Fe, and Ni (r = − 0.7). The correlation matrix provides a detailed overview of the uncorrelated features, which should be taken into account for further analysis using machine learning techniques, such as dimensionality reduction techniques like PCA and t-SNE for hierarchical agglomerative clustering (HAC).

5.3. Geochemical Provenance of Elements in Soil

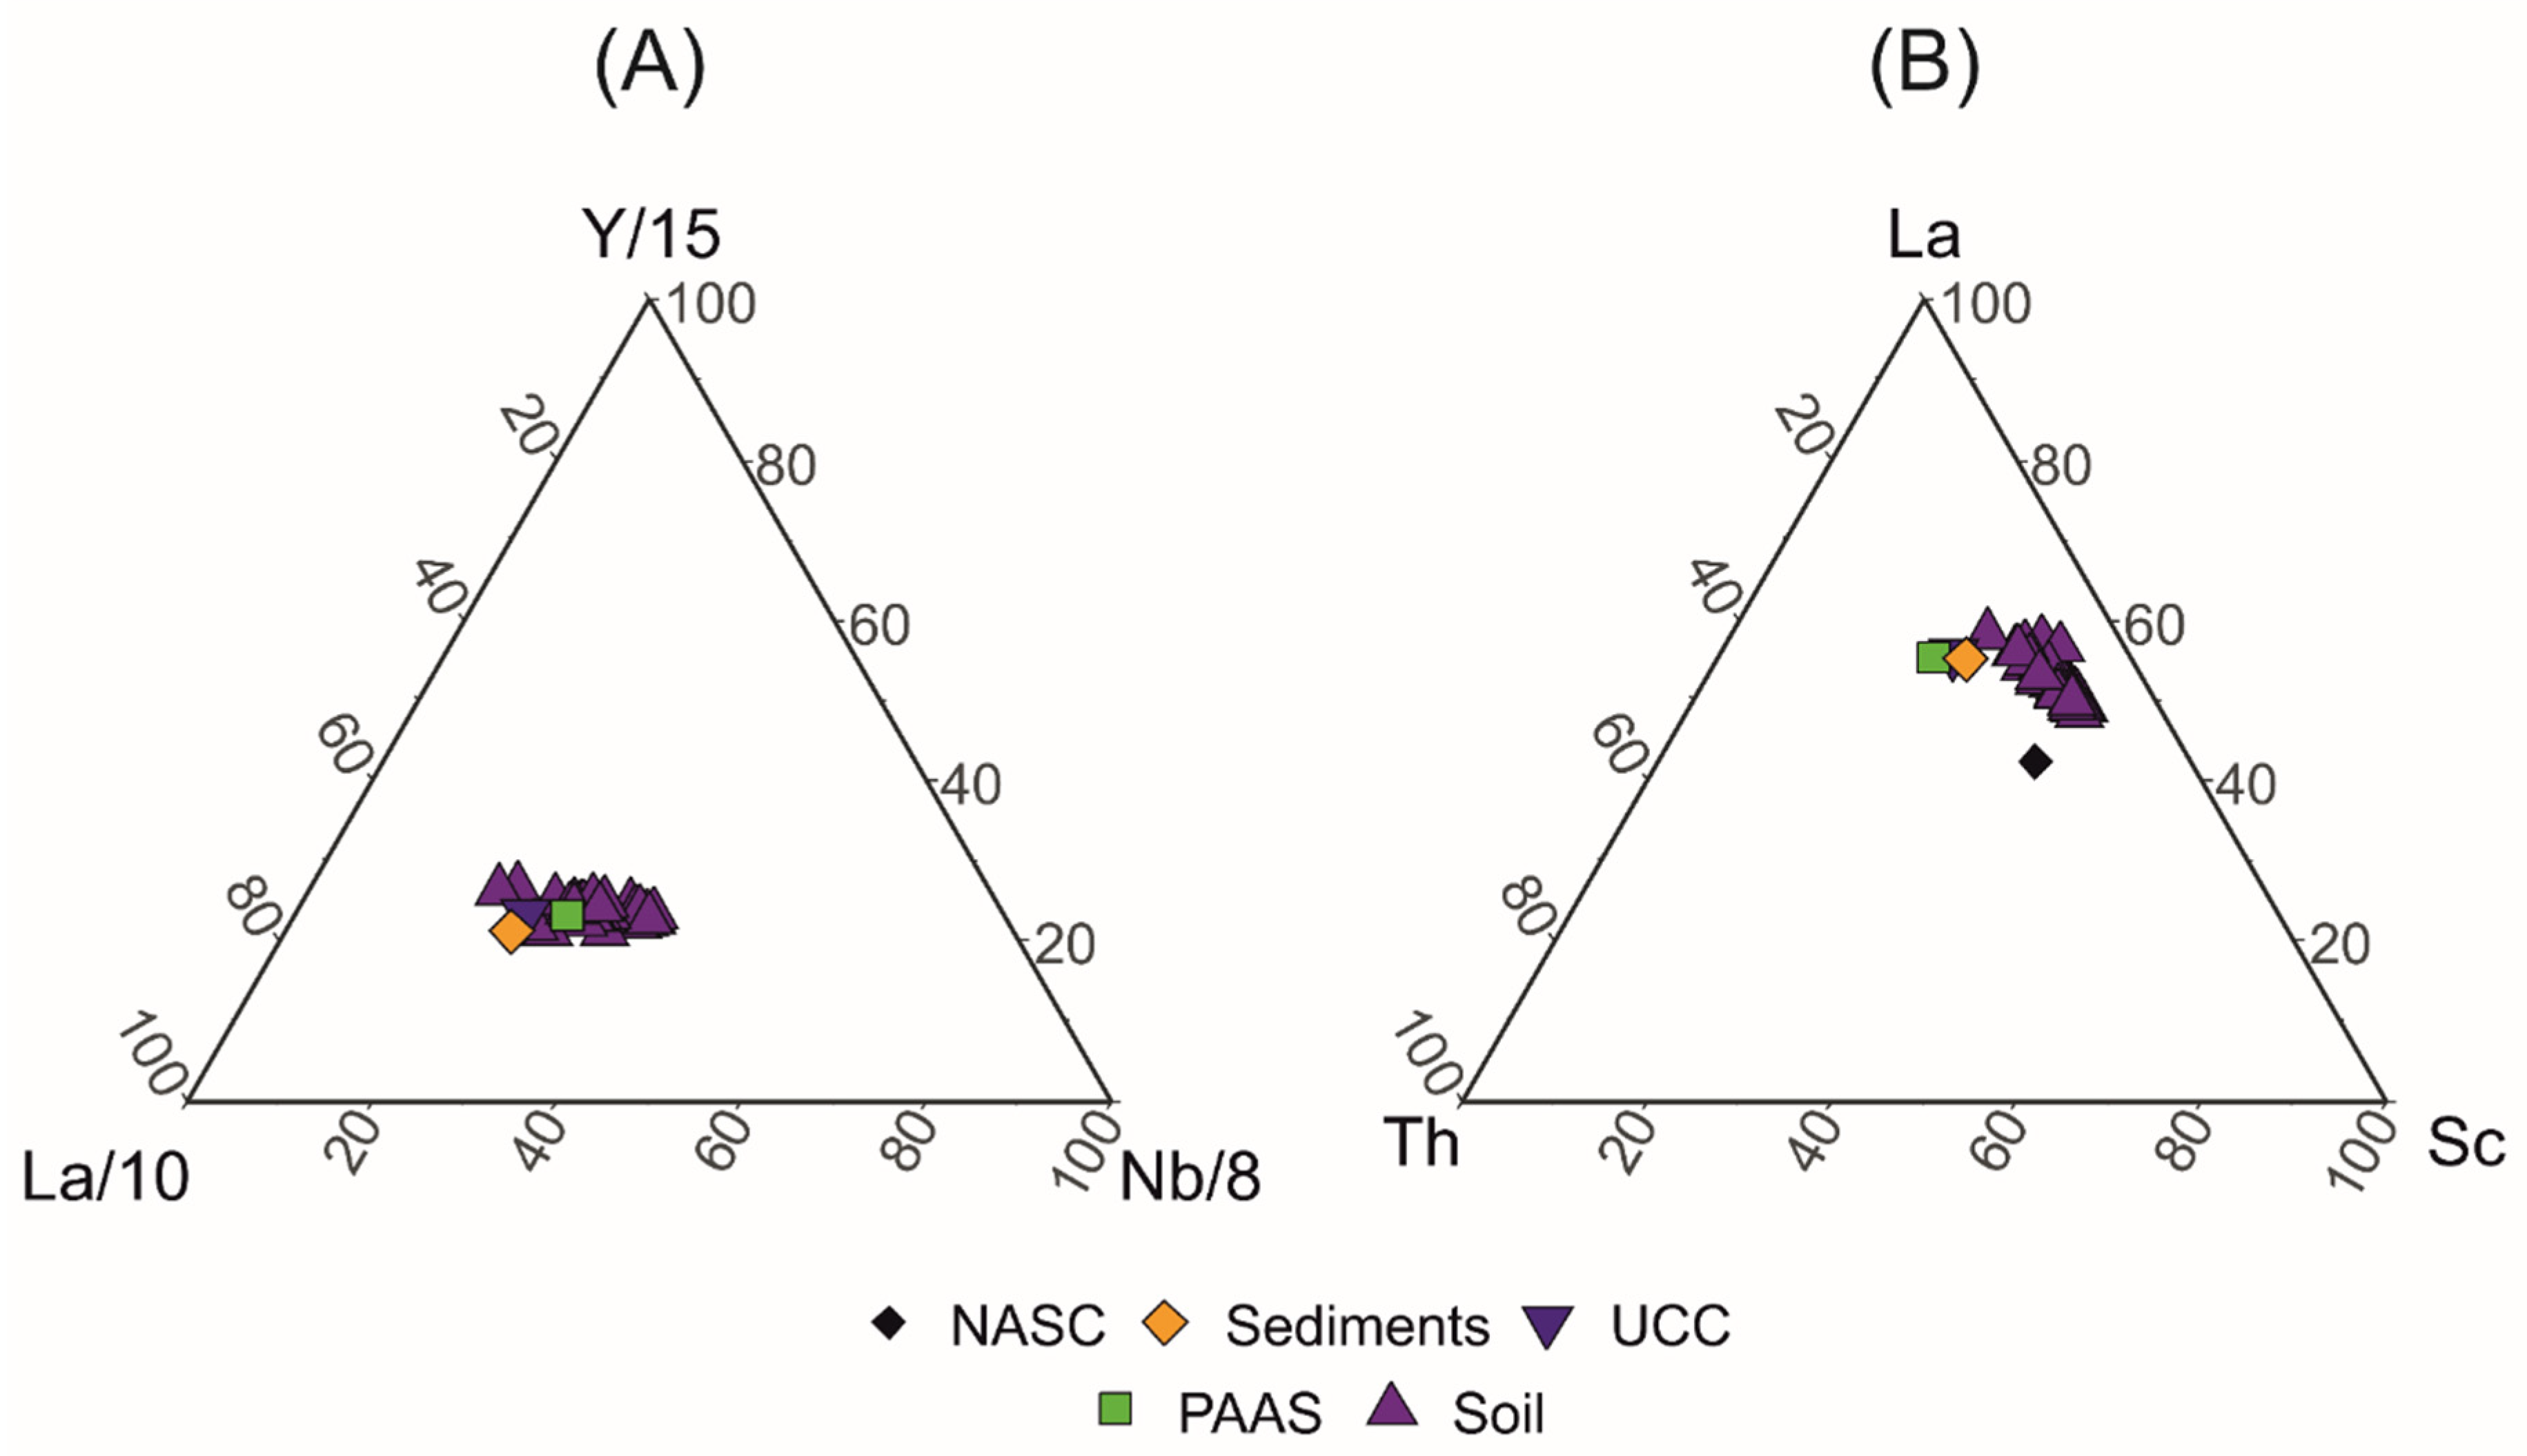
The geochemical origin of soil elements can be elucidated through effective methods that accurately represent their compositional variations. Among these methods, ternary diagrams stand out, offering valuable insights into soil characterization. Two ternary diagrams, La/10–Y/15–Nb/8 (A) and Th–La-Sc (B), are plotted, as clearly seen in Figure 4. The elements in both ternary diagrams are compared with the corresponding values from the literature as follows: UCC by Rudnick and Gao [54], PAAS by Taylor and McLennan [52], sediments by Viers, et al. [55], and the North American shale composite NASC by Gromet, et al. [56]. The samples match well those reported in the literature. Specifically, the ternary diagram A, where the samples are well allocated in the vicinity of UCC and B as well. These peculiarities can be attributed to the association of crustal elements in the soil samples.
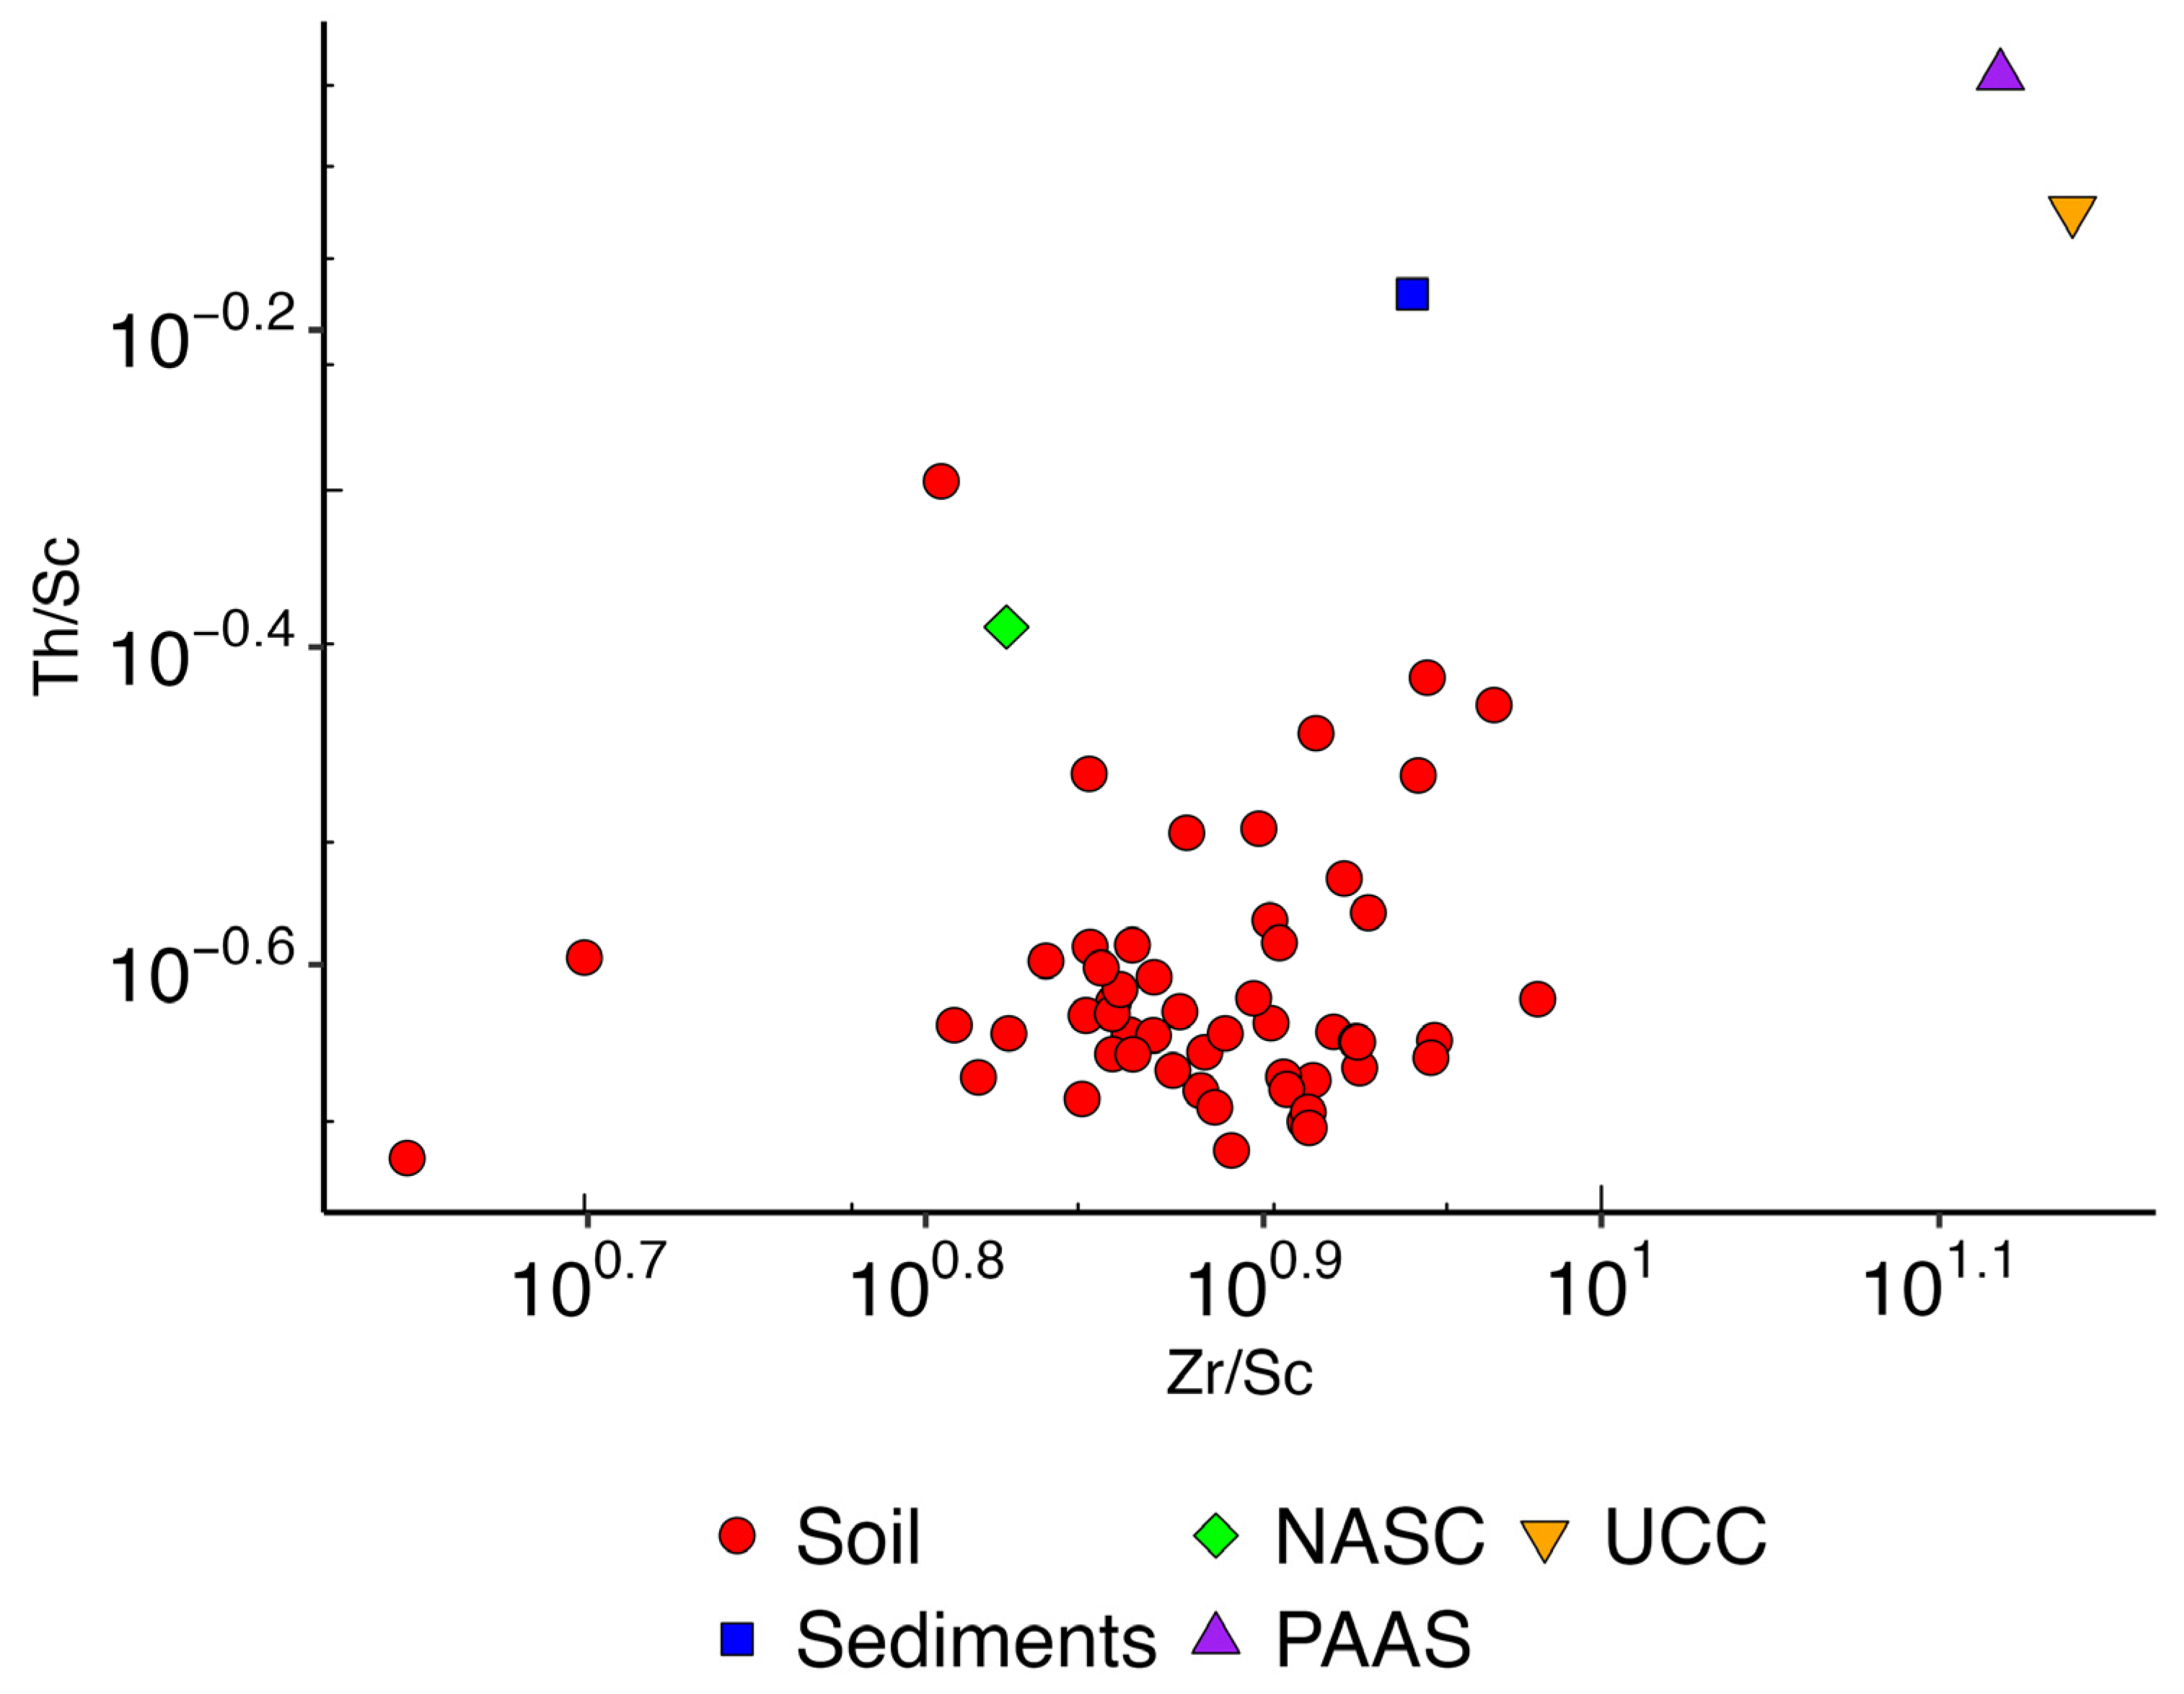
To gain further insights into sedimentary recycling, we analyzed the ratio of Zr/Sc versus Th/Sc, as shown in Figure 5. The figure clearly indicates minimal contributions from Th and Zr, suggesting a reduced sedimentary recycling process. This reduction can be attributed to the influence of the High Dam in Aswan, which traps sediments behind it. The obtained results are matching with our previous work along the two banks of the Nile River in the Egyptian sector [3,8].
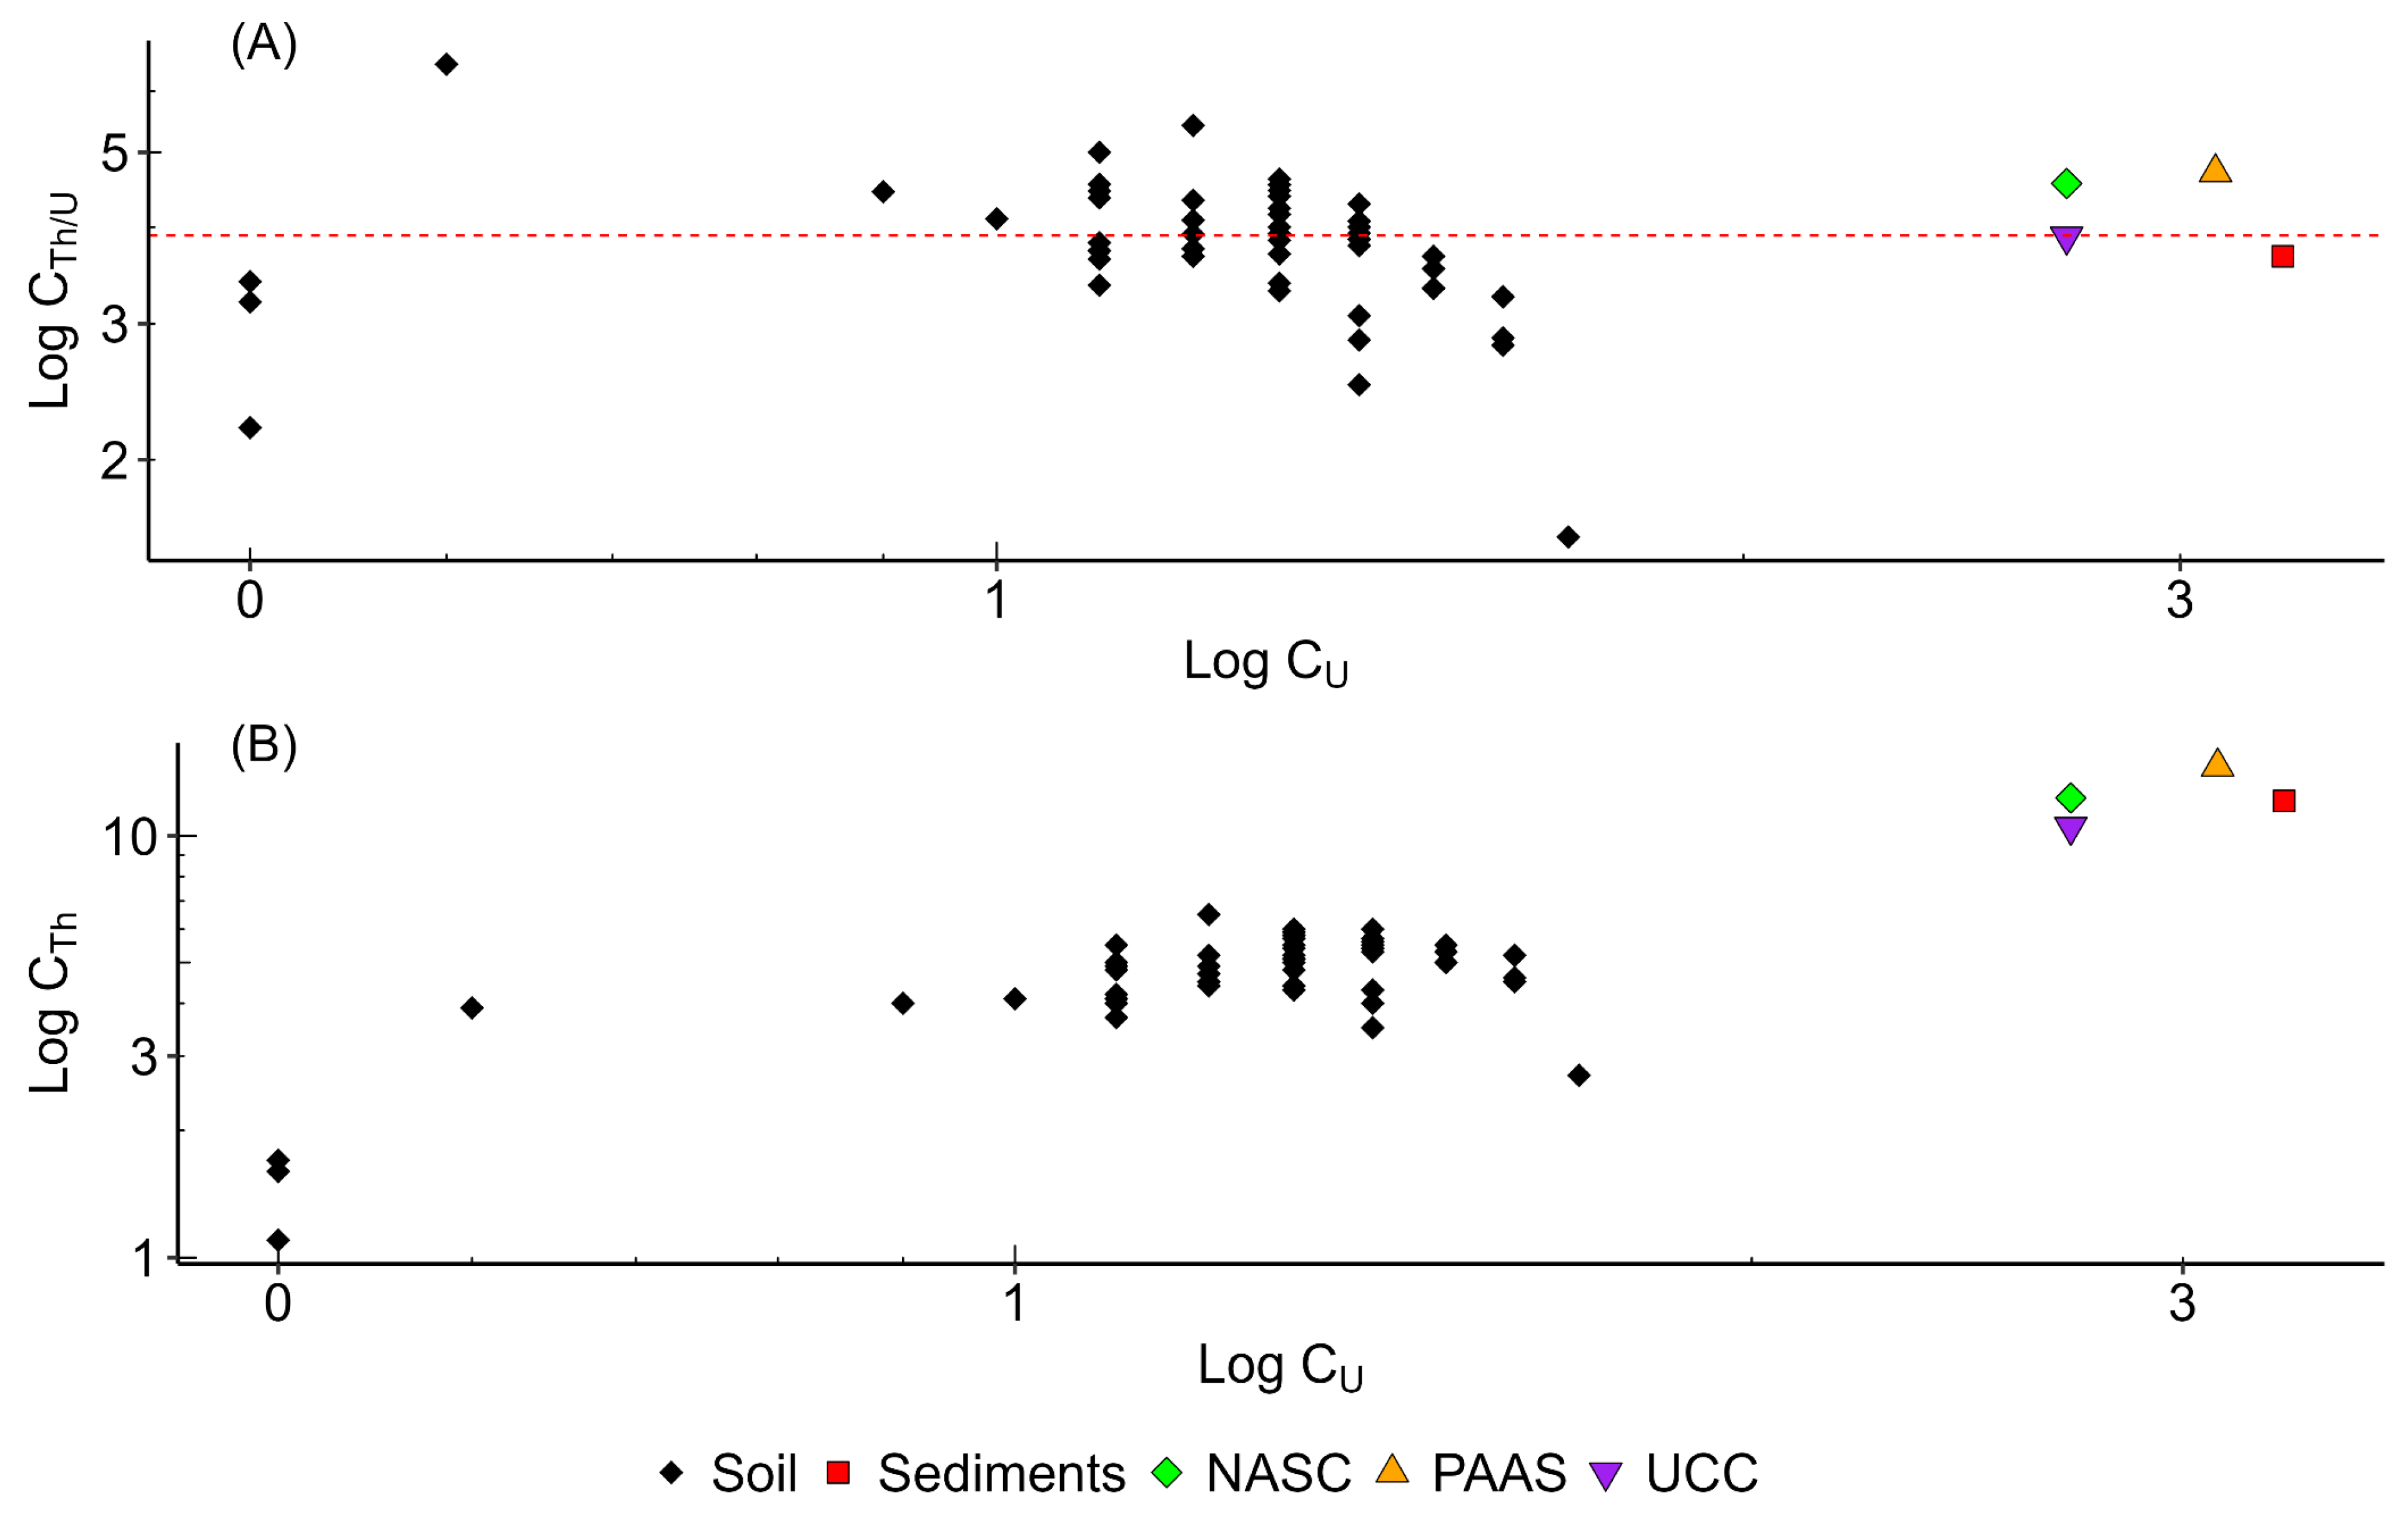
In the same manner, the distribution patterns of Th and U were examined in the studied soil samples, as clearly shown in Figure 6. The figure depicts that the ratio Th/U is in line with the corresponding values for UCC, NASC, PAAS, and the sediments, as shown in Figure 6A. In addition, the plot shows that the results of Th and U in the soil are distributed appropriately around the slope value of the ratio Th/U~3.9. These peculiarities prove that the origin of the Th and U is mainly from the crustal association, while Figure 6B shows the distribution of Th and U in the soil samples. It is clear from the figure that the amounts of Th and U are less than those of UCC, PAAS, NASC, and the sediments.
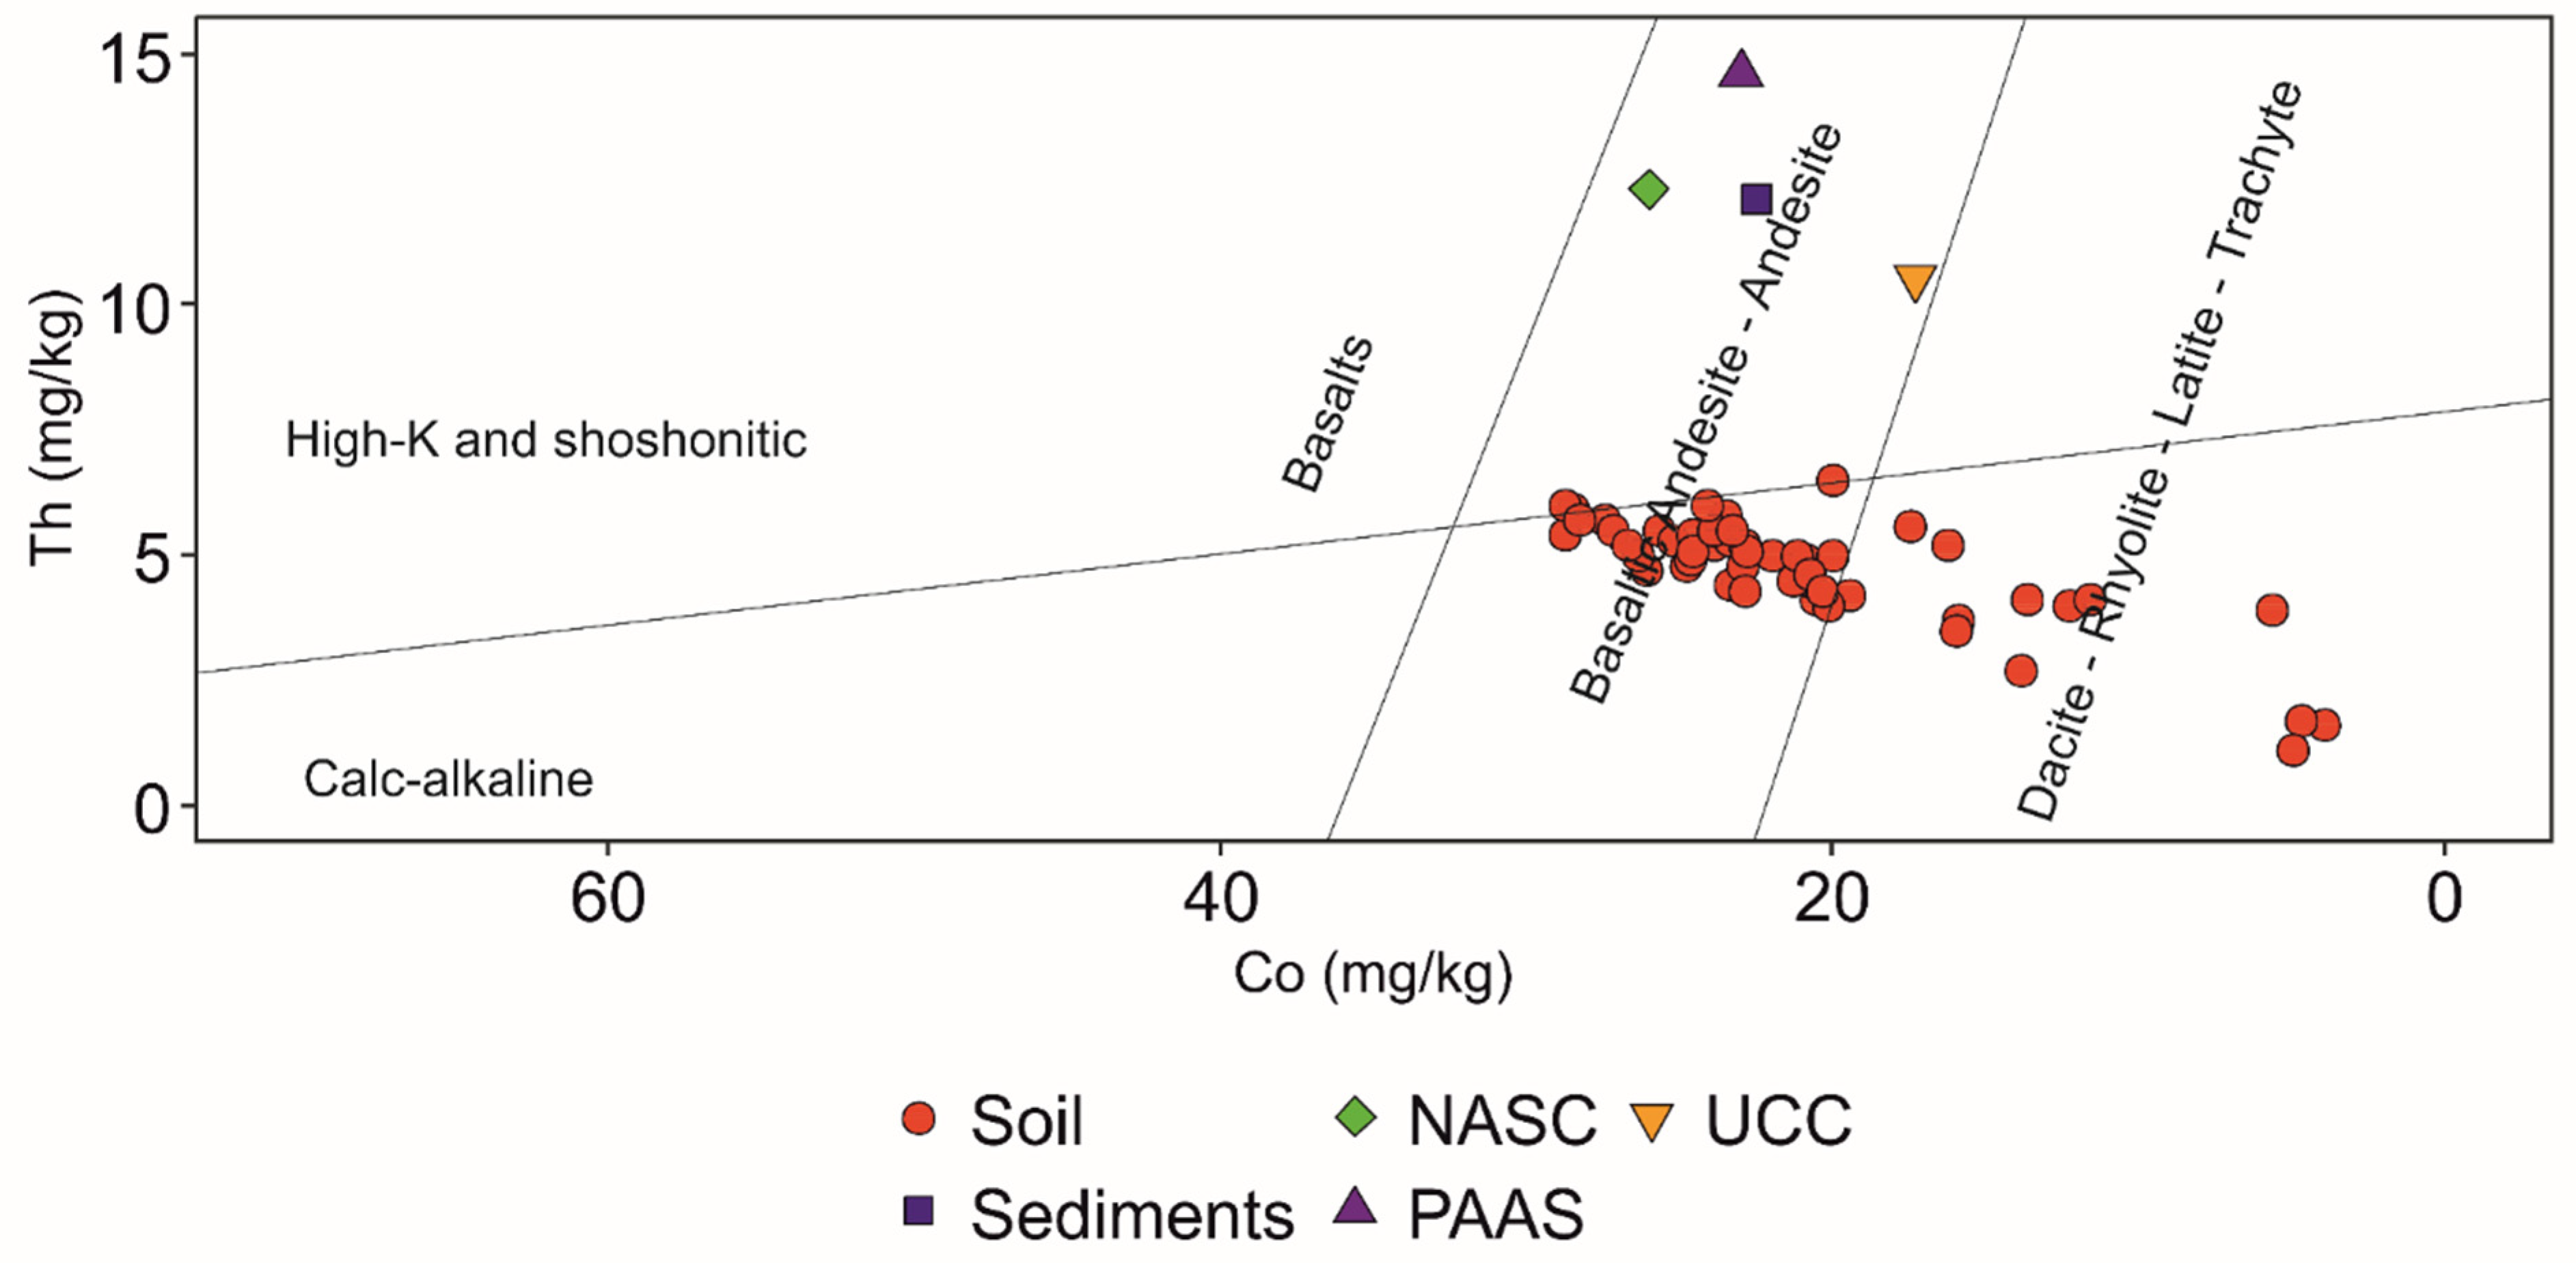
The relationship between Co and Th offers valuable insights into the weathering of rocks and their relationship to agricultural soils. Furthermore, it serves as an effective instrument for discerning the disparate origins of the elements present in the soil, as evidenced by the following illustration in Figure 7. It is obvious that most of the samples examined are located in the immediate vicinity of regions characterized by the occurrence of basalt, andesite and dacite rhyolite. These results can be attributed to the weathering of Ethiopian highlights that accumulated in the Nile Delta [3,8].

5.4. Findings of the Background and Pollution Analysis

In order to assess the environmental situation with regard to metal pollution, it is important to obtain the background values for the specific elements for which the assessment is carried out. As already mentioned, the background can be regional or global and can be calculated directly or indirectly. In the present work, the indirect regional background calculation was implemented. Based on the assumption that the mass fractions of the determined elements are normally distributed, the Just Another Gibbs Sampler (JAGS) is used in combination with Markov Chain Monte Carlo (MCMC) methods to apply Bayesian inference (BIM).
In this study, the results obtained were utilized as prior data for a model in which the mean (µ) follows a normal distribution, and the standard deviation (σ) follows a Gamma distribution. These hyperparameters were selected because they yielded the most accurate results for µ and σ, respectively. Specifically, the normal distribution was applied over the range defined by the minimum and maximum values of the data. The standard deviation σ was calculated using a Gamma distribution with a shape and rate parameter of 0.001. The model was designed to run for 50,000 iterations, with samples processed using JAGS and MCMC methods. The results of posteriors of the dataset (µ ± σ) with and without outliers are tabulated and given in Table 2.
At first glance, it is noticeable that there are slight differences between the results of the models for the raw data and the data after removing the outliers. The significant influence of the outlier on the distribution patterns of the mass fractions of the determined elements is evident.
Comparing the mean values of prior data, as seen in Table 1, it was discovered that the mean values of prior data are nearly identical to the posterior ones after eliminating the effect of the outliers. The close alignment of the mean values in the prior and posterior data can be attributed to the normal distribution of most mass fractions of the elements. This distribution limits the information available to significantly shift the posterior means away from the prior means. Additionally, removing outliers improves the similarity of these mean values, while the normal distribution of the prior data supports the tendency for the posterior means to closely resemble the prior values. Therefore, it is highly recommended to preprocess and treat the data before making hypotheses and conclusions. In particular, determining background levels on the basis of empirical data from the region under investigation can help to correctly assess the environmental situation with regard to pollution or contamination with elements. Otherwise, using background values from regions with different geological features could lead to a significant miscalculation of pollution levels, resulting in either overestimation or underestimation of the environmental situation. Based on the calculated results for posterior mean values without outliers from Table 2, the pollution indices and contamination factor were computed.
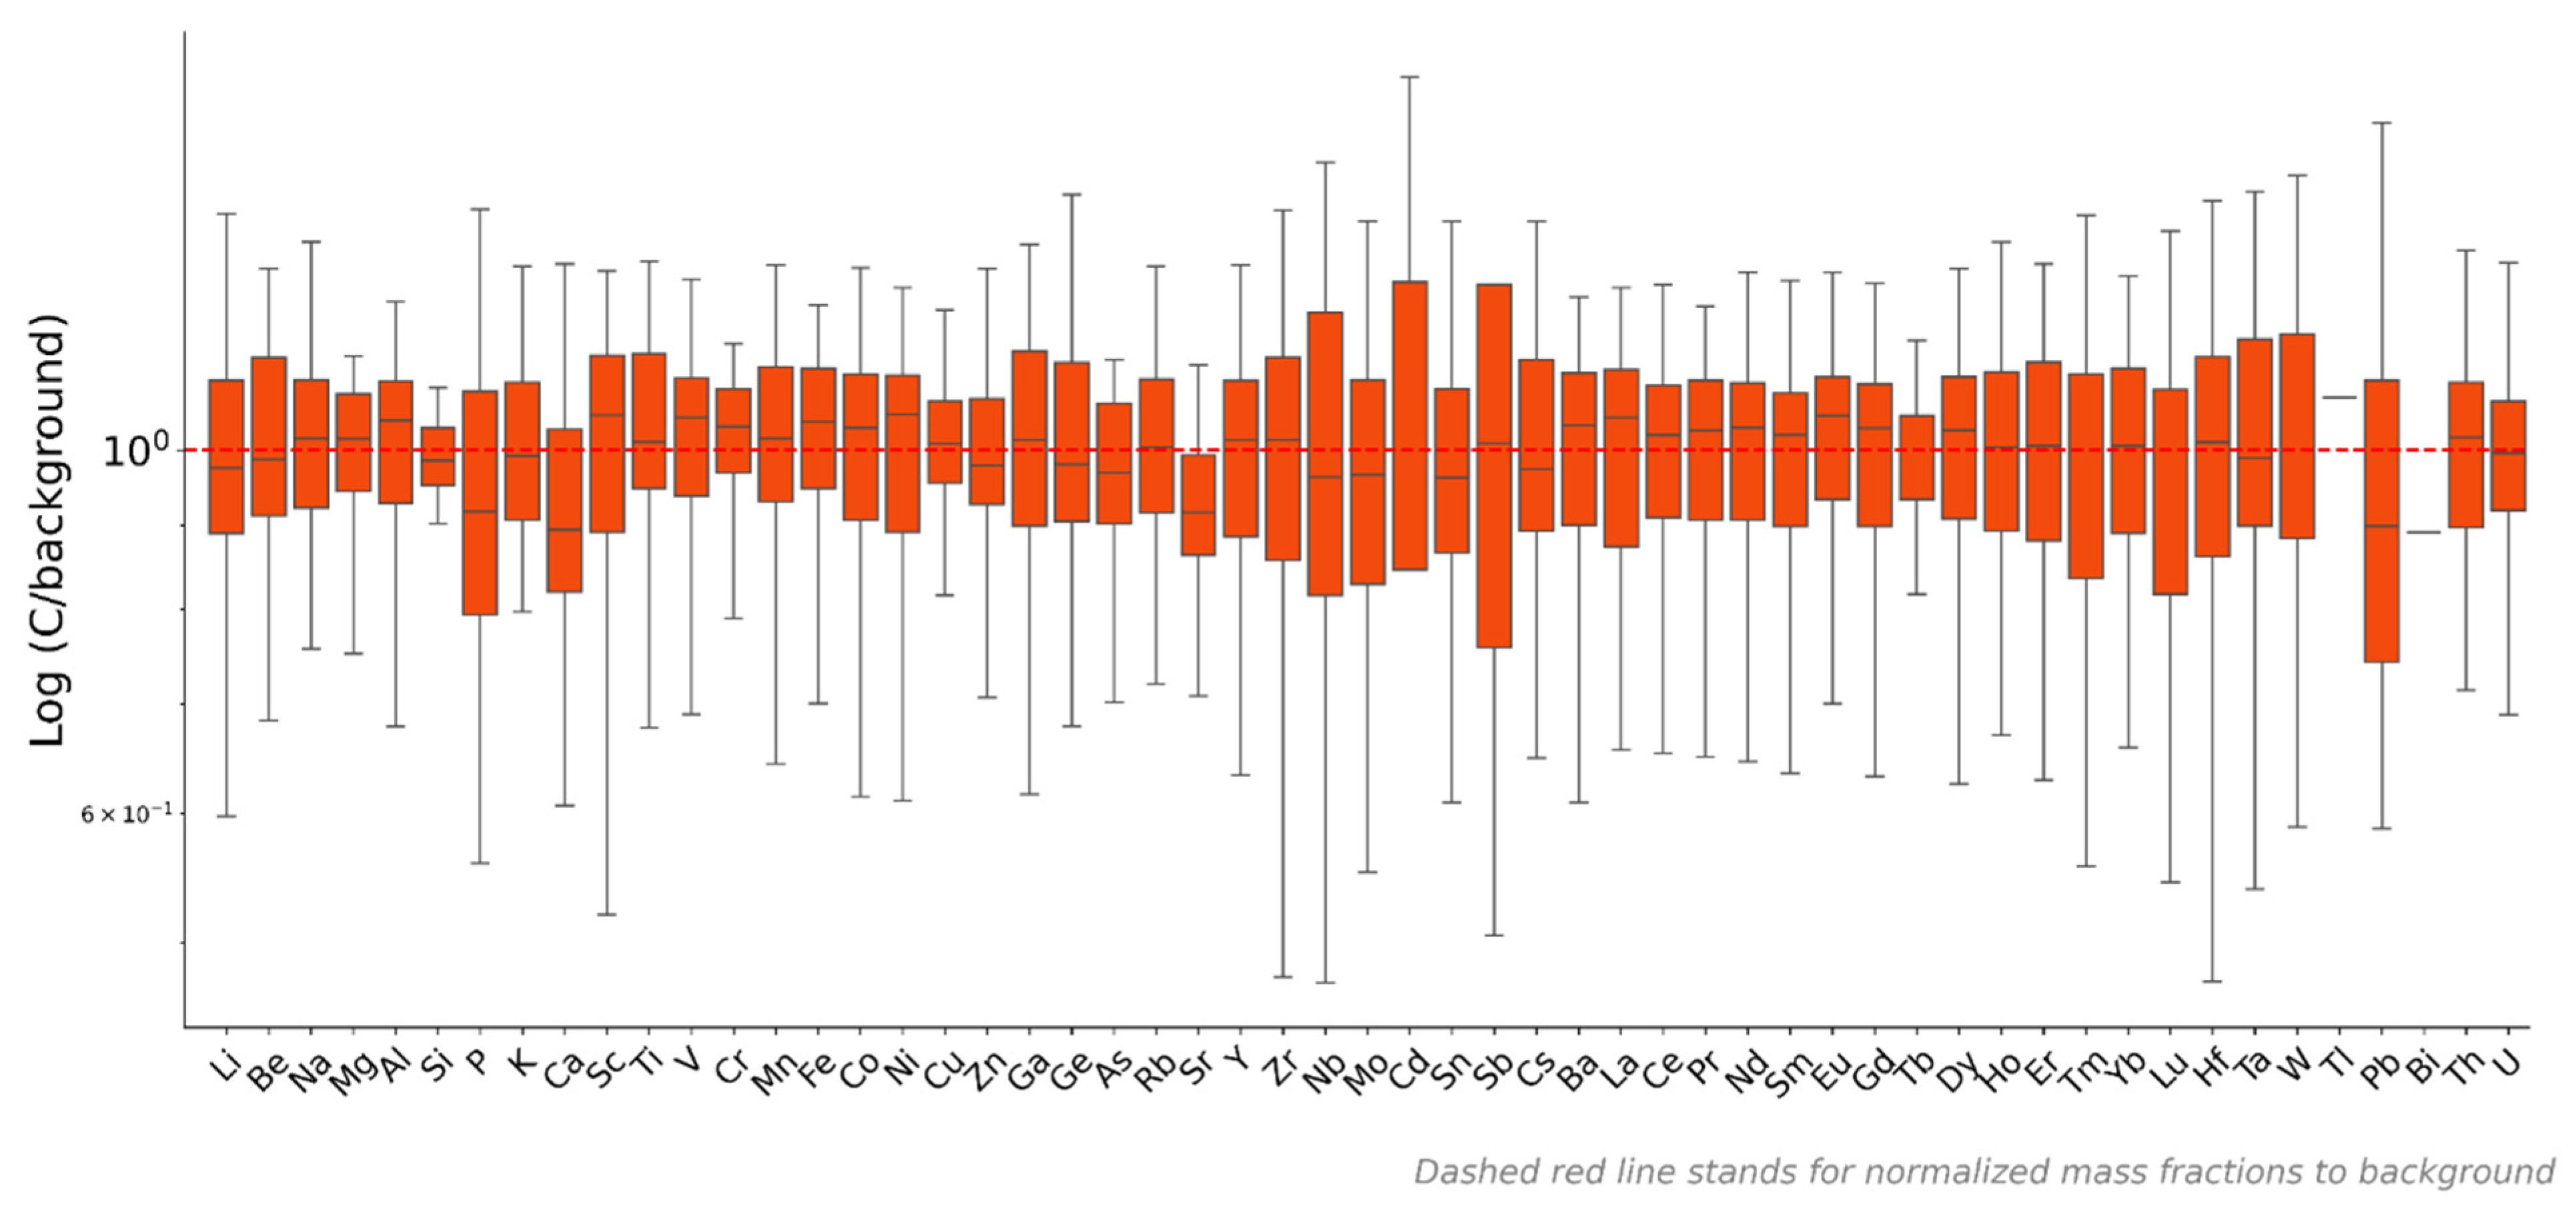
The single pollution index SPI is calculated and visualized in Figure 8. The figure clearly indicates that a small number of elements exhibit slightly elevated levels compared to the background values. However, these minimal amounts of SPI are well within the normalization line and do not pose any significant risk to human health or the surrounding environment.
The enrichment factor EF was calculated, and the results revealed that all the elements can be classified as no to minor enrichment. Specifically, EF ranges from 0.9 for Ni to 1.08 for Ca, respectively. Similarly, the pollution load index PLI was calculated and the results showed that PLI is higher than unity and does not pose any significant hazard to humans and the environment. Finally, the total pollution index TPI was calculated to be lower than 11 (permissible > 16) for the locations investigated. Based on the criteria and classes of PLI and TPI reported by Badawy, Dmitriev, El Samman, El-Taher, Blokhin, Rammah, Madkour, Salama and Budnitskiy [14], Abrahim and Parker [40], Andreev and Dzyuba [46], Saet, Revich, Yanin, Smirnova, Basharkevich, Onishchenko, Pavlova, Trefilova, Achkasov and Sarkisyan [48], Kowalska, et al. [58], the locations studied do not pose significant hazards. Overall, the data suggest that the studied areas are safe for both people and the environment.

5.5. Findings of the Unsupervised Learning HCA, PCA, t–SNE, and HAC

In this study, Hierarchical Cluster Analysis (HCA) was employed, an algorithm designed to categorize similar observations into groups known as clusters. Hierarchical clustering organizes data into a multilevel hierarchy, where clusters at one level merge to form clusters at the next. The algorithm groups objects based on their shared attributes, ultimately producing a set of distinct clusters. Within each cluster, the objects exhibit similarities, while differences exist between the clusters themselves [29,59,60]. Prior to the application of these algorithms, the data were scaled using the min–max normalization method to address discrepancies between the mass fractions of major, trace, and rare earth elements. This preprocessing step ensures that each feature contributes equally to the analysis.
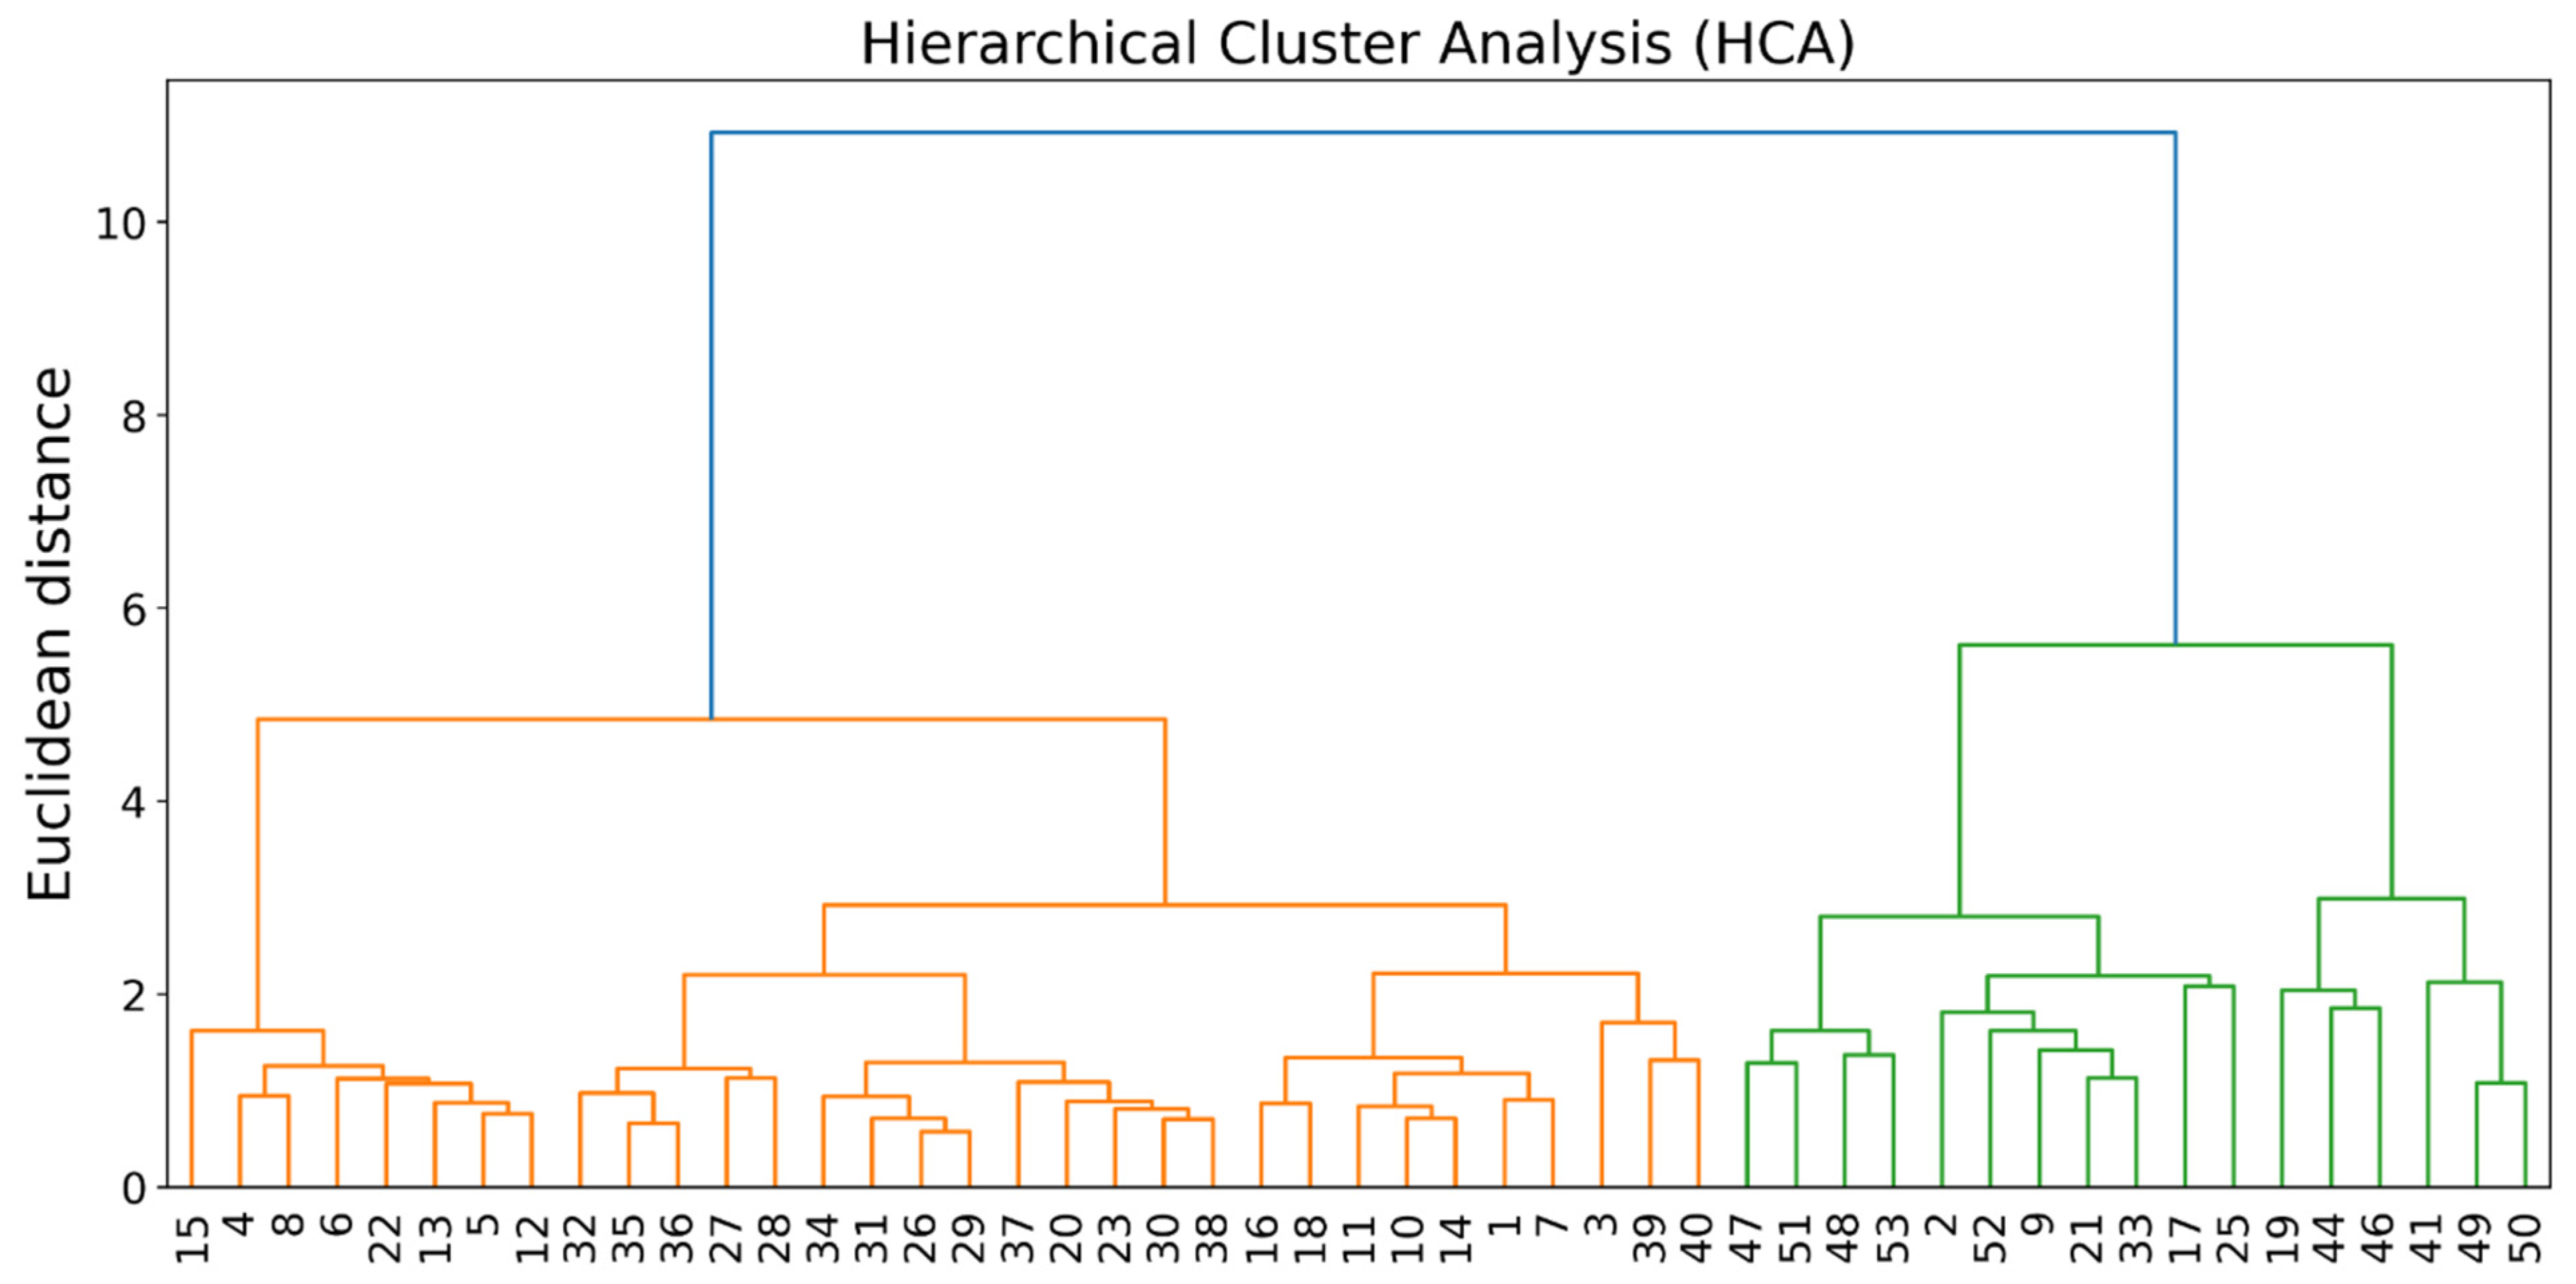
To gain an insight into the similarity of the observations, the hierarchical dendrogram was plotted, as can be clearly seen in Figure 9. A cluster analysis was performed using Ward’s minimum variance method to collect the group of observations based on geochemical characteristics. In addition, HCA was performed using Euclidean distance to calculate the distance to quantify the similarity or dissimilarity between the observations in Euclidean space. It is characterized by the direct measurement of the distance between two points. The accuracy of the clustering analysis was tested using the Cophenetic correlation coefficient, which yielded 0.7, suggesting moderate clustering with slight overlaps [28].
The figure clearly shows that soil samples are grouped into two primary clusters, each with identifiable subgroups sharing common geochemical characteristics. However, accurately determining the exact number of groups requires further analysis. To address this, the unsupervised machine learning algorithm HAC was applied. HAC was carried out based on the most powerful tools in dimensionality reduction (PCA and t–SNE). PCA is an unsupervised linear technique for reducing the dimensionality of high-dimensional data and enhancing data visualization. In this study, the dataset consists of 49 samples and 55 features, making it appropriate to apply PCA before conducting HAC.
Principal Component Analysis (PCA) revealed that the first two components capture nearly 70% of the total variance, with individual contributions of 63.7% and 6.5%, respectively. The scree plot further supports this, as it shows a notable elbow to the second component, suggesting that the first two components carry the most significant information. Based on this insight, the first two principal components were selected for further analysis using Hierarchical Agglomerative Clustering (HAC). This reduced data matrix was subsequently used to visualize the clustering outcomes of HAC. An unsupervised machine learning Agglomerative Clustering was applied and fitted to the data. The model was examined by calculating Silhouette and Davies–Bouldin Scores [61]. Then, by iterating different numbers of clusters, the highest scores were found out and the results are tabulated in Table S1.
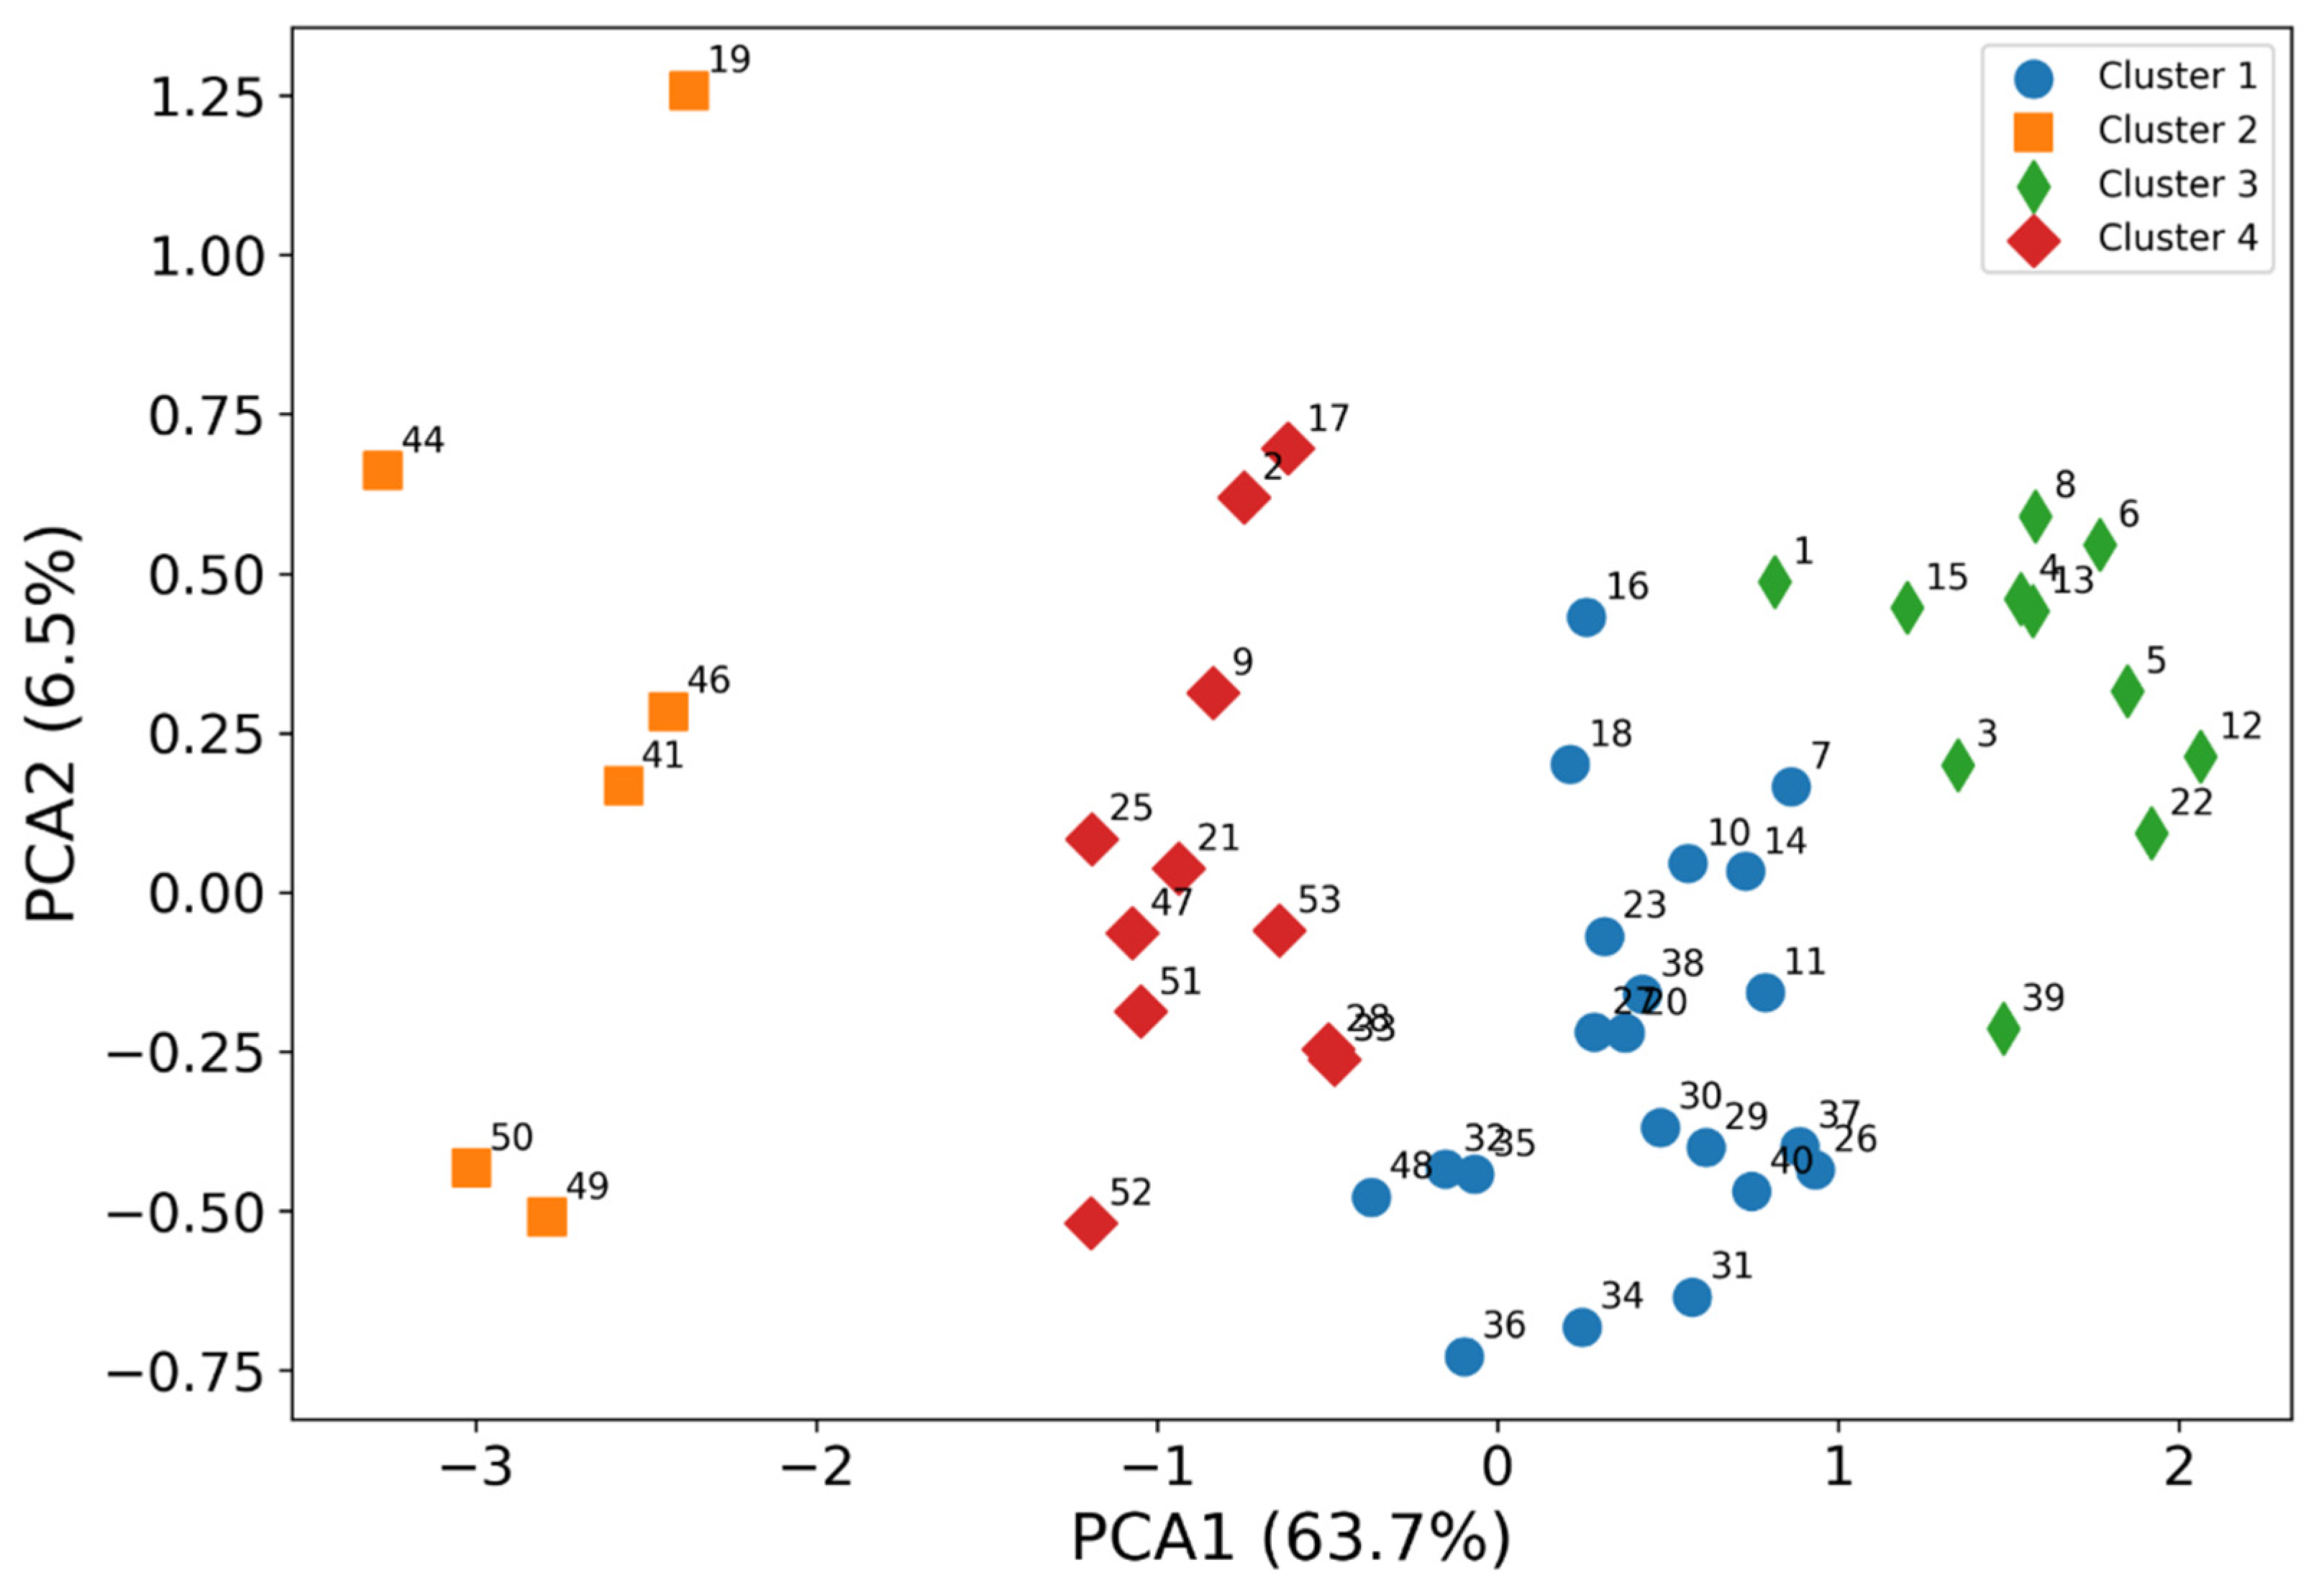
The highest Silhouette Score and lowest Davies–Bouldin Score achieved were 0.59 and 0.48, respectively, for two clusters. Therefore, it seems that the optimum number of clusters for the investigated data is two clusters. However, having prior knowledge about the investigated areas and potential pollution sources, it would be better to try using four clusters, especially because the differences in the scores are not significant compared with two clusters. These scores suggest normal clustering quality; although they are not particularly high, they indicate that the samples are reasonably well-clustered, with some overlap between clusters. In clustering analysis, a Silhouette Score closer to 1 signifies better-defined and more distinct clusters, while a lower Davies–Bouldin Score reflects higher clustering accuracy, as it indicates that observations within clusters are tightly grouped and well-separated from other clusters [61]. Based on the Agglomerative Clustering Analysis, the scatter plot of the first two PCAs was plotted and illustrated in Figure 10.
The figure depicts four distinct groups of locations. The groups can be summarized as follows:
  • Cluster 1 includes the highest number of locations, namely 7, 10, 11, 14, 16, 18, 23, 26, 27, 29, 30, 31, 32, 34, 35, 36, 37, 38, 40, and 48.
  • Cluster 2 has a minor number of samples, and they are locations 19, 41, 44, 46, 49, and 50.
  • Cluster 3 contains 11 locations: 1, 3, 4, 5, 6, 8, 12, 13, 15, 22, 39.
  • Cluster 4 includes the locations 2, 9, 17, 21, 25, 28, 33, 47, 51, 52, 53.
The studied locations are grouped based on shared sources of elemental composition in agricultural soil. PCA revealed overlaps between clusters, limiting its effectiveness in the clear separation of geochemical patterns.
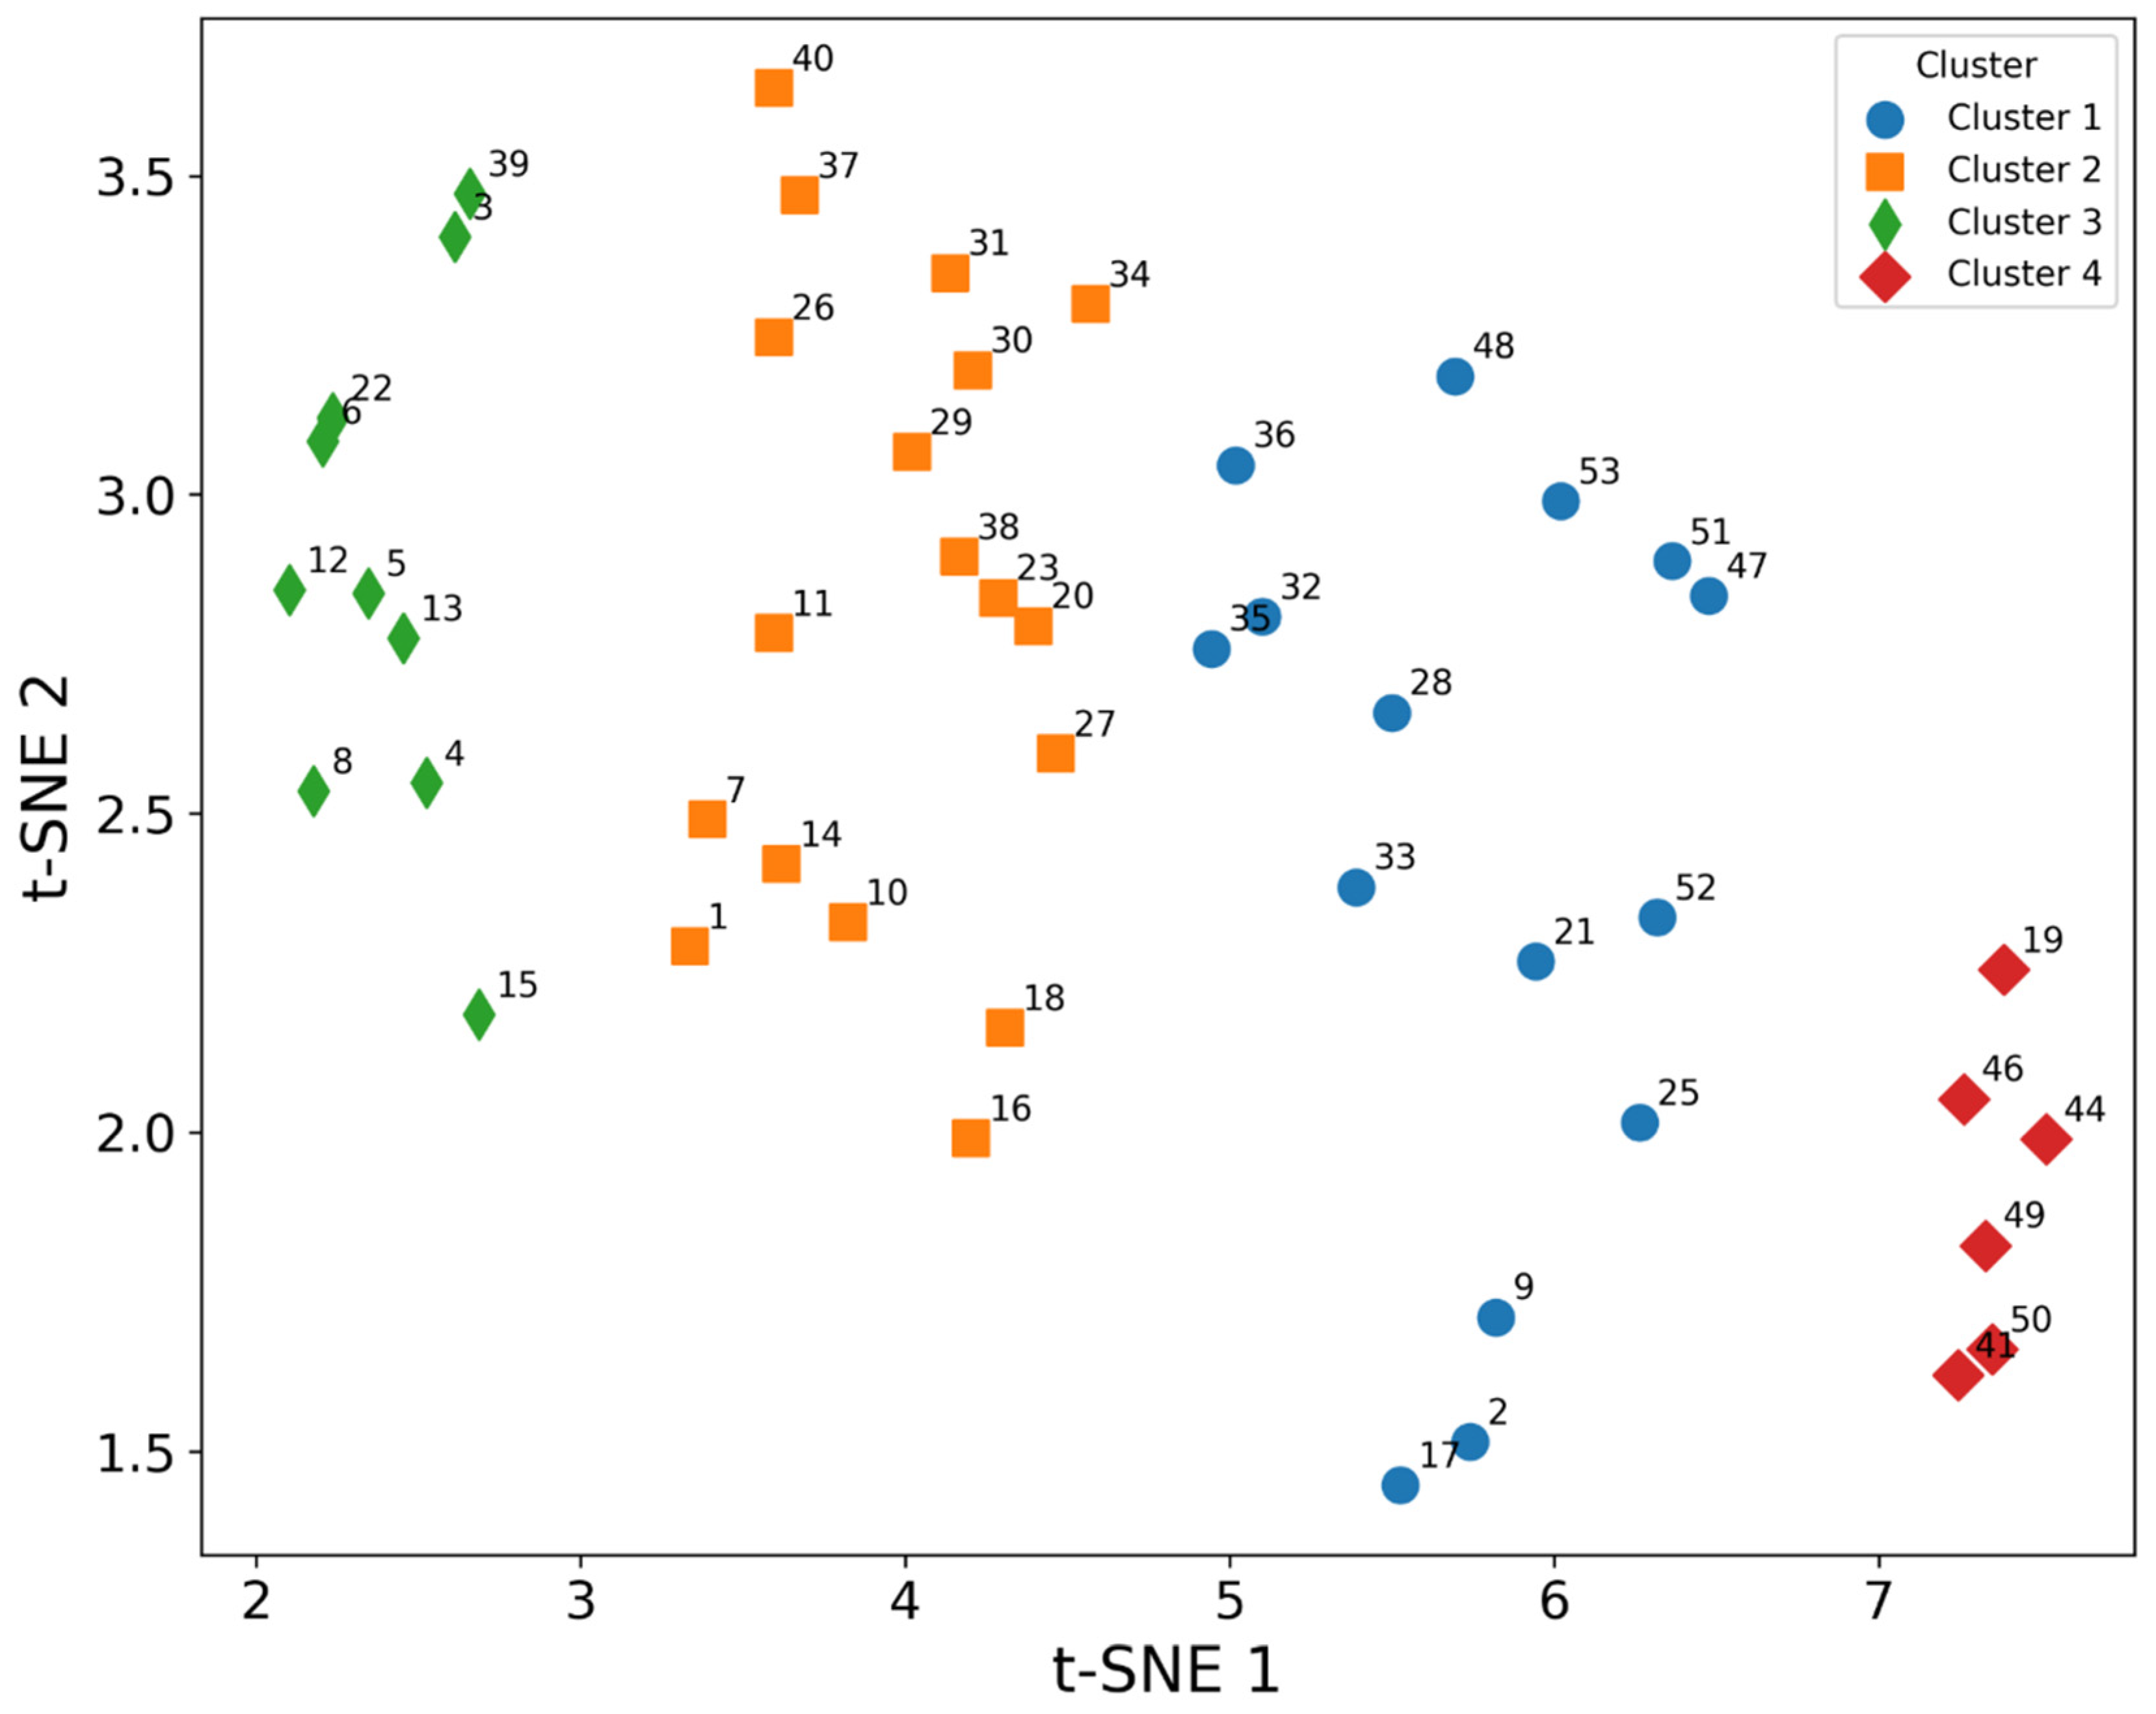
t-SNE, a widely used nonlinear dimensionality reduction technique, was applied to further reduce the data’s dimensions. The same approach was applied: first, the data was scaled, and t-SNE was performed with hyperparameters for a perplexity of 30 and auto-selected learning rate. Following dimensionality reduction, hierarchical agglomerative clustering was implemented as the chosen unsupervised clustering method. The results of HAC based on t-SNE are plotted and illustrated in Figure 11. The clustering evaluation yielded a Silhouette score of 0.49 and a Davies–Bouldin score of 0.63, indicating that the clusters are moderately well-defined.
With slight exceptions, both figures were grouped in almost the same places. The following discussion and interpretation will, therefore, be devoted to both. Although the clustering is moderate, the figure shows four clusters and can be summarized as follows:
  • Cluster 1 includes the soil samples labeled as 2, 9, 17, 21, 25, 28, 32, 33, 35, 36, 47, 48, 51, 52, and 53. Despite the fact that the samples were collected at different locations in the Nile Delta, they are grouped in a cluster, which is due to the fact that the samples were collected in agricultural areas close to the highways. Therefore, it can be assumed that the crustal association from the dust along the highways is the common source of these elements.
  • Cluster 2 contains 1, 7, 10, 11, 14, 16, 18, 20, 26, 27, 29, 30, 31, 34, 37, 38, and 40. The samples were taken from agricultural land near rural areas, and most likely the influences and pressures from these areas affect the amount of elemental mass fractions in the adjacent soil. It is good evidence that the analysis of the samples was accurate and that the statistical treatment and hypotheses are precise.
  • Cluster 3 has 10 samples, namely 3, 4, 5, 6, 8, 12, 12, 13, 15, 22, and 39. The samples were taken near large cities and industries. For example, some samples were collected near Tanta and Banha. It is, therefore, hypothesized that the common geochemical features that cluster these samples together are due to domestic activities and industry.
  • Cluster 4 has the minimum number of soil samples 19, 41, 44, 46, 49, and 50. These samples come from different places, but are collected in one group. This can be explained by the excessive use of fertilizers and the proximity to Lake Burullus [31].
Overall, the soil samples are well clustered according to the common geochemical characteristics. It is evidence that the precision and accuracy of the analysis is quite high. The analysis provides a comprehensive picture of the elemental composition of agricultural soils and provides an acceptable segmentation of the samples in terms of the elemental abundances. For example, the analysis shows that the samples were collected near highways, rural areas, and mixed potential pollution sources. Furthermore, the assignment of the clusters obtained by PCA and t-SNE showed a satisfactory agreement. They showed that the clusters are similar with respect to the common sources of pollution, as they reflect almost the same locations.

6. Conclusions

This study confirms the hypothesis that the agricultural soils in the Nile Delta region are not polluted and are mainly characterized by natural inputs from the earth’s crust. Comprehensive elemental analysis shows a slight enrichment of Cd, Ti, Cu, P, Eu, V, Fe, Ni and Ca, which currently pose no significant risks to the environment or human health. By integrating statistical approaches with advanced machine learning methods, in particular hierarchical clustering analysis and t-distributed Stochastic Neighbor Embedding, the study provides an innovative approach for environmental monitoring where sources related to human activities such as road traffic, agriculture and mixed land use can be effectively discriminated. The determination of empirically derived elemental background concentrations significantly improves the accuracy of future pollution assessments and reduces the risk of overestimating or underestimating environmental hazards. The present research combines soil geochemistry with machine learning models to create a novel methodological framework applicable to broader environmental management, policymaking and land-use planning. Policy makers can use these insights to develop targeted strategies to mitigate potential environmental impacts, while managers in agriculture and industry could use this approach to continuously monitor and control sources of contamination. The presented methodological approach and its results not only enrich the understanding of soil geochemistry in the Nile Delta but also hold promise for application in similar ecological assessments worldwide, particularly in regions experiencing rapid agricultural expansion and urbanization.

Supplementary Materials

The following supporting information can be downloaded at: https://www.mdpi.com/article/10.3390/environments12080289/s1, Figure S1: Boxplot shows the distribution patterns of the major elements as oxides in the soil samples; Figure S2: A correlation matrix based on Pearson method; Table S1: values of the accuracy scores.

Author Contributions

Conceptualization, W.M.B. and E.S.M.; Methodology, M.G.B.; Software, W.M.B.; Validation, W.M.B., M.G.B., E.S.M. and A.U.; Formal analysis, W.M.B.; Investigation, W.M.B., E.S.M. and T.M.M.; Data curation, W.M.B., F.I.E.-A. and T.M.M.; Writing—original draft, W.M.B. and A.U.; Writing—review & editing, F.I.E.-A., M.G.B. and T.M.M.; Visualization, F.I.E.-A. and A.U. All authors have read and agreed to the published version of the manuscript.

Funding

This research received no external funding.

Data Availability Statement

The original data is presented in this study.

Acknowledgments

The authors acknowledge the joint project between the Academy of Scientific Research and Technology (Egypt) and the Joint Institute for Nuclear Research (Dubna, Russia) ASRT–JINR collaboration.

Conflicts of Interest

The authors declare no conflict of interest.

References

  1. Hamza, W. The Nile Delta. In The Nile; Dumont, H.J., Ed.; Monographiae Biologicae; Springer: Dordrecht, The Netherlands, 2009; pp. 75–94. [Google Scholar]
  2. Fishar, M.R. Nile Delta (Egypt). In The Wetland Book: II: Distribution, Description and Conservation; Finlayson, C.M., Milton, G.R., Prentice, R.C., Davidson, N.C., Eds.; Springer: Dordrecht, The Netherlands, 2016; pp. 1–10. [Google Scholar]
  3. Arafa, W.M.; Badawy, W.M.; Fahmi, N.M.; Ali, K.; Gad, M.S.; Duliu, O.G.; Frontasyeva, M.V.; Steinnes, E. Geochemistry of sediments and surface soils from the Nile Delta and lower Nile valley studied by epithermal neutron activation analysis. J. Afr. Earth Sci. 2015, 107, 57–64. [Google Scholar] [CrossRef]
  4. Bratley, K.H.; Woodcock, C.E. Estimating the expansion and reduction of agricultural extent in Egypt using Landsat time series. Int. J. Appl. Earth Obs. 2024, 133, 104141. [Google Scholar] [CrossRef]
  5. Fritz, S.; See, L.; McCallum, I.; You, L.; Bun, A.; Moltchanova, E.; Duerauer, M.; Albrecht, F.; Schill, C.; Perger, C.; et al. Mapping global cropland and field size. Glob. Change Biol. 2015, 21, 1980–1992. [Google Scholar] [CrossRef] [PubMed]
  6. Badawy, W.; Frontasyeva, M.V.; Ibrahim, M. Vertical Distribution of Major and Trace Elements in a Soil Profile from the Nile Delta, Egypt. Ecol. Chem. Eng. S 2020, 27, 281–294. [Google Scholar] [CrossRef]
  7. Stanley, D.J. Nile delta: Extreme case of sediment entrapment on a delta plain and consequent coastal land loss. Mar. Geol. 1996, 129, 189–195. [Google Scholar] [CrossRef]
  8. Badawy, W.M.; Ghanim, E.H.; Duliu, O.G.; El Samman, H.; Frontasyeva, M.V. Major and trace element distribution in soil and sediments from the Egyptian central Nile Valley. J. Afr. Earth Sci. 2017, 131, 53–61. [Google Scholar] [CrossRef]
  9. Puthusseri, R.M.; Nair, H.P.; Johny, T.K.; Bhat, S.G. Insights into the response of mangrove sediment microbiomes to heavy metal pollution: Ecological risk assessment and metagenomics perspectives. J. Environ. Manag. 2021, 298, 113492. [Google Scholar] [CrossRef] [PubMed]
  10. Arbuzov, S.I.; Chekryzhov, I.Y.; Verkhoturov, A.A.; Spears, D.A.; Melkiy, V.A.; Zarubina, N.V.; Blokhin, M.G. Geochemistry and rare-metal potential of coals of the Sakhalin coal basin, Sakhalin island, Russia. Int. J. Coal Geol. 2023, 268, 104197. [Google Scholar] [CrossRef]
  11. IAEA. Soil Sampling for Environmental Contaminants; International Atomic Energy Agency: Vienna, Austria, 2004. [Google Scholar]
  12. EGSMA. Geologic Map of Um Safi Area; EGSMA: Cairo, Egypt, 1989. [Google Scholar]
  13. NSAM, N.-A.M. Determination of Element Composition of Rocks, Soils, Grounds, and Sediments by ICP-AE and ICP-MS Methods. All-Russian Scientific-Research Institute Of Mineral Resources named after N.M. Fedorovsky: Moscow, Russia, 2015. [Google Scholar]
  14. Badawy, W.M.; Dmitriev, A.Y.; El Samman, H.; El-Taher, A.; Blokhin, M.G.; Rammah, Y.S.; Madkour, H.A.; Salama, S.; Budnitskiy, S.Y. Elemental composition and metal pollution in Egyptian Red Sea mangrove sediments: Characterization and origin. Mar. Pollut. Bull. 2024, 198, 115830. [Google Scholar] [CrossRef]
  15. Josso, P.; Rushton, J.; Lusty, P.; Matthews, A.; Chenery, S.; Holwell, D.; Kemp, S.J.; Murton, B. Late Cretaceous and Cenozoic paleoceanography from north-east Atlantic ferromanganese crust microstratigraphy. Mar. Geol. 2020, 422, 106122. [Google Scholar] [CrossRef]
  16. R Core Team. R: A Language and Environment for Statistical Computing, 4.2.1; R Foundation for Statistical Computing: Vienna, Austria, 2022. [Google Scholar]
  17. van Rossum, G. Python Tutorial, Technical Report CS-R9526, Centrum voor Wiskunde en Informatica (CWI), 3.10; Python Software Foundation: Amsterdam, The Netherlands, 1995. [Google Scholar]
  18. Shapiro, S.S.; Wilk, M.B. An analysis of variance test for normality (complete samples). Biometrika 1965, 52, 591–611. [Google Scholar] [CrossRef]
  19. Filzmoser, P.; Hron, K. Outlier Detection for Compositional Data Using Robust Methods. Math. Geosci. 2008, 40, 233–248. [Google Scholar] [CrossRef]
  20. Filzmoser, P.; Hron, K.; Reimann, C. Principal component analysis for compositional data with outliers. Environmetrics 2009, 20, 621–632. [Google Scholar] [CrossRef]
  21. Lê, S.; Josse, J.; Husson, F. FactoMineR: An R package for multivariate analysis. J. Stat. Softw. 2008, 25, 18. [Google Scholar] [CrossRef]
  22. Van Der Maaten, L. Accelerating t-SNE using Tree-Based Algorithms. J. Mach. Learn. Res. 2014, 15, 3221–3245. [Google Scholar]
  23. Keim, D.A.; Kohlhammer, J.; Ellis, G.P.; Mansmann, F. Mastering the Information Age—Solving Problems with Visual Analytics; Eurographics Association: Eindhoven, The Netherlands, 2010. [Google Scholar]
  24. Badawy, W.; Silachyov, I.; Dmitriev, A.; Lennik, S.; Saleh, G.; Mitwalli, M.; El-Farrash, A.; Sallah, M. Elemental distribution patterns in rock samples from Egypt using neutron activation and complementary X-ray fluorescence analyses. Appl. Radiat. Isot. 2023, 202, 111063. [Google Scholar] [CrossRef]
  25. Hinton, G.; Roweis, S. Stochastic Neighbor Embedding. In Advances in Neural Information Processing Systems; MIT Press: Cambridge, MA, USA, 2003; Volume 15, pp. 857–864. [Google Scholar]
  26. Baxter, M.J. Exploratory Multivariate Analysis in Archaeology; Percheron Press, a division of Eliot Werner Publications, Inc.: Clinton Corners, NY, USA, 2015. [Google Scholar]
  27. Carlson, D.L. Quantitative Methods in Archaeology Using R; University of Cambridge: Cambridge, UK, 2017. [Google Scholar]
  28. Badawy, W.M.; Dmitriev, A.Y.; Koval, V.Y.; Smirnova, V.S.; Chepurchenko, O.E.; Lobachev, V.V.; Belova, M.O.; Galushko, A.M. Formation of reference groups for archaeological pottery using neutron activation and multivariate statistical analyses. Archaeometry 2022, 64, 1377–1393. [Google Scholar] [CrossRef]
  29. Müllner, D. Modern hierarchical, agglomerative clustering algorithms. arXiv 2011. [CrossRef]
  30. Bar-Joseph, Z.; Gifford, D.K.; Jaakkola, T.S. Fast optimal leaf ordering for hierarchical clustering. Bioinformatics 2001, 17, S22–S29. [Google Scholar] [CrossRef] [PubMed]
  31. Badawy, W.; Elsenbawy, A.; Dmitriev, A.; El Samman, H.; Shcheglov, A.; El-Gamal, A.; Kamel, N.H.M.; Mekewi, M. Characterization of major and trace elements in coastal sediments along the Egyptian Mediterranean Sea. Mar. Pollut. Bull. 2022, 177, 113526. [Google Scholar] [CrossRef] [PubMed]
  32. Badawy, W.M.; Duliu, O.G.; El Samman, H.; El-Taher, A.; Frontasyeva, M.V. A review of major and trace elements in Nile River and Western Red Sea sediments: An approach of geochemistry, pollution, and associated hazards. Appl. Radiat. Isot. 2021, 170, 109595. [Google Scholar] [CrossRef] [PubMed]
  33. Gelman, A.; Carlin, J.B.; Stern, H.S.; Dunson, D.B.; Vehtari, A.; Rubin, D.B. Bayesian Data Analysis; Chapman and Hall/CRC: Boca Raton, FL, USA, 2013. [Google Scholar]
  34. Lunn, D.J.; Spiegelhalter, D.J.; Thomas, A.; Best, N. The BUGS project: Evolution, critique and future directions. Stat. Med. 2009, 28, 3049–3067. [Google Scholar] [CrossRef]
  35. Plummer, M. JAGS: A Program for Analysis of Bayesian Graphical Models Using Gibbs Sampling. In Proceedings of the Third International Workshop on ‘Distributed Statistical Computing’ (DSC 2003), Vienna, Austria, 20–22 March 2003; Technische Universität Wien: Vienna, Austria, 2003. [Google Scholar]
  36. Kruschke, J.K. Bayesian estimation supersedes the t test. J. Exp. Psychol. Gen. 2013, 142, 573–603. [Google Scholar] [CrossRef]
  37. Park, J.H.; Quinn, K.; Martin, A. MCMCpack: Markov chain Monte Carlo in R. J. Stat. Softw. 2011, 42, 1–21. [Google Scholar] [CrossRef]
  38. Plummer, M.; Best, N.; Cowles, K.; Vines, K. Output Analysis and Diagnostics for MCMC (CODA). R News 2006, 6, 7–11. [Google Scholar]
  39. Kamanina, I.Z.; Badawy, W.M.; Kaplina, S.P.; Makarov, O.A.; Mamikhin, S.V. Assessment of Soil Potentially Toxic Metal Pollution in Kolchugino Town, Russia: Characteristics and Pollution. Land 2023, 12, 439. [Google Scholar] [CrossRef]
  40. Abrahim, G.M.S.; Parker, R.J. Assessment of heavy metal enrichment factors and the degree of contamination in marine sediments from Tamaki Estuary, Auckland, New Zealand. Environ. Monit. Assess. 2008, 136, 227–238. [Google Scholar] [CrossRef]
  41. Lv, J.; Liu, Y.; Zhang, Z.; Zhou, R.; Zhu, Y. Distinguishing anthropogenic and natural sources of trace elements in soils undergoing recent 10-year rapid urbanization: A case of Donggang, Eastern China. Environ. Sci. Pollut. Res. 2015, 22, 10539–10550. [Google Scholar] [CrossRef] [PubMed]
  42. Reimann, C.; de Caritat, P. Distinguishing between natural and anthropogenic sources for elements in the environment: Regional geochemical surveys versus enrichment factors. Sci. Total Environ. 2005, 337, 91–107. [Google Scholar] [CrossRef] [PubMed]
  43. Ergin, M.; Saydam, C.; Baştürk, Ö.; Erdem, E.; Yörük, R. Heavy metal concentrations in surface sediments from the two coastal inlets (Golden Horn Estuary and İzmit Bay) of the northeastern Sea of Marmara. Chem. Geol. 1991, 91, 269–285. [Google Scholar] [CrossRef]
  44. Chen, C.W.; Kao, C.M.; Chen, C.F.; Di Dong, C. Distribution and accumulation of heavy metals in the sediments of Kaohsiung Harbor, Taiwan. Chemosphere 2007, 66, 1431–1440. [Google Scholar] [CrossRef]
  45. Varol, M. Assessment of heavy metal contamination in sediments of the Tigris River (Turkey) using pollution indices and multivariate statistical techniques. J. Hazard. Mater. 2011, 195, 355–364. [Google Scholar] [CrossRef]
  46. Andreev, D.N.; Dzyuba, E.A. Total soil heavy metal contamination in various biotops at the territory of Vishersky reserve. Gen. Biol. 2016, 64, 5. [Google Scholar]
  47. Shaykhutdinova, A.N. Assessment of the degree of contamination agricultural soils Kuzbass mobile forms of heavy metals. In Proceedings of the V International Scientific Conference Dedicated to the 85th Anniversary of the Department of Soil Science and Soil Ecology of TSU, Tomsk, Russia, 10 August 2015; p. 5. [Google Scholar]
  48. Saet, Y.E.; Revich, B.A.; Yanin, E.P.; Smirnova, R.S.; Basharkevich, I.L.; Onishchenko, T.L.; Pavlova, L.N.; Trefilova, N.Y.; Achkasov, A.I.; Sarkisyan, S.S. Geochemistry of the Environment; Nedra: Moscow, Russia, 1990. [Google Scholar]
  49. Rudnick, R.L.; Gao, S. Composition of the Continental Crust. In Treatise on Geochemistry; Turekian, K.K., Ed.; Elsevier: Oxford, UK, 2014; pp. 1–51. [Google Scholar]
  50. Hair, J.F.; Sarstedt, M.; Pieper, T.M.; Ringle, C.M. The use of partial least squares structural equation modeling in strategic management research: A review of past practices and recommendations for future applications. Long Range Plan. 2012, 45, 320–340. [Google Scholar] [CrossRef]
  51. Zhou, X.; Chen, Q.; Liu, C.; Fang, Y. Using moss to assess airborne heavy metal pollution in Taizhou, China. Int. J. Environ. Res. Public Health 2017, 14, 430. [Google Scholar] [CrossRef] [PubMed]
  52. Taylor, S.R.; McLennan, S.M. The Continental Crust: Its Composition and Evolution; Blackwell Scientific Publications: Oxford, UK, 1985; p. 312. [Google Scholar]
  53. Fowler, A.D.; Doig, R. The significance of europium anomalies in the REE spectra of granites and pegmatites, Mont Laurier, Quebec. Geochim. Cosmochim. Acta 1983, 47, 1131–1137. [Google Scholar] [CrossRef]
  54. Rudnick, R.L.; Gao, S. Composition of the continental crust. Treatise Geochem. 2003, 3, 1–64. [Google Scholar] [CrossRef]
  55. Viers, J.; Dupre, B.; Gaillardet, G. Chemical composition of suspended sediments in World Rivers: New insights from a new database. Sci. Total Environ. 2009, 407, 853–868. [Google Scholar] [CrossRef]
  56. Gromet, L.P.; Haskin, L.A.; Korotev, R.L.; Dymek, R.F. The “North American shale composite”: Its compilation, major and trace element characteristics. Geochim. Cosmochim. Acta 1984, 48, 2469–2482. [Google Scholar] [CrossRef]
  57. Bhatia, M.R.; Crook, K.A.W. Trace element characteristics of graywackes and tectonic setting discrimination of sedimentary basins. Contrib. Mineral. Petrol. 1986, 92, 181–193. [Google Scholar] [CrossRef]
  58. Kowalska, J.B.; Mazurek, R.; Gąsiorek, M.; Zaleski, T. Pollution indices as useful tools for the comprehensive evaluation of the degree of soil contamination–A review. Environ. Geochem. Health 2018, 40, 2395–2420. [Google Scholar] [CrossRef] [PubMed]
  59. Ranjbarzadeh, R.; Caputo, A.; Tirkolaee, E.B.; Jafarzadeh Ghoushchi, S.; Bendechache, M. Brain tumor segmentation of MRI images: A comprehensive review on the application of artificial intelligence tools. Comput. Biol. Med. 2023, 152, 106405. [Google Scholar] [CrossRef] [PubMed]
  60. Nielsen, F. Hierarchical Clustering. In Introduction to HPC with MPI for Data Science; Nielsen, F., Ed.; Springer International Publishing: Cham, Switzerland, 2016; pp. 195–211. [Google Scholar]
  61. Davies, D.L.; Bouldin, D.W. A Cluster Separation Measure. IEEE Trans. Pattern Anal. Mach. 1979, PAMI-1, 224–227. [Google Scholar] [CrossRef]
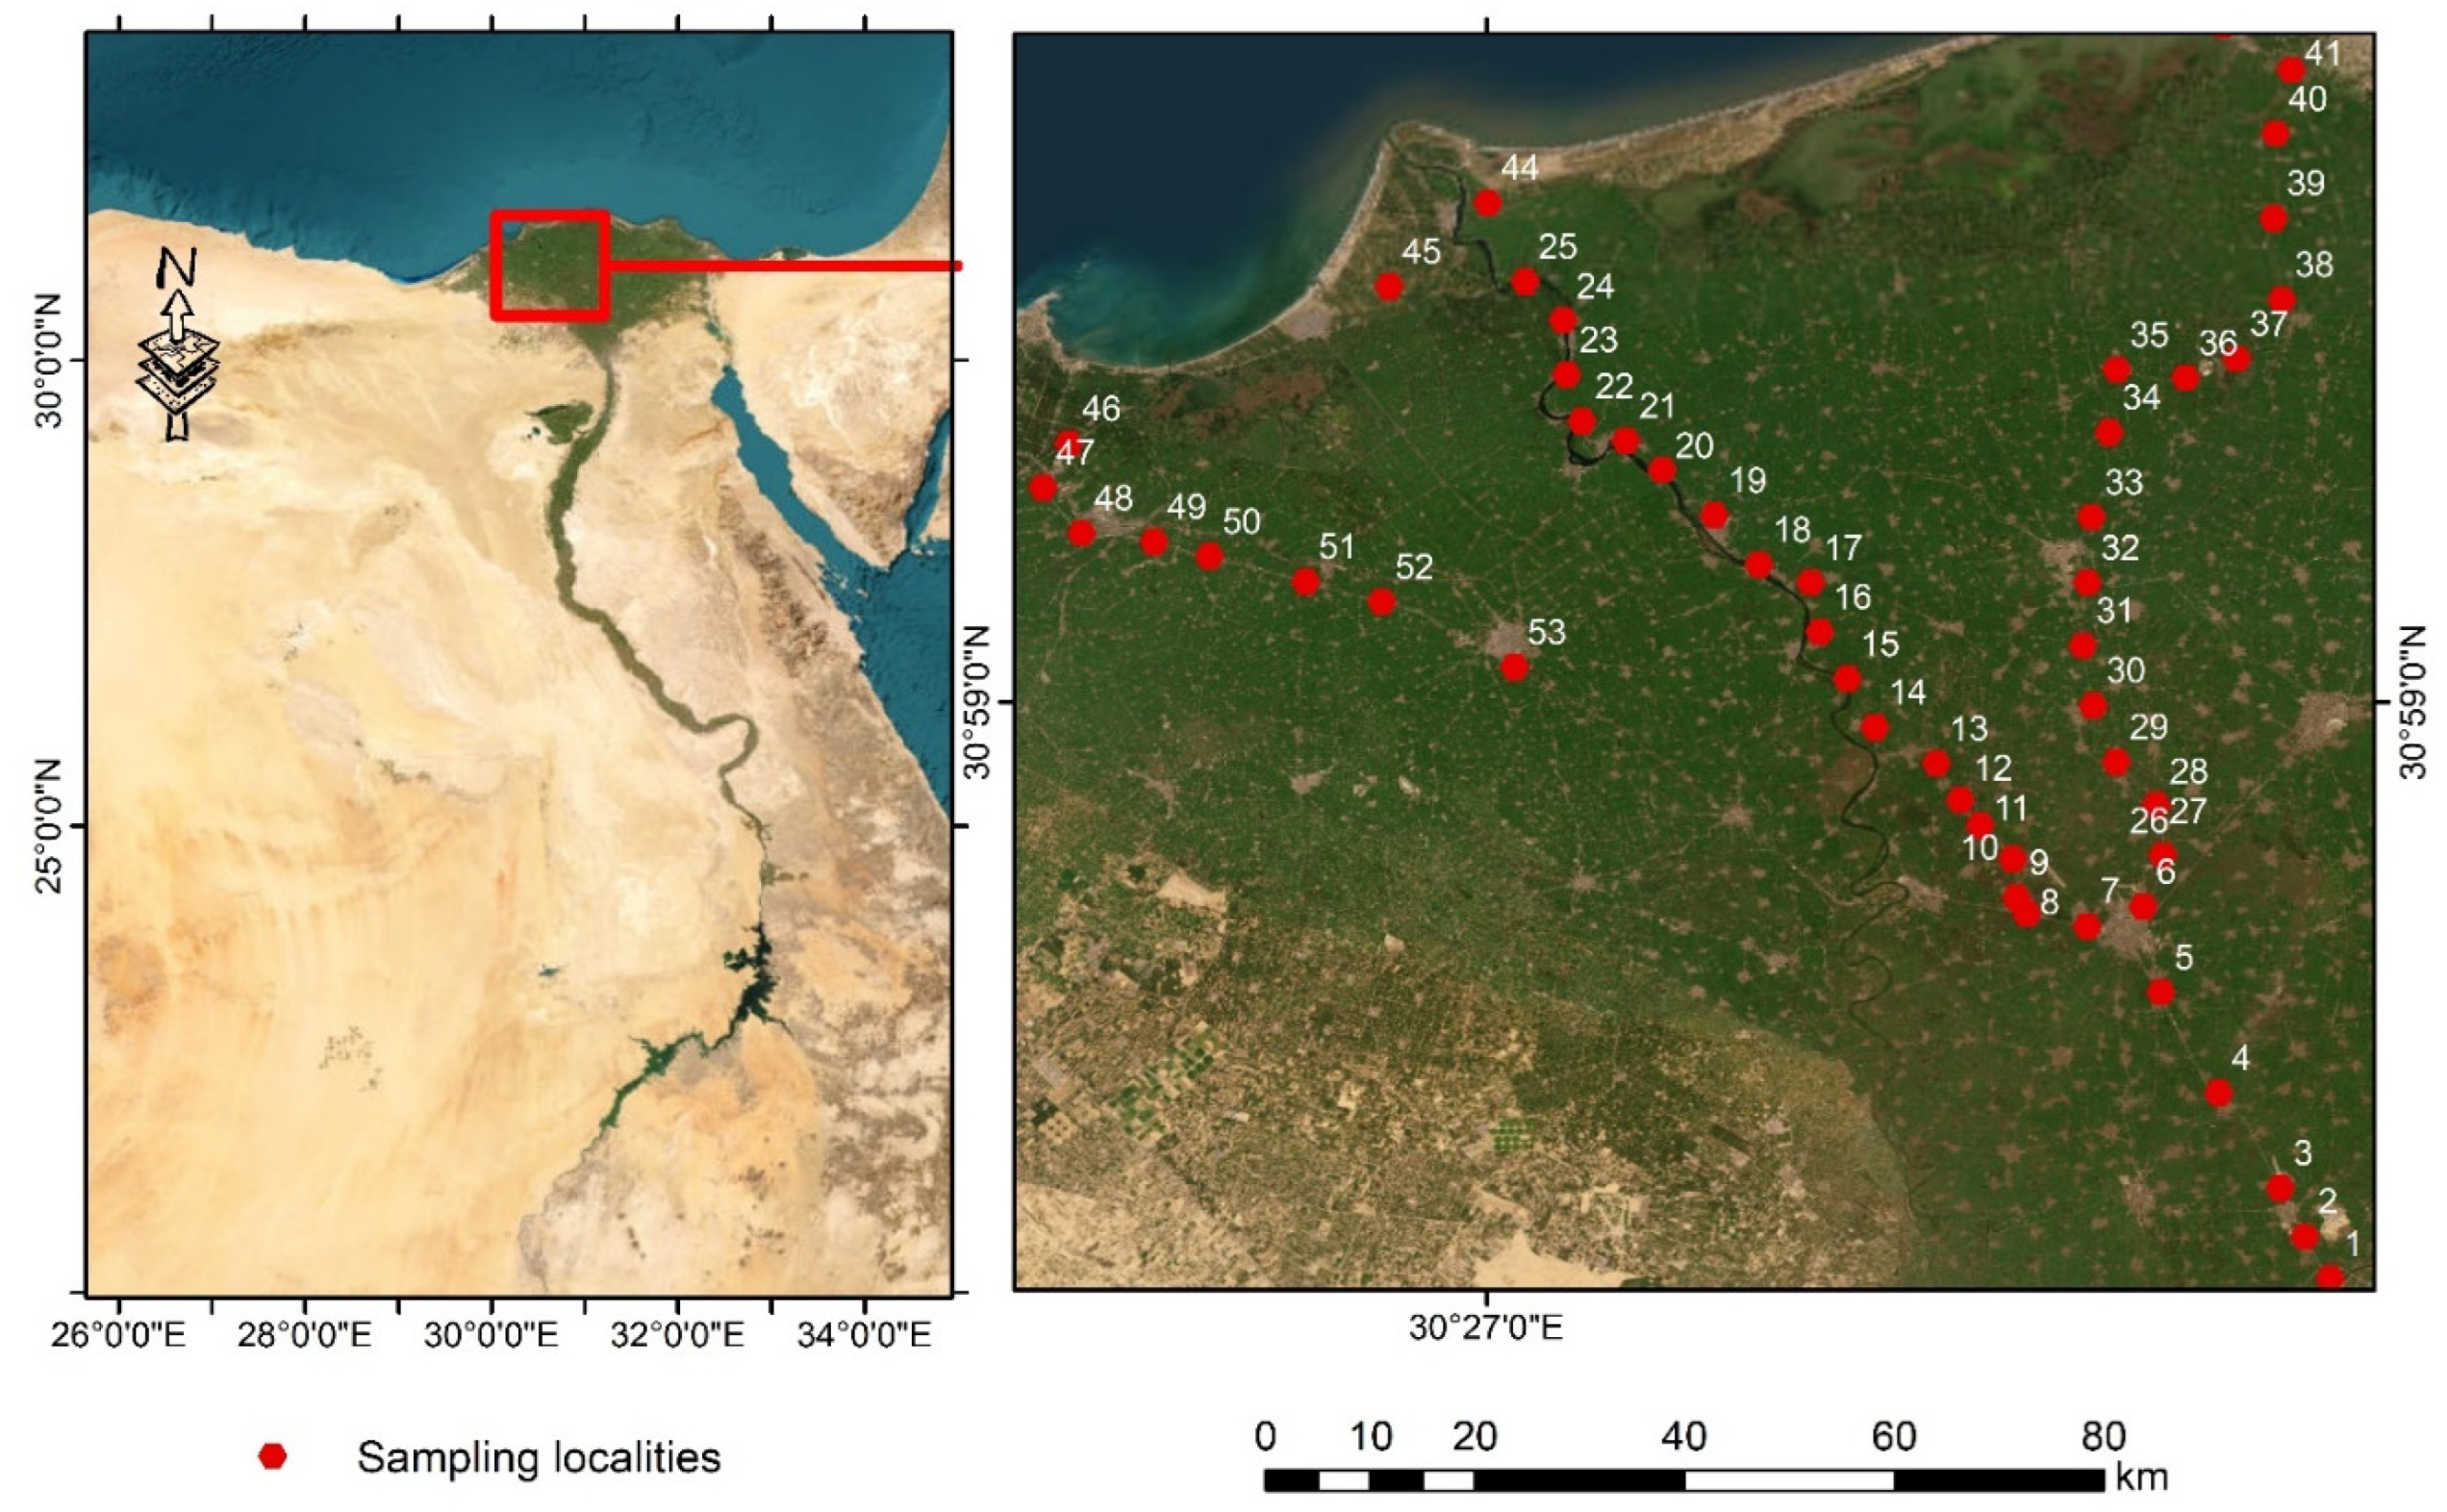
Figure 1. A map showing the sampling locations of the soil.
Environments 12 00289 g001
Figure 2. Boxplot shows the main descriptive statistical patterns of the determined elements in the soil samples.
Environments 12 00289 g002
Figure 3. A plot shows the distribution patterns of the rare earth elements normalized to UCC, PAAS, and Chondrites.
Environments 12 00289 g003
Figure 4. Ternary diagram shows the relationship between (A) La/10–Y/15–Nb/8 and (B) Th–La-Sc [57].
Environments 12 00289 g004
Figure 5. Biplot shows the ratio indicators of Zr/Sc vs. Th/Sc for the studied soil compared with the corresponding values from the literature.
Environments 12 00289 g005
Figure 6. Distribution patterns of Th and U in the soil samples compared with the literature (A) Th/U vs U and (B) Th vs U. The dashed red line stands for normalization.
Environments 12 00289 g006
Figure 7. Biplot shows the relationship between immobile trace elements, Co vs. Th.
Environments 12 00289 g007
Figure 8. Boxplot shows the logarithmic values of the single pollution index SPI.
Environments 12 00289 g008
Figure 9. Hierarchical cluster analysis of the soil samples.
Environments 12 00289 g009
Figure 10. Hierarchical agglomerative clustering based on PCA.
Environments 12 00289 g010
Figure 11. Hierarchical agglomerative clustering based on t–SNE.
Environments 12 00289 g011
Table 1. Descriptive statistics of the studied soil samples from Nile Delta River. The mass fractions of the elements are provided in mg/kg and compared with upper continental crust (UCC) by Rudnick and Gao [49].
ElementMean ± SEMedian ± MAD *Min–MaxCV%SkewnessKurtosisW-Staticp-ValueUCCElementMean ± SEMedian ± MAD *Min–MaxCV%SkewnessKurtosisW-Staticp-ValueUCC
Li14.1 ± 0.40713.7 ± 1.67–23.820.30.5271.910.9610.10124Cd0.237 ± 0.0080.2 ± 00.2–0.422.30.974−0.1970.6450.0000.09
Be1.32 ± 0.0331.3 ± 0.10.7–1.717.4−0.516−0.0540.9570.0742.1Sn3.12 ± 0.1323 ± 0.41.5–7.229.72.287.820.7870.0002.1
Na7850 ± 1727980 ± 7074260–10,50015.4−0.5040.8170.9730.31724,258.57Sb0.396 ± 0.0210.4 ± 0.10.2–137.526.070.7750.0000.4
Mg17,700 ± 29118,000 ± 128013,300–24,10011.5−0.0070.9230.950.03614,953.85Cs1.23 ± 0.0311.2 ± 0.10.6–1.717.9−0.3740.4510.9690.2224.9
Al74,100 ± 165077,200 ± 561038,000–91,20015.6−1.140.8520.9020.00181,510.71Ba365 ± 8.11379 ± 37.7223–45315.5−0.644−0.1190.9570.070628
Si245,000 ± 2640241,000 ± 10,100221,000–309,0007.561.613.110.8570.000311,405.14La27.6 ± 0.63528.9 ± 318.1–34.716.1−0.452−0.7650.9490.03431
P1260 ± 611160 ± 169707–328033.82.428.580.7950.000654.57Ce62.4 ± 1.2963.8 ± 5.540.8–78.814.4−0.399−0.3930.9710.26263
K9840 ± 1779760 ± 8887840–12,70012.60.46−0.4550.9680.19523,244.16Pr6.62 ± 0.1386.8 ± 0.64.3–8.114.6−0.495−0.3490.9580.0777.1
Ca40,000 ± 186035,700 ± 402024,200–80,10032.71.752.450.7810.00025,657.49Nd30.2 ± 0.67731.2 ± 3.319.5–38.815.7−0.372−0.3710.970.24027
Sc20.7 ± 0.57221.8 ± 2.210.8–26.719.3−0.9260.2350.9150.00214Sm6.46 ± 0.1496.6 ± 0.64.1–8.216.2−0.427−0.3030.9610.1014.7
Ti9460 ± 2739570 ± 11604390–12,30020.2−0.8120.2720.9350.0093835.79Eu1.71 ± 0.041.8 ± 0.21.1–2.216.5−0.445−0.2780.9560.0631
V157 ± 3.72164 ± 11.883.9–20016.6−1.160.7720.890.00097Gd6.01 ± 0.1376.2 ± 0.63.8–7.616−0.426−0.4080.9640.1324
Cr116 ± 2.11120 ± 770.7–13512.7−1.341.390.8670.00092Tb0.857 ± 0.020.9 ± 0.10.6–1.116−0.372−0.4330.9170.0020.7
Mn1040 ± 26.41060 ± 112536–150017.8−0.3510.3430.9790.538774.46Dy4.96 ± 0.1175.1 ± 0.53.1–6.416.5−0.434−0.3710.9620.1113.9
Fe63,300 ± 149065,900 ± 585036,300–77,70016.4−0.9870.2550.9080.00139,175.06Ho0.896 ± 0.020.9 ± 0.10.6–1.215.6−0.342−0.0570.9350.0090.83
Co22.3 ± 0.61923 ± 2.611.6–28.819.4−0.638−0.0240.9490.03217.3Er2.39 ± 0.0592.4 ± 0.31.5–3.117.2−0.392−0.4570.9650.1542.3
Ni75.5 ± 2.1679.4 ± 5.939.1–11620−0.6020.8360.9210.00347Tm0.359 ± 0.010.4 ± 00.2–0.518.8−0.9560.2960.7320.0000.3
Cu62.3 ± 1.4862.9 ± 3.732.3–82.516.6−0.8511.370.9160.00228Yb2.58 ± 0.0592.6 ± 0.31.7–3.316−0.313−0.4680.9590.0821.96
Zn93.8 ± 2.0891.8 ± 6.353.1–12315.5−0.2590.6220.9580.07767Lu0.367 ± 0.0080.4 ± 00.2–0.516.1−10.8010.7010.0000.31
Ga15.6 ± 0.43915.8 ± 2.17.4–20.819.7−0.548−0.0690.9670.18417.5Hf4.65 ± 0.1444.7 ± 0.72.2–6.621.6−0.175−0.4520.9840.7515.3
Ge1.33 ± 0.0321.3 ± 0.10.7–1.917.10.0230.5890.9650.1551.4Ta1.11 ± 0.0361.1 ± 0.20.6–1.622.4−0.108−0.6850.9660.1700.9
As2.99 ± 0.1032.9 ± 0.32.1–7.124.23.7519.40.6510.0004.8W0.68 ± 0.0250.6 ± 0.10.4–1.325.50.9751.950.9110.0011.9
Rb33.7 ± 0.733.9 ± 3.420.5–43.714.5−0.188−0.0090.990.95584Tl0.186 ± 0.0050.2 ± 00.1–0.219−2.042.170.4170.0000.9
Sr261 ± 10.9240 ± 16.8171–59429.22.577.180.6950.000320Pb14.1 ± 0.76612.7 ± 2.68.3–35.637.91.864.10.8220.00017
Y22.6 ± 0.56522.9 ± 2.814.3–29.317.5−0.296−0.5810.9650.15121Bi0.112 ± 0.0060.1 ± 00.1–0.334.73.310.70.3540.0000.16
Zr161 ± 4.99164 ± 21.376.8–22621.7−0.112−0.4880.9780.466193Th4.91 ± 0.1065 ± 0.52.7–6.515.1−0.4840.290.9780.46810.5
Nb17.5 ± 0.66916.9 ± 3.38.3–26.326.70.095−0.8480.9720.29012U1.31 ± 0.0251.3 ± 0.10.9–1.713.30.074−0.3520.9620.1132.7
Mo0.724 ± 0.0240.7 ± 0.10.4–122.8−0.089−0.680.950.0361.1
* MAD = median absolute deviation.
Table 2. The µ ± σ of the determined elements with and without outliers using Bayesian inference method.
Elementµ ± σ
with Outliers
µ ± σ
Without Outliers
UCCElementµ ± σ
with Outliers
µ ± σ
Without Outliers
UCC
Li13.3 ± 414.1 ± 2.924Cd0.2 ± 0.10.2 ± 0.10.09
Be1.2 ± 0.31.3 ± 0.22.1Sn2.9 ± 1.13.1 ± 12.1
Na7664.5 ± 1607.77851.2 ± 1237.424,258.57Sb0.4 ± 0.20.4 ± 0.20.4
Mg16,807.2 ± 3785.817,679.9 ± 2094.114,953.85Cs1.2 ± 0.31.2 ± 0.24.9
Al70,235.1 ± 17,993.774,059.1 ± 11,849.181,510.71Ba353.4 ± 74.5365.5 ± 58.3628
Si25,5903.7 ± 44,770.4244,630 ± 18,993.4311,405.14La26.3 ± 6.427.6 ± 4.631
P1211.5 ± 462.71263.4 ± 438.8654.57Ce59.5 ± 1462.4 ± 9.363
K9561.1 ± 1754.89837.9 ± 1276.523,244.16Pr6.3 ± 1.56.6 ± 17.1
Ca38,189 ± 14,395.439,952.4 ± 13,406.125,657.49Nd28.8 ± 6.930.2 ± 4.927
Sc19.6 ± 5.620.7 ± 4.114Sm6.1 ± 1.56.5 ± 1.14.7
Ti8998.2 ± 25619463.1 ± 1960.83835.79Eu1.6 ± 0.41.7 ± 0.31
V148.2 ± 41.1157 ± 26.897Gd5.7 ± 1.46 ± 14
Cr111.6 ± 22.9116.2 ± 15.192Tb0.8 ± 0.20.9 ± 0.10.7
Mn988.3 ± 262.21039.9 ± 190774.46Dy4.7 ± 1.25 ± 0.83.9
Fe59,670.8 ± 16,718.863,318.3 ± 10,687.539,175.06Ho0.9 ± 0.20.9 ± 0.10.83
Co21 ± 6.422.3 ± 4.517.3Er2.3 ± 0.62.4 ± 0.42.3
Ni71 ± 22.275.5 ± 15.547Tm0.3 ± 0.10.4 ± 0.10.3
Cu59.1 ± 15.862.3 ± 10.728Yb2.5 ± 0.62.6 ± 0.41.96
Zn88.8 ± 2393.8 ± 1567Lu0.3 ± 0.10.4 ± 0.10.31
Ga14.7 ± 4.415.6 ± 3.217.5Hf4.4 ± 1.44.6 ± 15.3
Ge1.3 ± 0.31.3 ± 0.21.4Ta1.1 ± 0.31.1 ± 0.30.9
As2.8 ± 0.93 ± 0.74.8W0.6 ± 0.20.7 ± 0.21.9
Rb32.1 ± 7.733.7 ± 584Tl0.2 ± 00.2 ± 00.9
Sr251.6 ± 84.2261.4 ± 78.5320Pb13.5 ± 5.814.1 ± 5.517
Y21.5 ± 5.722.6 ± 4.121Bi0.1 ± 00.1 ± 00.16
Zr151.8 ± 48.5161.2 ± 35.8193Th4.7 ± 1.14.9 ± 0.810.5
Nb16.5 ± 5.917.5 ± 4.812U1.2 ± 0.31.3 ± 0.22.7
Mo0.7 ± 0.20.7 ± 0.21.1
Disclaimer/Publisher’s Note: The statements, opinions and data contained in all publications are solely those of the individual author(s) and contributor(s) and not of MDPI and/or the editor(s). MDPI and/or the editor(s) disclaim responsibility for any injury to people or property resulting from any ideas, methods, instructions or products referred to in the content.