Article

Infrasound-Altered Pollination in a Common Western North American Plant: Evidence from Wind Turbines and Railways

1
Wyoming Natural Diversity Database, University of Wyoming, Laramie, WY 82071, USA
2
Department of Zoology and Physiology, University of Wyoming, Laramie, WY 82071, USA
3
Program in Ecology and Evolution, University of Wyoming, Laramie, WY 82071, USA
*
Author to whom correspondence should be addressed.
Environments 2025, 12(8), 266; https://doi.org/10.3390/environments12080266 (registering DOI)
Submission received: 1 July 2025 / Revised: 28 July 2025 / Accepted: 28 July 2025 / Published: 31 July 2025

Abstract

Anthropogenic noise can have diverse effects on natural ecosystems, but less is known about the degree to which noise can alter organisms in comparison to other disturbances. A variety of frequencies are produced by man-made objects, ranging from high to low frequencies, and we studied infrasound (<20 Hz) produced by wind turbines and trains. We estimated the number, mass and viability of seeds produced by flowers of Plains pricklypear (Opuntia polyacantha Haw.) that were left open to pollinators, hand-pollinated or bagged to exclude pollinators. Each pollination treatment was applied to plants at varying distances from wind turbines and railways (≤25 km). Self-pollinated Opuntia polyacantha and plants within the wind facility produced ≥1.6 times more seeds in the bagged treatments compared to more distant sites. Seed mass and the percent of viable seeds decreased with distance from infrasound. Viability of seeds was >70% for most treatments and sites. If wind facilities, railways and other man-made structures produce infrasound that increases self-pollination, crops and native plants near sources may produce heavier seeds with higher viability in the absence of pollinators, but genetic diversity of plants may decline due to decreased cross-pollination.

1. Introduction

Land development (e.g., energy, infrastructure, urban, agricultural) alters ecosystems through a variety of mechanisms including building structures, adding artificial light and removing vegetation, but sound produced by anthropogenic structures is less studied, e.g., [1,2,3]. The degree to which anthropogenic noise alters ecosystems is less known and likely depends on the frequencies produced ranging from high (6–8 kHz) to low (<500 Hz) [4]. Infrasound, which is below the audible threshold of human hearing, can originate from natural and anthropogenic sources, e.g., [5,6]. Elephants and whales communicate over long distances using infrasound [7,8], and earthquakes and ocean waves generate infrasound [9,10]. Infrasound is also produced by man-made objects such as bridges [11], vehicles [12], railways [13], power stations [10] and wind turbines [6,11,14]. The long wavelengths of infrasound can travel long distances through the ground (20–90 km) [15,16], but the degree to which they alter organisms has seldom been studied [3,17].
Man-made structures that produce infrasound are common on the landscape, but infrasound is infrequently measured due to the specialized equipment needed [18]. Railways and wind turbines are two common structures that produce infrasound. The established routes of railways have transported goods across continents since the 1800s and most studies focused on mortality of vertebrate wildlife; however, few investigated sounds produced by railways [19,20]. Far more work has been done on the ecological effects of roads compared to railways resulting in a knowledge gap [21]. Conversely, wind power is growing rapidly across the planet and we are only beginning to understand how these structures interact with the environment [3,22]. Turbines reduce wind speed, which increases precipitation, temperature and evaporation ≤20 km downwind (wake effects) [23,24,25,26,27] regardless of wind facility size [24]. Wake effects could alter plant fitness and community structure [28]. Almost nothing is known about the interaction of plants and wind facilities, but we do know that construction removes native communities and increases the potential of invasive species [29]. Despite the growth of wind facilities globally, we are aware of only one study that measured seed-set for 9 forbs ≤29 km from turbines and discovered that self-pollination decreased with distance from turbines [17]. Wind power is an appealing source of renewable energy due to emitting much less carbon into the atmosphere and more research should investigate methods to make wind energy and biota thrive in unison.
A growing body of research revealed diverse ecological effects of sound on animals [30], and most studies investigated livestock and few studies investigated plants [31]. Generally, noise can increase secretion of hormones and heart rate and reduce livestock production, but responses likely depend on intensity [30,32]. Birds such as Dupont’s lark (Chersophilus duponti) altered their vocalizations when exposed to turbine noise, possibly to avoid being masked by similar frequencies [33]. Swans, geese and ducks avoided wind facilities [34], and female sage-grouse choose nesting and brooding sites ≥8 km away from wind turbines [35]. Additionally, infrasound from wind turbines may affect human health, causing sleep disturbance and headaches [36,37]. Low-frequency noise created by wind turbines increased stress in burrowing badgers (Meles meles) and decreased the density of earthworms [38,39]. Plants, such as crops, can also respond to noise, including producing higher yields when exposed to long durations of high-decibel, low-frequency noise [40]. Plants can respond to infrasound; plants have evolved to react to external stimuli (e.g., buzzing bees, chewing insects), which can trigger the release of pollen. For example, plants with concealed anthers released nectar [41] or firmly attached pollen grains [42] when exposed to vibrations produced by pollinating insects. Bees emit 165–196 Hz vibrations while pollinating [43], frequencies that are also generated by man-made structures such as operating wind turbines [44]. Honeybees traveled towards vibrations ≥10 Hz [45,46], demonstrating the need for further studies.
Synergy between plants and pollinators is well established, but nothing is known about how railway or wind facility noise may factor into their mutualism. Most plants rely on pollinating insects to distribute pollen and produce seeds, but some plants can self-pollinate in the absence of pollinators, producing seeds without receiving pollen from other plants [47]. While selfing is common among plants, the number, size and viability of seeds produced this way greatly varies [48]. Self-pollination may compensate for seed production when plants are pollen-limited (i.e., do not receive adequate quantity or quality of pollen); however, inadequate cross-pollination reduces long-term viability of plant populations, altering their distribution, abundance [49] and genetics [50]. Wind energy development can have negative [51], positive [52] or no effects [53] on plant communities depending on the location and species, but rare, endemic or imperiled species are typically less abundant in developed areas [28]. Studies have mainly addressed how railway verges change plant communities, but we are not aware of any studies investigating the extent to which sound from railways alter plants [21]. Turbines and railways are often sited in croplands [54] and natural areas [55] that produce food for humans and wildlife. Estimating how man-made noise affects pollinators is critical, especially given the global decline in many bee and butterfly species [56].
Noise levels vary among sources and depend on environmental characteristics. Pressure levels of sound are measured on the decibel scale and are weighted based on the intensity of frequencies audible to humans (A-weighting; dB(A) or dBA; logarithmic scale). Noise levels 100 m from turbines, 10 m above ground level at wind speeds of 5–7 m/s are ~50 dBA [57]. The noise levels 30 m from a railroad vary between 75 and 95 dBA, excluding horns. Noise intensity experienced by an animal or plant is influenced by the topography and meteorological conditions of a site and many produced sounds are below the range of human hearing. Unfortunately, measurements of insect noise are not weighted the same way, making comparisons of noise levels between insects and anthropogenic sources difficult.
We established five sites that varied in distance to wind turbines or railroad tracks to estimate the degree to which infrasound affected plant seed-set. We studied a native plant common in the western US, Plains pricklypear (Opuntia polyacantha Haw.). Our specific questions were (1) Does self-pollination decrease with distance from infrasound? and (2) Does seed viability shift with distance from infrasound? Opuntia species are capable of self-pollination [58,59], but this usually results in fewer, mostly non-viable seeds [60]. Results will inform farmers and resource managers about seed production and pollination near sources of infrasound.

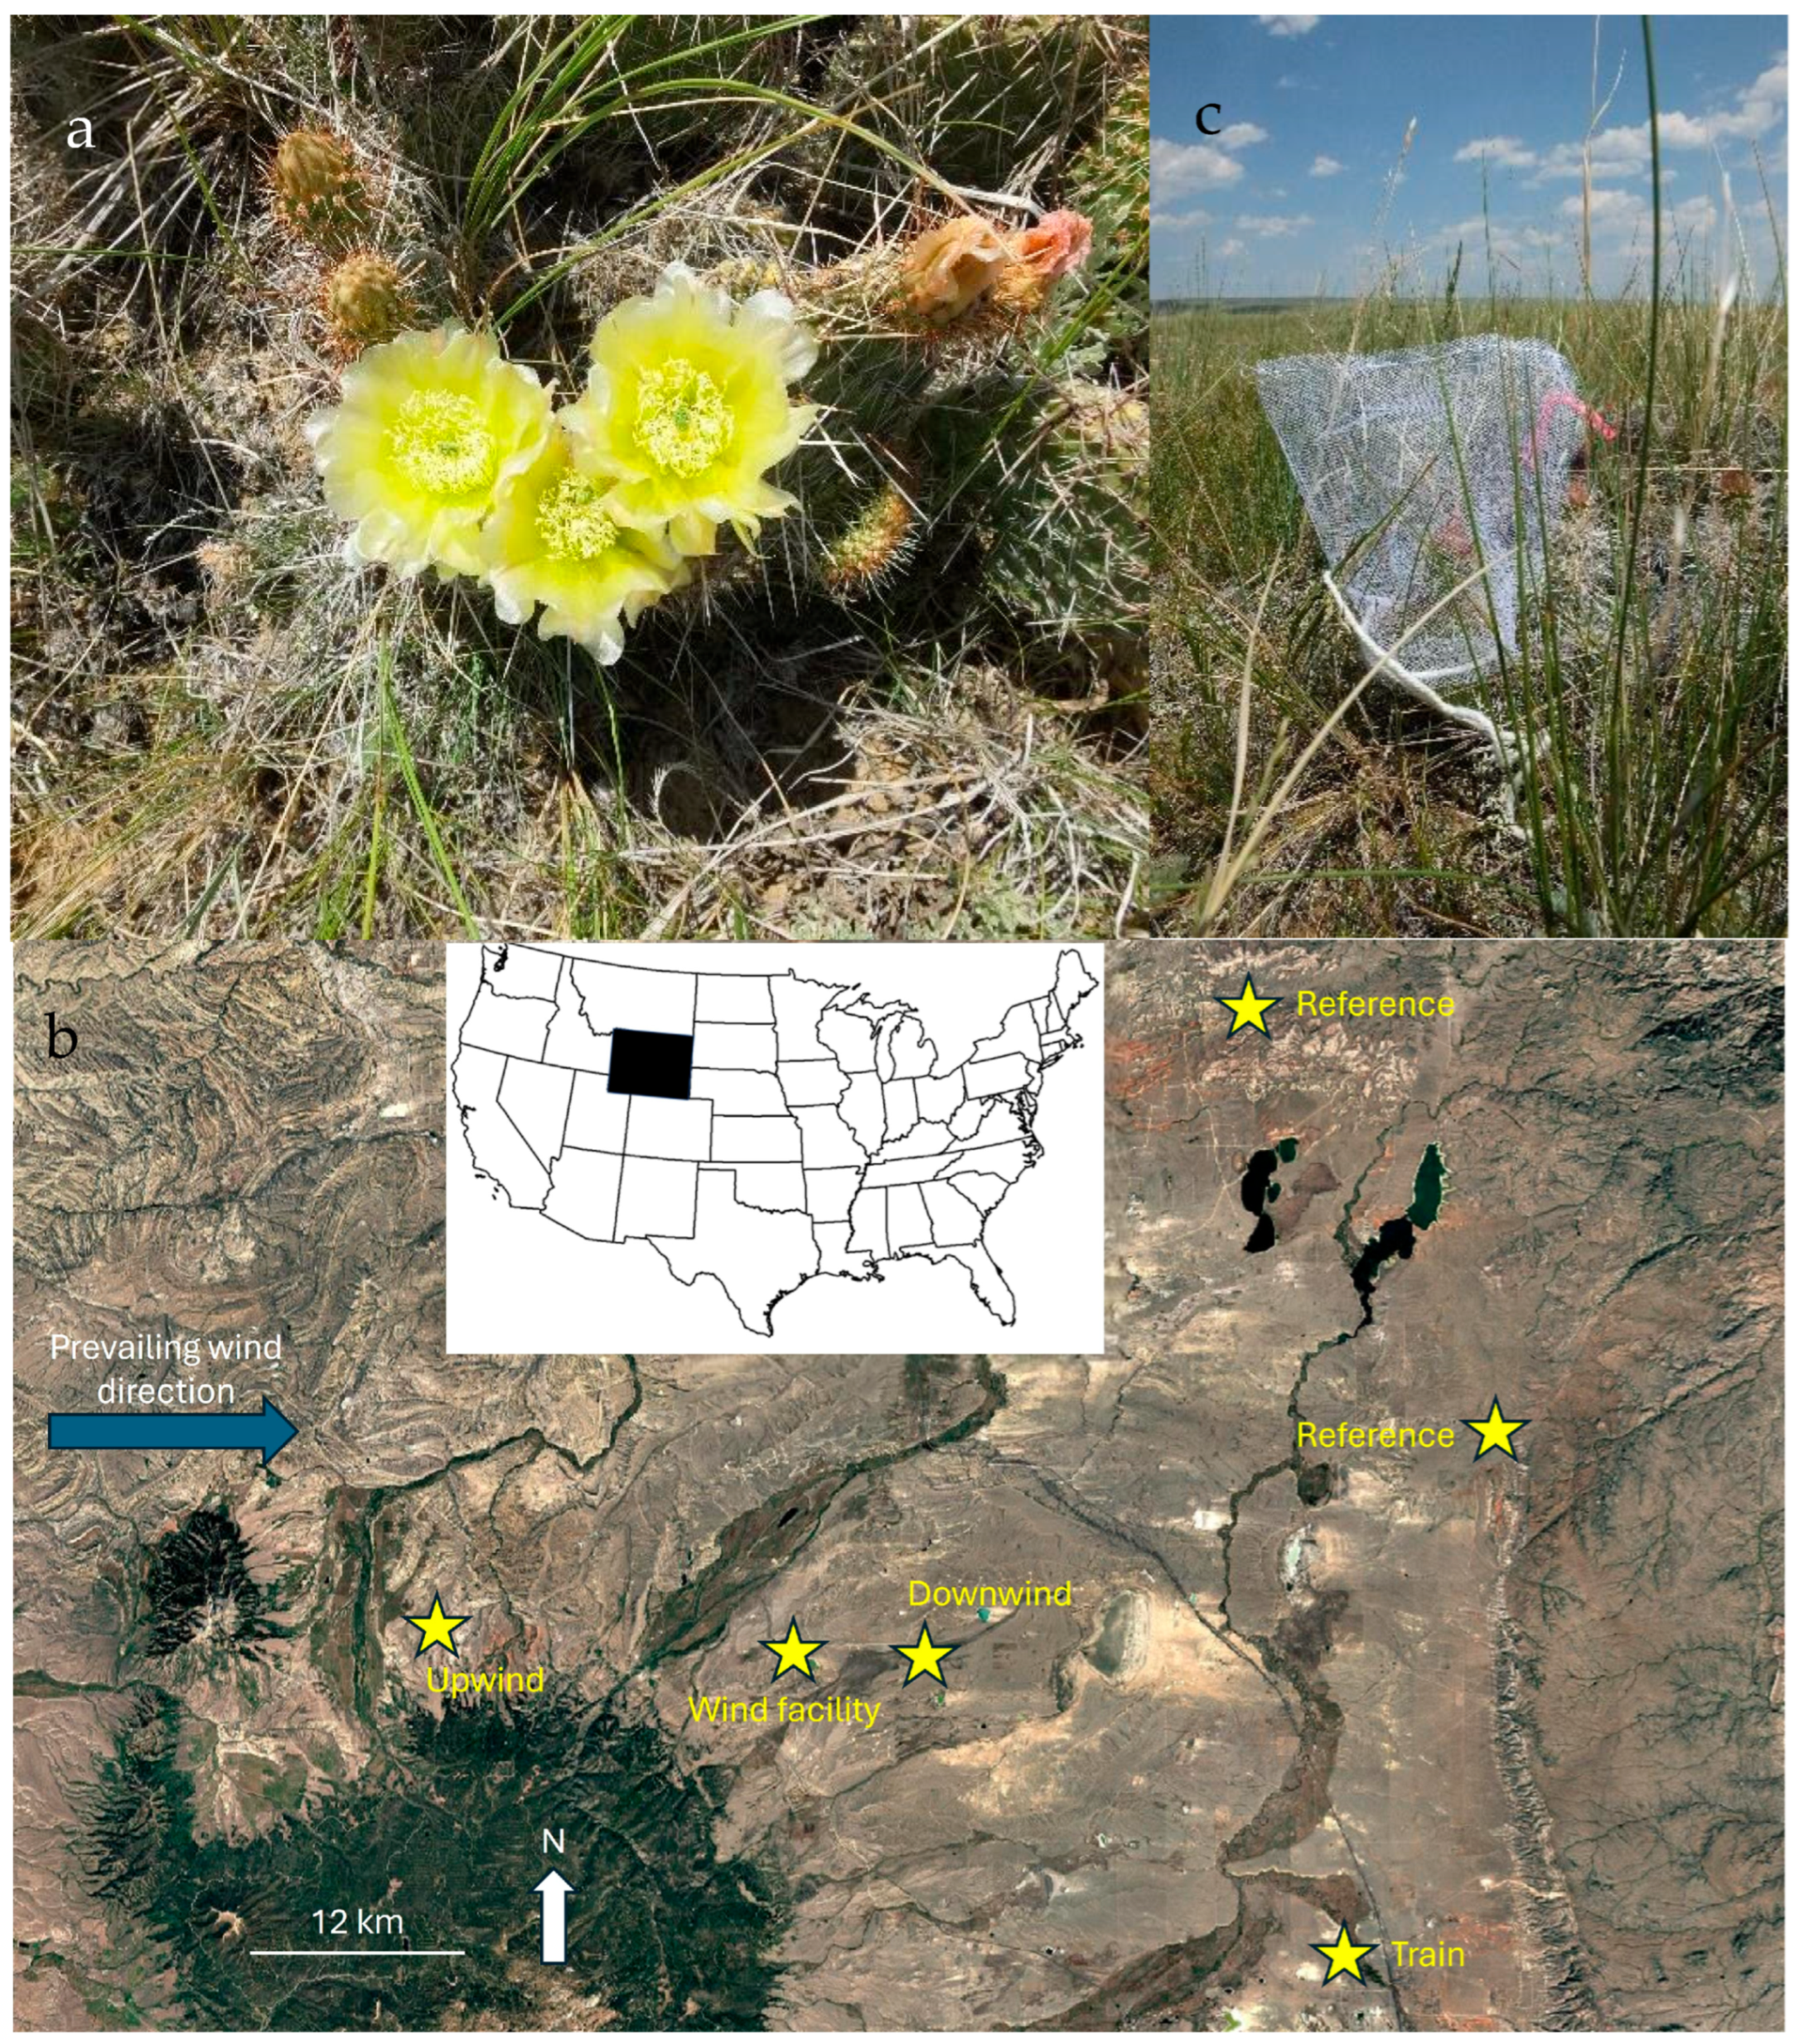
2. Materials and Methods
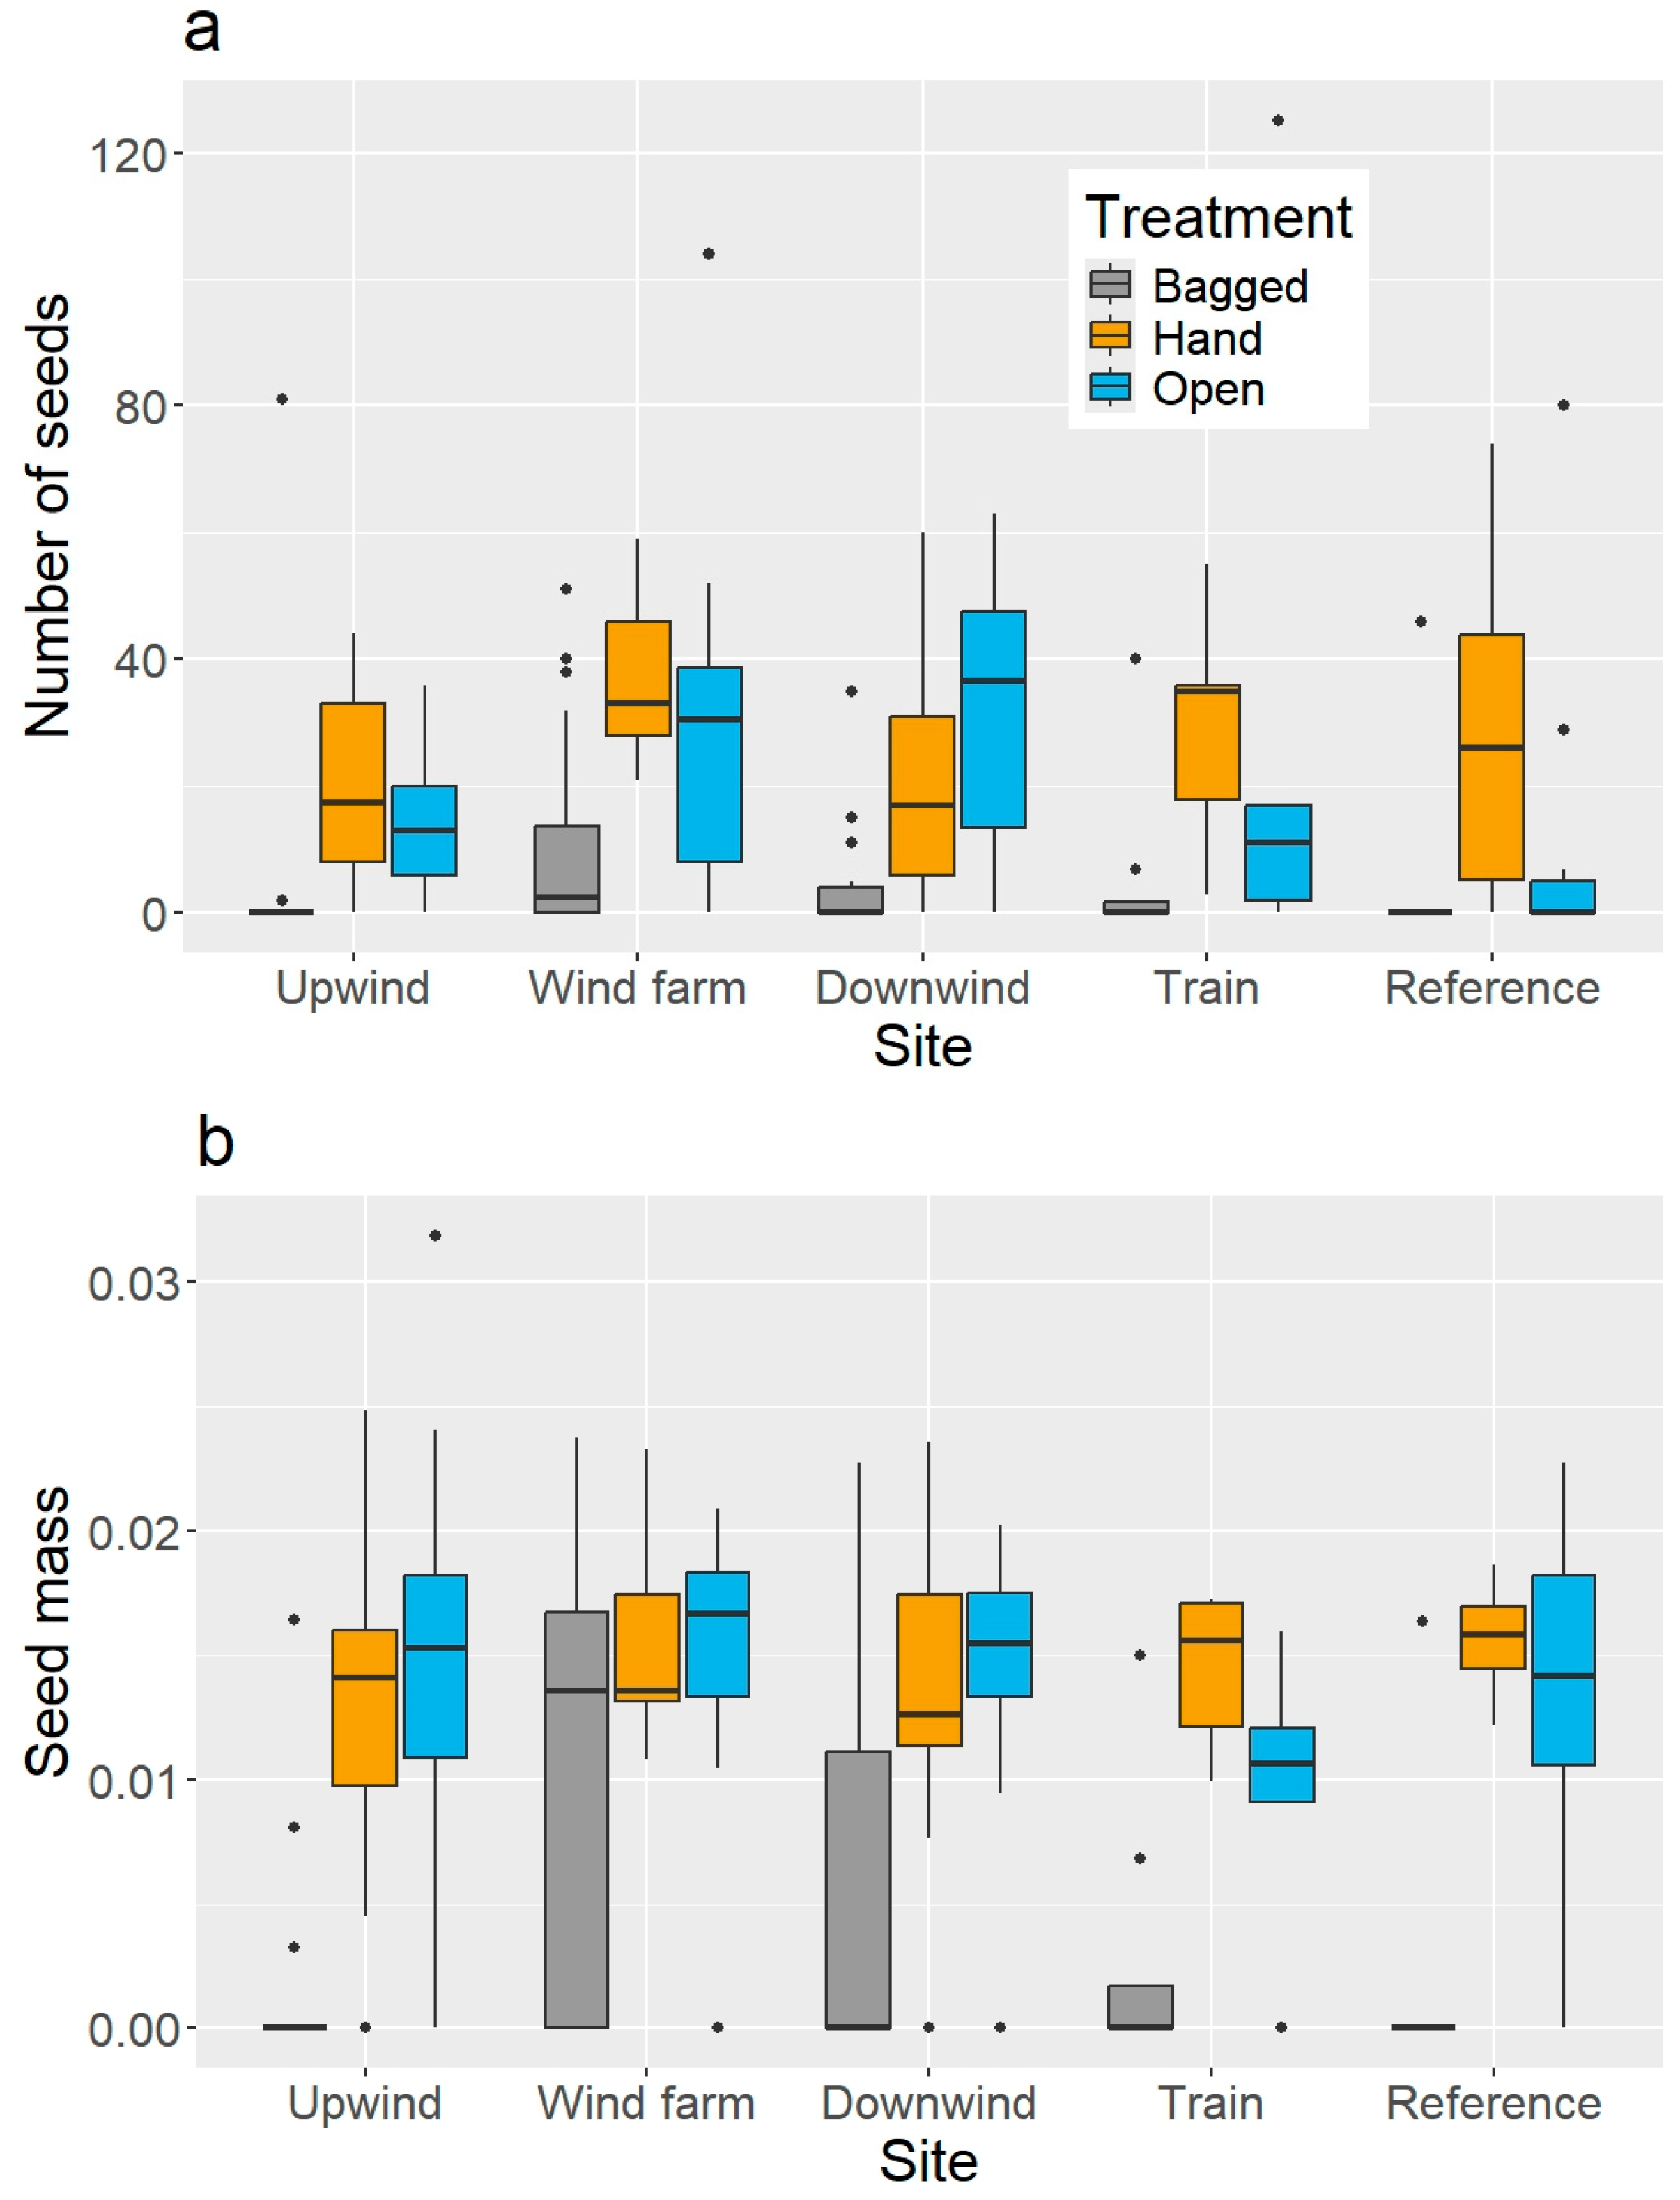
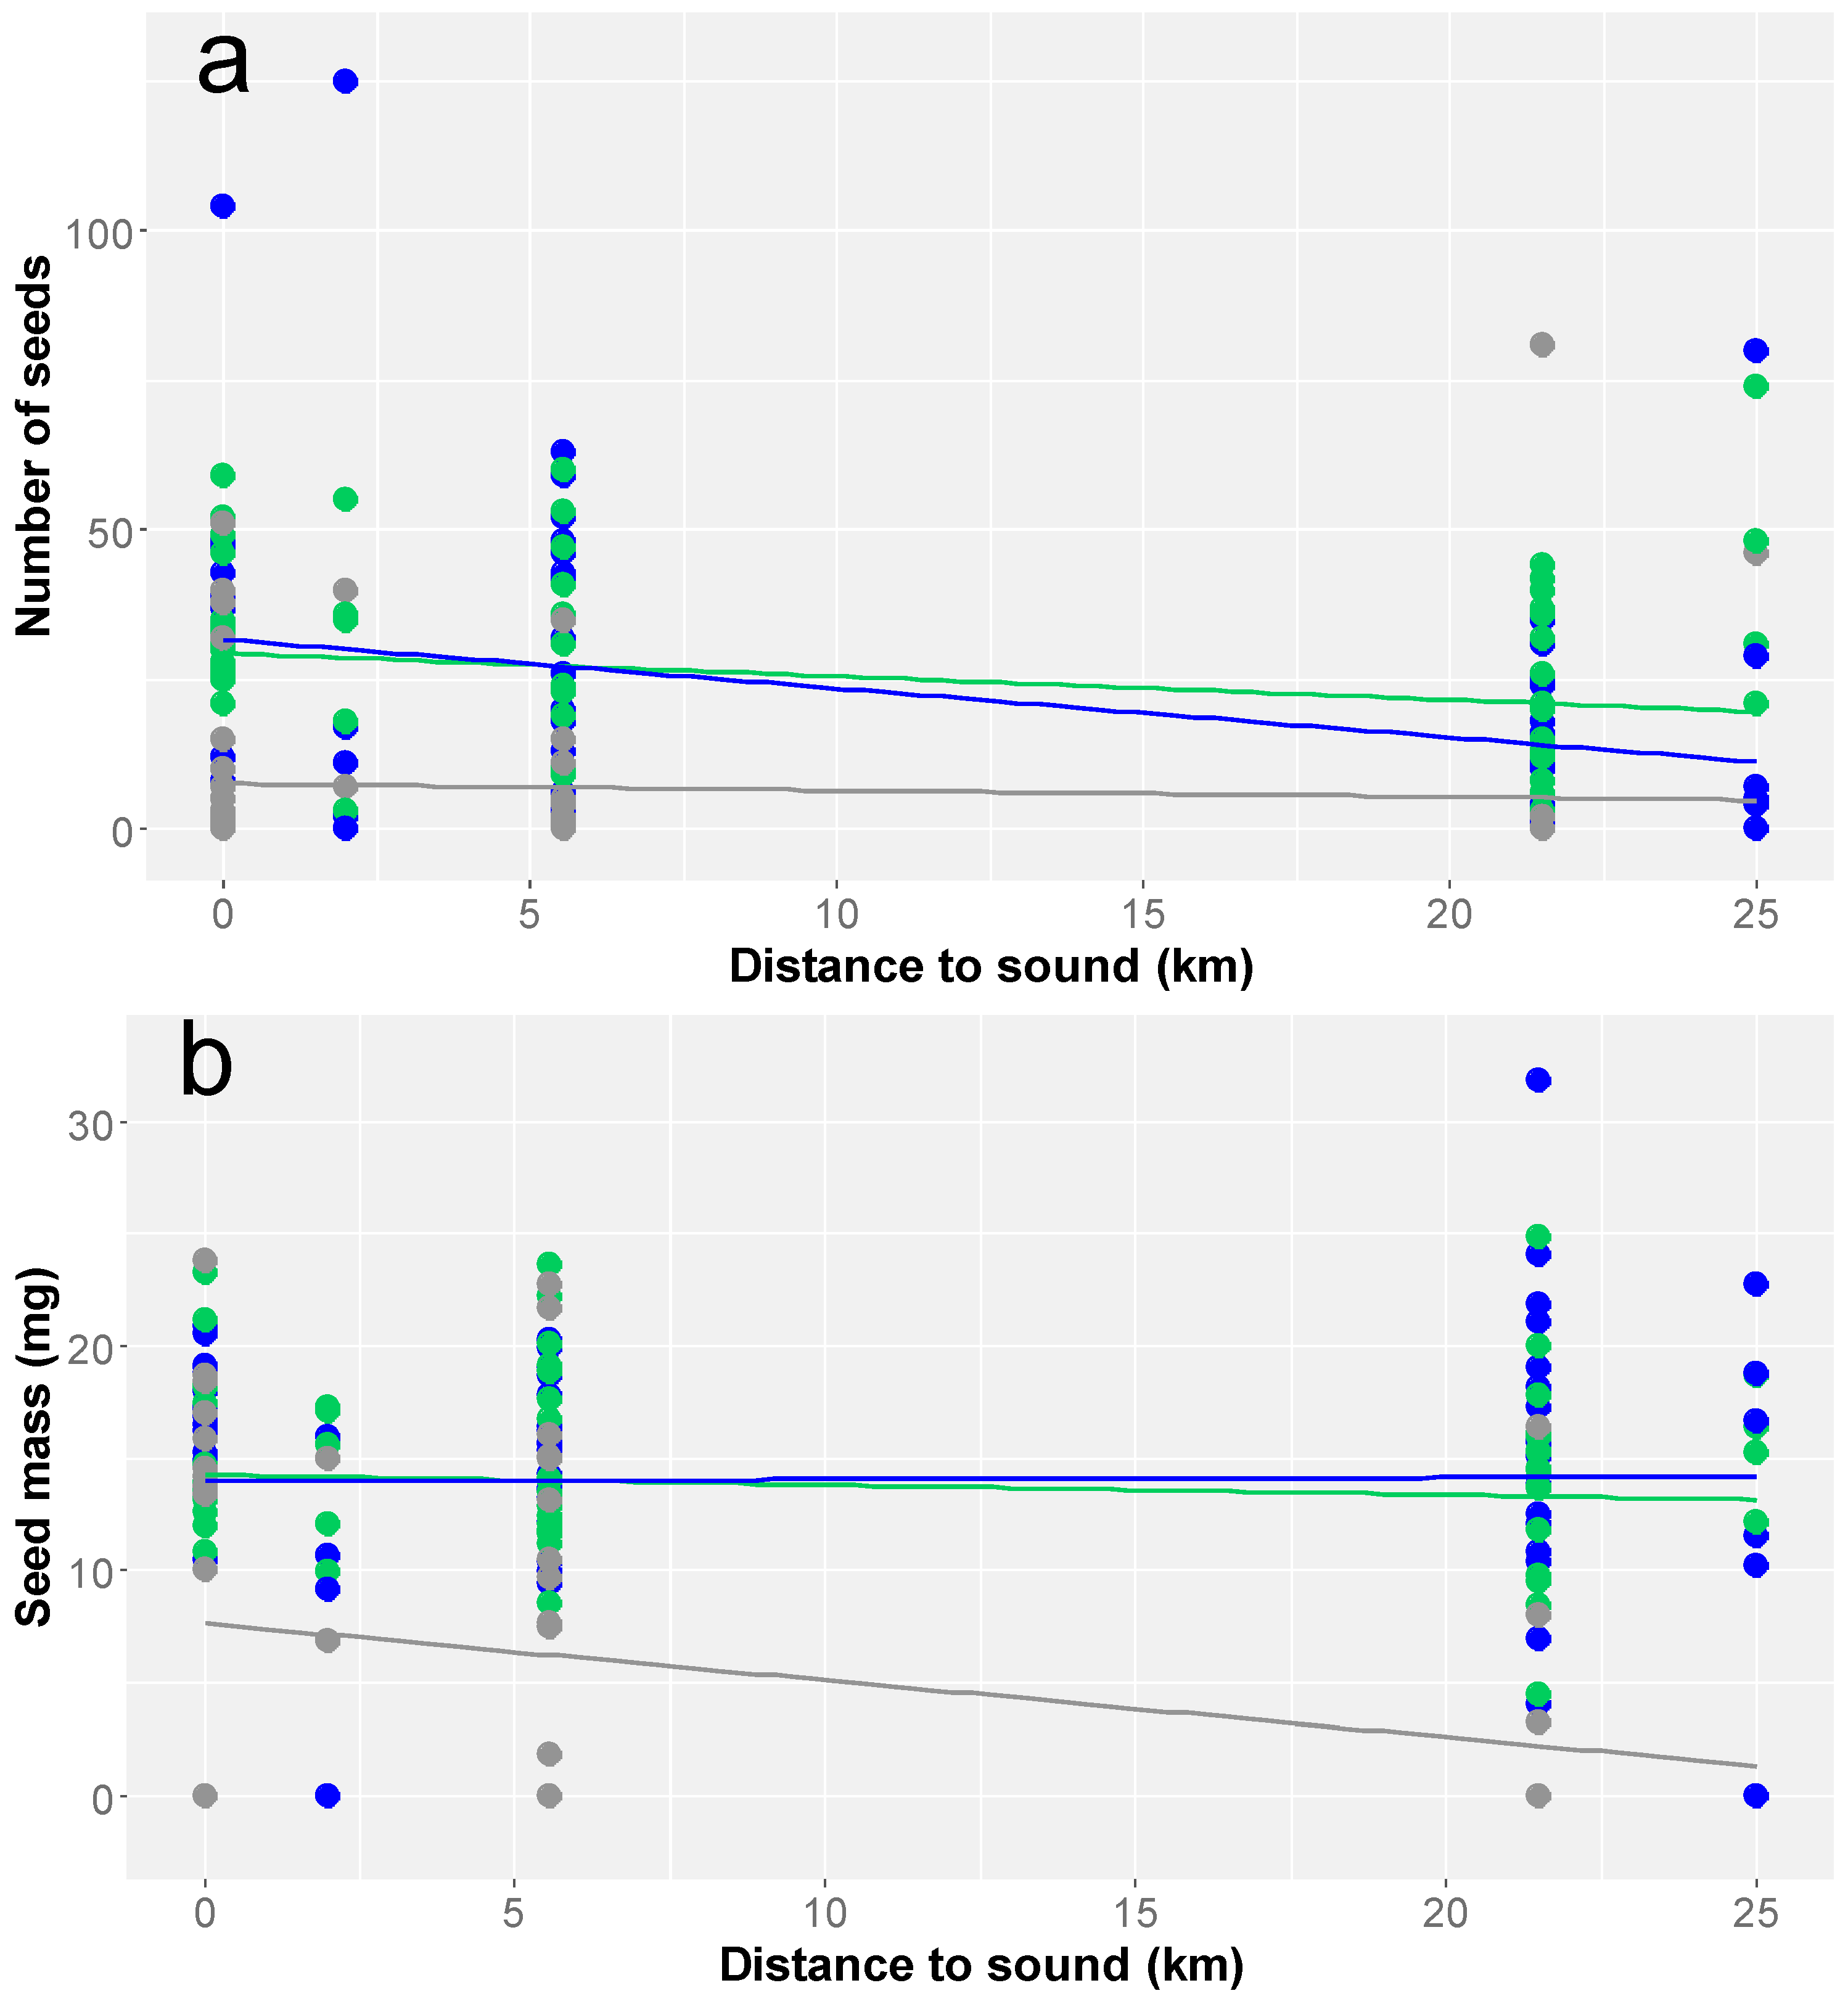
We investigated seed-set of Plains pricklypear (Figure 1a) at five sites in southern Wyoming, United States, to measure seed production at varying distances from an active wind facility and railways to measure the degree to which infrasound affects pollen transfer. We worked at three sites near an operating wind facility with 66 turbines capable of producing 99 MW of power in 2016. Winds primary blows out of the west, southwest and south (decreasing order). The upwind site was 21.5 km west of turbines, the wind facility site was amongst active turbines and the downwind site was 4.5 to 6.6 km east of the wind facility. We measured the seed-set at a site 2 km from active an active railway where 45–60 trains passed daily and two reference sites >20 km from a source of infrasound (e.g., railways, wind facilities, towns and major roads) in 2020. All sites were selected based on their similar landscape characteristics to the wind facility, which was located in sagebrush steppe and received ~30–36 cm of precipitation annually [61,62].
Opuntia polyacantha is a native perennial cactus distributed throughout western North America that thrives in dry shrublands, often in conjunction with sagebrush (Artemesia sp.) and rabbitbrush (Chrysothamnus sp.) [63]. The low-forming plant (≤1 m in height) produces ~5 to 9 cm diameter yellow, pink or violet flowers that flower for one day [60]. Fruits are ~2.5 to 5 cm long capsules that dry and split, releasing seeds. Opuntia polyacantha can self-pollinate, potentially due to the thigmonastic stamens [59], but selfing can result in lower seed production [60]. We chose this species because it was abundant at all sites and is common in western North America, including areas being developed for renewable energy and railways. Opuntia flowers are used by a variety of bees, including some species that specialize in their flowers. We observed flowering O. polyacantha from early June to late July and seed maturation ended in late August.
Opuntia polyacantha flowers at each site were divided among three treatments during late June to estimate the degree to which distance from infrasound may alter pollination (n = 225 plants total). We selected ≥20 individuals for each treatment and at each site to measure seed production. Bags with 1 mm mesh were placed over flower buds prior to flowering for the bagged treatment (Figure 1b), which stopped most pollinators from visiting. The seed-set in the bagged treatment was due to self-pollination. Once petals dropped, bags were removed to minimize effects of bags on subsequent seed development. Flowers in the open treatment were chosen on fair weather days to ensure pollination. We assumed flowers that opened on stormy days (e.g., cooler temperatures and precipitation) had lower insect visitation. Flowers were labeled for tracking but otherwise unmanipulated and were indicative of the seed-set under natural pollination. Visiting pollinators and selfing were responsible for most seed-sets in the open treatment. Excess pollen measured the seed-set when pollen was not limited in the hand-pollinated flowers. Pollen was gathered from plants ≥50 m away to minimize potential genetic similarity. Pollen was collected using a cotton swab with most of the cotton removed to reduce disturbance to the flowers’ anthers and to maximize pollen collection. Fresh pollen was applied 10 times to the stigma. Hand-pollinated and open treatments were not bagged after flowers dried, which resulted in some treatments being lost due to fruits bursting. Across all treatments, we selected individual plants with one flower on the paddle. Each flower was marked with a string around the base and flagged. We monitored the treatments twice a week from late June to August. We harvested fruits during August and dried them at 35 °C for at least a week before extracting seeds. We counted and massed seeds from individual fruits to the nearest 0.01 mg. We divided the mass of all seeds by the number of seeds massed to calculate average seed mass per fruit. Seeds were analyzed for viability using Tetrazolium staining [64]. Seeds were cut in half, submerged in a 1% tetrazolium solution and left for 24 h. Respiring seeds turned red and non-viable seeds remained white.
We estimated differences among treatments and with distance to infrasound using generalized linear mixed-effects models to estimate the degree to which sound from wind turbines and railways altered seed-set. We estimated how treatment, distance and source of infrasound altered the number of seeds, the mass of seeds and the percent of viable seeds produced. The data were not normally distributed so we inspected histograms and used the fitdistrplus package [65] in Program R [66] to find which distribution best represented the data. We used the negative binomial distribution for seed count (mixed_model; Package GLMMadaptive) [67], the gamma distribution for seed mass (glm; Package lme4) [68] and the quasipoisson for the proportion of viable seeds (glmmPQL; Package Mass) [69]. We included treatment, distance to source (i.e., turbines or railway) and source of sound (turbine, railway or none for reference site) as fixed effects and site as a random effect. We did not include site as a random effect for seed mass because site explained little variance in the model. Generalized linear mixed-effects models produce values for each level of a categorical variable (e.g., treatment) and we reported the range of t-values and p-values for each level. We estimated differences among treatments using the estimated marginal means (emmeans) package [70] to calculate which treatments differed (α ≤ 0.05). Data were summarized using the plyer package [71].

3. Results

More seeds were produced by flowers in the open and hand-pollinated treatments than the bagged treatment (Table 1; Figure 2a; emmeans, p < 0.0001) showing that outcrossing increased seed-set. The number of seeds did not differ between the open and hand-pollinated treatments, suggesting that O. polyacantha was not pollen-limited at our sites (Figure 2a; emmeans, p = 0.81). More than 1.6 times more seeds were produced in the bagged treatment and ≥1.2 times more seeds were produced in the hand-pollinated treatment within the wind facility compared to more distant sites. The number of seeds produced in the open and hand-pollinated treatments decreased with distance from infrasound (Table 1; Figure 3a), but the source of infrasound did not matter (Figure 2a; emmeans, p > 0.90).
Seed mass in the bagged treatment decreased with distance from infrasound (Table 1; Figure 3b), and seed mass was lower when sound originated from railways (Figure 2b; emmeans, p = 0.05). Flowers in the bagged treatment produced lighter seeds than the hand-pollinated and open treatments (Figure 2b; emmeans, p < 0.0001). Opuntia polyacantha was not pollen-limited; the mass of seeds in the open and hand-pollinated treatments did not differ (Figure 2b; emmeans, p = 1).
The percent of viable seeds produced in the bagged treatment was lower than those in the hand-pollinated and open treatments (Figure 2c). In fact, >90% of seeds were viable in the hand-pollinated and open treatments, and 71% were viable in the bagged treatment on average. Distance to the source of infrasound (Figure 3c; Table 1) and the source of infrasound did not explain the variation in the percent of viable seeds (Figure 2c; emmeans, p ≥ 0.86). A lower percent of viable seeds were produced in the bagged treatment compared to the hand-pollinated and open treatments (Figure 2c; emmeans, p ≤ 0.002). The percent of viable seeds in the open and hand-pollinated treatments did not differ (emmeans, p = 0.57), further suggesting that pollen was not limiting O. polyacantha at our sites.
Sites differed from one another but the proximity to turbines or railways was the most obvious difference among them. Vegetation structure and climate were similar among sites at least partially due to their close proximity (62 km distance between farthest sites). The upwind site was within a wildlife habitat management area that lacked livestock grazing, but livestock grazing occurred at different intensities within the wind facility, downwind, railway and reference sites. Road use was low at the downwind, reference and railway sites, and we noticed more traffic at the other sites. Infrasound is produced by many man-made structures; however, we were able to minimize other sources due to the remoteness of our sites. We were unable to measure infrasound directly because we lacked the specialized equipment to do so and understanding how quickly infrasound dissipated would help us interpret our results. Unfortunately, we are not aware of any studies that measured infrasound at longer distances from sources and we imagine that this varies based on several factors, including topography, soil type, soil state (e.g., frozen) and source type (e.g., wind turbine, building, bridge or railway).

4. Discussion

Previous studies found that Opuntia species can self-pollinate [17,58,59]; however, self-pollination resulted in limited, mostly non-viable seeds [60]. Conversely, our study found that self-pollinating O. polyacantha near a wind facility or railway produced heavier seeds and a higher percentage of viable seeds than plants more distant from sources of infrasound when pollinators were excluded from flowers. Infrastructure development can reduce biodiversity [72,73] and biomass of local vegetation [27,51], but few studies investigated the degree to which infrasound produced by man-made structures may affect plants [29]. Our results suggest that infrasound induced self-pollination in O. polyacantha, but more research is needed to understand this phenomenon. Vibrations from operating wind turbines, railways, bridges and other anthropogenic sources may mimic those produced by pollinating insects or influence selfing through other mechanisms, potentially increasing the success of self-pollination. If man-made noise induces self-pollination in a variety of native plants, these plants will produce seeds as pollinators decline, but the genetic diversity of plants will likely decline due to reduced outcrossing.
More seeds were produced near sources of infrasound in the bagged treatment potentially due to sound. Sites more distant from wind facilities and railways agreed with the previous literature where few seeds were produced [60]; however, our results within the wind facility contrasted. Climate and currents are altered ≤20 km downwind of turbines [74], so we originally hypothesized that wake effects would alter seed-set at the downwind site. Thus, we originally designed the study to measure seed-set upwind and downwind of active turbines. Increased precipitation and temperature can cause plants to produce more flowers, increasing their chance of successfully self-pollinating [75]. We concluded that wake effects were not primarily responsible for the higher self-pollination within the wind facility, because we are not aware of any mechanism where increased turbulence and more moderate temperatures could increase seed-set in the bagged treatment. Furthermore, we expected the downwind site to show a stronger response if wake effects were responsible, but we measured the largest effects within the wind facility instead. We also did not observe plants producing more flowers. To test the hypothesis that low frequency sound altered self-pollination in plants, we measured seed-set near an active railway, lessening support for wake effects. The number (negative slope for all treatments) and mass of seeds (self-pollinated treatment only) produced at sites near wind turbines or railways was higher than at sites farther from sources of infrasound, suggesting that low frequency sounds can alter pollination in O. polyacantha and potentially other species.
Infrasound from railways, wind facilities and potentially other sources (e.g., bridges, roads, airports, etc.) may aid O. polyacantha in self-pollination. In our study, infrasound mainly appeared to aid self-pollination, but much more research is needed. Seed quality was always better in the outcrossed treatments (i.e., open and hand-pollinated), indicating that pollinators enhanced seed-set. However, in the absence of pollinators, O. polyacantha produced heavier seeds and a higher percentage of viable seeds near sources of infrasound, and this phenomenon has only been investigated for nine plant species [17]. Infrasound has been measured ≤90 km from turbines during calm conditions (i.e., no wind), but ≤20 km from turbines on days that are windy [15]. Newer turbines are taller and may produce larger amplitudes of low frequency sound than the shorter turbines measured in this study; however, we are not aware of any studies that compared them. Our study area was typically windy (~7 m/s) and we hypothesized that infrasound was minimal at the reference site on most days. Additionally, we observed lighter seeds and fewer viable seeds produced in the bagged treatment downwind, suggesting that infrasound dissipated ~5.5 km away but still affected seed production. Interestingly, plants near passing trains also produced more seeds through self-pollination but fewer seeds than at the wind facility or downwind, which may be at least partially explained by the 2 km distance from the tracks. Wind turbines run continuously during optimal conditions, but 45–60 trains passed by our site daily, making sound from railways more intermittent. Plants likely respond to infrasound, because they react to sounds by growing towards a specific frequency [31], by producing additional chemical defenses when exposed to the sound of chewing insects [76] or by producing more nectar [41]. We hope that our study encourages others to consider and investigate the degree to which infrasound interacts with plants and wildlife.
Opuntia polyacantha likely senses sound and vibrations produced by wind facilities and railways. Common among the Opuntia genus, O. polyacantha has 450–600 thigmonastic stamens that perceive touch or vibration normally induced by specialized pollinators [59,77]. When movement is detected, the anthers pack tightly around the stigma. Vibrations from turbines or railways may cause O. polyacantha to move their anthers inward and rub pollen onto the stigma thereby self-pollinating. Future studies may estimate the frequency and amplitude needed to trigger this response. As non-mobile organisms, plants use external stimuli like vibrations to induce the release of pollen. Higher amplitudes, which translate to more energetic vibrations, can release pollen in plants [78]. Certain structures of plants can attenuate some sound frequencies while transmitting others [78]. Attentionally, sounds attenuate more quickly when they are higher frequency [78]. For example, the petals of Oenothera drummondi responded to frequencies produced by bees and hawkmoths by physically vibrating [41]. Most Oenothera species are visited by a variety of bees, suggesting that these plants are receptive to many vibration frequencies. Most of the audible noise produced by turbines is in the low-frequency band (20–2000 Hz) [57], which overlaps with the range of pollinator wing beat frequencies (50–1000 Hz) [41]. If audible frequencies produced by man-made structures [44] are similar to insect wing beats, they may vibrate petals while infrasound may cause O. polyacantha anthers to move toward the stigma and self-pollinate.

5. Conclusions

Wind facilities, railways and other man-made structures that emit infrasound are commonly built in agricultural and natural settings and may enhance seed production in crops and native forbs. The response of O. polyacantha to infrasound may be larger because of their thigmonastic stamen, but infrasound enhanced self-pollination in other plants [17]. Additionally, the behavior of pollinators may change in response to infrasound. Plants that excel at transmitting sound waves may be affected to a larger degree [79]. If self-pollination is generally enhanced by infrasound, crops and native plants near sources may produce heavier seeds and a higher percentage of viable seeds even as pollinators decline [80]. Opuntia and other cactus species primarily rely on larger bee pollinators such as Melissodes and Bombus to transport pollen [60]. Larger bees (e.g., Bombus) have the highest proportion of species in decline globally [56]; thus, the potential for increased pollen-limitation and self-pollination may be imminent [47]. Self-pollination may be common with infrasound, but we are not aware of any studies that have measured it. Consequently, plant genetic diversity may decline due to decreased cross-pollination because of reduced bee abundance, less pollen transported and vibrations from man-made structures [50]. Inbred plant populations have lower fitness and less ability to respond to environmental stress [81,82], traits that are critical to survival in a warming climate.

Author Contributions

Conceptualization, L.M.T., L.T.-W., D.D. and M.E.D.; methodology, L.M.T., L.T.-W., D.D. and M.E.D.; formal analysis, L.M.T.; investigation, L.T.-W., M.M., A.L. and D.D.; resources, L.M.T. and M.E.D.; writing—original draft preparation, L.T.-W. and L.M.T.; writing—review and editing, L.M.T., L.T.-W., D.D., M.W., A.L., M.M. and M.E.D.; visualization, M.M. and L.M.T.; supervision, L.M.T. and M.E.D.; project administration, L.M.T. and M.E.D.; funding acquisition, L.M.T., L.T.-W., D.D. and M.E.D. All authors have read and agreed to the published version of the manuscript.

Funding

This research was funded by the Isaak Walton League of America to support L. Thelen-Wade’s undergraduate research project.

Data Availability Statement

The original contributions presented in this study are included in the article. Further inquiries can be directed to the corresponding author.

Acknowledgments

Thanks to the Wyoming Bureau of Land Management, a landowner and PacifiCorp for access to sites. A conversation with Jesse Barber led us to investigate sound as a possible mechanism for self-pollination. The Thelen-Wade family and Isaac Dority helped with fieldwork. The experiment was an undergraduate research project performed by L. Thelen-Wade. The authors have reviewed and edited the output and take full responsibility for the content of this publication.

Conflicts of Interest

The authors declare no conflict of interest.

References

  1. DeFries, R.S.; Foley, J.A.; Asner, G.P. Land-use choices: Balancing human needs and ecosystem function. Front. Ecol. Environ. 2004, 2, 249–257. [Google Scholar] [CrossRef]
  2. Pijanowski, B.C.; Farina, A.; Gage, S.H.; Dumyahn, S.L.; Krause, B.L. What is soundscape ecology? An introduction and overview of an emerging new science. Landsc. Ecol. 2011, 26, 1213–1232. [Google Scholar] [CrossRef]
  3. Weschler, M.; Tronstad, L. Wind energy and insects: Reviewing the state of knowledge and identifying potential interactions. PeerJ 2024, 12, e18153. [Google Scholar] [CrossRef] [PubMed]
  4. Ryunosuke, K. Adverse impacts of wind power generation on collision behaviour of birds and anti-predator behaviour of squirrels. J. Nat. Conserv. 2008, 16, 44–55. [Google Scholar] [CrossRef]
  5. Meunier, M. Wind Farm—Long term noise and vibration measurements. Proc. Meet. Acoust. 2013, 19, 040075. [Google Scholar] [CrossRef]
  6. Zajamsek, B.; Hansen, K.L.; Doolan, C.J.; Hansen, C.H. Characterisation of wind farm infrasound and low-frequency noise. J. Sound Vib. 2016, 370, 176–190. [Google Scholar] [CrossRef]
  7. Payne, R.S. The role of infrasounds in maintaining whale herds. J. Acoust. Soc. Am. 2004, 115, 2554. [Google Scholar] [CrossRef]
  8. Garstang, M. Elephant infrasounds: Long-range communication. In Handbook of Mammalian Vocalization: An Integrative Neuroscience Approach; Brudzynski, S.M., Ed.; Handbook of Behavioral Neuroscience; Elsevier: Amsterdam, The Netherlands, 2010; Volume 19, pp. 57–67. [Google Scholar]
  9. Mutschlecner, J.P.; Whitaker, R.W. Infrasound from earthquakes. J. Geophys. Res.-Atmos. 2005, 110, D01108. [Google Scholar] [CrossRef]
  10. Turnbull, C.; Turner, J.; Walsh, D. Measurement and level of infrasound from wind farms and other sources. Acoust. Aust. 2012, 40, 45–50. [Google Scholar]
  11. Donn, W.L.; Balachandran, N.K.; Kaschak, G. Atmospheric infrasound radiated by bridges. J. Acoust. Soc. Am. 1974, 56, 1367–1370. [Google Scholar] [CrossRef]
  12. Sandberg, U. Identification of infrasound generation mechanisms in a bus. J. Low Freq. Noise Vib. Act. Control 1988, 7, 110–117. [Google Scholar] [CrossRef]
  13. Iida, M.; Kikuchi, K.; Takami, H. Infrasound generated by a high-speed train running through a short tunnel. J. Low Freq. Noise Vib. Act. Control 2007, 26, 177–194. [Google Scholar] [CrossRef]
  14. Jakobsen, J. Infrasound emission from wind turbines. J. Low Freq. Noise Vib. Act. Control 2005, 24, 145–155. [Google Scholar] [CrossRef]
  15. Keith, S.E.; Daigle, G.A.; Stinson, M.R. Wind turbine low frequency and infrasound propagation and sound pressure level calculations at dwellings. J. Acoust. Soc. Am. 2018, 144, 981–996. [Google Scholar] [CrossRef] [PubMed]
  16. Marcillo, O.; Arrowsmith, S.; Blom, P.; Jones, K. On infrasound generated by wind farms and its propagation in low-altitude tropospheric waveguides. J. Geophys. Res. Atmos. 2015, 120, 9855–9868. [Google Scholar] [CrossRef]
  17. Tronstad, L.M.; Weschler, M.; Storey, A.M.; Handley, J.; Tronstad, B.P. Vibrations from Wind Turbines Increased Self-Pollination of Native Forbs, and White Bases Attracted Pollinators: Evidence Along a 28 km Gradient in a Natural Area. Wind 2025, 5, 15. [Google Scholar] [CrossRef]
  18. Malec, T.; Boczar, T.; Wotzka, D.; Kozioł, M. Measurement and Analysis of Infrasound Signals Generated by Operation of High-Power Wind Turbines. Energies 2021, 14, 6544. [Google Scholar] [CrossRef]
  19. Dorsey, B.; Olsson, M.; Rew, L.J. Ecological effects of railways on wildlife. In Handbook of Road Ecology; Wiley: Hoboken, NJ, USA, 2015; pp. 219–227. [Google Scholar]
  20. Lucas, P.S.; de Carvalho, R.G.; Grilo, C. Railway disturbances on wildlife: Types, effects, and mitigation measures. In Railway Ecology; Springer: Berlin/Heidelberg, Germany, 2017; pp. 81–99. [Google Scholar]
  21. Popp, J.N.; Boyle, S.P. Railway ecology: Underrepresented in science? Basic Appl. Ecol. 2017, 19, 84–93. [Google Scholar] [CrossRef]
  22. Schuster, E.; Bulling, L.; Koppel, J. Consolidating the State of Knowledge: A Synoptical Review of Wind Energy’s Wildlife Effects. Environ. Manag. 2015, 56, 300–331. [Google Scholar] [CrossRef]
  23. Baidya Roy, S.; Traiteur, J.J. Impacts of wind farms on surface air temperatures. Proc. Natl. Acad. Sci. USA 2010, 107, 17899–17904. [Google Scholar] [CrossRef]
  24. Baidya Roy, S.; Pacala, S.W.; Walko, R. Can large wind farms affect local meteorology? J. Geophys. Res. Atmos. 2004, 109, D19101. [Google Scholar] [CrossRef]
  25. Roy, S.B. Simulating impacts of wind farms on local hydrometeorology. J. Wind Eng. Ind. Aerodyn. 2011, 99, 491–498. [Google Scholar]
  26. Fiedler, B.H.; Bukovsky, M.S. The effect of a giant wind farm on precipitation in a regional climate model. Environ. Res. Lett. 2011, 6, 045101. [Google Scholar] [CrossRef]
  27. Zhou, L.; Tian, Y.; Baidya Roy, S.; Dai, Y.; Chen, H. Diurnal and seasonal variations of wind farm impacts on land surface temperature over western Texas. Clim. Dyn. 2013, 41, 307–326. [Google Scholar] [CrossRef]
  28. Urziceanu, M.; Anastasiu, P.; Rozylowicz, L.; Sesan, T.E. Local-scale impact of wind energy farms on rare, endemic, and threatened plant species. PeerJ 2021, 9, e11390. [Google Scholar] [CrossRef]
  29. Silva, M.; Pasos, I. Vegetation. In Wildlife and Wind Farms, Conflicts and Solutions: Volume 1—Onshore: Potential Effects; Perrow, M., Ed.; Pelagic Publishing: Exeter, UK, 2017; pp. 40–62. [Google Scholar]
  30. Brouček, J. Effect of noise on performance, stress, and behaviour of animals. Slovak J. Anim. Sci. 2014, 47, 111–123. [Google Scholar]
  31. Gagliano, M. Green symphonies: A call for studies on acoustic communication in plants. Behav. Ecol. 2013, 24, 789–796. [Google Scholar] [CrossRef]
  32. Trigg, J.; Naweed, A.; Kinnear, S. A scoping review of freight rail noise and vibration impacts on domestic animal health and welfare. Anim. Welf. 2022, 31, 69–77. [Google Scholar] [CrossRef]
  33. Gómez-Martínez, C.; González-Estévez, M.A.; Cursach, J.; Lázaro, A. Pollinator richness, pollination networks, and diet adjustment along local and landscape gradients of resource diversity. Ecol. Appl. 2022, 32, e2634. [Google Scholar] [CrossRef]
  34. Hotker, H.; Krone, O.; Nehls, G. Birds of Prey and Wind Farms: Analysis of Problems and Possible Solutions; Springer: Cham, Switzerland, 2017; p. 331. [Google Scholar]
  35. Kirol, C.P.; Smith, K.T.; Graf, N.E.; Dinkins, J.B.; Lebeau, C.W.; Maechtle, T.L.; Sutphin, A.L.; Beck, J.L. Greater sage-grouse response to the physical footprint of energy development. J. Wildl. Manag. 2020, 84, 989–1001. [Google Scholar] [CrossRef]
  36. Bolin, K.; Bluhm, G.; Eriksson, G.; Nilsson, M.E. Infrasound and low frequency noise from wind turbines: Exposure and health effects. Environ. Res. Lett. 2011, 6, 035103. [Google Scholar] [CrossRef]
  37. Hansen, C.H.; Doolan, C.J.; Hansen, K.L. Effects of Wind Farm Noise and Vibration on People. In Wind Farm Noise: Measurement, Assessment and Control; Wiley: Hoboken, NJ, USA, 2017; pp. 436–475. [Google Scholar]
  38. Velilla, E.; Collinson, E.; Bellato, L.; Berg, M.P.; Halfwerk, W. Vibrational noise from wind energy-turbines negatively impacts earthworm abundance. Oikos 2021, 130, 844–849. [Google Scholar] [CrossRef]
  39. Agnew, R.C.N.; Smith, V.J.; Fowkes, R.C. Wind turbines cause chronic stress in badgers (Meles meles) in Great Britain. J. Wildl. Dis. 2016, 52, 459–467. [Google Scholar] [CrossRef] [PubMed]
  40. Jung, J.; Kim, S.-K.; Kim, J.Y.; Jeong, M.-J.; Ryu, C.-M. Beyond Chemical Triggers: Evidence for Sound-Evoked Physiological Reactions in Plants. Front. Plant Sci. 2018, 9, 25. [Google Scholar] [CrossRef]
  41. Veits, M.; Khait, I.; Obolski, U.; Zinger, E.; Boonman, A.; Goldshtein, A.; Saban, K.; Seltzer, R.; Ben-Dor, U.; Estlein, P.; et al. Flowers respond to pollinator sound within minutes by increasing nectar sugar concentration. Ecol. Lett. 2019, 22, 1483–1492. [Google Scholar] [CrossRef]
  42. Vallejo-Marín, M. Buzz pollination: Studying bee vibrations on flowers. New Phytol. 2019, 224, 1068–1074. [Google Scholar] [CrossRef] [PubMed]
  43. Eickwort, G.C.; Ginsberg, H.S. Foraging and mating behavior in Apoidea. Annu. Rev. Entomol. 1980, 25, 421–446. [Google Scholar] [CrossRef]
  44. Hansen, C.; Doolan, C.; Hansen, K. Wind Farm Noise: Measurement, Assessment and Control; John Wiley and Sons Ltd.: West Sussex, UK, 2017. [Google Scholar]
  45. Dreller, C.; Kirchner, W.H. Hearing in honeybees—Localization of the auditory sense organ. J. Comp. Physiol. A-Sens. Neural Behav. Physiol. 1993, 173, 275–279. [Google Scholar] [CrossRef]
  46. Sanchez-Bayo, F.; Wyckhuys, K.A.G. Worldwide decline of the entomofauna: A review of its drivers. Biol. Conserv. 2019, 232, 8–27. [Google Scholar] [CrossRef]
  47. Razanajatovo, M.; Maurel, N.; Dawson, W.; Essl, F.; Kreft, H.; Pergl, J.; Pyšek, P.; Weigelt, P.; Winter, M.; Van Kleunen, M. Plants capable of selfing are more likely to become naturalized. Nat. Commun. 2016, 7, 13313. [Google Scholar] [CrossRef]
  48. Crawford, M.S.; Handley, J.; Tronstad, L.M. An insect-pollinated species in a wind-pollinated genus: Case study of the endemic plant, Laramie chickensage Artemisia simplex. Nord. J. Bot. 2022, 2022, e03708. [Google Scholar] [CrossRef]
  49. Fernández, J.D.; Bosch, J.; Nieto-Ariza, B.; Gómez, J.M. Pollen limitation in a narrow endemic plant: Geographical variation and driving factors. Oecologia 2012, 170, 421–431. [Google Scholar] [CrossRef]
  50. Morales, C.L.; Traveset, A. Interspecific pollen transfer: Magnitude, prevalence and consequences for plant fitness. Crit. Rev. Plant Sci. 2008, 27, 221–238. [Google Scholar] [CrossRef]
  51. Tang, B.; Wu, D.; Zhao, X.; Zhou, T.; Zhao, W.; Wei, H. The Observed Impacts of Wind Farms on Local Vegetation Growth in Northern China. Remote Sens. 2017, 9, 332. [Google Scholar] [CrossRef]
  52. Xu, K.; He, L.; Hu, H.; Liu, S.; Du, Y.; Wang, Z.; Li, Y.; Li, L.; Khan, A.; Wang, G. Positive ecological effects of wind farms on vegetation in China’s Gobi desert. Sci. Rep. 2019, 9, 6341. [Google Scholar] [CrossRef]
  53. Pătru-Stupariu, I.; Calotă, A.-M.; Santonja, M.; Anastasiu, P.; Stoicescu, I.; Biriş, I.A.; Stupariu, M.-S.; Buttler, A. Do wind turbines impact plant community properties in mountain region? Biologia 2019, 74, 1613–1619. [Google Scholar] [CrossRef]
  54. Pohrib, M.D.; Niacsu, L. Natural Land Patterns Suitable for Wind Farms Placement in Eastern Romania. Case Study: The Padureni-Husi Area. Int. J. Eng. Technol. 2012, 4, 645. [Google Scholar] [CrossRef]
  55. Fargione, J.; Kiesecker, J.; Slaats, M.J.; Olimb, S. Wind and wildlife in the Northern Great Plains: Identifying low-impact areas for wind development. PLoS ONE 2012, 7, e41468. [Google Scholar] [CrossRef] [PubMed]
  56. Potts, S.G.; Biesmeijer, J.C.; Kremen, C.; Neumann, P.; Schweiger, O.; Kunin, W.E. Global pollinator declines: Trends, impacts and drivers. Trends Ecol. Evol. 2010, 25, 345–353. [Google Scholar] [CrossRef] [PubMed]
  57. Kaldellis, J.K.; Garakis, K.; Kapsali, M. Noise impact assessment on the basis of onsite acoustic noise immission measurements for a representative wind farm. Renew. Energy 2012, 41, 306–314. [Google Scholar] [CrossRef]
  58. Ollerton, J.; Winfree, R.; Tarrant, S. How many flowering plants are pollinated by animals? Oikos 2011, 120, 321–326. [Google Scholar] [CrossRef]
  59. Schlindwein, C.; Wittmann, D. Stamen movements in flowers of Opuntia (Cactaceae) favour oligolectic pollinators. Plant Syst. Evol. 1997, 204, 179–193. [Google Scholar] [CrossRef]
  60. Osborn, M.M.; Kevan, P.G.; Lane, M.A. Pollination biology of Opuntia polyacantha and Opuntia phaeacantha (Cactaceae) in southern Colorado. Plant Syst. Evol. 1988, 159, 85–94. [Google Scholar] [CrossRef]
  61. Love, L.D.; Christianson, A. Geologic Map of Wyoming; U.S. Geological Survey: Reston, VA, USA, 1985. [Google Scholar]
  62. Curtis, J.; Grimes, K. Wyoming Climate Atlas. Available online: https://www.wrds.uwyo.edu/sco/climateatlas/ (accessed on 24 February 2025).
  63. Moore, G.; Goldman, D.; Garland, M.; Taliga, C.; Hinshaw, J. PLANTS Database. Available online: https://plants.usda.gov/home (accessed on 11 January 2022).
  64. Starfinger, U.; Karrer, G. A standard protocol for testing viability with the Triphenyl Tetrazolium Chloride (TTC) Test. Jul.-Kühn-Arch. 2016, 65–66. [Google Scholar] [CrossRef]
  65. Delignette-Muller, M.; Dutang, C. fitdistrplus: An R package for fitting distributions. J. Stat. Softw. 2015, 64, 1–34. [Google Scholar] [CrossRef]
  66. R Development Core Team. R: A Language and Environment for Statistical Computing; R Foundation for Statistical Computing: Vienna, Austria, 2023. [Google Scholar]
  67. Rizopoulos, D. GLMMadaptive: Generalized Linear Mixed Models Using Adaptive Gaussian Quadrature. 2023. Available online: https://drizopoulos.github.io/GLMMadaptive/ (accessed on 25 July 2025).
  68. Bates, D.; Machler, M.; Bolker, B.M.; Walker, S.E. Fitting linear mixed-effects models using lme4. J. Stat. Softw. 2015, 67, 1–48. [Google Scholar] [CrossRef]
  69. Venables, W.N.; Ripley, B.D. Modern Applied Statistics with S, 4th ed.; Springer: New York, NY, USA, 2002. [Google Scholar]
  70. Lenth, R. Emmeans: Estimated Marginal Means, Aka Least-Squares Means. R Package. Version 1.7.2. 2022. Available online: https://rvlenth.github.io/emmeans/ (accessed on 25 July 2025).
  71. Wickham, H. The Split-Apply_Combine Strategy for Data Analysis. J. Stat. Softw. 2011, 40, 1–29. [Google Scholar] [CrossRef]
  72. Topić, J.; Stančić, Z. Extinction of fen and bog plants and their habitats in Croatia. Biodivers. Conserv. 2006, 15, 3371–3381. [Google Scholar] [CrossRef]
  73. Walker, K.J.; Preston, C.D. Ecological predictors of extinction risk in the flora of lowland England, UK. Biodivers. Conserv. 2006, 15, 1913–1942. [Google Scholar] [CrossRef]
  74. Takle, E.S. Climate. In Wildlife and Wind Farms, Conflicts and Solutions: Volume 1—Onshore: Potential Effects; Perrow, M., Ed.; Pelagic Publishing: Exeter, UK, 2017; pp. 24–39. [Google Scholar]
  75. Van Etten, M.L.; Brunet, J. The impact of global warming on floral traits that affect the selfing rate in a high-altitude plant. Int. J. Plant Sci. 2013, 174, 1099–1108. [Google Scholar] [CrossRef]
  76. Appel, H.M.; Cocroft, R.B. Plants respond to leaf vibrations caused by insect herbivore chewing. Oecologia 2014, 175, 1257–1266. [Google Scholar] [CrossRef] [PubMed]
  77. Cota-Sánchez, J.H.; Almeida, O.J.; Falconer, D.J.; Choi, H.J.; Bevan, L. Intriguing thigmonastic (sensitive) stamens in the Plains Prickly Pear Opuntia polyacantha (Cactaceae). Flora-Morphol. Distrib. Funct. Ecol. Plants 2013, 208, 381–389. [Google Scholar] [CrossRef]
  78. De Luca, P.A.; Vallejo-Marín, M. What’s the ‘buzz’about? The ecology and evolutionary significance of buzz-pollination. Curr. Opin. Plant Biol. 2013, 16, 429–435. [Google Scholar] [CrossRef] [PubMed]
  79. Hassanien, R.H.; Hou, T.-Z.; Li, Y.-F.; Li, B.-M. Advances in effects of sound waves on plants. J. Integr. Agric. 2014, 13, 335–348. [Google Scholar] [CrossRef]
  80. Goulson, D.; Nicholls, E.; Botias, C.; Rotheray, E.L. Bee declines driven by combined stress from parasites, pesticides, and lack of flowers. Science 2015, 347, 1255957. [Google Scholar] [CrossRef]
  81. Bijlsma, R.; Bundgaard, J.; VanPutten, W. Environmental dependence of inbreeding depression and purging in Drosophila melanogaster. J. Evol. Biol. 1999, 12, 1125–1137. [Google Scholar] [CrossRef]
  82. Keller, L.; Waller, D. Inbreeding effects in wild populations. Trends Ecol. Evol. 2002, 17, 230–241. [Google Scholar] [CrossRef]
Figure 1. (a) The flowers of Plains pricklypear (Opuntia polyacantha); (b) the locations of the sites relative to one another and an inset map showing the location of the state of Wyoming in the United States of America; and (c) the bagged treatment that excluded pollinators from visiting flowers.
Environments 12 00266 g001
Figure 2. The (a) number, (b) mass and (c) percent of viable seeds from Plains pricklypear (Opuntia polyacantha) varied among treatments and sites. Flowers were bagged to assess self-pollination, pollinated by local pollinators in the open treatment and hand-pollinated to measure seed characteristics when pollen was not limiting. The upwind and downwind sites were near an active wind facility, the train site was near a railway and the reference site was distant from anthropogenic sources of infrasound.
Environments 12 00266 g002aEnvironments 12 00266 g002b
Figure 3. The (a) number, (b) mass and (c) percent of viable seeds from Plains pricklypear (Opuntia polyacantha) varied with distance to sound from a wind facility, railway and reference sites >20 km away. Flowers were bagged to assess self-pollination, pollinated by local pollinators in the open treatment and hand-pollinated to measure seed characteristics when pollen was not limiting.
Environments 12 00266 g003aEnvironments 12 00266 g003b
Table 1. The results of generalized linear models that analyzed the number of seeds, mass of seeds and percent viability of seeds across treatments and sites. The explanatory variables were source of infrasound (train, turbine or reference), seed-set treatment (bagged, hand-pollinated or open) and distance to the source of infrasound. Generalized linear models drop on categorical variable thus only 2 are shown below. See methods for more details on explanatory variables. Italicized lines represent variables that differed (α ≤ 0.05).
Response VariableCoefficientt or z-Valuesp-Values
Number seeds
Intercept2.34.9<0.0001
Train−0.24−0.370.67
Turbine−0.14−0.370.71
Distance−0.028−2.10.03
Hand-pollinated1.45.4<0.0001
Open1.25.0<0.0001
Seed mass
Intercept2.28.4<0.0001
Train−0.61−2.00.04
Turbine−0.16−0.710.48
Distance−0.018−2.90.004
Hand-pollinated0.917.1<0.0001
Open0.917.3<0.0001
% Viable seeds
Intercept−0.27−2.40.018
Train−0.033−0.260.84
Turbine−0.049−0.510.70
Distance−0.0037−1.40.39
Hand-pollinated0.314.8<0.0001
Open0.264.10.0001
Disclaimer/Publisher’s Note: The statements, opinions and data contained in all publications are solely those of the individual author(s) and contributor(s) and not of MDPI and/or the editor(s). MDPI and/or the editor(s) disclaim responsibility for any injury to people or property resulting from any ideas, methods, instructions or products referred to in the content.

