Article

Long-Term Performance of Passive Volatile Organic Compounds (VOCs) Samplers for Indoor Air

1
Watershed and Ecosystem Characterization Division, Center for Environmental Measurement & Modeling (CEMM), Office of Research and Development (ORD), U.S. Environmental Protection Agency (EPA), 109 TW Alexander Dr., Research Triangle Park, NC 27711, USA
2
Ecosystem Processes Division, Center for Environmental Measurement & Modeling (CEMM), Office of Research and Development (ORD), U.S. Environmental Protection Agency (EPA), 960 College Station Road, Athens, GA 30605, USA
3
Jacobs, 1999 Bryan St., Ste. 1200, Dallas, TX 75201, USA
4
Eurofins Environment Testing Northern California, LLC, Folsom, CA 95630, USA
*
Author to whom correspondence should be addressed.
Environments 2025, 12(8), 267; https://doi.org/10.3390/environments12080267 (registering DOI)
Submission received: 5 June 2025 / Revised: 17 July 2025 / Accepted: 26 July 2025 / Published: 31 July 2025

Abstract

The reliability of passive samplers in measuring volatile organic compounds (VOCs) in indoor air depends on whether the uptake rate is constant given the environmental conditions and sampler exposure duration. The first phase of this study evaluated the performance of charcoal-based, solvent-extracted passive samplers (e.g., Radiello® 130 passive samplers with white diffusive bodies) over exposure periods ranging from 1 week to 1 year in a test house with known vapor intrusion (VI). Chloroform %Bias values exceeded the ±30% acceptance criterion after 4 weeks exposure. Benzene, hexane, and trichloroethylene (TCE) concentrations were within the acceptance criterion for up to three months. Toluene and tetrachloroethylene (PCE), the two least volatile compounds, demonstrated uniform uptake rates over one year. In the second phase of this study, testing of the longer exposure times of 6 months and 1 year were evaluated with three additional passive samplers: Waterloo Membrane SamplerTM (WMSTM), SKC 575 with secondary diffusive cover, and Radiello® 130 passive samplers with yellow diffusive bodies. The SKC 575 and Radiello® 130 passive samplers produced acceptable results (%Bias ≤ 30%) over the 6-month exposure period, while the WMSTM sampler results favored petroleum hydrocarbon more than chlorinated solvent uptake. After the 1-year exposure period, the passive sampler performances were acceptable under specific conditions of this study. The results suggest that all three samplers can produce acceptable results over exposure time periods beyond 30 days and up to a year for some compounds.

1. Introduction

The objective of this study was to evaluate volatile organic compound (VOC) concentrations using passive samplers beyond 30 days and potentially extending the exposure period to a full year. The few published studies evaluating sampling intervals greater than 30 days are largely focused on measuring benzene, toluene, ethylbenzene, and xylenes (BTEX) [1,2]. The stability of chlorinated compounds on sorbents in the presence of humidity and the variability of the sampler uptake rate past 30 days are not well understood for any of the passive samplers under consideration for this study. The sorbent selection, sampler geometry, and target chemical’s volatility may impact the application of passive samplers during extended deployment/exposure periods. Vapor intrusion (VI) is the migration of subsurface vapors, including radon and VOCs, from the subsurface of a building to indoor air. Current standard practices for indoor air VOC monitoring in the US include the use of negatively pressurized, ultra-clean, passivated, stainless steel canisters for collecting samples to be analyzed by methods TO-14 and TO-15 [3,4]. Method TO-15 specifies an audit accuracy of ±30% and a replicate precision of 25% as performance criteria.
Active (or pumped) sorbent methods (e.g., TO-17 [5]) have also been published by the US Environmental Protection Agency (US EPA) for VOC measurements in ambient air. However, in these methods, air samples are actively collected over 1 h using a sample pump with sampling rates from 17 mL/min to 67 mL/min, yielding total sample volumes between 1 and 4 liters (L). Sampling intervals can be extended beyond 1 h; however, care must be taken to ensure breakthrough volumes are not exceeded. Given the minimum pump flow rate cited in TO-17 of 17 mL/min, the practical upper limit for chlorinated VOCs using a multibed thermal desorption sorbent tube is on the order of 10 L to 20 L for select VOCs yielding a corresponding maximum collection period of 8 to 24 h [6].
European agencies have developed standard methods for passive sampling for VOCs applicable to a range of concentrations and durations that are similar to those discussed by the study in this paper for indoor and ambient air quality, as well as vapor intrusion investigations. This material and other basic information on passive samplers have been summarized in an Engineering Issue Paper prepared by US EPA’s Office of Research and Development [7].
One way to lower the detection limits and control day-to-day variability when evaluating chronic or sub-chronic exposures is to sample over a longer period. This approach would provide a lower detection limit, be cost-effective, and result in a time-integrated composite sample. Laboratory and field evaluations with such an approach for ambient and indoor air applications have been published and show promising results for sampling durations of up to 14 days. Exposure of badge-type charcoal-based passive samplers to controlled atmospheres of 10 to 200 ppb benzene, toluene, and m-xylene showed a more consistent uptake rate when deployed for 14 days [8]. A field study published by Begerow et al. showed comparability between two charcoal-based passive sampler geometries, badge and tube-style, for 4-week indoor and outdoor air samples [9]. Field evaluations were also conducted using radial charcoal-based and thermal desorption Radiello® samplers to determine performance over a 14-day period. Ambient BTEX measurements using Radiello® samplers compared well to active sorbent sampling results [10].
A field study at Orion Park, Moffett Field, in California compared measurements of VOCs by Method TO-15 [4] to three different radial and axial tube-type sorbent systems:
  • Radial: activated charcoal (with carbon disulfide (CS2) extraction: gas chromatography–mass spectrometry [GC/MS]);
  • Radial: carbograph 4 (TO-17 [5]: thermal desorption [TD] GC/MS);
  • Axial: chromosorb 106 thermal desorption tube (TO-17 [5]: TD GC/MS).
Performance for the two radial samplers was superior to the axial method [11,12]. Testing was also performed at the Wheeler building in Indianapolis comparing Summa canisters to Radiello® solvent-extracted samplers. The Wheeler building is a complex, multiuse, multiunit 100,000 square foot building that has been previously tested by US EPA [11,12,13]. Formerly a factory from 1911 to 1995, the industrial slab-on-grade and basement building was renovated with a theater, office space, and artist galleries, including live/work lofts with 35 separate heating, ventilation, and air conditioning (HVAC) zones.
Across the two sites, the Radiello® solvent-extracted sampler concentrations of chlorinated compounds, such as PCE and TCE, showed good agreement with TO-15 Summa canister results and had recoveries generally ranging from 70 to 100% and precision % differences less than 5%. Agreement was poor for polar compounds, including ethanol, methyl ethyl ketone, and acetone, whereas the Radiello® solvent-extracted samplers recovered between 5 and 30% when compared to the TO-15 Summa canister results. Radiello® thermal desorption sampler results correlated well (r2 = 0.85) with the TO-15 Summa canister results but had TCE concentrations about half of those found in the Summa canisters. The lower TCE concentrations suggest that a 2-week exposure time was too long for the Radiello® thermally desorbed samplers [11,12].
McAlary et al. performed an extensive comparison of the performance among five different passive samplers in the laboratory and field sites [14,15]. In the laboratory, they found that passive samplers can provide concentration measurements with accuracy (mostly within a factor of 2) and precision (RSD < 15%) comparable to conventional Summa canister samples and US EPA Method TO-15 analysis when the passive samplers were exposed for 30 min [14]. Similar results were found when the same five samplers were exposed for up to 11.7 days in the field, where soil vapor concentrations were within a factor of 2 and precision was comparable to active sampling using Summa canisters [15].
The objective of this study was to evaluate VOC concentrations using passive samplers beyond 30 days, potentially extending the exposure period to a full year. The reliability of passive samplers in measuring VOC concentrations largely depends on whether the uptake rate is constant through time given the environmental conditions and the exposure period. Prolonged exposure of passive samplers can result in reduced net uptake rates due to back diffusion or loss of sorptive capacity. To evaluate the performance of charcoal-based, solvent-extracted, passive samplers over periods ranging from 1 week to 1 year, the VOC concentrations measured for extended time intervals were compared with the average concentrations measured concurrently over shorter time segments. The shortest interval used in this comparative study was 1 week.

2. Materials and Methods

The study was conducted in two phases. The first phase was an intensive year-long study looking at the Radiello® 130 passive sampler performance on a weekly, bi-weekly, monthly, quarterly, and annual frequency. As a result of the findings from the first phase, a second-phase long-term study was conducted to examine the effectiveness of the three different passive samplers for exposure periods of 6 months and 1 year.

2.1. Study Site

The test house is a vacant residential duplex in the Mapleton Fall Creek neighborhood of Indianapolis, IN [16]. The test house (Figure 1) is an early twentieth century duplex built before 1915. Based on the mirrored floor plans of the two sides, it is likely that the house was always a duplex. The construction is a two-story wood frame (with attic) on a brick foundation with a poured concrete basement floor. Due to extensive vandalism prior to the start of the study commencing, a gas-fired forced air furnace unit was installed only on one side of the duplex. The test house has no central air conditioning system to mimic typical tenant usage; therefore, window-mounted air conditioning units were installed. The test house was unfurnished and operated as if occupied, with seasonal adjustments to temperatures being made by a field scientist, although heat was available only on one side of the duplex. As the test house was predominantly vacant, anthropogenic inputs of VOCs were not a concern.

2.2. Mitigation History

The Indianapolis test house was not mitigated during the phase 1 study [16]. Between the phase 1 and phase 2 studies, a subslab depressurization system was installed and periodically operated [17]. During phase 2, the mitigation system was off for the first 6 months and on for the second 6 months of the study.

2.3. Sample Collection

For phase 1, indoor air passive sampling was done with Radiello® 130 samplers with white diffusive bodies. The Radiello® 130 passive samplers were placed on wooden clothes drying racks for durations of 7, 14, 28 (monthly), 91 (quarterly), 182 (semiannually), and 364 (annual) days. On both sides of the Indianapolis test house, racks were placed in the first-floor center room and in the northern and southern sections of each basement. In addition, a protected outdoor location, on a telephone pole near the house, was installed to accommodate the passive samplers and to act as an ambient air location.
For phase 2, three different passive samplers were deployed to compare their efficiencies among sampler types over periods of 6 months and 1 year. The sampler types compared at the Indianapolis test house were these: (a) Radiello® 130 radial sampler with a yellow diffusive body, which has a longer diffusive path length due to its smaller average pore size and a thicker diffusive membrane than the white diffusive body, which results in a lower sampling rate; (b) SKC 575 badge sampler with charcoal-based sorbent; and (c) WMSTM, which is a permeation passive sampler in which the uptake of VOCs is controlled by a polydimethylsiloxane membrane and the VOCs are collected onto a charcoal-based sorbent bed. The WMSTM has the lowest sampling rates of the three samplers tested, with rates on the order of 2 to 5 times less than the SKC 575 badge and 5 to 20 times less than the Radiello® 130 passive sampler with the yellow diffusive body. Specifications of the three types of passive samplers used in this study are provided in Table 1. Manufacturer’s guidelines and standard operating procedures for each of these passive samplers can be found at Radiello [18], SKC 575 [19], and WMSTM [20].
The selected samplers and the control Radiello® 130 passive samplers with the white diffusive bodies were each hung on the wooden racks in the 422 first floor center room, 422 basement south section, 420 basement south section, and at the ambient location. The control Radiello® 130 passive samplers with the white diffusive bodies were collected after 7-day exposure periods. Individual weekly results were used to identify peak VOC concentrations that should be reflected in the long-term sample results.

2.4. Sample Analysis and Quality Assurance

All passive samplers were analyzed by spiking internal standard and surrogate solution onto the sorbent and adding 2.0 mL of CS2 directly to each storage vial or the sampler housing. The vial or sampler was then placed on a shaker for approximately 30 min, and the extract was transferred to an autosampler vial for analysis by GC/MS by US EPA Method 8260 [22], in synchronous SIM/Scan mode with a 6% cyanopropyl phenyl, 94% polydimethylsiloxane, 30 m × 0.25 mm × 1.4 um column. Field blanks, trip blanks, and laboratory blanks were used to evaluate false positives and/or high bias due to transport, storage, sample handling, and sorbent contamination.

2.4.1. Radiello® 130

The uptake rates used to generate sample concentrations were published by the Radiello® manufacturer, Fondazione Salvatore Maugeri (Padova, Italy), based on measurements made in a standard atmosphere chamber [18]. The rates were corrected for the average temperature recorded over the sampling duration using the equation:
QK = Q298 (K/298)1.5
where K is the measured temperature in degrees Kelvin, QK is the uptake rate at temperature K, and Q298 is the published reference rate at 298 K.
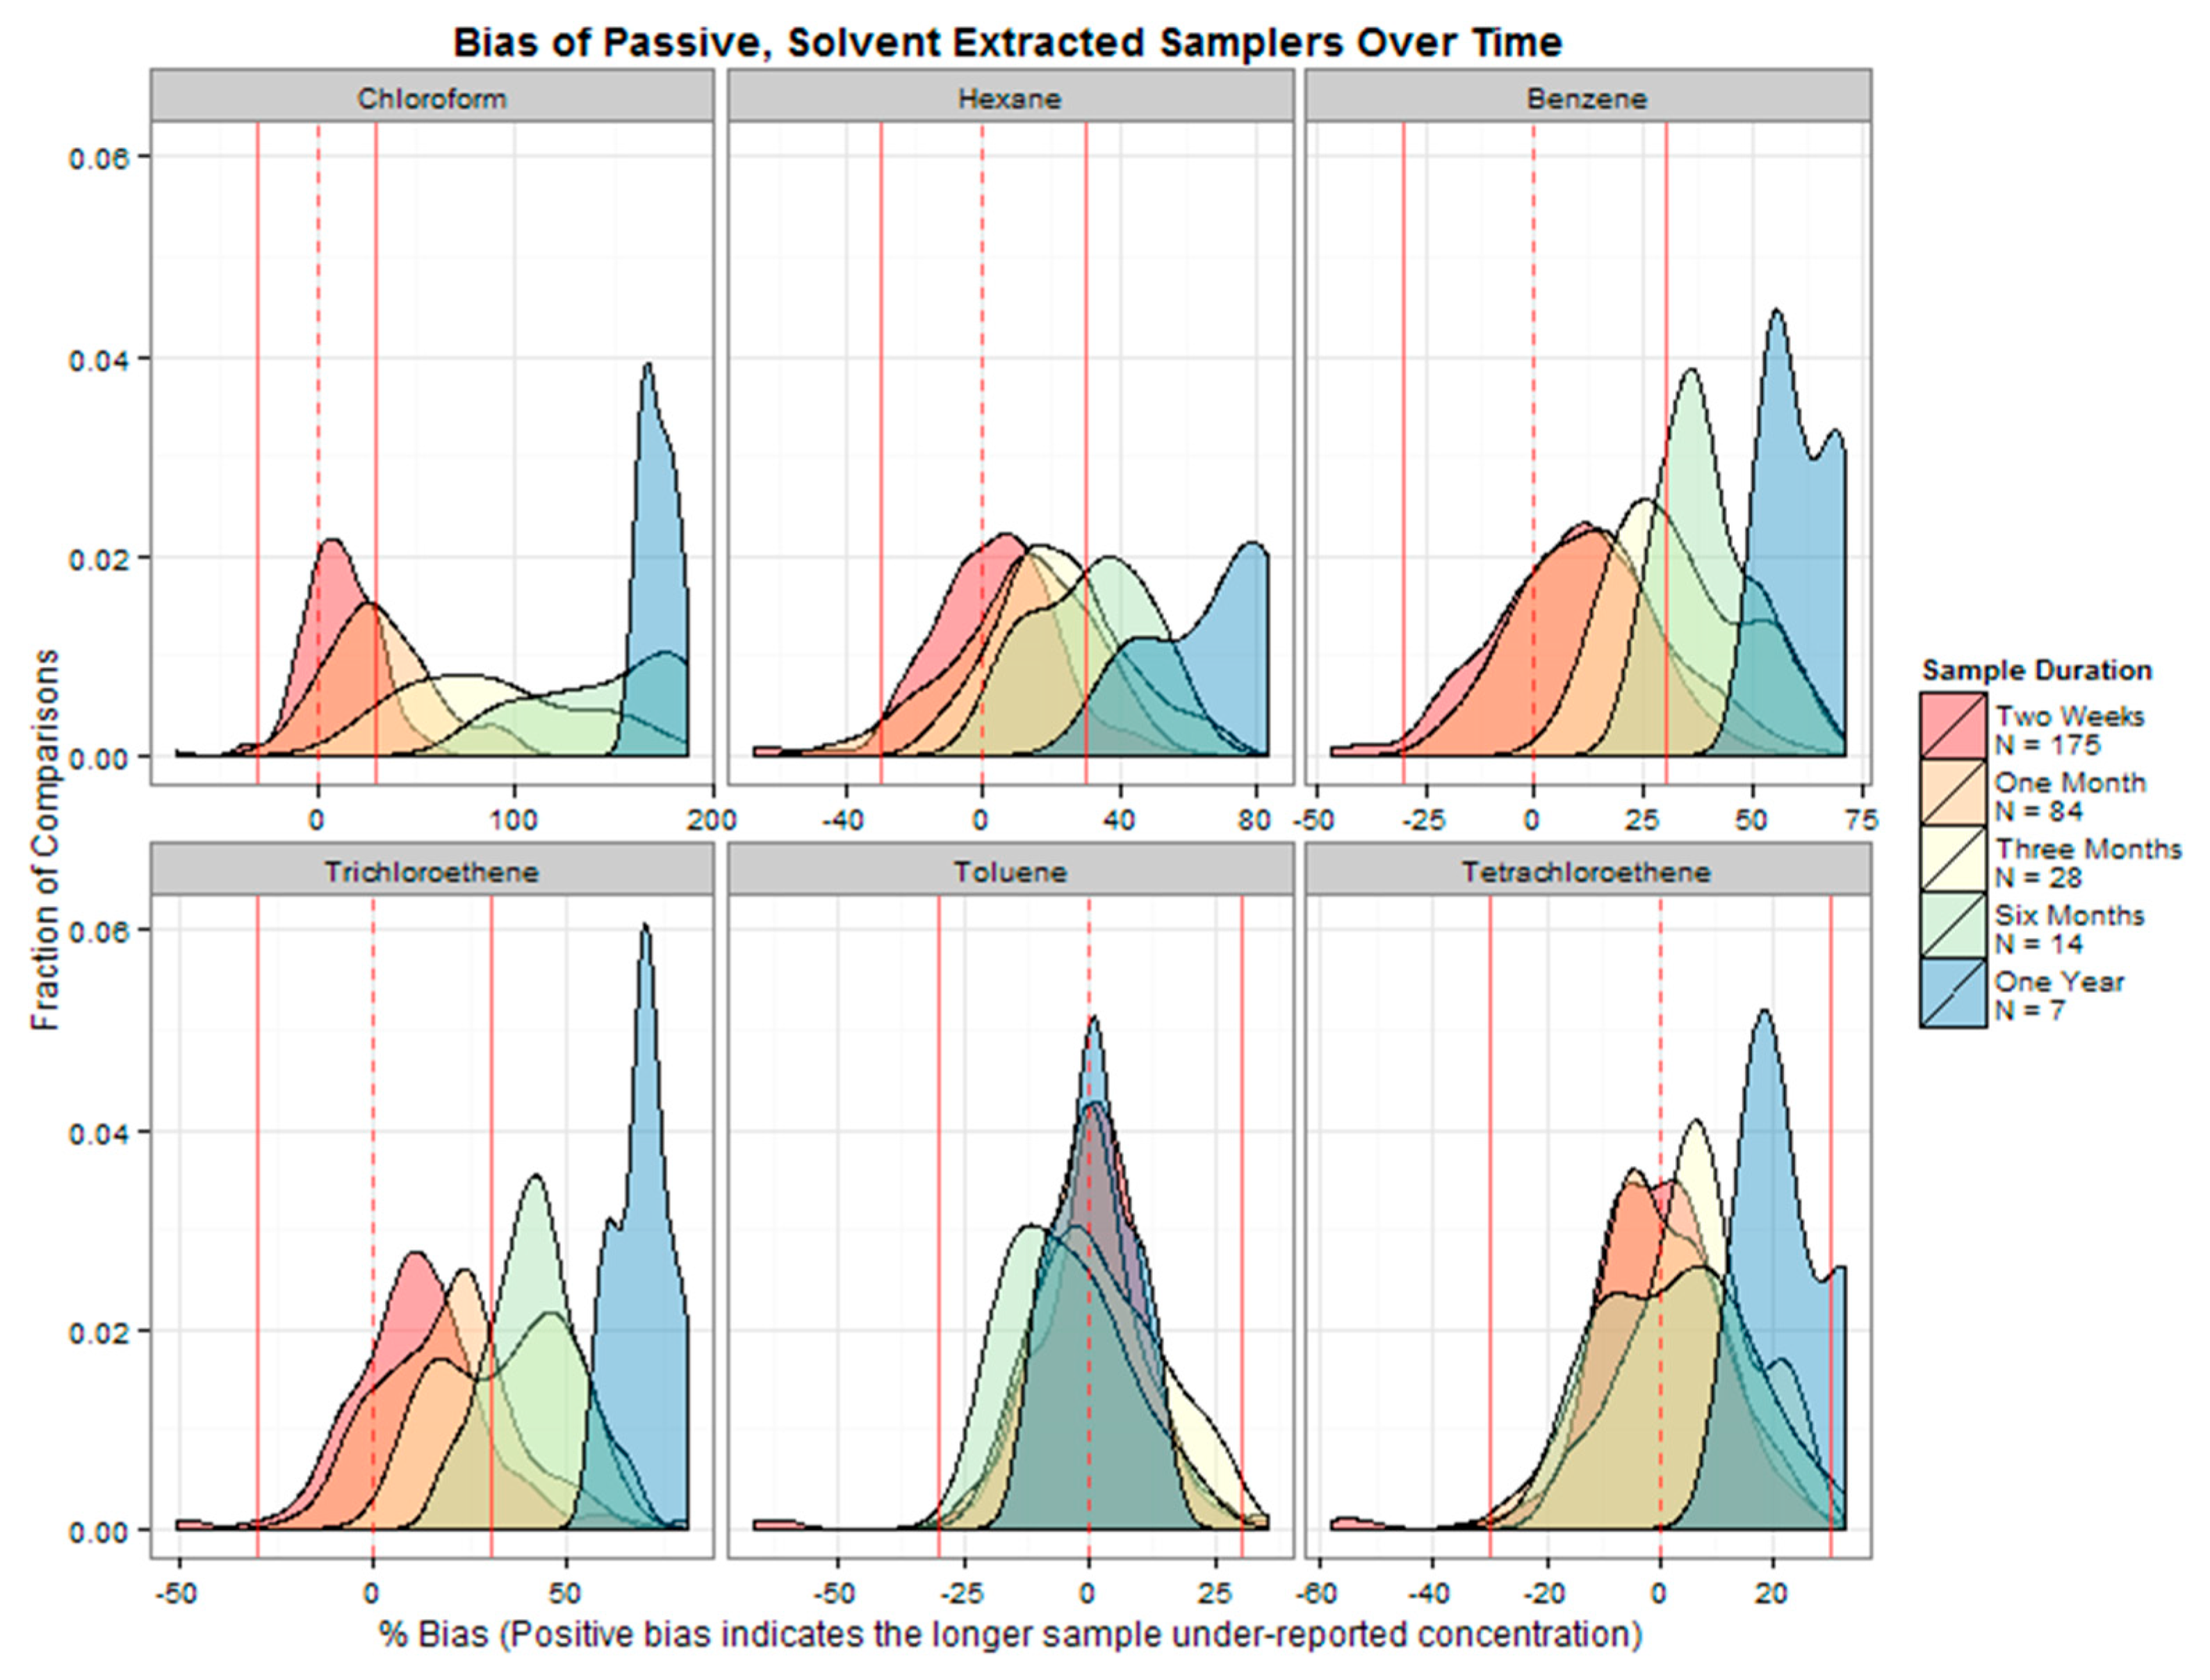
Evaluation of the passive sampler performance over the exposure period was determined by comparing the numerical average of the shorter time segments (e.g., 1 week and 2 weeks) to the concurrent integrated measurement (e.g., biweekly and monthly). For each interval evaluated, the relative percent difference (%Bias) was calculated using the following equation:
%Bias = (CA − CI)/((CA + CI) ⁄ 2) × 100%
where CA = average concentration of the shorter exposure period sample and CI = measured concentration of the integrated sample over the longer exposure period.
A positive %Bias indicated the average concentration of the shorter duration measurements was higher than the longer integrated sample concentration. A negative %Bias indicated that the shorter duration measurement underestimated the actual vapor concentration. The acceptance criterion to demonstrate equivalency between concentrations and durations was ±30%. If the reported concentration was a nondetect, the %Bias calculation was performed using half of the reporting limit for the corresponding concentration.
Field blanks were collected using a blank Radiello® 130 cartridge from the media sample batch sent to the field from the laboratory. The cartridge was removed from the sealed storage vial and transferred to the diffusive housing in a similar manner to sample deployment. The cartridge was then immediately removed from the housing, returned to the storage vial, and sealed for shipment back to the laboratory with the field samples. In general, a field blank was collected with each shipment to the laboratory. A total of 47 field blanks were submitted over the duration of the project.
Blank Radiello® 130 cartridges from the media batches were also assigned as trip blanks, measures of exposure during transportation to the laboratory. The cartridge was not opened or removed from the storage vial but was sent back to the laboratory along with the field samples. There were 22 trip blanks submitted for analysis.
In the case of the laboratory blank, a Radiello® 130 cartridge was extracted with each analytical batch to measure background from the sorbent and the extraction process. A total of 73 unique laboratory blanks were analyzed and reported over the duration of the project. To assist in data interpretation, all blank and field sample results were evaluated down to the method detection limit (MDL). The results of the field, trip, and laboratory blanks for the Radiello® 130 sampler are summarized in Table A1, Table A2 and Table A3. The number of blanks with detections above the reporting limit (RL) and MDL are tabulated. Summary statistics were then calculated on this subset of positive detections.
Hexane and toluene were commonly detected in the field, trip, and laboratory blanks above the MDL. In the case of the field blanks, several had concentrations above the RL for hexane and toluene. All detections in the trip and laboratory blanks were below the RL but above the MDL. Positive biases for benzene, hexane, and toluene were anticipated for the daily Radiello® 130 samples due to the blank levels. Sample concentrations were not adjusted for concentrations detected in any blank. For the daily passive samples, the average mass collected on the blank sorbent was 0.11, 0.10, and 0.04 µg for benzene, hexane, and toluene, respectively. A positive bias was expected for hexane for the weekly samples as well because the mass collected in the samples was generally less than 10 times the associated blank levels. Blank levels of toluene were not significant when evaluating the weekly samples because the mass collected in the samples was generally greater than 10 times the associated blank levels. Longer duration samples would normally collect more mass and thus would not be significantly affected.
No detections of chloroform or cis-1,2-dichloroethene (cis-1,2-DCE) were measured in any of the blanks. For a small percentage of the blanks, low-concentration detections above the MDL but below the RL were measured for PCE and TCE.
To monitor extraction efficiency, 5.0 µg of toluene-d8 was spiked into each field sample and quality control (QC) sample Radiello 130 cartridge immediately prior to extraction. The recoveries were evaluated against laboratory limits of 70% to 130%. All surrogate recoveries met the laboratory criterion, and summary statistics are presented in Table A4.
Accuracy of the extraction and analysis step for the target compounds was evaluated by analyzing a laboratory control sample (LCS). An unused Radiello cartridge was spiked with a standard containing 5.0 µg of each compound of interest. The laboratory acceptance criterion for LCS recovery was 70 to 130%. All LCS recoveries met the control limits of 70 to 130%, and summary statistics are presented in Table A5.
Sample precision was evaluated by collecting field duplicates and by analyzing laboratory control sample duplicates (LCSDs). Field duplicates were collected for approximately every 10 field samples, and an LCSD was prepared and analyzed with each sample analytical batch. Because the LCSD was a second cartridge prepared and extracted in the same manner as the LCS, the relative percentage difference (%RPD) represents the precision of the analytical method from extraction through analysis. The method precision data are summarized in Table A6 and Table A7. The laboratory acceptance criterion of %RPD < 25% for the field duplicates was met for all compounds except for TCE in one duplicate sample. The LCS/LCSD met the %RPD < 25% except for benzene in two analytical batches and hexane in five analytical batches.

2.4.2. SKC 575 Badge Sampler

A field/trip blank was collected using a blank SKC 575 badge sampler from the media sample batch sent to the field from the laboratory. The blank sampler was opened during preparation of field samples for deployment and then sealed and stored at ambient temperature until sample shipment. A total of 1 field blank was submitted over the duration of the project. In the case of the laboratory blank, a SKC 575 badge sampler was extracted with each analytical batch to measure background from the sorbent and the extraction process. A total of 2 laboratory blanks were analyzed and reported over the duration of the project. To assist in data interpretation, all blank samples and all field sample results were evaluated down to the MDL. The results of the QC samples for the SKC 575 badge samplers are summarized in Table A8 and Table A9. Summary statistics were then calculated on the subset of samples with positive detections. Benzene was detected in the field/trip and laboratory blank above the MDL. A positive bias for benzene was anticipated for the 6-month and 1-year SKC575 badge samples due to the blank levels. The average mass of benzene collected on the sorbent for the 6-month and 1-year SKC 575 badge samples was 0.94 and 1.2 ug/m3, respectively. No detections of any of the other target analytes were measured in any of the blanks.
Accuracy of the extraction and analysis step for the target compounds was evaluated by analyzing an LCS. An unused SKC 575 badge sampler was spiked with a standard containing 5.0 µg of each compound of interest. The laboratory acceptance criterion for LCS recovery was 70 to 130%. All LCS recoveries met the control limits of 70 to 130%, and summary statistics are presented in Table A10.
Sample precision was evaluated by collecting field duplicates and by analyzing LCSDs. Field duplicates were collected for approximately every 10 field samples, and an LCSD was prepared and analyzed with each sample preparation batch. Because the LCSD was a second badge that was prepared and extracted in the same manner as the LCS, the %RPD represents the precision of the analytical method from extraction through analysis. The method precision is summarized in Table A11 and Table A12. The laboratory acceptance criterion of %RPD < 25% was met for all compounds except for benzene, chloroform, and hexane in one field duplicate sample and hexane in two analytical batches.
To monitor extraction efficiency, 5.0 µg of toluene-d8 was spiked into each field sample and QC sample immediately prior to extraction. The recoveries were evaluated against laboratory limits of 70% to 130%. All surrogate recoveries met the laboratory criterion, and summary statistics are presented in Table A13.

2.4.3. WMSTM

A field/trip blank was collected using a blank WMSTM sampler from the media sample batch sent to the field from the laboratory. The blank sampler was opened during preparation of field samples for deployment and then sealed and stored at ambient temperature until sample shipment. A total of 1 field/trip blank was submitted over the duration of the project. Benzene was detected above the MDL but below the reporting limit. No other compounds were detected in the field/trip blank.
For a laboratory blank, a WMSTM sampler was extracted with each analytical batch to measure background from the sorbent and the extraction process. A total of 2 laboratory blanks were analyzed and reported over the duration of the project. To assist in data interpretation, all blank samples and all field sample results were evaluated down to the MDL. The results of the field and laboratory blanks for the WMSTM samplers are summarized in Table A14 and Table A15. Summary statistics were then calculated on the subset of sample with positive detections.
Benzene was the only target analyte detected in the one field/trip and the laboratory blanks above the MDL. The blank level of benzene is significant when evaluating the 6-month and 1-year samples with which it is associated, because the concentrations detected in the samples were less than 10 times the amount detected in the blank. No detections of chloroform, cis-1,2-DCE, hexane, toluene, PCE, or TCE were measured in any of the blanks. To monitor extraction efficiency, 5.0 µg of toluene-d8 was spiked into each field sample and QC sample WMS vial immediately prior to extraction. The recoveries were evaluated against laboratory limits of 70% to 130%. All surrogate recoveries met the laboratory criterion, and summary statistics are presented in Table A16.
Accuracy of the extraction and analysis steps for the target compounds was evaluated by analyzing an LCS. An unused WMSTM sampler was spiked with a standard containing 5.0 µg of each compound of interest. The laboratory acceptance criterion for LCS recovery was 70 to 130%. All LCS recoveries met the control limits of 70 to 130%, and summary statistics are presented in Table A17.
Sample precision was evaluated by collecting field duplicates and by analyzing LCSDs. Field duplicates were collected for approximately every 10 field samples, and an LCSD was prepared and analyzed with each sample preparation batch. Because the LCSD was a second cartridge prepared and extracted in the same manner as the LCS, the %RPD represents the precision of the analytical method from extraction through analysis. The method precision is summarized in Table A18 and Table A19. The laboratory acceptance criterion of %RPD < 25% was met for all compounds except for hexane in one field duplicate and one LCSD.
The WMSTM sample concentrations were adjusted for uptake rate variations due to temperature as recorded onsite by an Onset HOBO® data logging system placed on each wooden sample rack. All measurements were made in accordance with an approved quality assurance project plan. Although some deviations were identified, the deviances did not affect the interpretation of our results [17].

3. Results and Discussion

Concentrations of benzene, chloroform, hexane, PCE, toluene, and TCE ranged from 0.4 to 2.3, 0.1 to 4.0, 0.23 to 2.6, 0.1 to 22, 0.44 to 6.0, and 0.1 to 2.7 µg/m3, respectively. Several high PCE concentrations were identified when first initiating research at the Indianapolis test house. Removal of the highest PCE concentration samples led to typical PCE concentrations ranging from 0.1 to 2.2 µg/m3. Results below the detection limit in the individual weekly samples used for comparison to the longer duration samples were most common for TCE; thus, they introduced the greatest uncertainty in the evaluation of passive sampler performance for TCE.

3.1. Phase 1—Radiello® 130 Passive Sampler Duration Testing

If the effective uptake rate decreased with increasing sampling duration, the mean %Bias would be expected to be less for the shorter exposure periods than for the longer exposure periods (i.e., the longer exposure period samples would consistently underestimate the actual vapor concentration). In fact, this was the case. The mean %Bias was generally less for the shorter exposure periods than longer exposure periods for all six VOCs, with the exception of biweekly and monthly PCE and biweekly and semiannual toluene which had negative mean %Bias values (Table 1). These results are in agreement with the findings of Oury et al. [8]. When comparing the mean %Bias of the weekly samples to the mean %Bias of the biweekly samples, all six VOCs were within the acceptance limit of ±30%. As the comparison period lengthened to weekly versus monthly, quarterly, and semiannually, the number of compounds outside the acceptance criterion increased from one to three and then to four, respectively, indicating decreased sampler uptake rates with increased exposure time. Only toluene and PCE mean %Bias values were within the acceptance criterion for a full 1 year after initial sampler deployment. Chloroform and hexane had the overall greatest standard deviations with respect to the average of %Bias across all comparison periods, while toluene and PCE always had the smallest standard deviations.
To readily visualize the effects of longer-term exposure durations on the measurement of VOC concentrations, kernel density plots were created (Figure 2). The kernel density plots are approximations to the data probability distribution and are affected by sample size (n); therefore, caution should be used during interpretation when n < 30, as was the case for phase 2. For example, when examining the kernel density plot for chloroform, the peak after 2 weeks was within the ±30% acceptance criterion (i.e., between the solid red lines). After exposure for 1 month, the peak was nearly +30%, indicating that 1 month is about the limit for using a Radiello® 130 passive sampler with the white diffusive body at the relevant chloroform concentrations in the Indianapolis test house. This sorption capability limit for chloroform is supported numerically where the mean %Bias was 31.39%, just slightly above the acceptance criterion (Table 2). As the exposure period extended beyond 1 month, the peaks for 3 months, 6 months, and 1 year increasingly showed greater positive %Bias, well outside the acceptance criterion.
In contrast to chloroform, toluene and PCE %Bias values were within the acceptance criterion throughout the entire year, although a positive shift was identified for PCE with the 1-year exposure period (Figure 2). Hexane and benzene %Bias values appear to be acceptable for up to 3-month exposure periods, although numerically, the benzene mean %Bias was slightly above the acceptance criterion at 33.05% (Table 2). This apparent conflict indicates that the Radiello® 130 passive sampler with the white diffusive body was at its sorption capability limit at the relevant benzene concentrations in the Indianapolis test house at the end of the 3-month exposure period. A bimodal kernel density estimation was noted for TCE with the 3-month exposure period, with the first peak being within the acceptance limits while the second peak was outside the acceptance limits (Figure 2). The quarterly mean %Bias value for TCE was 34.17% (Table 2), indicating an approximate 1-month exposure limit for the Radiello® 130 passive sampler with the white diffusive body.
In general, the phase 1 %Bias data suggest that the stability of the uptake rate is a function of the compound’s volatility as measured by vapor pressure. The VOCs with higher vapor pressures shifted toward a positive bias at shorter exposure intervals than VOCs with lower vapor pressures. The maximum sampling exposure period, defined by meeting the mean %Bias acceptance criterion, follows the expected order from shortest to longest based on the compound’s volatility. The most volatile compound, chloroform, was the first VOC to exceed the average ±30% criterion, and exposure intervals could not be acceptably extended beyond 4 weeks. Benzene and TCE were similar in their volatility and essentially showed comparable performance in their %Bias data, exceeding the criterion at the quarterly exposure measurement. The two least volatile compounds, toluene and PCE, demonstrated a uniform uptake rate over the course of a year. Hexane was the exception to the volatility order, with steady uptake rates extending through the 3-month exposure period. Figure 3 shows that as the period of measurements increases from biweekly to annually, the number of %Bias satisfying the equivalency rate decreases for all VOCs except toluene. While these results may be generally interpreted in terms of volatility, this is not a perfect explanation, and it is likely that solubility in CS2 and sorption or partition coefficients into the sorbent may also play a role.
The charcoal sorbent cartridge in the Radiello® 130 passive sampler had sufficient capacity for a 52-week duration with mass loadings onto the cartridges well under the manufacturer’s recommended limit of 80 mg. The sum of the target VOC masses collected on the sampler for the year-long samples was less than 0.2 mg for all the samples, and the total mass on the samplers was estimated to be generally less than 1 mg. If VOC concentrations are significantly higher than what was measured at the Indianapolis test house, then additional considerations should be made regarding extending the sampling duration to ensure sampler capacity is not exceeded.

3.2. Phase 2—Passive Sampler 6-Month and 1-Year Testing

Phase 2 exposed the WMSTM, SKC 575 with secondary diffusive cover, and Radiello® 130 samplers with yellow diffusive bodies for 6- and 12-month exposure periods in the Indianapolis test house. Radiello® 130 passive samplers with white diffusive bodies were collocated with the other samplers and exposed for 1-week periods. Overall, reducing the uptake rate improved performance of passive samplers over the long-term durations. While sampler performance was evaluated against the ±30% acceptance criterion as compared to the weekly average of the Radiello® 130 passive samplers with the white diffusive bodies, the average VOC concentrations from three long-term samplers were typically within a factor of two of the weekly average VOC concentration over the same exposure periods (Table 3 and Table 4). Results for TCE were not included in the data evaluations for phase 2 of the study because the majority of detected concentrations were at or below the reporting limit.
The WMSTM had the lowest published uptake rate; however, it generally yielded the lowest concentration of the three passive samplers tested and was typically lower than the average 1-week Radiello® 130 passive sampler with the white diffusive body concentration for the same exposure period. The WMSTM had acceptable %Bias values for two out of three locations in the Indianapolis test house for benzene, toluene, and hexane when exposed for 6 months. The %Bias values continued to be within acceptance limits for toluene and hexane after 1 year. The WMS had %Bias values exceeding the 30% acceptance criteria at two of the three locations for chloroform and all three locations for PCE for the 6-month exposure, as well as all locations for chloroform and PCE for the 1-year exposure. It appears that the charcoal-based sorbent bed in the WMSTM may be better suited for the sampling of petroleum hydrocarbons than chlorinated solvents over these longer exposure periods.
The SKC 575 badge sampler had the next highest uptake rate and typically had the highest concentration relative to the other samplers and the weekly average, most specifically for toluene, of the Radiello® 130 white diffusive body sampler. After the 6-month exposure, the %Bias values for the SKC 575 sampler were nearly always within the ±30% acceptance limit except for benzene. These results were similar to findings by Oury et al. [8], who attributed the loss of benzene with longer exposure times to back diffusion from the sampler. In contrast, after 12 months, only hexane %Bias values were acceptable at all three sampling locations.
Uptake rates for the Radiello® 130 passive sampler with yellow diffusive bodies were estimated using the effective geometric constant of the yellow diffusive body and resulted in concentrations that were relatively accurate based on comparison to the weekly average concentrations. For chloroform and PCE, 6-month exposure times were always within the acceptance limits. Benzene was almost always within the acceptance limits after 6 months of exposure. After the 1-year exposure period, chloroform showed a strong positive bias, likely due to its weak adsorption to the sorbent bed and subsequent back diffusion. Interestingly, after 1 year, only hexane had acceptable %Bias values in two of the three sampling locations. Similarly, the WMSTM and SKC 575 passive samplers also showed a marked decrease in the effective uptake rate and subsequent elevated %Bias values for chloroform when exposed for 1 year.

4. Conclusions

4.1. Phase 1—Radiello® 130 Passive Sampler Duration Testing

The radial-style, charcoal-based passive sampler performance over exposure periods from 1 week to 1 year was dependent on the target compound. The charcoal-based sorbent cartridge had sufficient capacity for the 1-year exposure period with estimated loadings of less than 1 mg, which were well below the manufacturer’s recommended loading limit of 80 mg. Hence, sorptive capacity of the passive sampler was not a factor influencing the results. All VOCs showed excellent agreement between the mean %Bias of the 1-week and the 2-week samples, suggesting uniform uptake rates over this comparison period within the ±30% acceptance limit. The mean %Bias for chloroform was just outside the acceptance criterion after the 4-week exposure period. TCE uptake was constant up to an approximate 1-month exposure period but failed to meet the acceptance criterion after a 3-month exposure period. Benzene and hexane exhibited generally stable uptake rates through the monthly exposure period but failed to meet the acceptance criterion for the quarterly, semi-annual, and annual exposure periods. Toluene and PCE continued to demonstrate stable uptake rates after the quarterly, semiannual, and annual exposure periods and had %Bias values within the ±30% acceptance criterion.

4.2. Phase 2—Passive Sampler 6-Month and 1-Year Testing

The WMSTM, SKC 575, and Radiello® 130 passive samplers with yellow diffusive bodies were exposed for 6-month and 1-year periods, and the resultant VOC concentrations were compared to the average VOC concentrations from the Radiello® 130 passive samplers with white diffusive bodies that had been exposed for 1-week periods. Overall, the lower uptake rate associated with these three passive samplers improved performance (i.e., decreased the %Bias values) over the longer exposure periods. The SKC 575 sampler and the Radiello® 130 passive sampler with the yellow diffusive body generally produced acceptable results over the 6-month exposure period, while the WMSTM sampler with a charcoal-based sorbent bed appeared to be more suited for the collection of the petroleum hydrocarbons than the chlorinated solvents. After the 1-year exposure period, the overall passive sampler performances were inconsistent, except for hexane, which was acceptable for all three passive samplers. While passive sampler performance was evaluated against the ±30% acceptance criterion as compared to the weekly average of the Radiello® 130 passive samplers with the white diffusive bodies, the three long-term samplers evaluated had VOC concentrations that were typically within a factor of two of the weekly average concentration.
In general, the results suggest that all three samplers can produce acceptable results over long periods; however, customizing each sampler to site-specific conditions, for example, by empirically deriving uptake rates for specific environments, sampling durations, and analytes, may be necessary to optimize performance during a long-term study. If VOC concentrations are significantly higher than those measured at our test site, additional considerations should be made before extending the exposure period to ensure sampler sorptive capacity is not exceeded. These results show that extended sampling times with passive samplers can be a cost-effective tool for estimating chronic or sub-chronic exposure for selected VOCs.

Author Contributions

Conceptualization, J.H.Z. and B.S.; methodology, J.H.Z., B.S., C.C.L. and H.H.; validation, J.H.Z., C.C.L. and H.H.; formal Analysis, J.H.Z., C.C.L. and B.C.; investigation, J.H.Z., B.S., C.C.L. and B.C.; writing—original draft preparation, J.H.Z., B.S., C.C.L. and B.C.; writing—review and editing, J.H.Z., B.S., C.C.L., B.C. and H.H.; visualization, C.C.L. and B.C.; supervision, J.H.Z., B.S. and C.C.L.; project administration, B.S. and C.C.L.; funding acquisition, B.S. and J.H.Z. All authors have read and agreed to the published version of the manuscript.

Funding

The United States Environmental Protection Agency, through its Office of Research and Development, funded, managed, and collaborated in the research described here under contract EP-C-11-036 to RTI International. The APC was funded by United States Environmental Protection Agency.

Data Availability Statement

The original data presented in the study are openly available at DATA.gov or DOI: 10.23719/1528744.

Acknowledgments

The authors would like to thank, for their valuable contributions during field sampling, sample analysis, and data interpretation, Alan Williams (US EPA), Ausha Scott (Eurofins Air Toxics), Sara Jonker (ARCADIS), Breda Munoz (RTI), Robert Norberg (RTI), and Nathan Yates (RTI). A special thank you to Leigh Riley Evans, Executive Director of Mapleton-Fall Creek Development Corporation, the non-profit organization that provided us with unlimited access to the Indianapolis test house used in this study. The authors have reviewed and edited the output and take full responsibility for the content of this publication.

Conflicts of Interest

Authors John H. Zimmerman and Brian Schumacher were employed by the U.S. Environmental Protection Agency. Authors Christopher C. Lutes and Brian Cosky were employed by the company Jacobs Engineering. Author Heidi Hayes was employed by Eurofins Environment Testing Northern California, LLC. The authors declare that the research was conducted in the absence of any commercial or financial relationships that could be construed as a potential conflict of interest. It has been subjected to Agency review and approved for publication. The views expressed in this manuscript are those of the author and do not necessarily represent the views or policies of the U.S. Environmental Protection Agency. Any mention of trade names or commercial products does not constitute EPA endorsement or recommendation for use.

Abbreviations

The following abbreviations are used in this manuscript:
VOCsvolatile organic compounds
VIvapor intrusion
TCEtrichloroethylene
PCEperchloroethylene
WMSTMWaterloo Membrane SamplerTM
HVACheating, ventilation, and air conditioning
RSDrelative standard deviation
BTEXbenzene, toluene, ethylbenzene, and xylene
MDLmethod detection limit
GC/MSgas chromatography–mass spectrometry
TDthermal desorption
RLreporting limit
cis-1,2-DCEcis-1,2-dichloroethene
US EPAUS Environmental Protection Agency
Lliters
LCSlaboratory control sample
%Biasrelative percent difference
QCquality control
LCSDslaboratory control sample duplicates
CS2carbon disulfide

Appendix A

Table A1. Indoor air passive field blank summary—Radiello® 130.
AnalyteRL (µg)Number of Field Blanks% of Field Blanks with DetectionsMean Blank Conc. (µg)Std Dev (µg)Min (µg)Max (µg)
AnalyzedConc. > RLRL > Conc. > MDL
Benzene0.44703881%0.110.0420.0400.18
Chloroform0.147000%NANANANA
cis-1,2-DCE0.147000%NANANANA
Hexane0.1474928%0.0990.0910.0330.35
PCE0.147029%0.0320.0200.00670.049
Toluene0.14712147%0.0400.0360.0140.17
TCE0.1470511%0.0150.00930.00640.031
RL = reporting limit; MDL = method detection limit; Std Dev = standard deviation; NA = not applicable.
Table A2. Indoor air passive trip blank summary—Radiello® 130.
AnalyteRL (µg)Number of Trip Blanks% of Trip Blanks with DetectionsMean Blank Conc. (µg)Std Dev (µg)Min (µg)Max (µg)
AnalyzedConc. > RLRL > Conc. > MDL
Benzene0.42202091%0.100.0390.0420.16
Chloroform0.122000%NANANANA
cis-1,2-DCE0.122000%NANANANA
Hexane0.12201045%0.0490.0120.0360.07
PCE0.122029%0.0150.0090.00870.022
Toluene0.12201882%0.0200.0080.0120.041
TCE0.1220418%0.0240.01590.00940.043
RL = reporting limit; MDL = method detection limit; Std Dev = standard deviation; NA = not applicable.
Table A3. Indoor air passive laboratory blank summary—Radiello® 130.
AnalyteRL (µg)Number of Lab Blanks% of Lab Blanks with DetectionsMean Blank Conc. (µg)Std Dev (µg)Min (µg)Max (µg)
AnalyzedConc. > RLRL > Conc. > MDL
Benzene0.47306792%0.120.0430.0390.22
Chloroform0.173000%NANANANA
cis-1,2-DCE0.173000%NANANANA
Hexane0.17301825%0.0530.0190.0340.083
PCE0.173023%0.00810.000420.00780.0084
Toluene0.17305271%0.0250.0140.0120.064
TCE0.173046%0.0220.00680.0130.027
RL = reporting limit; MDL = method detection limit; Std Dev = standard deviation; NA = not applicable.
Table A4. Indoor air passive surrogate summary—Radiello® 130.
ParameterResult
Number of surrogate recoveries measured1255
Average recovery (%R)102.8
Standard deviation (%R)5.9
Minimum recovery (%R)87
Maximum recovery (%R)122
Table A5. Indoor air passive laboratory control sample (LCS) summary—Radiello® 130.
AnalyteNumber of LCS AnalyzedMean LCS % RecoveryLCS Std Dev (%R)Min (%R)Max (%R)
Benzene739311.071116
Chloroform739611.570122
cis-1,2-DCE73958.772121
Hexane7310114.671130
PCE73989.873125
Toluene73949.873117
TCE73978.673118
Table A6. Indoor air passive field duplicate summary—Radiello® 130.
AnalyteNumber of Field Duplicates AnalyzedMeanStd Dev. (%RPD)Min (%RPD)Max (%RPD)Number of Exceedances
%RPD
Benzene44.82.91.98.40
Chloroform46.22.54.0110
cis-1,2-DCE4NDNANANANA
Hexane4149.50250
PCE45.83.80110
Toluene45.23.208.70
TCE47.8110271
ND = not detected, NA = not applicable.
Table A7. Indoor air passive laboratory precision (LCS/LCSD) summary—Radiello® 130.
AnalyteNumber of LCSD AnalyzedMean%RPDStd Dev. (%RPD)Min (%RPD)Max (%RPD)Number of Exceedances
Benzene739%8%0%29%2
Chloroform7310%7%0%25%0
cis-1,2-DCE735%4%0%19%0
Hexane7311%9%0%37%5
PCE735%4%0%19%0
Toluene735%4%0%19%0
TCE735%4%0%14%0
Table A8. Indoor air passive field/trip blank summary—SKC 575.
AnalyteRL (µg/m3)Field/Trip Blank (µg/m3)
Benzene0.150.098 J
Chloroform0.0390.039 U
cis-1,2-DCE0.0340.034 U
Hexane0.0410.041 U
PCE0.0390.039 U
Toluene0.0440.044 U
TCE0.0340.034 U
J—Estimated value, U—Compound analyzed for but not detected above the reporting limit.
Table A9. Indoor air passive laboratory blanks summary—SKC 575.
Analyte Number of Lab Blanks% of Lab Blanks with DetectionsMean Blank Conc. (µg/m3)Std Dev (µg/m3)Min (µg/m3)Max (µg/m3)
RL (µg)AnalyzedConc. > RLRL > Conc. > MDL
Benzene0.4202100%0.070.040.030.11
Chloroform0.12000%NDNANANA
cis-1,2-DCE0.12000%NDNANANA
Hexane0.12000%NDNANANA
PCE0.12000%NDNANANA
Toluene0.12000%NDNANANA
TCE0.12000%NDNANANA
ND = not detected, NA = not applicable.
Table A10. Indoor air passive LCS samples summary—SKC 575.
AnalyteNumber of LCS AnalyzedMean LCS % RecoveryLCS Std Dev (%R)Min (%R)Max (%R)
Benzene29178498
Chloroform29529397
cis-1,2-DCE29619596
Hexane2921478105
PCE21033100105
Toluene2101695107
TCE21044100107
Table A11. Indoor air passive field duplicate samples summary—SKC 575.
AnalyteNumber of Sample Duplicates AnalyzedMeanStd Dev. (%RPD)Min (%RPD)Max (%RPD)Number of Exceedances
%RPD
Benzene2105.44.2151
Chloroform216114.7261
cis-1,2-DCE2NDNANANANA
Hexane28.65.23141
PCE20.70.701.30
Toluene200000
TCE26.03.12.99.20
ND = not detected, NA = not applicable.
Table A12. Indoor air passive laboratory precision (LCS/LCSD) summary—SKC 575.
AnalyteNumber of LCSD AnalyzedMeanStd Dev. (%RPD)Min (%RPD)Max (%RPD)Number of Exceedances
%RPD
Benzene2123.87.7150
Chloroform2142.411160
cis-1,2-DCE22.71.61.04.30
Hexane2415.236462
PCE22.02.00.04.10
Toluene20.90.90.01.90
TCE22.00.11.92.00
Table A13. Indoor air passive surrogate summary—SKC 575.
ParameterResult
Number of surrogate recoveries measured15
Average recovery (%R)109
Standard deviation (%R)5.8
Minimum recovery (%R)102
Maximum recovery (%R)115
Table A14. Indoor air passive field/trip blank summary—WMSTM.
AnalyteRL (µg/m3)Blank Conc. (µg/m3)
Benzene0.360.24 J
Chloroform0.0980.098 U
cis-1,2-DCE0.100.10 U
Hexane0.590.59 U
PCE0.0360.036 U
Toluene0.0450.045 U
TCE0.0580.058 U
RL = reporting limit; J = estimated value. U = Compound analyzed for but not detected above the reporting limit.
Table A15. Indoor air passive laboratory blank summary—WMSTM.
Analyte Number of Lab Blanks% of Lab Blanks with DetectionsMean Blank Conc. (ug/m3)Std Dev (ug/m3)Min (ug/m3)Max (ug/m3)
RL (ug/m3)AnalyzedConc. > RLRL > Conc. > MDL
Benzene0.3620150%0.27 JNA0.270.27
Chloroform0.102000%0.10 UNANANA
cis-1,2-DCE0.102000%0.10 UNANANA
Hexane0.592000%0.59 UNANANA
PCE0.0362000%0.036 UNANANA
Toluene0.0452000%0.045 UNANANA
TCE0.0582000%0.058 UNANANA
RL = reporting limit; MDL = method detection limit; Std Dev = standard deviation; J—Estimated value, U—Compound analyzed for but not detected above the reporting limit; NA = not applicable.
Table A16. Indoor air passive surrogate summary—WMSTM.
ParameterResult
Number of surrogate recoveries measured18
Average recovery (%R)108
Standard deviation (%R)5.3
Minimum recovery (%R)102
Maximum recovery (%R)116
Table A17. Indoor air passive laboratory control sample (LCS) summary—WMSTM.
AnalyteNumber of LCS AnalyzedMean LCS % RecoveryLCS Std Dev (%R)Min (%R)Max (%R)Number of Exceedances
Benzene2929831010
Chloroform294193940
cis-1,2-DCE2982961000
Hexane288682930
PCE21002981010
Toluene21023991050
TCE210611051070
Table A18. Indoor air passive field duplicates summary—WMSTM.
AnalyteNumber of Field Duplicates AnalyzedMeanStd Dev. (%RPD)Min (%RPD)Max (%RPD)Number of Exceedances
%RPD
Benzene23.812.74.90
Chloroform27.325.78.90
cis-1,2-DCE2NDNANANANA
Hexane2362116571
PCE21.51.503.00
Toluene20.60.601.30
TCE22.72.705.40
ND = not detected, NA = not applicable.
Table A19. Indoor air passive laboratory precision (LCS/LCSD) summary—WMSTM.
AnalyteNumber of LCSD AnalyzedMeanStd Dev. (%RPD)Min (%RPD)Max (%RPD)Number of Exceedances
%RPD
Benzene21051.9140
Chloroform21138.2140
cis-1,2-DCE2201.020
Hexane225177.8421
PCE2211.020
Toluene2110.020
TCE2000.010

References

  1. Bertoni, G.; Tappa, R.; Allegrini, I. Internal consistence of the new “Analyst” diffusive sampler: A long-term field test. Diffus. Monit. 2001, 12, 2–5. [Google Scholar] [CrossRef]
  2. Brown, V.; Crump, D. Appropriate sampling strategies to characterize VOCs in indoor air using diffusive samplers. In Proceedings of the International Conference on VOCs, London, UK, 27–28 October 1993. [Google Scholar]
  3. US EPA (United States Environmental Protection Agency). Compendium of Methods for the Determination of Toxic Organic Compounds in Ambient Air, Second Edition, Compendium Method TO-14A: Determination of Volatile Organic Compounds (VOCs) in Ambient Air Using Specially Prepared Canisters with Subsequent Analysis by Gas Chromatography; EPA/625/R-96/010b; U.S. Environmental Protection Agency: Washington, DC, USA, 1999.
  4. US EPA. Compendium of Methods for the Determination of Toxic Organic Compounds in Ambient Air Second Edition Compendium Method TO-15 Determination of Volatile Organic Compounds (VOCs) in Air Collected in Specially Prepared Canisters and Analyzed by Gas Chromatography Mass Spectrometry (GC/MS); EPA/625/R-96/010b; U.S. Environmental Protection Agency: Washington, DC, USA, 1999.
  5. US EPA. Compendium of Methods for the Determination of Toxic Organic Compounds in Ambient Air, Second Edition, Compendium Method TO-17, Determination of Volatile Organic Compounds in Ambient Air Using Active Sampling onto Sorbent Tubes; EPA/625/R-96/010b; U.S. Environmental Protection Agency: Washington, DC, USA, 1999.
  6. Marotta, L.; Snow, M.; Varisco, S. Extending the Hydrocarbon Range Above Naphthalene for Soil Vapor and Air Samples Using Automated Thermal Desorption/Gas Chromatography/Mass Spectrometry (ATD/GC/MS). In Proceedings of the National Environmental Monitoring Conference, Washington, DC, USA, 5 December 2024. [Google Scholar]
  7. Kaltenberg, E.; James, R.; Schumacher, B.; Barnett, F.; McKernan, J. Engineering Issue Paper: Passive Samplers for Supporting Vapor Intrusion Investigations; EPA/600/R-23/327; U.S. Environmental Protection Agency: Washington, DC, USA, 2024. [Google Scholar]
  8. Oury, B.; Lhuillier, F.; Protois, J.; Moréle, Y. Behavior of the GABIE, 3M3500, PerkinElmer Tenax TA, and RADIELLO 145 diffusive samplers exposed over a long time to a low concentration of VOCs. J. Occup. Environ. Hyg. 2006, 3, 547–557. [Google Scholar] [CrossRef] [PubMed]
  9. Begerow, J.; Jermann, E.; Keles, T.; Dunemann, L. Performance of two different types of passive samplers for the GC/ECD-FID determination of environmental VOC levels in air. Int. J. Anal. Chem. 1999, 363, 399–403. [Google Scholar] [CrossRef]
  10. Cocheo, C.; Boaretto, C.; Pagani, D.; Quaglio, F.; Sacco, P.; Zaratin, L.; Cottica, D. Field evaluation of thermal and chemical desorption BTEX radial diffusive sampler Radiello® compared with active (pumped) samplers for ambient air measurements. J. Environ. Monitor. 2009, 11, 297–306. [Google Scholar] [CrossRef] [PubMed]
  11. Lutes, C.C.; Uppencamp, R.; Hayes, H.; Greenwell, D.; Mosley, R. Long-term integrated samplers for indoor air and sub-slab soil gas at VI sites. In Proceedings of the 2010 Battelle Conference, Monterey, CA, USA, 24–27 May 2010; Available online: https://projects.battelle.org/chlorinated-conference/2010Chlor_Proceedings/Papers/G-040_Abs.pdf (accessed on 29 July 2025).
  12. Lutes, C.C.; Uppencamp, R.; Hayes, H.; Mosley, R.; Greenwell, D. Long-term integrating samplers for indoor air and subslab soil gas at VI sites. In Proceedings of the Presentation at the AWMA Specialty Conference: Vapor Intrusion 2010; Chicago, IL, USA, 28–30 September 2010. Available online: https://cfpub.epa.gov/si/si_public_file_download.cfm?p_download_id=500428&Lab=NRMRL (accessed on 29 July 2025).
  13. Mosley, R.B.; Greenwell, D.; Lutes, C.C. Use of integrated indoor concentrations of tracer gases and volatile organic compounds (VOCs) to distinguish soil sources from above-ground sources. In Proceedings of the 2010 Battelle Conference, Monterey, CA, USA, 24–27 May 2010. [Google Scholar]
  14. McAlary, T.; Groenevelt, H.; Seethapathy, S.; Sacco, P.; Crump, D.; Tuday, M.; Schumacher, B.; Hayes, H.; Johnson, P.; Górecki, T. Quantitative passive soil vapor sampling for VOCs-part 2: Laboratory experiments. Environ. Sci. Process. Impact. 2014, 16, 491–500. [Google Scholar] [CrossRef] [PubMed]
  15. McAlary, T.; Groenevelt, H.; Nicholson, P.; Seethapathy, S.; Sacco, P.; Crump, D.; Tuday, M.; Hayes, H.; Schumacher, B.; Johnson, P.; et al. Quantitative passive soil vapor sampling for VOCs-part 3: Field experiments. Environ. Sci. Process. Impact. 2014, 16, 501–510. [Google Scholar] [CrossRef] [PubMed]
  16. US EPA. Project Report, Fluctuation of Indoor Radon and VOC Concentrations Due to Seasonal Variations; EPA/600/R-12/673; U.S. Environmental Protection Agency: Las Vegas, NV, USA, 2012.
  17. US EPA. Assessment of Mitigation Systems on Vapor Intrusion; EPA/600/R-13/241; U.S. Environmental Protection Agency: Las Vegas, NV, USA, 2015. [Google Scholar]
  18. Sigma-Aldrich. Radiello Manual, Volatile Organic Compounds (VOCs) Chemically Desorbed with CS2, Supelco Edition. Available online: https://hpst.cz/sites/default/files/download/2023/05/radiello_manual_final.pdf (accessed on 14 July 2025).
  19. SKC Passive Sampler VOC 575 Selection Guide. Available online: https://weber.hu/Downloads/SKC/SKC_PassiveSampling_Rates_575.pdf (accessed on 14 July 2025).
  20. Waterloo Membrane Sampler, Sirem Labs. Available online: https://www.siremlab.com/waterloo-membrane-sampler/ (accessed on 14 July 2025).
  21. Williams, A. (US EPA, Research Triangle Park, NC, USA); ICS MAUGERI—Centro di Ricerche Ambientali (ICS Maugeri SpA SB, Vigonza, Italy). Personal communication, 2024.
  22. US EPA. “Method 8260D (SW-846): Volatile Organic Compounds by Gas Chromatography/Mass Spectrometry (GC/MS)” Revision 3; U.S. Environmental Protection Agency: Washington, DC, USA, 2006.
Figure 1. Street view of Indianapolis test house (Photo courtesy of US EPA).
Environments 12 00267 g001
Figure 2. Kernel densities of %Bias for VOCs in the Indianapolis test house. The dotted red line represents a %Bias of zero, and the solid red lines bracket the study acceptance criterion of ± 30%.
Environments 12 00267 g002
Figure 3. The effect of vapor pressure on sorbent performance.
Environments 12 00267 g003
Table 1. Specifications for SKC 575, WMS, and Radiello 130 with white/yellow diffusive bodies.
SamplerSKC 575WMSRadiello 130, White BodyRadiello 130,
Yellow Body
Type and Mass of SorbentsAnasorb CSC, 350 mgAnasorb 747®, 165 mgActivated charcoal (30–50 mesh), 530 ± 30 mgActivated charcoal (30–50 mesh), 530 ± 30 mg
Diffusion MediaNylonpolydimethylsiloxane (PDMS) membraneMicroporous polyethylene 1.7 mm thick and average porosity 25 ± 5 µm. Diffusive path length is 18 mm.Microporous polyethylene 5 mm thick and average porosity 10 ± 2 µm. Diffusive path length is 150 mm.
DimensionsDiameter: 1.4 in (3.5 cm); length (including clip): 2.5 in (6.3 cm); depth: 0.6 in (1.5 cm)1.8 mL crimp top glass vial60 mm length and 4 mm diameter60 mm length and 4 mm diameter
Sample uptake Rates (mL/min)
Benzene16.0 a2.2 b80 c27 d
Hexane14.3 a1.5 b66 c23 d
TCE14.9 a2.6 b69 c24 d
PCE13.1 a5.4 b59 c20 d
a [18]; b [19]; c [20]; d Calculated from sample uptake rate for Radiello 130 with white diffusive body times the ratio of the geometric constants of the yellow diffusive body to the white diffusive body (ratio = 0.34256) as per [21].
Table 2. Summary statistics for %Bias by exposure period and VOC.
Exposure Periodsn a%Bias bStandard
Deviation
Weekly vs. Biweekly
Benzene1757.7416.98
Chloroform17511.1518.55
Hexane1752.7518.85
Tetrachloroethylene175−0.4411.78
Toluene175−0.0212.13
Trichloroethylene17510.9817.23
Weekly vs. Monthly
Benzene8413.3916.80
Chloroform8431.3926.89
Hexane8411.3320.00
Tetrachloroethylene84−0.4710.89
Toluene840.0310.68
Trichloroethylene8419.0917.65
Weekly vs. Quarterly
Benzene2833.0514.83
Chloroform2888.2943.58
Hexane2823.0519.29
Tetrachloroethylene285.8810.82
Toluene282.3712.03
Trichloroethylene2834.1715.94
Weekly vs. Semiannual
Benzene1439.4810.89
Chloroform14147.0036.58
Hexane1431.6116.71
Tetrachloroethylene142.9312.44
Toluene14−4.8411.41
Trichloroethylene1461. 711.91
Weekly vs. Annual
Benzene760.817.91
Chloroform7172.308.45
Hexane767.1918.10
Tetrachloroethylene722.377.54
Toluene70.807.77
Trichloroethylene769.307.25
an = number of samples. b—yellow shaded boxes within the ±30% acceptance limit.
Table 3. Indianapolis test house 6-month passive sampler concentration comparison (µg/m3).
VOC Concentration (µg/m3)%Bias (Against Weekly Avg.)
LocationWMSTMSKC 575 aRadiello® 130 YellowRadiello® 130 White Weekly AverageWMSTMSKC 575Radiello® 130 Yellow
Benzene
422 Base S0.600.580.520.8737%41%50%
422 First0.650.660.710.8324% b22%16%
420 Base S0.630.600.680.8327%33%20%
Toluene
422 Base S0.791.21.20.9821%−22%−20%
422 First0.711.21.50.9832%−22%−42%
420 Base S0.841.21.40.9512%−20%−38%
Hexane
422 Base S0.350.400.520.50−30%−21%4%
422 First0.260.520.790.52−50%−1%52%
420 Base S0.610.590.830.4924%20%69%
Chloroform
422 Base S0.470.940.600.6024%−44%0%
422 First0.150.400.350.3272%−22%−9%
420 Base S c0.100.160.130.1752%4%27%
Tetrachloroethylene
422 Base S0.611.10.960.9443%−12%−2%
422 First0.260.520.620.4758%−11%−28%
420 Base S0.140.230.270.2244%−4%−20%
a—Used published outdoor uptake rates as more representative of basement indoor duplex conditions. b—Yellow boxes indicate value within ±30% acceptance limit. c—Percent bias calculations influenced by high number of nondetects in Radiello 130® white passive sampler weekly averages.
Table 4. Indianapolis test house 1-year passive sampler concentration comparison (µg/m3).
VOC Concentration (µg/m3)%Bias (Against Weekly Avg.)
LocationWMSTMSKC 575 aRadiello® 130 YellowRadiello® 130 White Weekly AverageWMSTMSKC 575Radiello® 130 Yellow
Benzene
422 Base S0.360.490.470.8884%57%61%
422 First0.350.520.560.8280%44%38%
420 Base S0.350.480.520.7573%43%36%
Toluene
422 Base S1.01.51.61.215% b−27%−32%
422 First0.931.51.81.06%−43%−58%
420 Base S0.991.61.71.112%−34%−41%
Hexane
422 Base S0.620.500.550.56−10%13%2%
422 First0.650.440.670.51−23%15%−26%
420 Base S0.400.640.750.5124%−23%−38%
Chloroform
422 Base S0.170.170.0190.5099%98%185%
422 First0.100.140.0220.31102%75%173%
420 Base S c0.0480.0530.0140.1073%64%152%
Tetrachloroethylene
422 Base S0.330.570.540.8891%43%48%
422 First0.160.310.330.4697%38%33%
420 Base S0.0940.170.180.1969%14%7%
a—Used published outdoor uptake rates as more representative of basement indoor duplex conditions. b—Yellow boxes indicate value within ±30% acceptance limit. c—Percent bias calculations influenced by high number of nondetects in Radiello® 130 white passive sampler weekly averages.
Disclaimer/Publisher’s Note: The statements, opinions and data contained in all publications are solely those of the individual author(s) and contributor(s) and not of MDPI and/or the editor(s). MDPI and/or the editor(s) disclaim responsibility for any injury to people or property resulting from any ideas, methods, instructions or products referred to in the content.

