Article

A Rapid Method for Identifying Plant Oxidative Stress and Implications for Riparian Vegetation Management

1
Graduate School of Science and Engineering, Saitama University, Saitama 338-8570, Japan
2
School of Earth, Environmental and Marine Sciences, University of Texas Rio Grande Valley, Brownsville, TX 78520, USA
3
Hydro Technology Institute, Shimo-Meguro, Tokyo 153-0064, Japan
4
Research and Development Center, Nippon Koei, Tsukuba 300-1259, Japan
5
Department of Agronomy, Bangladesh Agricultural University, Mymensingh 2202, Bangladesh
6
Committee of Arakawa Taroemon Nature Restoration Project, Saitama 350-1124, Japan
7
Next Eco, Nishi-gotanda, Tokyo 141-0031, Japan
8
Faculty of Law, Department of Law, Soka University, Tokyo 192-8577, Japan
*
Authors to whom correspondence should be addressed.
Environments 2025, 12(7), 247; https://doi.org/10.3390/environments12070247
Submission received: 11 June 2025 / Revised: 15 July 2025 / Accepted: 15 July 2025 / Published: 17 July 2025

Abstract

Native and invasive plants of the riverain region undergo a range of environmental stresses that result in excess reactive oxygen species (ROS). Hydrogen peroxide (H2O2) is a relatively stable and quickly quantifiable way among different ROS. The herbaceous species including Artemisia princeps, Sicyos angulatus, and Solidago altissima were selected. The H2O2 and photosynthetic pigment of leaves were measured, soil samples were analyzed to quantify macronutrients such as total nitrogen (TN), total phosphorus (TP), and soil moisture, and photosynthetic photon flux density (PPFD) was also recorded at different observed sites of Arakawa Tarouemon, Japan. The H2O2 concentration of S. altissima significantly increased with high soil moisture content, whereas A. Princeps and S. angulatus significantly decreased with high soil moisture. In each species, H2O2 was negatively correlated with chlorophyll a (chl a) and chlorophyll b (chl a). When comparing different parameters involving TN, TP, PPFD, and soil moisture content with H2O2 utilizing the general additive model (GAM), only soil moisture content is significantly correlated with H2O2. Hence, this study suggests that H2O2 would be an effective biomarker for quantifying environmental stress within a short time, which can be applied for riparian native and invasive plant species vegetation regulation.

1. Introduction

Riverine and coastal ecosystems depend heavily on riparian vegetation, providing ecological, hydrological, and socio-economic advantages. They help to stabilize riverbanks through their deep-rooted systems, reduce erosion, provide sedimentation [1,2], act as a natural buffer against flooding [3], can provide biodiversity hotspots [4], filter pollutants, such as agricultural effluent [5], aid with carbon sequestration [6], hold cultural and spiritual significance [7], provide habitats for various aquatic and terrestrial species [8], and so on, especially in Japan. Human disturbances, such as urbanization, can severely affect the ecology of riverine zones [9] and agricultural practices like nutrient runoff, and can influence pesticide contamination [10], drought [11], rainfall [12], temperature changes [13], and the abundance of invasive species, like Solidago altissima L. [14] and Sicyos angulatus L. [15]. It is essential to preserve and restore these zones to maintain biodiversity and human communities.
Biological diversity and ecological resilience are dependent on maintaining a balanced relationship between native and invasive species. The presence of native plants in ecosystems contributes to the improvement of the conditions and the maintenance of water and soil quality. Riparian zones can support both native and invasive species; however, uncontrolled invasive growth can threaten the ecological and biological benefits of riparian ecosystems. Artemisia princeps Pamp. is a native species, meanwhile S. angulatus and S. altissima are invasive in Japan. Environmental elements that have a substantial impact on both native and invasive species separately and collectively in ecosystems include soil moisture, total nitrogen (TN), total phosphorus (TP), and solar radiation [16,17,18,19,20]. Riparian vegetation management requires monitoring both native and invasive plants.
Soil moisture has a direct effect on photosynthesis, nutrient uptake, and general plant growth. In extreme droughts, riparian species require adequate moisture, and variations in moisture regimes can alter biodiversity and community composition [21]. Depending on the species, some native riparian species prefer moister soils, whereas others are able to tolerate drier soils [22]. Riparian zones can therefore be affected by changes in soil moisture. Riparian ecosystems are highly dependent on soil moisture to maintain their biodiversity. In addition to improving habitat quality, diverse plant communities can also support a wide range of wildlife species [23]. Riparian zones support species adapted to a wide range of moisture regimes, from those favoring low soil moisture to others thriving in consistently wet environments, and it can be challenging to explore the specific environmental conditions that best support each type, and it can be difficult to assess which conditions will benefit which species.
Soil macronutrients comprising TN and TP and their ratio (TN:TP) are essential factors influencing the growth, composition, and dynamics of riparian vegetation in Japan. Flood disruptions prevent sediment accumulation in a riparian zone from developing properly, reducing its nutrient level [24,25]. In riparian zones, the biogeochemical cycling of these nutrients affects both terrestrial and aquatic plants [26]. Riparian vegetation absorbs nutrients from streams to regulate their intake, influencing algal and phytoplankton growth downstream [27]. Despite the benefits of adequate nitrogen and phosphorus levels for native plants, excessive fertilization can result in eutrophication and shifts towards the dominance of invasive species. Thus, it is always necessary to address species-specific concerns when managing vegetation communities.
Invasive and native plants respond to solar intensity variation in response to environmental stress. Hydrogen peroxide (H2O2) is a key product of reactive oxygen species (ROS). When plants’ photosynthetic machinery is overloaded by high solar radiation, especially ultraviolet (UV) light, the chloroplasts produce more ROS, such as H2O2. Although H2O2 can operate as a signaling molecule at low concentrations to trigger stress response systems, at elevated concentrations, oxidative stress occurs, causing damage to proteins, membranes, and chlorophyll. Degradation of the chlorophyll caused by this oxidative damage might hinder the plant’s capacity to absorb light effectively, which lowers photosynthetic efficiency and growth in general. Native plant species frequently lack the strong antioxidant systems needed to efficiently detoxify high ROS, since they have developed in favorable circumstances. It has been observed when native species, particularly A. princeps, are subjected to environmental stress, their photosynthesis significantly decreases, which reduces the capacity to compete in rapidly changing environments [28]. In contrast, a lot of invasive species have developed more effective scavenging methods for ROS due to their increased quantities of antioxidant enzymes, consisting of superoxide dismutase, catalase, and peroxidase, which help neutralize H2O2 into harmless byproducts. This allows invasive species, notably S. altissima and S. angulatus, to continue their photosynthesis and retain their chlorophyll content even in the face of oxidative stress or excessive solar radiation [29,30]. Furthermore, the accumulation of photoprotective substances by invading species, including flavonoids and carotenoids, also lessens the strain on the photosynthetic machinery and guards against damage to photosystem II (PSII). Invasive plants have a major advantage because of their capacity to withstand ROS and intense light when it comes to colonizing new places and adjusting to climate change stressors like rising temperatures and fluctuating solar radiation quantified as photosynthetic photon flux density (PPFD) [31]. Consequently, in these regions, invading plants can frequently outcompete native species, changing the architecture of plant communities and possibly decreasing biodiversity. In ecosystems, particularly Japan’s riparian zones, an understanding of these physiological variations is crucial for ecosystem management because it guides methods to limit invasive populations while bolstering the adaptability of native species.
Numerous techniques are used to assess oxidative stress in plants, with variations in research duration and complexity. Long-term observation across several growing seasons is necessary for phenotypic trait observations [32] and utilizing antioxidant enzyme activities techniques [33], which evaluate morphological, growth, and reproductive production changes under stress. Research on stress-induced genetic alterations and their effects on plant resistance can take more than a year to complete using genomic and epigenetic techniques [34]. Additionally, investigating the effectiveness of utilizing water- and drought-resistant qualities requires extensive research spanning to evaluate long-term adaptive strategies [35]. Contrary to the methods above, H2O2 measurement is a fast and straightforward technique for assessing oxidative stress, providing results within hours or days [36]. It can be achieved by adopting colorimetric assays like the titanium sulfate Ti(SO4)2 method, which is convenient, reliable, and easy to execute [37]. H2O2 buildup is one of the most commonly used ROS as an oxidative stress marker in a variety of plant stress studies, including those involving trees, shrubs, crops, macrophytes, and microorganisms [38,39,40,41,42,43]. H2O2 is more stable and can be measured experimentally with reduced losses compared to other types of ROS such the hydroxyl radical (OH) and superoxide radical (O2−) [44,45]. Therefore, H2O2 would be used for monitoring how plants react to the degree of environmental stress and as an indicator of their physiological state.
The current study’s objectives are to (a) quickly assess plant oxidative stress by measuring the effects of environmental stressor parameters using H2O2 concentrations as an indicator; and (b) investigate species-specific conditions that are appropriate for managing riparian vegetation in both native and invasive plant species.

2. Materials and Methods

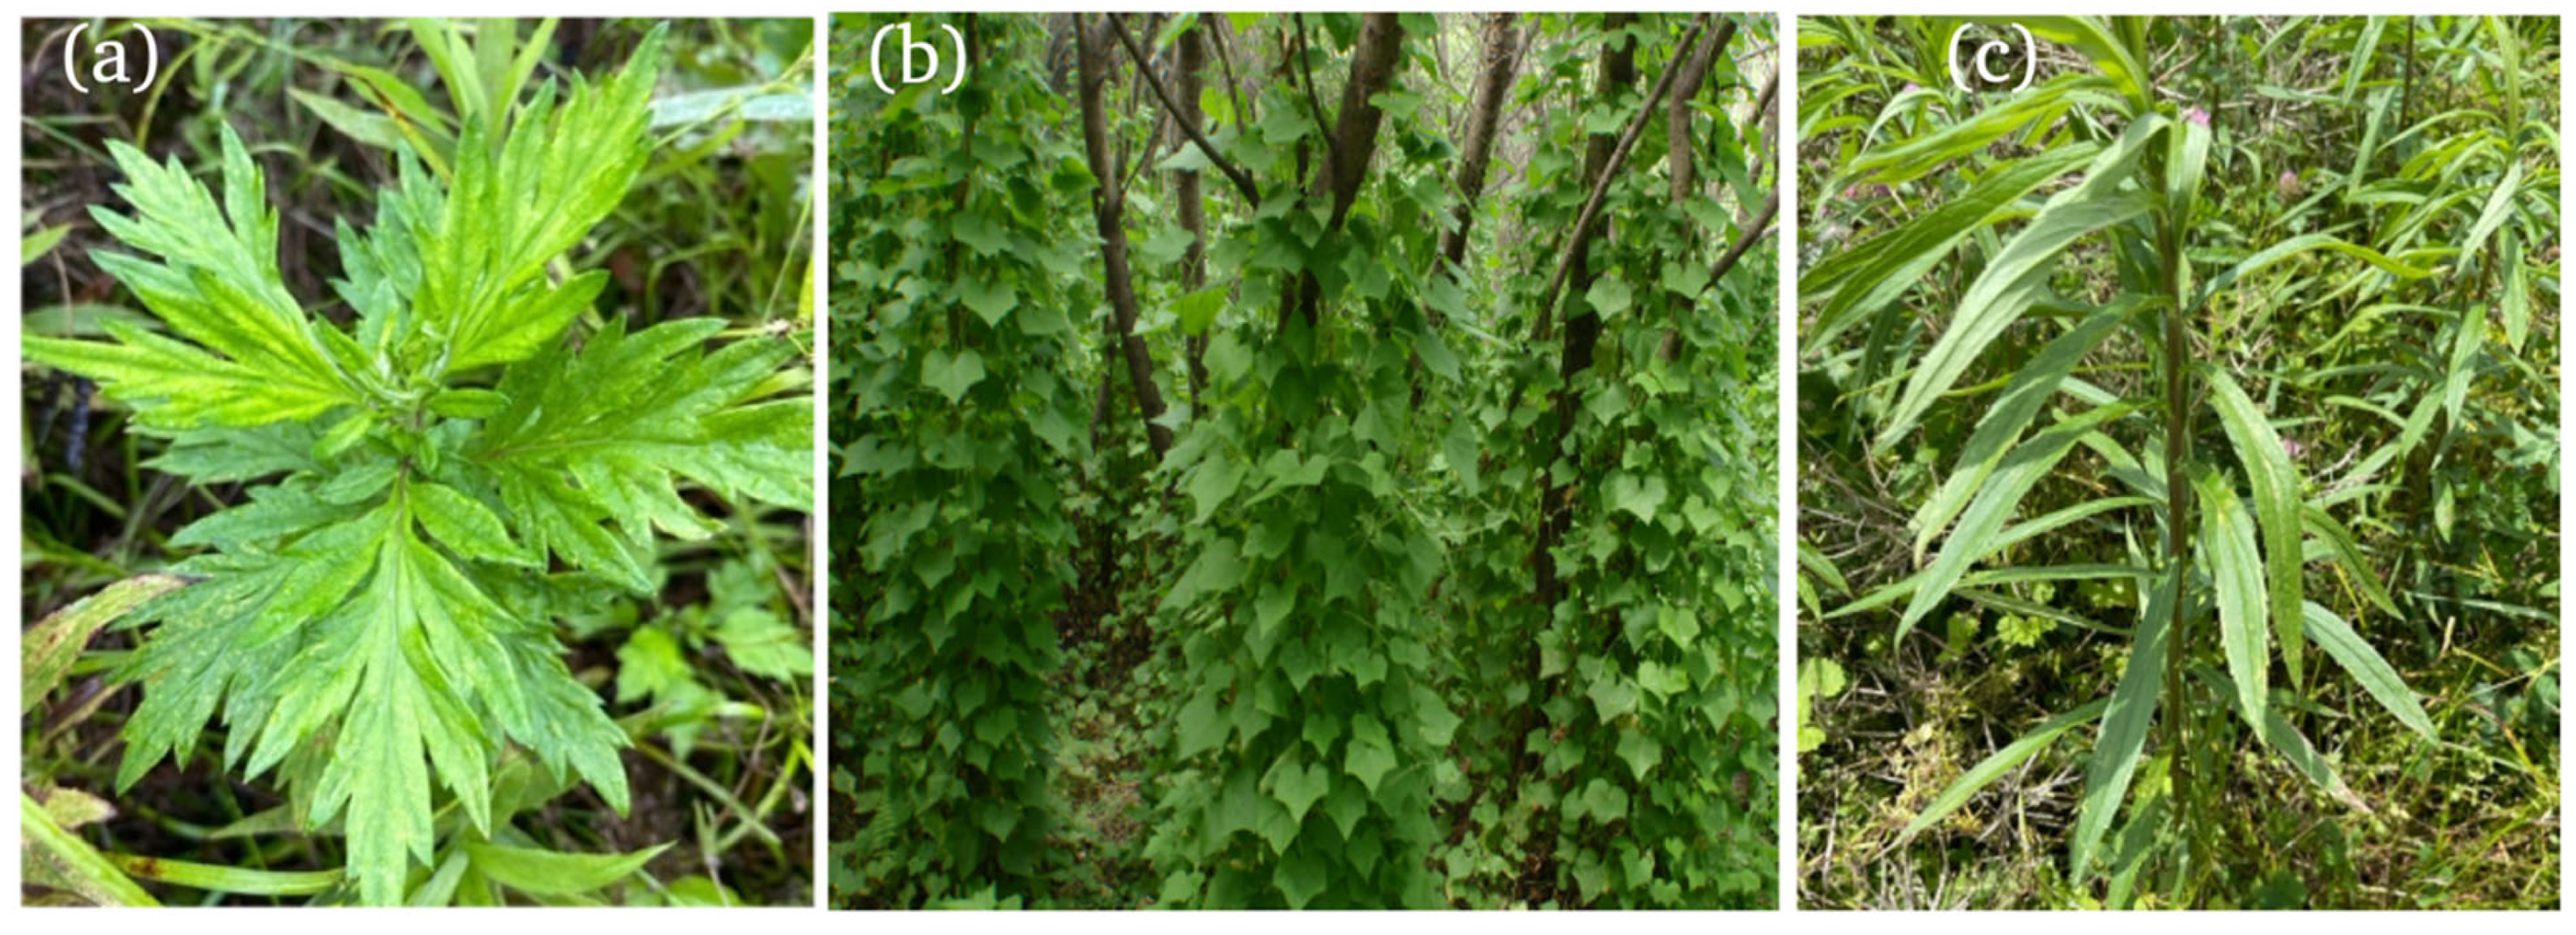
2.1. Study Location and a Selection of Native and Invasive Species

We collected samples in the first week of June and August at Arakawa Tarouemon (35.97388600° N, 139.51967900° E to 35.98494300° N to 139.51587800° E), and the third sampling was conducted in the second week of September in 2022. This study was conducted during this peak growth season in Japanese riparian habitats. Due to the high levels of sunlight, the high temperatures, and the varying soil moisture to which plants are exposed, this time of year is more conducive to oxidative stress. The target species were chosen based on their differing growth form and ecological role: Artemisia princeps (erect native), Sicyos angulatus, (vining invasive), and Solidago altissima, (rhizomatous, tall, and invasive). This variation in morphology will enable us to test for associations between structural and ecological traits and oxidative stress responses. It is one of the most important hydrological networks in Saitama as it supports agriculture, biodiversity, and the well-being of local communities.
A good understanding of herbaceous species is essential for managing riparian vegetation in riverbanks because they play a vital role in promoting ecosystem health, stabilizing surface soil, and preventing erosion, particularly through dense ground cover and rapid seasonal growth, functions that differ from the longer-term stabilizing roles of trees. Due to their seasonal growth cycles and rapid turnover, these organisms provide resources for food and habitat. All three herbaceous species that we studied, A. princeps, S. angulatus, and S. altissima, start to grow in the early spring. Artemisia princeps is native to Japan and grows along roadsides, riversides, shorelines, and in the elevated riparian zones. Invasive species such as S. angulatus and S. altissima originated from America and have been introduced to Japan. S. angulatus constitutes a rising vine which is assisted by plants around it. The dense, expansive mats it produces can suffocate other plants by blocking light and stunting their growth. Conversely, S. altissima is a tall, erect herb that produces a lot of seeds and has a large rhizomatous root system that helps it build thick stands.

2.2. Collection of Plant Leaves and Soil

Gloves were used to avoid contamination while carefully collecting well-grown leaves that had been exposed to sunlight. After the sample being taken, every leaf was promptly wrapped around in a plastic bag. It took no more than forty to forty-five minutes to reach the laboratory. The central portion of the plants’ fully grown leaves were taken out in every replication. It is possible to reduce the loss of H2O2 concentration by preparing samples quickly after collection [46]. Therefore, the leaves were prepared for analysis as soon as they arrived in the laboratory. For each sampling location, several leaves from each species were collected to analyze H2O2 and photosynthetic pigments. A light intensity meter (Apogee, MQ-200, Logan, UT, USA) was operated to quantify the photosynthetic photon flux density (PPFD). For each plant species, nearly 22 samples were collected at different sampling points covering the above-mentioned coordinates. The soil samples were collected in triplicate at all sampling sites 15–20 cm below the ground surface. In order to analyze the riparian soil, it was stored in tightly sealed plastic bags and transported to the laboratory. Figure 1a–c presents the selected species.

2.3. Sample Preparation Utilizing Shake Master Auto for H2O2 Quantification

A 15 mL strong tube was filled with a combination of beads 3 mm (8–10 pieces) and 10 mm (1 piece). Approximately 50 mg of plant samples are cut with a sizer and placed in the strong tube. Each sample containing tubes was dissolved with liquid nitrogen before being crushed to powder using shake master auto (BMS Inc., Poway, CA, USA). After addition of polyvinylpyrollidoneK90 (PVP) to mask the phenolic effect, 5 mL of 0.05 M phosphate buffer (pH 6.0) was homogenized with the mixture. After centrifuging (Kokusan H60-R, Kyoto, Japan) twice at 5500 rotation per minute (rpm) for 10 min, the supernatant of the mixture was collected and analyzed for H2O2.

2.4. Determination of H2O2 Content with Ti (SO4)2 Assay

H2O2 was measured using the Brennan & Frenkel [37] method. Acidic solution contains titanium (II) metal ions forming yellow peroxide complexes with H2O2. In 0.835 mL of 20% H2SO4 solution, 0.1% Ti(SO4)2 in 0.25 mL of extracted sample solution was added. For 15 min at room temperature, the mixture was centrifuged at 10,000 rpm. Spectrophotometer cells of 1 mL capacity were then filled with 1 mL of the supernatant. At 410 nm, absorbance was recorded. With the aim of preparing the blank, we mixed 750 µL of 0.05 M phosphate buffer (pH 6.0) with 2.5 mL of 0.1% Ti(SO4)2 in 20% H2SO4. The trend of the standard curve derived based on the recognized H2O2 concentration was employed to compute the H2O2 concentration. The findings were displayed as μmol/gFW (Fresh weight).

2.5. Extraction of Photosynthetic Pigments (Chlorophyll a and Chlorophyll b)

After weighing roughly 50 mg each, the plant samples were put in a 15 mL tube and 5 mL of N, N-dimethylformamide was added. The tube is placed in an area of darkness for 24 h after being wrapped with aluminum foil sheets [47]. The cuvette is filled with 1 mL of N, N-dimethylformamide in order to evaluate the blank reading. Measurements were made continuously at 750 nm, 664 nm, and 647 nm wavelengths using 1 mL samples.
The absorbance at 750 nm was used for removing any interference and turbidity effects of the samples. This value was not applied in the calculation of chlorophyll concentrations, but was used for the extrapolation of absorbance at 664 and 647 nm for the determination of chlorophyll a (chl a) and chlorophyll b (chl b) values, respectively (Shimadzu, Kyoto Prefecture, Japan, UV mini 1210). These pigments’ assessment was carried out using previously established coefficients [48]. The contents of chl a and chl b are stated in µg/g FW. The following equations are utilized for chl a and chl b derivation:
Chl a (µg/mL) = 11.65 × A664 − 2.69 × A647
Chl b (µg/mL) = 20.81 × A647 − 4.53 × A664

2.6. Measurement of Soil Moisture, TN, and TP

A weight loss method was employed to estimate the moisture content of the soil samples. Initial soil samples were weighed then dried in an electric oven at 105 °C for 25–26 h [49]. A comparison of the initial weight and final weight of the sample was used to estimate soil moisture content. Analysis of soil nutrients was limited to fine sediments (<128 μm). TN and TP concentrations were determined using a soil–water analyzer (Model EW-THA1J; Eiken Chemical Co., Ltd., Tokyo, Japan), following the manufacturer’s protocol based on the colorimetric methods described in the Standard Methods for the Examination of Water and Wastewater [50]. Using a bottle with 30 mL buffer, 1 g (1 g) of soil was added and vigorously shaken for 3 min. A syringe was filled with 30 mL of solution and then 16 mL were filtered (Millex-GV Syringe filter unit, 0.22 µm; Sigma-Aldrich, St Louis, MO, USA) (in the case of larger pore sizes, filtration becomes volatile, affecting the measurement procedure for TN and TP). Afterwards, the cartridge was placed in its intended location, and the filtered samples and buffer were placed in their corresponding chambers. It took 15–18 min for the result to appear on the output screen, and TN and TP were recorded. This outcome was contrasted with the previously acquired TN and TP standard concentration graph.

2.7. Statistical Analyses

The statistical analysis was carried out applying R (R programming) [51] and IBM SPSS Statistics (Version 29.0 IBM Corporation, Chicago, IL, USA). To evaluate associations between each chosen parameter, Pearson’s correlation analysis was employed. To explore the variance in the mean at a 0.05 significance level, the data was analyzed with the one-way Analysis of Variance (ANOVA) followed by a Bonferroni post hoc test. The statistical significance of the computed variables was calculated by incorporating the significance levels (p) and correlation coefficient (r). We used the ‘mgcv’ package of ‘R’ to analyze general additive models (GAM). The best models were compared and selected using Akaike information criterion (AIC) and log Likelihood (logLik) within the ‘MuMIn’ package. The heteroscedasticity of the chosen models was tested with the Breusch–Pagan test using the ‘lmtest’ package. Furthermore, the heteroscedasticity of residuals in the GAM were tested with the Breusch–Pagan test as implemented in the lmtest package in R. To check multicollinearity of independent variables, the variance inflation factor (VIF) of the selected models was calculated using ‘olsrr’ package. For visualization of the model performance, the mgcViz package was deployed.

3. Results

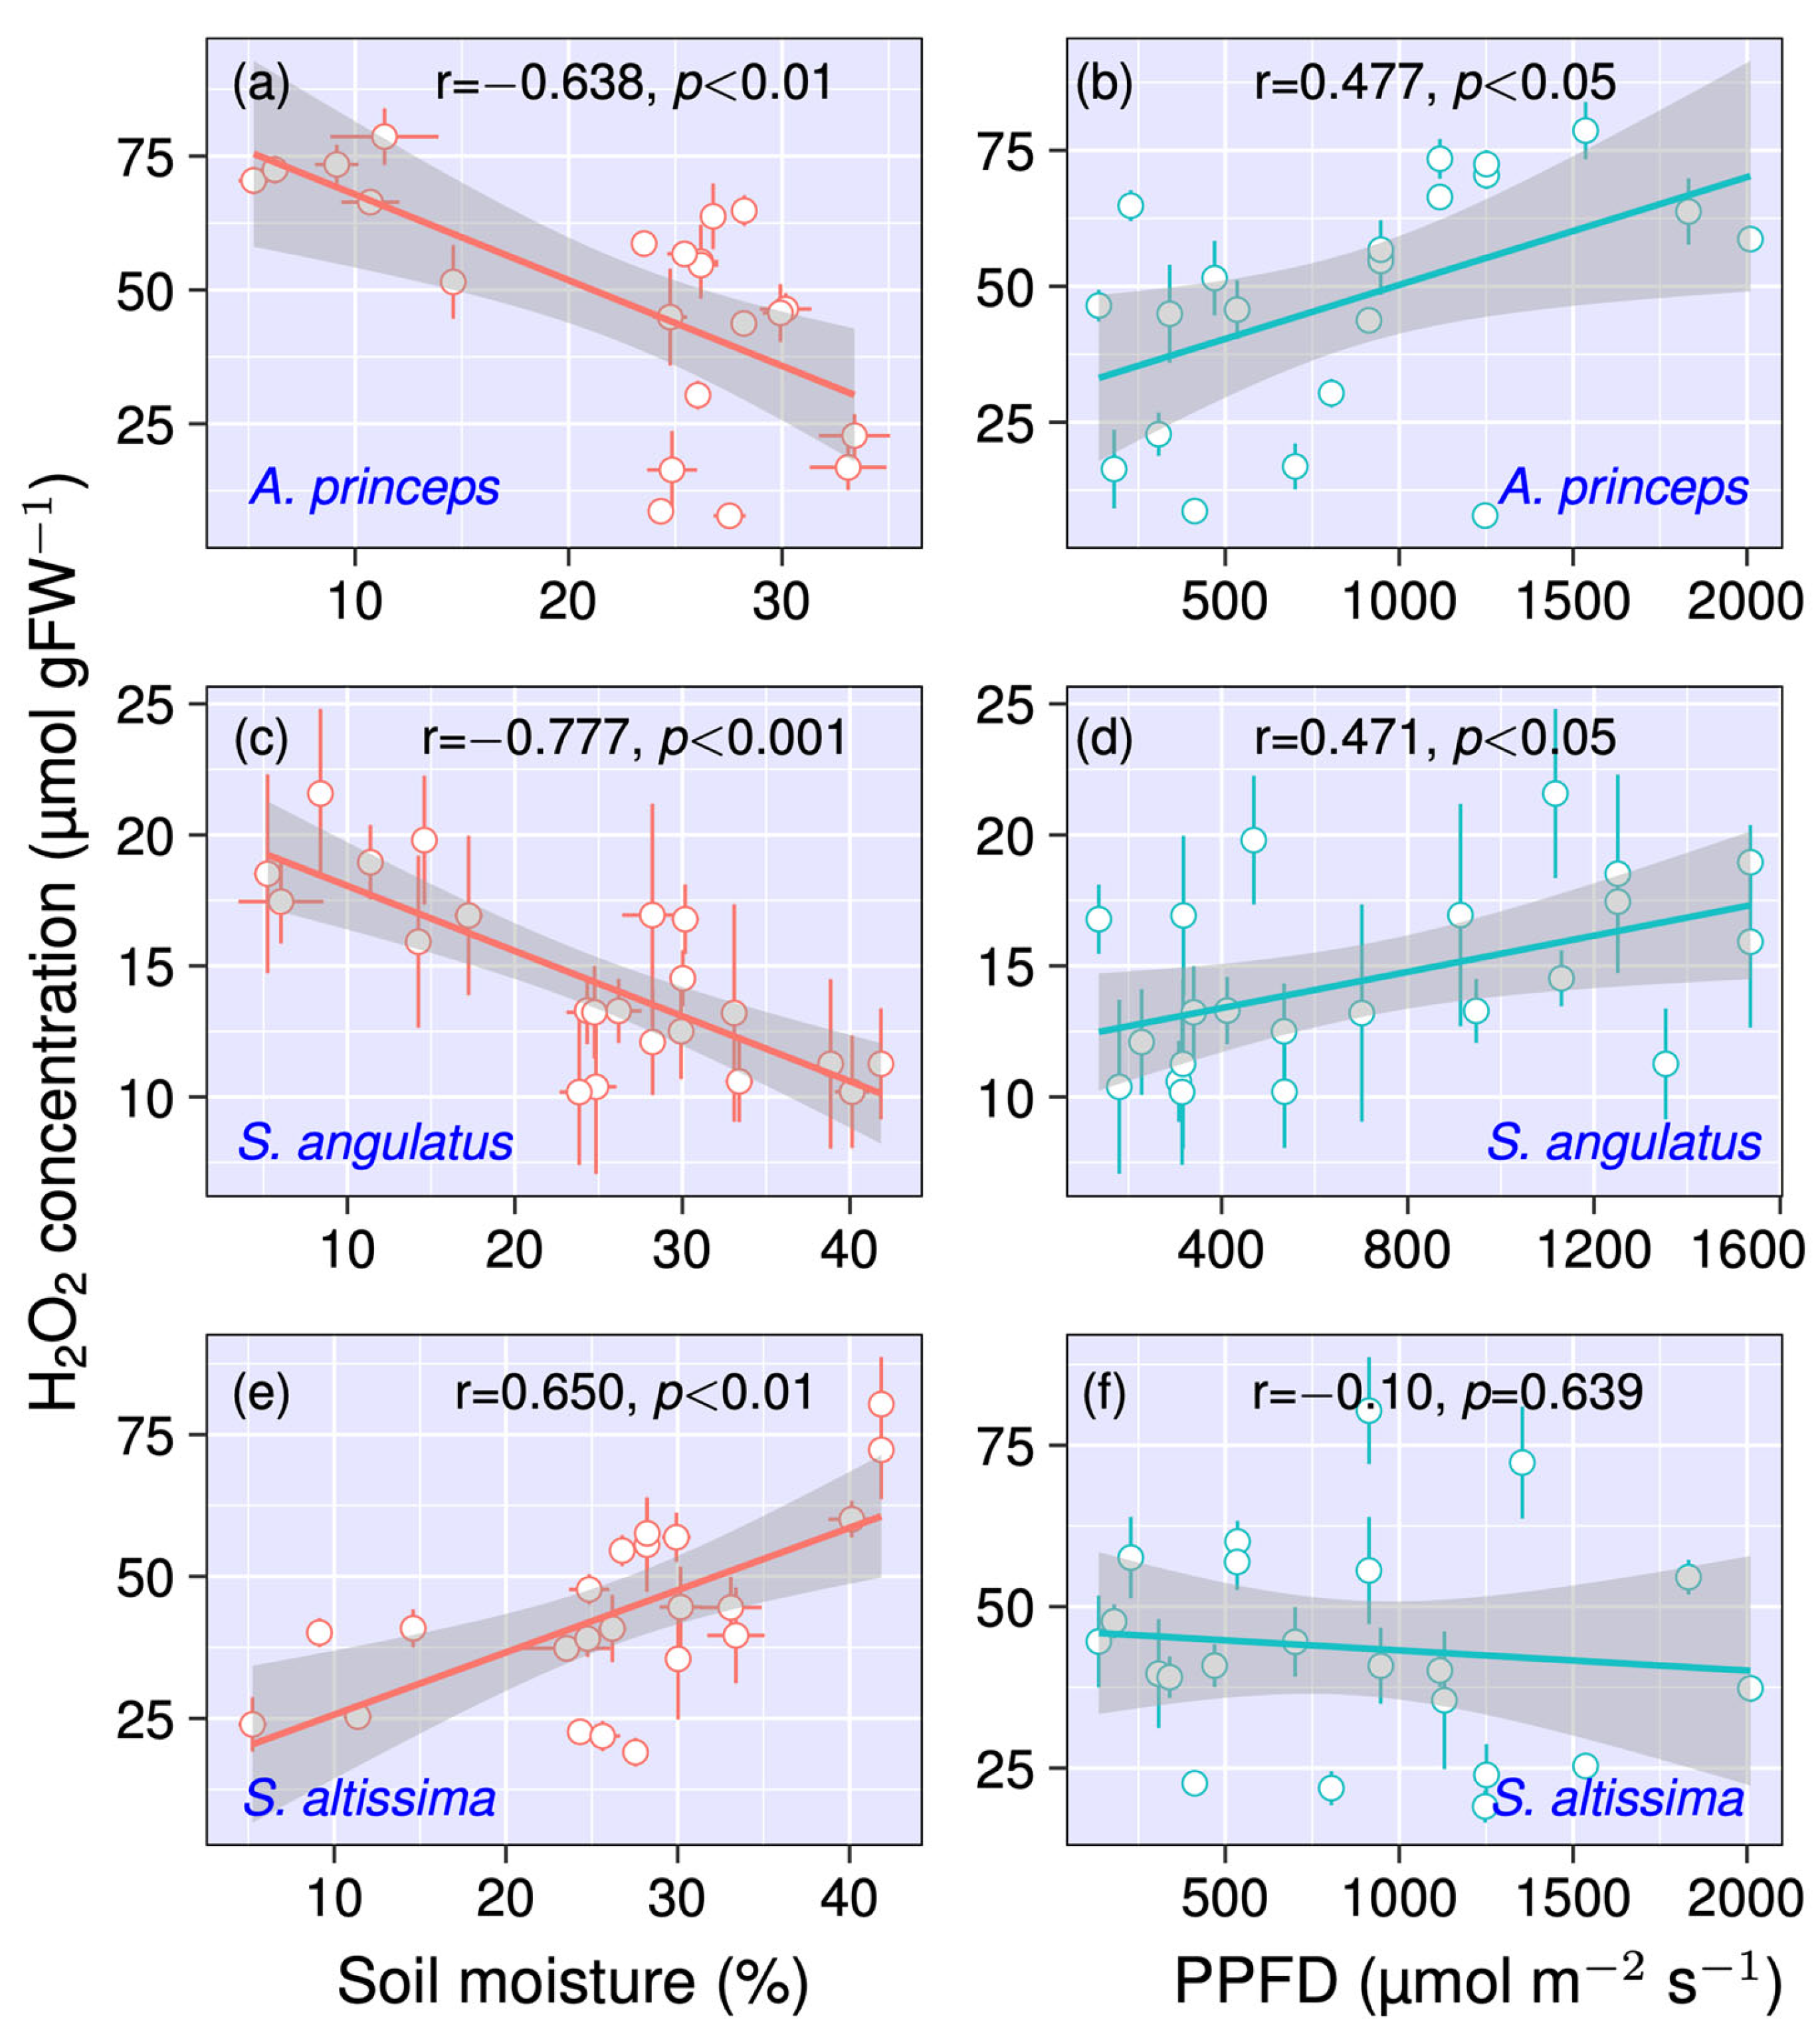
3.1. Impact of Soil Moisture and PPFD on H2O2 Concentration

Soil moisture content and PPFD directly affect H2O2 concentration for each species (Figure 2). A significant decrease in H2O2 concentration with increasing soil moisture content was observed in A. princeps (r = −0.638; p < 0.01) and S. angulatus (r = −0.777; p < 0.001), indicating a negative correlation between H2O2 levels and soil moisture in both species. On the other hand, S. altissima exhibits a significant positive correlation with soil moisture content and H2O2 (r = 0.650; p < 0.01). The higher the soil moisture content, the lower the H2O2 levels in A. princeps and S. angulatus, which is an indication that there is less oxidative stress, whereas a low soil moisture content is stressful. For S. altissima, excess H2O2 levels indicate that the plants experience stress as soil moisture rises. Waterlogged soils may cause oxygen deprivation (hypoxia) in the root zone due to excessive moisture. Post hoc Tukey’s test indicated that S. angulatus H2O2 levels were significantly different from both A. princeps and S. altissima (p < 0.001 for both species), but no significant difference was found between A. princeps and S. altissima (p = 0.668). These results show that S. angulatus has unique oxidative stress responses compared to the two other species. A positive correlation was observed with PPFD and H2O2 in A. princeps (r = 0.477; p < 0.05) and S. angulatus (r = 0.471; p < 0.05); meanwhile, a negative trend was observed in the S. altissima (r = −0.10; p = 0.639).

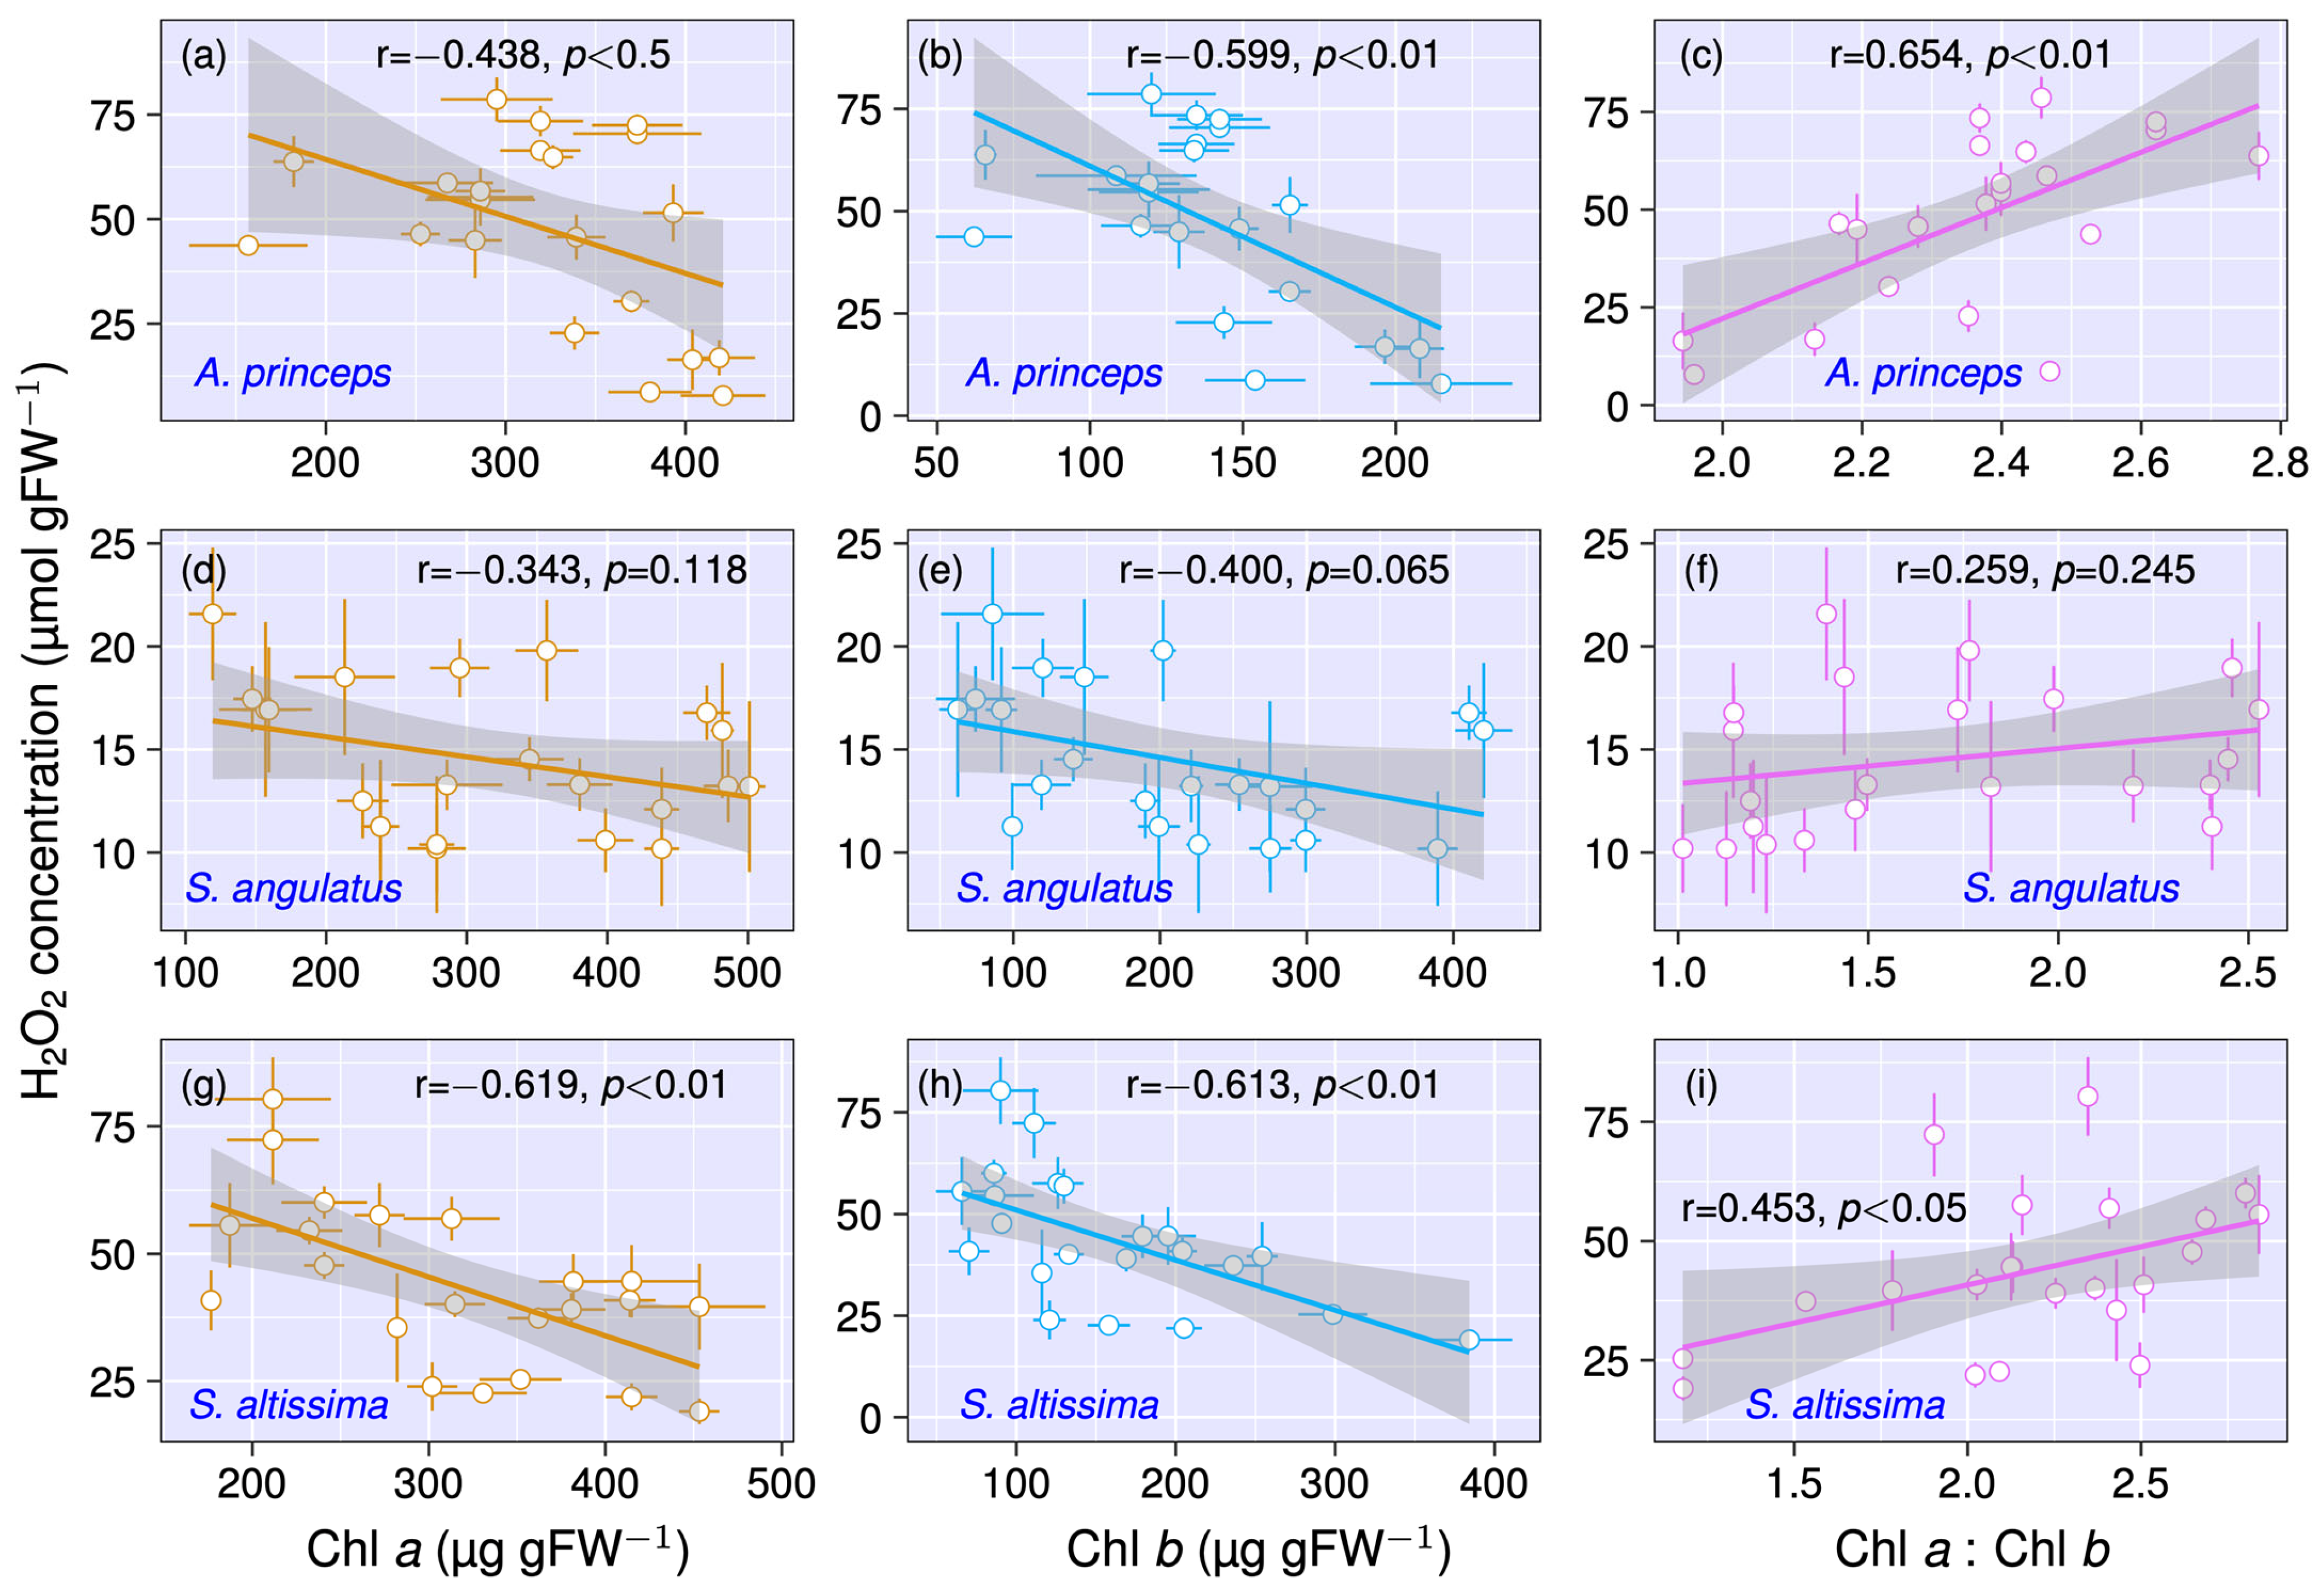
3.2. Relationship Between Chlorophyll Content and H2O2 Concentration

Figure 3 indicates the relationship between chlorophyll pigment and H2O2 concentration. H2O2 showed a negative correlation with both chl a and chl b across all species examined (for A. princeps, chl a and H2O2, r = −0.438, p < 0.05; chl b and H2O2, r = −0.599, p < 0.01; For S. angulatus, chl a, and H2O2, r = −0.343, p = 0.118; chl b and H2O2, r = −0.400, p = 0.065; for S. altissima, chl a and H2O2, r = −0.619, p < 0.01; chl b and H2O2, r = −0.613, p < 0.01). However, a positive correlation is identified between H2O2 and chl a:b in A. princeps, (r = 0.654, p < 0.01), S. angulatus (r = 0.259, p = 0.245), and S. altissima (r = 0.453, p < 0.05). Chlorophyll pigments are degrading or decreasing because of oxidative stress brought on by H2O2, as seen by the negative association between H2O2 and chl a and chl b for each species. Degradation of chlorophyll is a typical reaction to oxidative stress because ROS can harm molecules of chlorophyll right away, reducing photosynthesis and compromising the survival of plants. The positive relationship between H2O2 and the chl a:b ratio suggests that oxidative stress may have a more profound effect on chl b than chl a, leading to an increase in the chl a:b ratio when H2O2 levels rise. This might be because under stress, chl b degrades more quickly than chl a due to its increased vulnerability to oxidative damage.

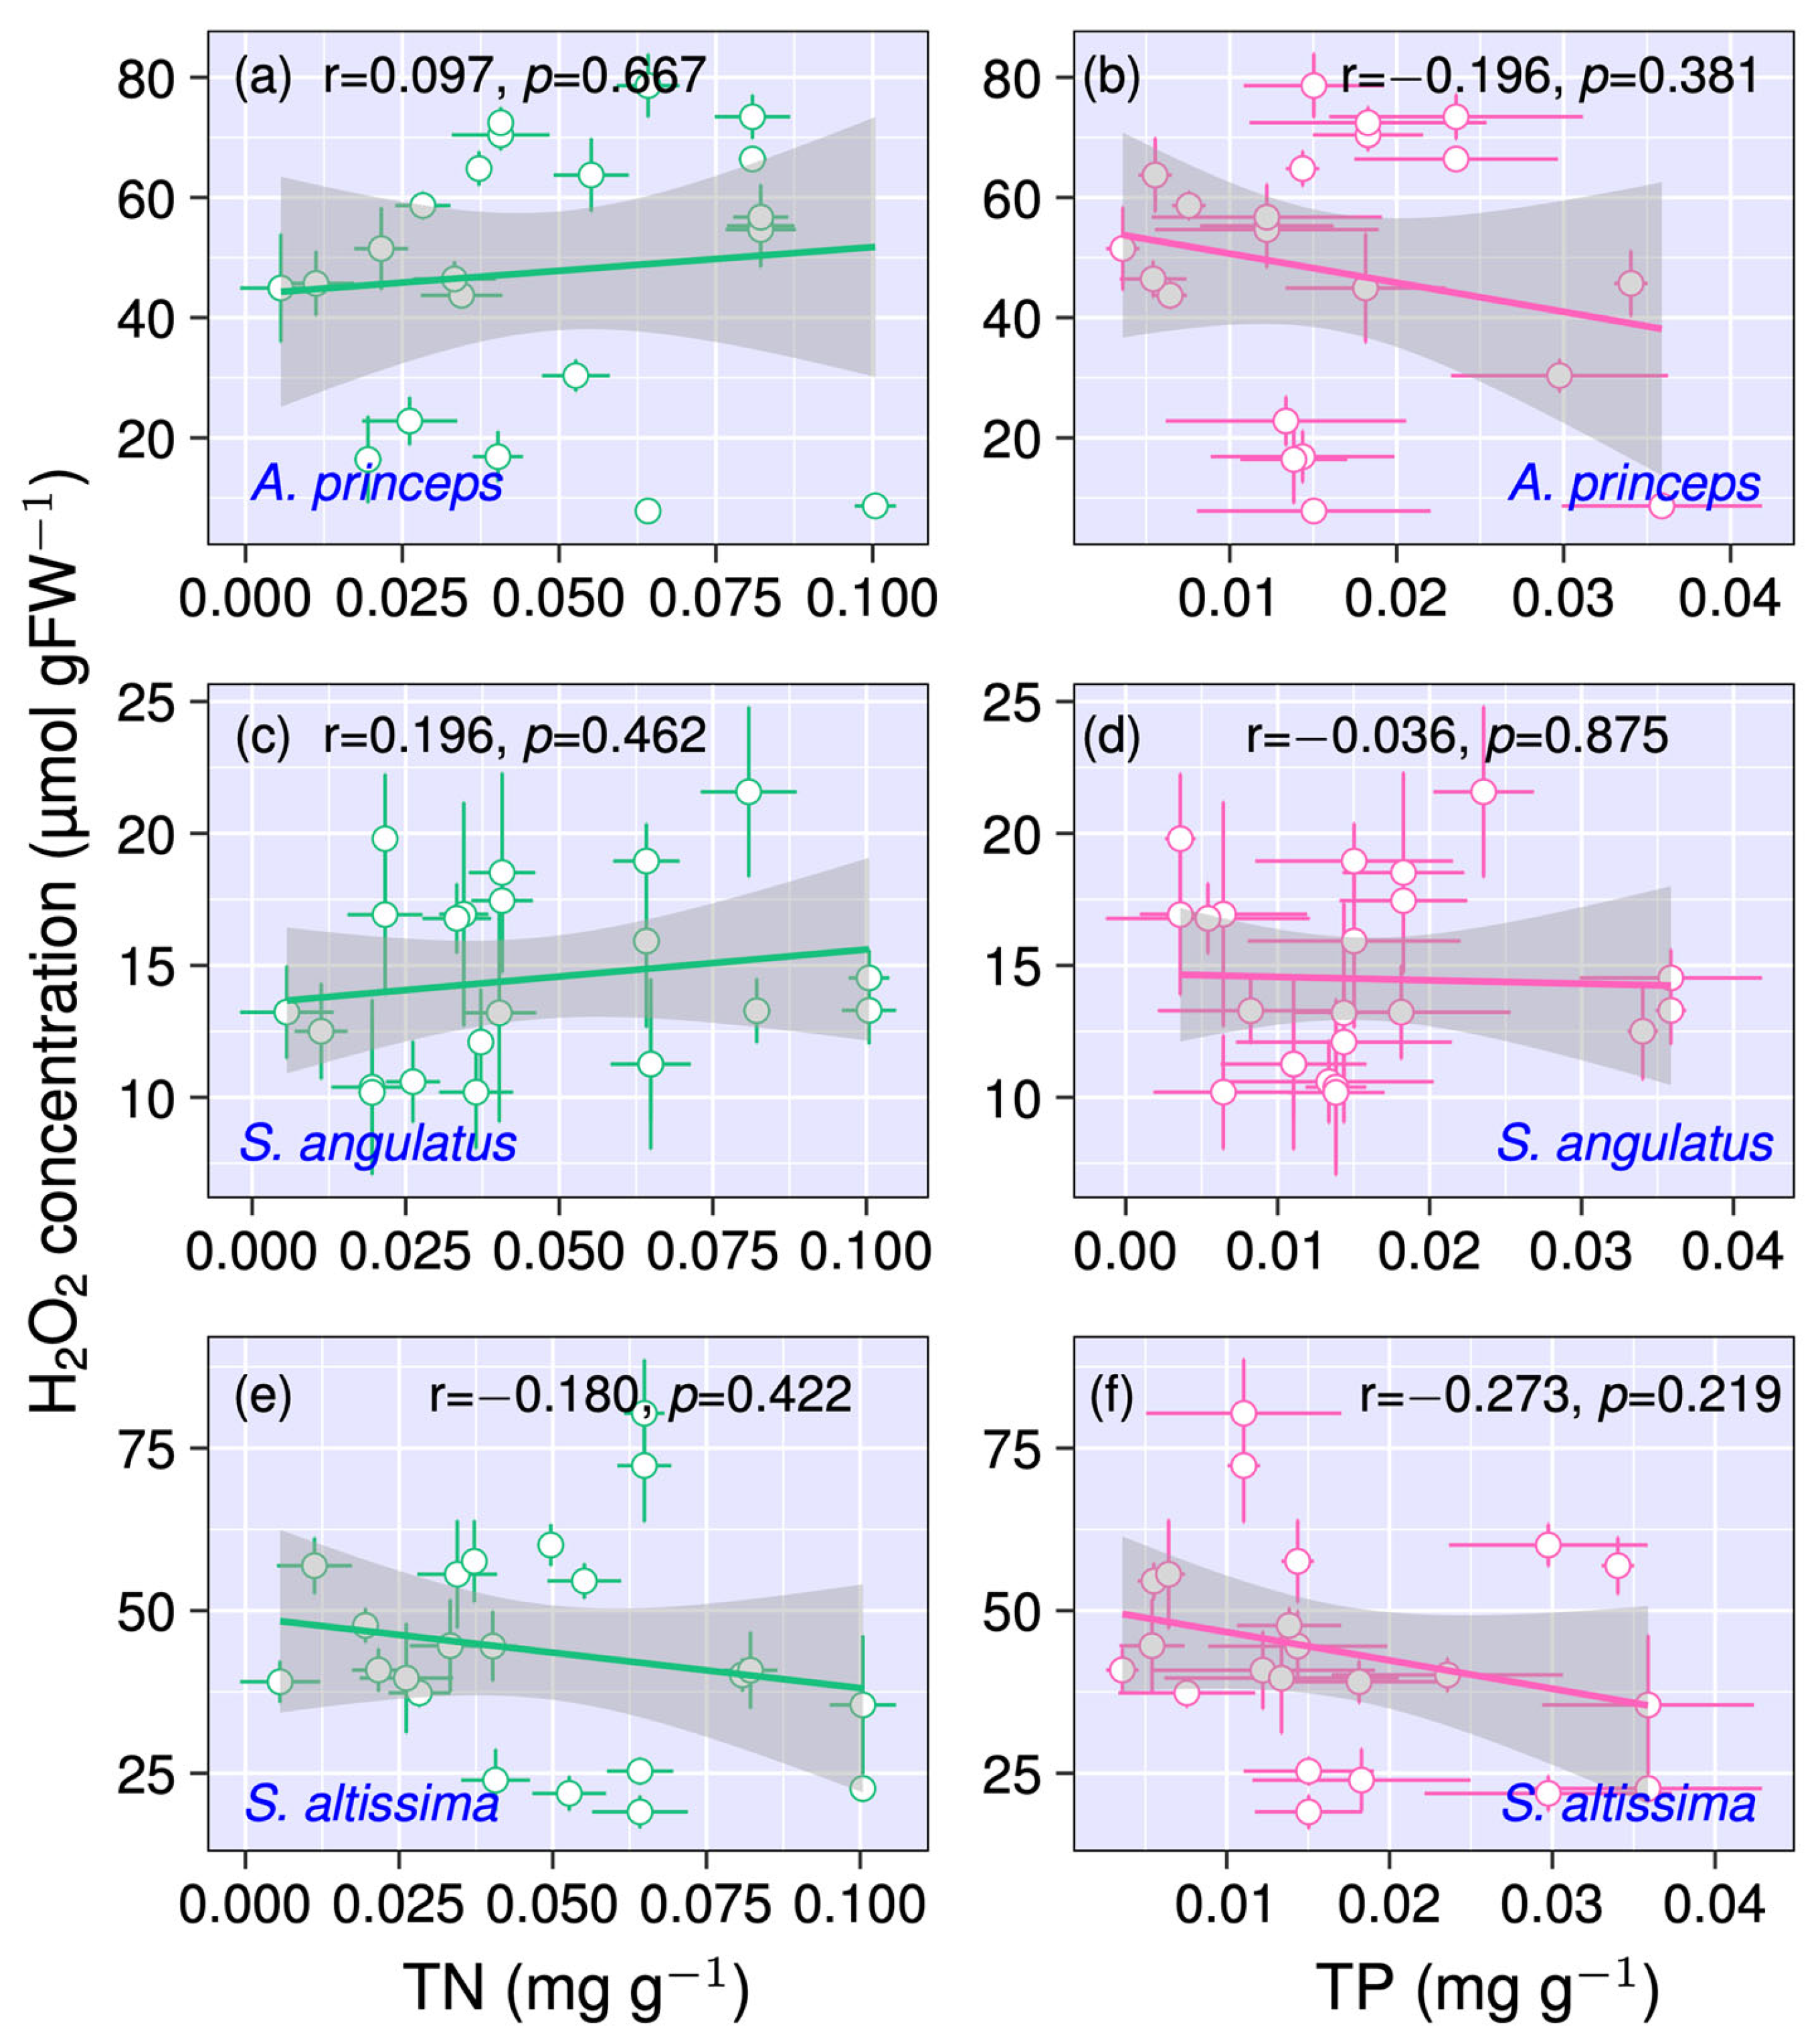
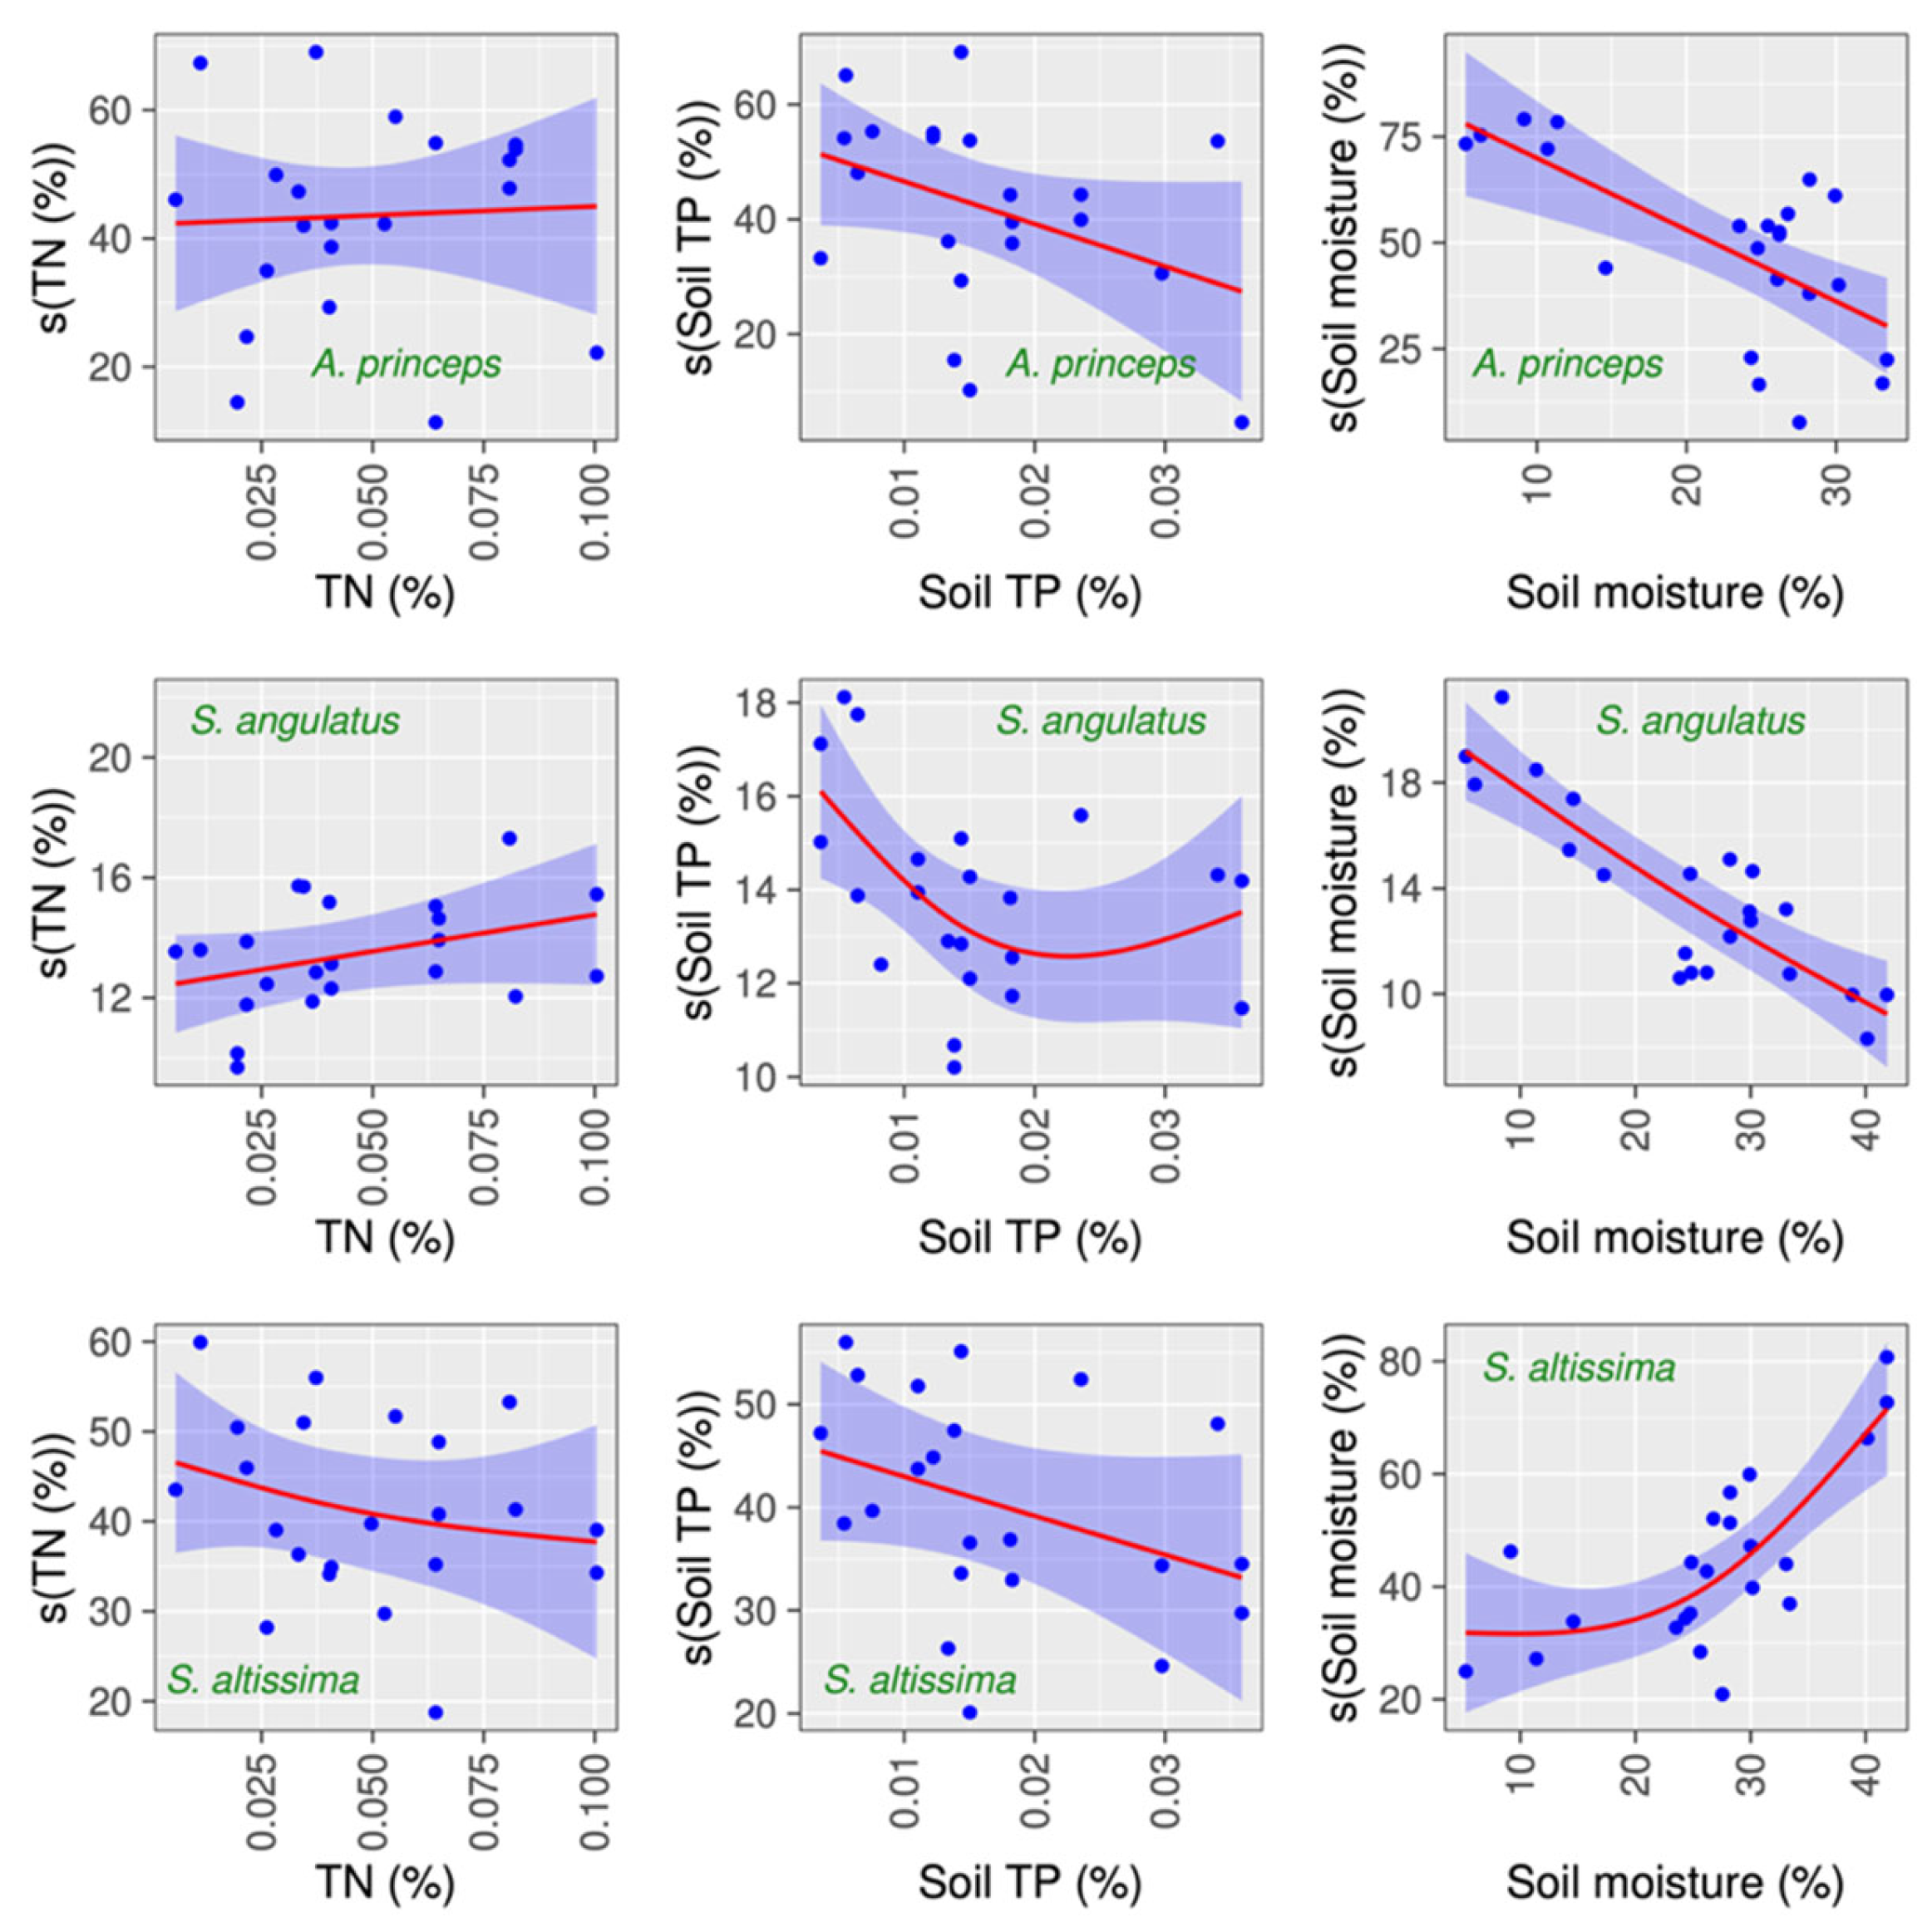
3.3. Relationship Between H2O2 Concentration and Soil Macronutrients

No remarkable positive or negative correlation was observed between TN or TP and H2O2 (for A. princeps, TN and H2O2, r = 0.097, p = 0.667; TP and H2O2, r = −0.196, p = 0.381; for S. angulatus, TN and H2O2, r = 0.165, p = 0.462; TP and H2O2, r = −0.036, p = 0.875; for S. altissima, TN and H2O2, r = −0.180, p = 0.422; TP and H2O2, r = −0.273, p = 219) (Figure 4). The correlation of H2O2 and TN:TP for A. princeps (r = 0.264, p = 0.234); S. angulatus (r = 0.179, p = 0.424); and S. altissima (r = 0.260, p = 0.240). This implies that the levels of TN and TP in the soil do not directly affect the concentration of H2O2. Hence, changes in H2O2 levels may not be triggered by the presence or absence of TN and TP. ROS-related mechanisms, such as H2O2 generation and scavenging, are distinct from those controlling nitrogen and phosphorus absorption and metabolism in plants.

3.4. Connection Between Several Factors and H2O2 Concentration

To examine the combined influence of the environmental variables, GAMs for each plant species were developed. H2O2 concentration was considered the dependent variable, and soil moisture content, TN, TP, and PPFD were used as independent variables. The GAM analysis reveals that soil moisture is the only significant indicator of soil H2O2. As TN and TP concentrations have little impact on H2O2 concentrations in plants in the present study, soil moisture content is the only factor that affects them. The deviance explained is more than 48% for each species (A. princeps is 61.1%; S. angulatus is 69.7%; S. altissima is 80.6%) (Table 1, Table 2 and Table 3), which is considered a better fit for the environmental parameter cut-off values [52]. In order to obtain the best model fit for each species, various independent variables were tested systematically (Table 4). For each of the three species, the most parsimonious model with only soil moisture [s(SM)] had the lowest AIC and highest model weight, suggesting the strongest support. While it was attempted, more complex models utilizing other responses (e.g., PPFD, TN, TP) showed large AIC values and small model weights for any increase in explanatory power. The variance inflation factor (VIF) values of the selected models were calculated to examine the multicollinearity of the independent variables (Table 5). All the VIF values were less than 3, suggesting that multicollinearity was not a problem in any of the models. They also demonstrated a low value of tolerance, much higher than a threshold of 0.1, again indicating that no multicollinearity existed among predictors. Heteroscedasticity of residuals in the GAMs was evaluated with the Breusch–Pagan test. The Breusch–Pagan test suggested no notable heteroscedasticity in the three species models: A. princeps (BP = 2.88, df = 3, p = 0.411), S. angulatus (BP = 1.54, df = 3, p = 0.674), and S. altissima (BP = 0.92, df = 3, p = 0.821). These p-values (all >0.05) confirm that the assumption of homoscedasticity was satisfied for each model. Figure 5 exhibits the association between H2O2 and the factors taken together.

4. Discussion

Native and invasive plant species have their own defense mechanisms to manage oxidative stress, which is frequently expressed in the generation of H2O2, which is directly related to the overall effects of environmental stress. H2O2 is chosen as the predominant response variable because it is a direct and initial result of oxidative stress, and it can respond more sensitively and more quickly [53] than chlorophyll pigments to environmental changes [54]. Although chlorophyll degradation is a sign of stress, it is a relatively late response and dependent on the species. H2O2, on the other hand, represents oxidant signaling that originates further upstream and is therefore a common marker of stress physiology. Among the environmental stresses that can result in more ROS, including H2O2 production in plants, are drought, cold temperatures, nutritional imbalances, and high solar radiation. Invasive and native species both generate H2O2 in stress reactions, but their capacity to purify and control this substance differs significantly, affecting their competitive and survival strategies. Invasive species frequently have a higher capacity for high H2O2 levels and are better at coping with oxidative stress. However, native species may not be able to adapt as well to elevated oxidative stress and frequently have a smaller endurance range to environmental changes. Thus, the distribution and success of native compared to invasive species in stressed ecosystems are significantly influenced by their varying capacities to control H2O2 and other oxidative stress markers. Controlling invasive species and managing native plant populations require an understanding of these dynamics, which emphasizes the necessity of restoration techniques that either lessen stressors in native ecosystems or take advantage of the unique oxidative stress vulnerabilities of invading plants. In the present study, invasive species, namely S. altissima, tends to show higher H2O2 concentration (75–85 μmol/gFW) (Figure 2c). However, S. angulatus H2O2 levels (10–25 μmol/gFW) are lower than S. altissima (Figure 2e). On the contrary, the native species that includes A. princeps exhibits a wide range of H2O2 level (10–80 μmol/gFW) adaptability depending on the soil moisture content (Figure 2a). This demonstrates that the management of riparian vegetation should take into account the characterization and capacity for adaptation of individual species.
PPFD has a direct effect on chlorophyll and photosynthesis, which are essential to plant growth. Invasive species may be at an advantage in areas with higher PPFD due to their frequently increased photosynthetic efficiency. Moreover, the production of H2O2 contributes to plant stress reactions and may serve as a marker of the degree of oxidative stress in plants. It is possible that invasive species have superior detoxification systems for H2O2, which enables them to endure and flourish in the face of environmental stressors that would otherwise inhibit native species. The abundance and achievement of invading and native plant species in a particular ecosystem are determined by an intricate structure of interactions between these variables. In the current investigation. A. princeps and S. angulatus showed a positive connection with PPFD and H2O2, while S. altissima showed a negative trend (Figure 2). Higher PPFD probably results in higher H2O2 levels for A. princeps and S. angulatus, which suggests greater oxidative stress. Under extreme light circumstances, these plants may experience oxidative stress if they are unable to handle the extra ROS due to a restricted antioxidant capacity. S. altissima, on the other hand, may have more robust defenses against ROS in bright light. S. altissima may be able to sustain lower H2O2 levels when PPFD rises because they have more potent antioxidant systems or are suited to high-light conditions.
The findings of this investigation show that the chl a and chl b are linked adversely with the H2O2 concentration in each species as oxidative stress increased (Figure 3). This relationship implies that H2O2 may decrease chlorophyll production or the breakdown of chlorophyll, thus reducing the plant’s ability to photosynthesize. In contrast, the chl a:b ratio exhibits a positive connection with H2O2. This indicates that during oxidative stress, the chl a:b ratio rises as H2O2 levels do, possibly as a result of a larger decrease in chl b than chl a. While chl b is connected to harvesting light structures, chl a is mostly linked to the central reaction centers of photosynthesis, consequently suggesting a shift could represent an adaptive response. The plant may be redistributing its resources to support essential photosynthetic functions even under difficult circumstances, as employed by an increase in the chl a:b ratio. These connections demonstrate how chlorophyll dynamics alter in response to oxidative stress and how the plant attempts to balance photosynthesis while limiting stress-induced oxidative damage. Indeed, it has been established that H2O2 is a strong inhibitor of photosynthesis since, even at very low concentrations, it may cut CO2 fixation in half by inhibiting the Calvin cycle’s enzymes [55].
In riparian zones, research shows that the shape of plant communities and the success of native vs. invasive species are significantly influenced by the availability and balance of nutrients. Morris et al. [56] state that as TN and TP are necessary for photosynthesis and metabolic processes, moderate quantities of these nutrients are necessary to maintain native plant growth. However, excessive TN and TP levels, which are frequently brought on by urbanization or agricultural drainage, can cause eutrophication, which favors invasive species that develop quickly, including S. altissima and S. angulatus [57,58]. Nitrogen is particularly efficiently utilized by invasive species, resulting in rapid growth and competition for native species [59]. There was evidence that invasive species altered nutrient cycling in riparian zones, adding to TN levels and reinforcing their dominance through feedback loops [60]. Inversely, low TN:TP ratios (less than 10:1) are indicative of phosphorus-rich environments, which may likewise benefit non-native organisms that have acclimated to these unbalanced circumstances [61]. Moderate TN:TP ratios (10:1 to 20:1) are thought to be optimal for maintaining a balanced nutrient environment that promotes native species [62]. Changes in species composition brought on by an unbalanced TN:TP ratio can lower biodiversity and allow a few dominant invasive plants to proliferate [63]. According to the current study, the TN:TP ratio is no greater than 10:1. However, as shown in Figure 4, the concentration of TN and TP in the riparian soil for the herb species did not significantly correlate with the concentration of H2O2 in plant tissue in this investigation. Hence, in the present research, nitrogen and phosphorus were not regarded as important elements for controlling species or restricting growth

4.1. Evaluating the Influence of Selected Environmental Parameters

Riparian vegetation is essential for preventing bank erosion, regulating flow rate during severe floods, boosting watershed infiltration, and securing and retaining debris [64]. The construction of dams upstream, gravel mining, and the afforestation of the upstream mountainous areas have all contributed to a significant decline in the volume of sediments in Japanese rivers over the past 50 years. Based on this, the riparian morphology and sediment characteristics remain largely unaltered even in the face of repeated, severe flooding episodes [65,66]. The majority of the sampling locations were only submerged for a maximum of one week during a significant flooding event, which happens roughly once every ten years. As a result, the quantified soil moisture content is typically indicative of the research site. Therefore, the impact of the soil moisture content is primarily responsible for the species abundance in the riparian zone [67]. Although A. princeps, S. angulatus, and S. altissima exist in a wide range of soil moisture from 5% to 45%, the oxidative stress level of each species is different. For native riparian species like A. princeps, an increase in soil moisture typically correlates with a decrease in H2O2 levels, as higher soil moisture reduces oxidative stress by limiting oxygen availability in the root zone. When soil is more saturated, it restricts oxygen diffusion, creating low-oxygen conditions that prevent excessive ROS formation, including H2O2. Consequently, native plants experience lower oxidative stress under higher soil moisture, as the production of ROS slows down, minimizing potential cellular damage. The high soil moisture content in invasive species like S. altissima may make oxidative stress worse by increasing H2O2 production above the capacity of the plant’s antioxidant defenses, which could cause tissue damage and cellular stress. This response might be an indication of an adaptation challenge for S. altissima under specific environmental circumstances, particularly in riparian zones where water levels fluctuate. According to studies on related invasive species, S. altissima’s ecological success and capacity to outcompete native plants under a variety of stressors, including moisture stress, may also be attributed to allelopathic traits, such as the synthesis of compounds that impede growth [68,69]. Convergent evolutionary characteristics that enable both native and invasive plants in riparian zones to flourish in damp environments may also be the cause of the same H2O2 trends. This capacity to control oxidative stress under damp conditions may contribute to the invasive success of S. angulatus, whereas it is consistent with A. princeps’s long-term adaptation to native riparian habitats. Every species specification should be taken into account while managing riparian vegetation. Among the several characteristics of certain native and invading plant species, the GAM predicts that soil moisture content is the main trigger of plant oxidative stress (Table 1, Table 2 and Table 3). Moreover, this study demonstrates that the formation of H2O2 cannot be directly impacted by TN or TP due to their insignificant quantities (Figure 4). Furthermore, the research reveals that the plants’ reactions to oxidative stress are largely consistent across different light intensities. This stability implies that the species being studied, whether native or invasive, probably has efficient systems in place to control the generation of ROS and preserve H2O2 levels even when PPFD fluctuates.

4.2. Tissue H2O2 Concentration in Vegetation Management

Monitoring plants is an essential part of vegetation management. There are many approaches to understand the condition of plants, such as adaptive management, where stands are monitored over a long period to gauge growth or shrinkage. This is a very time-consuming and expensive process. It is possible to use H2O2 in riparian vegetation management as a rapid and efficient oxidative stress marker that enables an analysis of plant health and their response to environmental variables, such as soil moisture, light intensity, and nutrient availability. Plants exposed to high levels of H2O2 may be undergoing oxidative stress, indicating an imbalance between reactive oxygen species production and antioxidant defenses. Assessing H2O2 levels can help managers determine what species are resilient to changing environmental conditions, as well as identify areas where vegetation may be stressed. Riparian ecosystems may benefit from management strategies aimed at supporting species more tolerant of oxidative stress via H2O2. In addition, identifying native plants that are stress-tolerant, as opposed to invasive species that are more sensitive, can guide targeted interventions and restoration efforts. Future research should also consider controlled experiments where soil moisture and nutrient levels are systematically varied to test causal relationships with H2O2 concentrations in plant tissues across species.

4.3. Limitations of This Study

While this research provides insight into riparian species management by quantifying oxidative stressors effectively, including native and invasive species, a more extensive temporal dataset—including seasonal and inter-annual variability—would help to confirm the method’s robustness. It may be possible to strengthen the correlation between the results if more samples with sampling points are added. Beyond this, longer term monitoring and manipulation experiments (which simulate future (climatic and human) changes) is recommended to further validate this approach under changing conditions. In future work, we will include other soil chemical properties, including NO3 and NH4 forms of nitrogen, organic matter, pH, CEC, and micronutrient elements, to provide a more comprehensive understanding of the soil–plant interface.

5. Conclusions

Riparian vegetation is influenced by a complex set of environmental variables, such as soil moisture, light intensity, and nutrient availability, which under certain conditions may contribute to oxidative stress in plants. These stressors influence H2O2 production, a key marker of oxidative stress, which varies between native and invasive species. Observations from this study demonstrated that oxidative stress would be effectively measured and is strongly influenced by environmental factors such as soil moisture. The difference in H2O2 generation and management highlights a critical adaptive advantage of invasive species, facilitating their establishment and spread in dynamic riparian ecosystems at the expense of native plant diversity. The chl a and chl b linked adversely with the H2O2 concentration in each species as oxidative stress increased. In contrast, the chl a:b ratio exhibits a positive connection with H2O2. This clarifies that during oxidative stress, the chl a:b ratio rises as H2O2 levels do, possibly resulting a larger decrease in chl b than chl a. The nutrient levels, especially TN and TP, cannot play a significant role due to a small variation in TN and TP concentration. Additionally, this explores the effects of PPFD and H2O2 generation that need to be managed separately for native and invasive species. H2O2 concentration in the plant could be a rapid, efficient, and reliable monitoring indicator for vegetation management. The outcomes of this research indicate that the species specifications of each plant species should be considered while managing riparian vegetation.

Author Contributions

Conceptualization, M.R. and T.A.; methodology, M.R. and T.A.; software, M.R. and M.H.R.; validation, M.R., T.A., K.F., M.H.R., H.K., J.A. and R.T.A.; formal analysis, M.R., T.A., H.K. and J.A.; investigation, M.R., T.A., H.K., J.A. and R.T.A.; resources, M.R. and T.A.; data curation, M.R. and T.A.; writing—M.R.; writing—review and editing, M.R., T.A., K.F., M.H.R., H.K. and J.A.; visualization, M.R. and T.A.; supervision, T.A. and K.F.; project administration, T.A.; funding acquisition, T.A. All authors have read and agreed to the published version of the manuscript.

Funding

This work was financially supported by the Grant-in-Aid for Scientific Research (B) (19H02245), (C) (23K04040), and the Fund for the Promotion of Joint International Research (18KK0116) of the Japan Society for the Promotion of Science (JSPS).

Institutional Review Board Statement

This study has been approved by the Ministry of Land, Infrastructure, Transport and Tourism, Japan (protocol code 39, Tarouemon-chiku, Shizensaiseijigyou, Kanto-Chiho-Seibikyoku).

Data Availability Statement

The original contributions presented in this study are included in the article. Further inquiries can be directed to the corresponding author(s).

Conflicts of Interest

Author Takashi Asaeda was employed by the company Hydro Technology Institute and Nippon Koei. Author Junichi Akimoto was employed by the company Next Eco. The remaining authors declare that the research was conducted in the absence of any commercial or financial relationships that could be construed as a potential conflict of interest.

References

  1. Nakamura, F.; Yamada, H. Effects of pasture development on the ecological functions of riparian forests in Hokkaido in northern Japan. Ecol. Eng. 2005, 24, 539–550. [Google Scholar] [CrossRef]
  2. Toda, Y.; Zhou, Y.; Sakai, N. Modeling of riparian vegetation dynamics and its application to sand-bed river. J. Hydro-Environ. Res. 2020, 30, 3–13. [Google Scholar] [CrossRef]
  3. Akamatsu, F.; Shimano, K.; Denda, M.; Ide, K.; Ishihara, M.; Toda, H. Effects of sediment removal on nitrogen uptake by riparian plants in the higher floodplain of the Chikuma River, Japan. Landsc. Ecol. Eng. 2008, 4, 91–96. [Google Scholar] [CrossRef]
  4. Akasaka, T.; Mori, T.; Ishiyama, N.; Takekawa, Y.; Kawamoto, T.; Inoue, M.; Mitsuhashi, H.; Kawaguchi, Y.; Ichiyanagi, H.; Onikura, N.; et al. Reconciling biodiversity conservation and flood risk reduction: The new strategy for freshwater protected areas. Divers. Distrib. 2022, 28, 1191–1201. [Google Scholar] [CrossRef]
  5. Kikuchi, T.; Kohzu, A.; Ouchi, T.; Fukushima, T. Quantifying the sources and removal of nitrate in riparian and lotic environments based on land use and topographic parameters of the watershed. Ecol. Indic. 2020, 116, 106535. [Google Scholar] [CrossRef]
  6. Ishikawa, N.F.; Uchida, M.; Shibata, Y.; Tayasu, I. Carbon storage reservoirs in watersheds support stream food webs via periphyton production. Ecology 2014, 95, 1264–1271. [Google Scholar] [CrossRef]
  7. Piras, F.; Fiore, B.; Santoro, A. Small Cultural Forests: Landscape Role and Ecosystem Services in a Japanese Cultural Landscape. Land 2022, 11, 1494. [Google Scholar] [CrossRef]
  8. Zheng, X.; Natuhara, Y. Landscape and local correlates with two green tree-frogs, Rhacophorus (Amphibia: Rhacophoridae) in different habitats, central Japan. Landsc. Ecol. Eng. 2020, 16, 199–206. [Google Scholar] [CrossRef]
  9. Mizusawa, N.; Reza, M.S.; Oikawa, C.; Kuga, S.; Iijima, M.; Kobiyama, A.; Yamada, Y.; Ikeda, Y.; Ikeda, D.; Ikeo, K.; et al. Diversity and functions of bacterial communities in water and sediment from the watershed of the Tama River flowing a highly urbanized area. Fish. Sci. 2021, 87, 697–715. [Google Scholar] [CrossRef]
  10. Ide, J.I.; Takeda, I.; Somura, H.; Mori, Y.; Sakuno, Y.; Yone, Y.; Takahashi, E. Impacts of hydrological changes on nutrient transport from diffuse sources in a rural river basin, western Japan. J. Geophys. Res. Biogeosci. 2019, 124, 2565–2581. [Google Scholar] [CrossRef]
  11. Asaeda, T.; Rahman, M.; Vamsi-Krishna, L.; Schoelynck, J.; Rashid, M.H. Measurement of foliar H2O2 concentration can be an indicator of riparian vegetation management. Sci. Rep. 2022, 12, 13803. [Google Scholar] [CrossRef]
  12. Asaeda, T.; García de Jalón, D.; O’Hare, M.; Rahman, M. Sequential riparian vegetation alteration in Japanese river landscapes. Int. J. River Basin Manag. 2023, 23, 1–13. [Google Scholar] [CrossRef]
  13. Ito, H.; Ito, S.; Matsui, T.; Marutani, T. Effect of fluvial and geomorphic disturbances on habitat segregation of tree species in a sedimentation-dominated riparian forest in warm-temperate mountainous region in southern Japan. J. For. Res. 2006, 11, 405–417. [Google Scholar] [CrossRef]
  14. Mahmud, M.R.; Numata, S.; Hosaka, T. Mapping an invasive goldenrod of Solidago altissima in urban landscape of Japan using multi-scale remote sensing and knowledge-based classification. Ecol. Indic. 2020, 111, 105975. [Google Scholar] [CrossRef]
  15. Uchida, T.; Nomura, R.; Asaeda, T.; Rashid, M.H. Co-existence of Sicyos angulatus and native plant species in the floodplain of Tama River, Japan. Int. J. Biodivers. Conserv. 2012, 4, 336–347. [Google Scholar] [CrossRef]
  16. Tilman, D.; Wedin, D.; Knops, J. Productivity and sustainability influenced by biodiversity in grassland ecosystems. Nature 2001, 418, 617–620. [Google Scholar] [CrossRef]
  17. Stevens, J.M.; Fehmi, J.S. Early establishment of a native grass reduces the competitive effect of a non-native grass. Restor. Ecol. 2011, 19, 399–406. [Google Scholar] [CrossRef]
  18. LeJeune, K.D.; McLachlan, J.S. The role of nitrogen in plant invasions: A review of the evidence. Front. Ecol. Environ. 2004, 2, 103–110. [Google Scholar]
  19. Asaeda, T.; Rashid, M.H.; Liping, X.; Vamsi-Krishna, L.; Barnuevo, A.; Takeuchi, C.; Rahman, M. The distribution of submerged macrophytes in response to intense solar radiation and salinity reveals hydrogen peroxide as an abiotic stress indicator. Sci. Rep. 2023, 13, 4548. [Google Scholar] [CrossRef]
  20. Walker, L.R.; Smith, S.D. Impacts of invasive plants on community and ecosystem properties. In Assessment and Management of Plant Invasions; Springer New York: New York, NY, USA, 1997; pp. 69–86. [Google Scholar]
  21. Zhang, L.; Natuhara, Y.; Zhao, J.; Cao, Y. Effects of soil properties and urbanization on the trait variations of riparian species: Evidence from central Japan. J. Biotech. Res. 2024, 16, 37–383. [Google Scholar]
  22. Sato, T.; Ito, S.; Mitsuda, Y.; Soen, N. Impacts of land-use history on the diversity of a riparian forest landscape in warm-temperate Kyushu, southern Japan. Landsc. Ecol. Eng. 2010, 6, 89–98. [Google Scholar] [CrossRef]
  23. Yamamoto, K.; Iida, S.; Tanaka, M. Soil moisture and biodiversity in riparian ecosystems of Japan. Biodivers. Conserv. 2016, 25, 1129–1144. [Google Scholar]
  24. Rashid, M.; Asaeda, T. Seasonal variation of carbohydrates in Pueraria montana as affected by soil characteristics in a river floodplain. In Proceedings of the 36th IAHR World Congress, The Hague, The Netherlands, 28 June–3 July 2015; pp. 1–4. [Google Scholar]
  25. Rashid, M.H.; Uddin, M.N.; Sarkar, A.; Parveen, M.; Asaeda, T. The growth and nutrient uptake of invasive vines on contrasting riverbank soils. River Res. Appl. 2019, 35, 749–758. [Google Scholar] [CrossRef]
  26. Guildford, S.J.; Hecky, R.E. Total nitrogen, total phosphorus, and nutrient limitation in lakes and oceans: Is there a common relationship? Limnol. Oceanogr. 2000, 45, 1213–1223. [Google Scholar] [CrossRef]
  27. Dolman, A.M.; Mischke, U.; Wiedner, C. Lake-type-specific seasonal patterns of nutrient limitation in German lakes, with target nitrogen and phosphorus concentrations for good ecological status. Freshw. Biol. 2016, 61, 444–456. [Google Scholar] [CrossRef]
  28. Junker, L.V.; Ensminger, I. Relationship between leaf optical properties, chlorophyll fluorescence and pigment changes in senescing Acer saccharum leaves. Tree Physiol. 2016, 36, 694–711. [Google Scholar] [CrossRef]
  29. Barua, D.; Heckathorn, S.A. The interactive effects of light and temperature on heat-shock protein accumulation in Solidago altissima (Asteraceae) in the field and laboratory. Am. J. Bot. 2006, 93, 102–109. [Google Scholar] [CrossRef]
  30. Niinemets, Ü. Is there a species spectrum within the world-wide leaf economics spectrum? Major variations in leaf functional traits in the Mediterranean sclerophyll Quercus ilex. New Phytol. 2015, 205, 79–96. [Google Scholar] [CrossRef]
  31. Pollastrini, M.; Holland, V.; Brüggemann, W.; Bussotti, F. Chlorophyll a fluorescence analysis in forests. Ann. Di Bot. 2016, 6, 23–37. [Google Scholar]
  32. Guo, W.Y.; Lambertini, C.; Guo, X.; Li, X.Z.; Eller, F.; Brix, H. Phenotypic traits of the Mediterranean Phragmites australis M1 lineage: Differences between the native and introduced ranges. Biol. Invasions 2016, 18, 2551–2561. [Google Scholar] [CrossRef]
  33. Qian, J.; Liu, Y.; Wang, P.; Hu, J.; Lu, B.; Tang, S.; Zhang, C.; Gao, P. Responses of riparian plant roots to acute combined nitrogen and phosphorus stress: Changes in root morphology and antioxidant system. Aquat. Ecol. 2023, 57, 715–732. [Google Scholar] [CrossRef]
  34. Yin, M.; Wang, S.; Wang, Y.; Wei, R.; Liang, Y.; Zuo, L.; Huo, M.; Huang, Z.; Lang, J.; Zhao, X.; et al. Impact of Abiotic Stress on Rice and the Role of DNA Methylation in Stress Response Mechanisms. Plants 2024, 13, 2700. [Google Scholar] [CrossRef]
  35. Tränkner, M.; Jákli, B.; Tavakol, E.; Geilfus, C.M.; Cakmak, I.; Dittert, K.; Senbayram, M. Magnesium deficiency decreases biomass water-use efficiency and increases leaf water-use efficiency and oxidative stress in barley plants. Plant Soil 2016, 406, 409–423. [Google Scholar] [CrossRef]
  36. Jana, S.; Choudhuri, M.A. Glycolate metabolism of three submerged aquatic angiosperms during aging. Aquat. Bot. 1981, 12, 345–354. [Google Scholar] [CrossRef]
  37. Brennan, T.; Frenkel, C. Involvement of Hydrogen Peroxide in the Regulation of Senescence in Pear. Plant Physiol. 1977, 59, 411–416. [Google Scholar] [CrossRef] [PubMed]
  38. Mittler, R. Oxidative stress, antioxidants and stress tolerance. Trends Plant Sci. 2002, 7, 405–410. [Google Scholar] [CrossRef]
  39. Suzuki, N.; Rivero, R.M.; Shulaev, V.; Blumwald, E.; Mittler, R. Abiotic and biotic stress combinations. New Phytol. 2014, 203, 32–43. [Google Scholar] [CrossRef]
  40. Niu, L.; Liao, W. Hydrogen peroxide signaling in plant development and abiotic responses: Crosstalk with nitric oxide and calcium. Front. Plant Sci. 2016, 7, 230. [Google Scholar] [CrossRef]
  41. Asaeda, T.; Rahman, M.; Abeynayaka, H.D.L. Hydrogen peroxide can be a plausible biomarker in cyanobacterial bloom treatment. Sci. Rep. 2022, 12, 12. [Google Scholar] [CrossRef]
  42. Asaeda, T.; Rahman, M.; Liping, X.; Schoelynck, J. Hydrogen peroxide variation patterns as abiotic stress responses of Egeria densa. Front. Plant Sci. 2022, 13, 855477. [Google Scholar] [CrossRef]
  43. Rahman, M.; Asaeda, T.; Abeynayaka, H.D.L.; Fukahori, K. An Assessment of the Effects of Light Intensities and Temperature Changes on Cyanobacteria’s Oxidative Stress via the Use of Hydrogen Peroxide as an Indicator. Water 2023, 15, 2429. [Google Scholar] [CrossRef]
  44. Satterfield, C.N.; Bonnell, A.H. Interferences in titanium sulfate method for hydrogen peroxide. Anal. Chem. 1955, 27, 1174–1175. [Google Scholar] [CrossRef]
  45. Sharma, P.; Jha, A.B.; Dubey, R.S.; Pessarakli, M. Reactive oxygen species, oxidative damage, and antioxidative defense mechanism in plants under stressful conditions. J. Bot. 2012, 2012, 217037. [Google Scholar] [CrossRef]
  46. Rahman, M.; Asaeda, T.; Fukahori, K.; Imamura, F.; Nohara, A.; Matsubayashi, M. Hydrogen Peroxide Measurement Can Be Used to Monitor Plant Oxidative Stress Rapidly Using Modified Ferrous Oxidation Xylenol Orange and Titanium Sulfate Assay Correlation. Int. J. Plant Biol. 2023, 14, 546–557. [Google Scholar] [CrossRef]
  47. Rashid, M.H.; Asaeda, T.; Uddin, M.N. Litter-mediated allelopathic effects of kudzu (Pueraria montana) on Bidens pilosa and Lolium perenne and its persistence in soil. Weed Biol. Manag. 2010, 10, 48–56. [Google Scholar] [CrossRef]
  48. Wellburn, A.R. The spectral determination of chlorophylls a and b, as well as total carotenoids, using various solvents with spectrophotometers of different resolution. J. Plant Physiol. 1994, 144, 307–313. [Google Scholar] [CrossRef]
  49. Gardner, W.H. Water content. In Methods of Soil Analysis: Part 1 Physical and Mineralogical Methods; American Society of Agronomy, Inc.: Madison, WI, USA, 1986; Volume 5, pp. 493–544. [Google Scholar]
  50. APHA; AWWA; WEF. Standard Methods for the Examination of Water and Wastewater, 24th ed.; Lipps, W.C., Braun-Howland, E.B., Baxter, T.E., Eds.; APHA Press: Baltimore, MD, USA, 2023; Available online: https://www.standardmethods.org/24theditioncitation (accessed on 9 July 2025).
  51. R Core Team. R: A Language And Environment For Statistical Computing; R Foundation for Statistical Computing: Vienna, Austria, 2024; Available online: https://www.R-project.org/ (accessed on 10 July 2025).
  52. Drexler, M.; Ainsworth, C.H. Generalized additive models used to predict species abundance in the Gulf of Mexico: An ecosystem modeling tool. PLoS ONE 2013, 8, e64458. [Google Scholar] [CrossRef]
  53. Rahman, M.; Asaeda, T.; Fukahori, K.; Rashid, M.H.; Matsuo, A. Diurnal and Thermal Variations in an Oxidative Stress Biomarker of Pseudanabaena foetida: A Model for Environmental Adaptation in Aquatic Ecosystems. Stresses 2025, 5, 20. [Google Scholar] [CrossRef]
  54. Roach, T.; Miller, R.; Aigner, S.; Kranner, I. Diurnal changes in the xanthophyll cycle pigments of freshwater algae correlate with the environmental hydrogen peroxide concentration rather than non-photochemical quenching. Ann. Bot. 2015, 116, 519–527. [Google Scholar] [CrossRef]
  55. Foyer, C.H.; Shigeoka, S. Understanding oxidative stress and antioxidant functions to enhance photosynthesis. Plant Physiol. 2011, 155, 93–100. [Google Scholar] [CrossRef]
  56. Morris, J.T.; Shaffer, G.P.; Nyman, J.A. Brinson review: Perspectives on the influence of nutrients on the sustainability of coastal wetlands. Wetlands 2013, 33, 975–988. [Google Scholar] [CrossRef]
  57. Egli, P.; Schmid, B. Seasonal dynamics of biomass and nitrogen in canopies of Solidago altissima and effects of a yearly mowing treatment. Acta Oecologica 2000, 21, 63–77. [Google Scholar] [CrossRef]
  58. Fengxi, Z.; Shihui, Y.; Meihui, L.; Xinyu, L.; Zhang, X.; Yong, C.; Hong, Z. Adaptive strategies of structures that enhance invasion in Sicyos angulatus. Not. Bot. Horti Agrobot. Cluj Napoca 2019, 47, 1323–1330. [Google Scholar]
  59. Ashworth, S.M.; Foster, B.L.; Kindscher, K. Relative contributions of adjacent species set and environmental conditions to plant community richness and composition in a group of created wetlands. Wetlands 2006, 26, 193–204. [Google Scholar] [CrossRef]
  60. Chapin, F.S., III. Effects of plant traits on ecosystem and regional processes: A conceptual framework for predicting the consequences of global change. Ann. Bot. 2003, 91, 455–463. [Google Scholar] [CrossRef]
  61. Xu, X.; Thornton, P.E.; Post, W.M. A global analysis of soil microbial biomass carbon, nitrogen and phosphorus in terrestrial ecosystems. Glob. Ecol. Biogeogr. 2013, 22, 737–749. [Google Scholar] [CrossRef]
  62. Deng, Q.; Hui, D.; Luo, Y.; Elser, J.; Wang, Y.P.; Loladze, I.; Zhang, Q.; Dennis, S. Down-regulation of tissue N: P ratios in terrestrial plants by elevated CO2. Ecology 2015, 96, 3354–3362. [Google Scholar] [CrossRef]
  63. Bratt, A.R.; Finlay, J.C.; Welter, J.R.; Vculek, B.A.; Van Allen, R.E. Co-limitation by N and P characterizes phytoplankton communities across nutrient availability and land use. Ecosystems 2020, 23, 1121–1137. [Google Scholar] [CrossRef]
  64. Gurnell, A. Plants as river system engineers. Earth Surf. Process. Landf. 2014, 39, 4–25. [Google Scholar] [CrossRef]
  65. Liébault, F.; Piégay, H. Causes of 20th century channel narrowing in mountain and piedmont rivers of southeastern France. Earth Surf. Process. Landf. J. Br. Geomorphol. Res. Group 2002, 27, 425–444. [Google Scholar] [CrossRef]
  66. Lach, J.; Wyżga, B. Channel incision and flow increase of the upper Wisłoka River, southern Poland, subsequent to the reafforestation of its catchment. Earth Surf. Process. Landf. J. Br. Geomorphol. Res. Group 2002, 27, 445–462. [Google Scholar] [CrossRef]
  67. Annala, M.J.; Lehosmaa, K.; Ahonen, S.H.K.; Karttunen, K.; Markkola, A.M.; Puumala, I.; Mykrä, H. Effect of riparian soil moisture on bacterial, fungal and plant communities and microbial decomposition rates in boreal stream-side forests. For. Ecol. Manag. 2022, 519, 120344. [Google Scholar] [CrossRef]
  68. Hossain, M.A.; Bhattacharjee, S.; Armin, S.M.; Qian, P.; Xin, W.; Li, H.Y.; Burritt, D.J.; Fujita, M.; Tran, L.S.P. Hydrogen peroxide priming modulates abiotic oxidative stress tolerance: Insights from ROS detoxification and scavenging. Front. Plant Sci. 2015, 6, 420. [Google Scholar] [CrossRef]
  69. Kato-Noguchi, H.; Kato, M. Allelopathy and allelochemicals of Solidago canadensis L. and S. altissima L. for their naturalization. Plants 2022, 11, 3235. [Google Scholar]
Figure 1. The selected species for the current study are Artemisia princeps (a), Sicyos angulatus (b), and Solidago altissima (c).
Environments 12 00247 g001
Figure 2. Effect of soil moisture and PPFD on the generation of H2O2 concentration of A. princeps (a,b), S. angulatus (c,d), and S. altissima (e,f), respectively. Vertical and horizontal bars indicate standard deviation of H2O2 and soil moisture, respectively.
Environments 12 00247 g002
Figure 3. The correlation between H2O2 and photosynthetic pigment (chl a and chl b) along with its ratio (chl a:b) of A. princeps (ac), S. angulatus (df), and S. altissima (gi), respectively. The vertical bar represents the standard deviation for H2O2 while the horizontal bar represents the standard deviation for chl a and chl b.
Environments 12 00247 g003
Figure 4. Effect of TN and TP concentration on the generation of H2O2 concentration in A. princeps (a,b), S. angulatus (c,d), and S. altissima (e,f). The vertical bar represents the standard deviation for H2O2 while the horizontal bar represents the standard deviation for TN or TP concentration.
Environments 12 00247 g004
Figure 5. The correlation with H2O2 among parameters (soil moisture, TN, and TP) in A. princeps, S. angulatus, and S. altissima conducting GAM analysis.
Environments 12 00247 g005
Table 1. Analyzing the relationship between H2O2 among parameters applying the general additive model for A. princeps.
Indicators of Smoothness (Approximately)
ParametersEDFRef. EDFFp-Value
s (soil moisture)1115.245<0.0001
s(TN)110.0380.847
s(TP)112.9620.102
R-sq.(adj) = 0.407; deviance explained = 49.2%.
Table 2. Analyzing the relationship between H2O2 among parameters applying the general additive model for S. angulatus.
Indicators of Smoothness (Approximately)
ParametersEDFRef. EDFFp-Value
s (soil moisture)1.2861.48731.908<0.001
s(TN)112.5040.1699
s(TP)1.8471.9743.7540.0578
R-sq.(adj) = 0.685; deviance explained = 74.7%.
Table 3. Analyzing the relationship between H2O2 among parameters applying the general additive model for S. altissima.
Indicators of Smoothness (APPROXIMATELY)
ParametersEDFRef. EDFFp-Value
s (soil moisture)1.8781.98212.477<0.001
s(TN)1.1781.3220.9740.455
s(TP)1.0081.0172.170.522
R-sq.(adj) = 0.563; deviance explained = 64.8%.
Table 4. Several combinations of the independent variables to assess the best model fit for each species.
Candidate ModelsdfLoglikAICΔAICWeight
A. princeps
H2O2~ s(SM)3−92.74192.8200.51
H2O2~ s(PPFD) + s(SM)4−91.61193.580.760.35
H2O2~ s(SM) + s(TN) + s(TP) *5−91.05195.843.020.11
H2O2~ s(PPFD) + s(SM) + s(TN) + s(TP)6−90.39198.375.550.03
H2O2~ s(PPFD) + s(TN) + s(TP)5−95.45204.6511.830
S. angulatus
H2O2~ s(SM)3−47.68102.6800.42
H2O2~ s(SM) + s(TN) + s(TP) *6.13−42.74103.640.960.26
H2O2~ s(PPFD) + s(SM)4−46.94104.241.550.19
H2O2~ s(PPFD) + s(SM) + s(TN) + s(TP)6.85−41.88105.072.390.13
H2O2~ s(PPFD) + s(TN) + s(TP)5.43−54.16123.6720.980
S. altissima
H2O2~ s(SM)3.79−83.52176.7400.63
H2O2~ s(SM) + s(TN) + s(TP) *6.06−80.49178.852.10.22
H2O2~ s(PPFD) + s(SM)4.78−83.51179.993.250.12
H2O2~ s(PPFD) + s(SM) + s(TN) + s(TP)6.91−80.68182.936.190.03
H2O2~ s(PPFD) + s(TN) + s(TP)5−90.82195.3918.650
* Selected model.
Table 5. Variance inflation factor (VIF) value of smooth terms of independent variables included in the GAMs.
VariablesA. princepsS. angulatusS. altissima
ToleranceVIFToleranceVIFToleranceVIF
s(SM).10.6451.5510.5881.7010.8371.195
s(SM).20.7791.2830.7771.2870.8591.164
s(TN).10.6651.5030.3682.7180.6811.469
s(TN).20.5621.7780.4002.4990.6231.606
s(TP).10.7481.3370.8791.1380.9031.108
s(TP).20.7101.4080.3502.8530.5851.710
Disclaimer/Publisher’s Note: The statements, opinions and data contained in all publications are solely those of the individual author(s) and contributor(s) and not of MDPI and/or the editor(s). MDPI and/or the editor(s) disclaim responsibility for any injury to people or property resulting from any ideas, methods, instructions or products referred to in the content.

