
Climate Change Impacts on Agricultural Suitability in Rio Grande do Sul, Brazil


Abstract
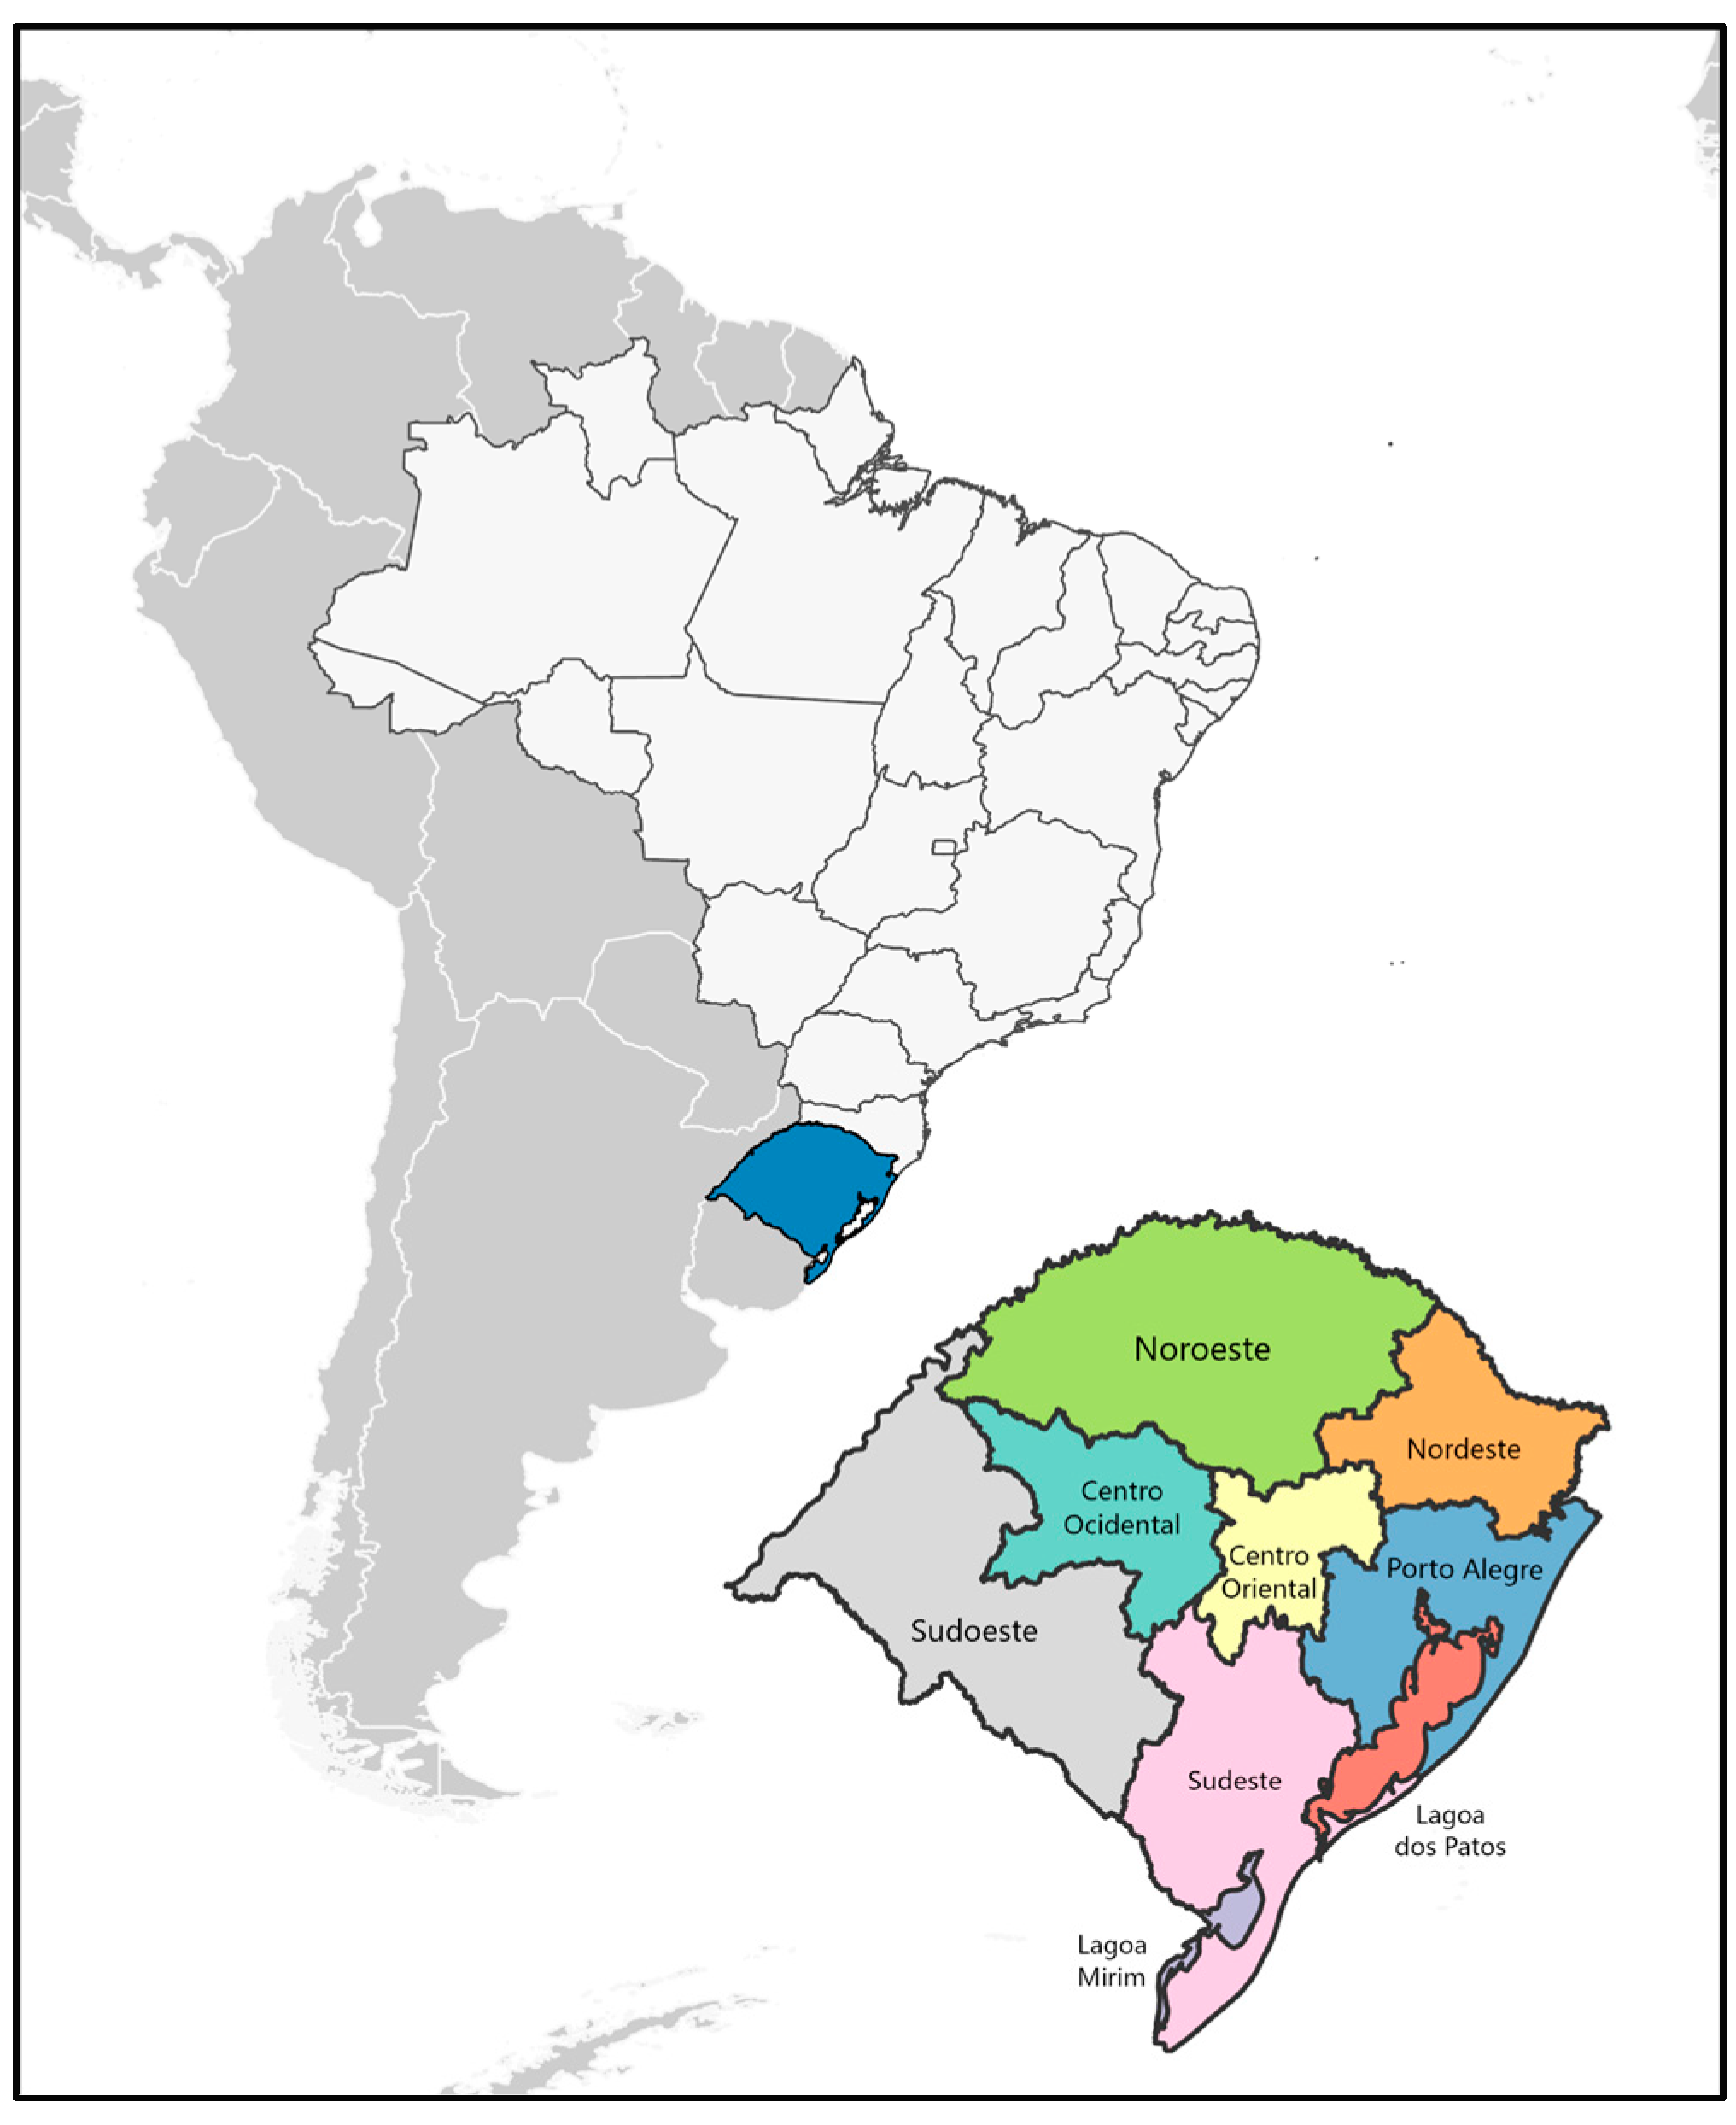
1. Introduction
2. Methods
2.1. Modeling Agriculture Suitability
2.2. Climate Data
2.3. Non-Climatic Data
2.4. Agriculture Data
3. Results
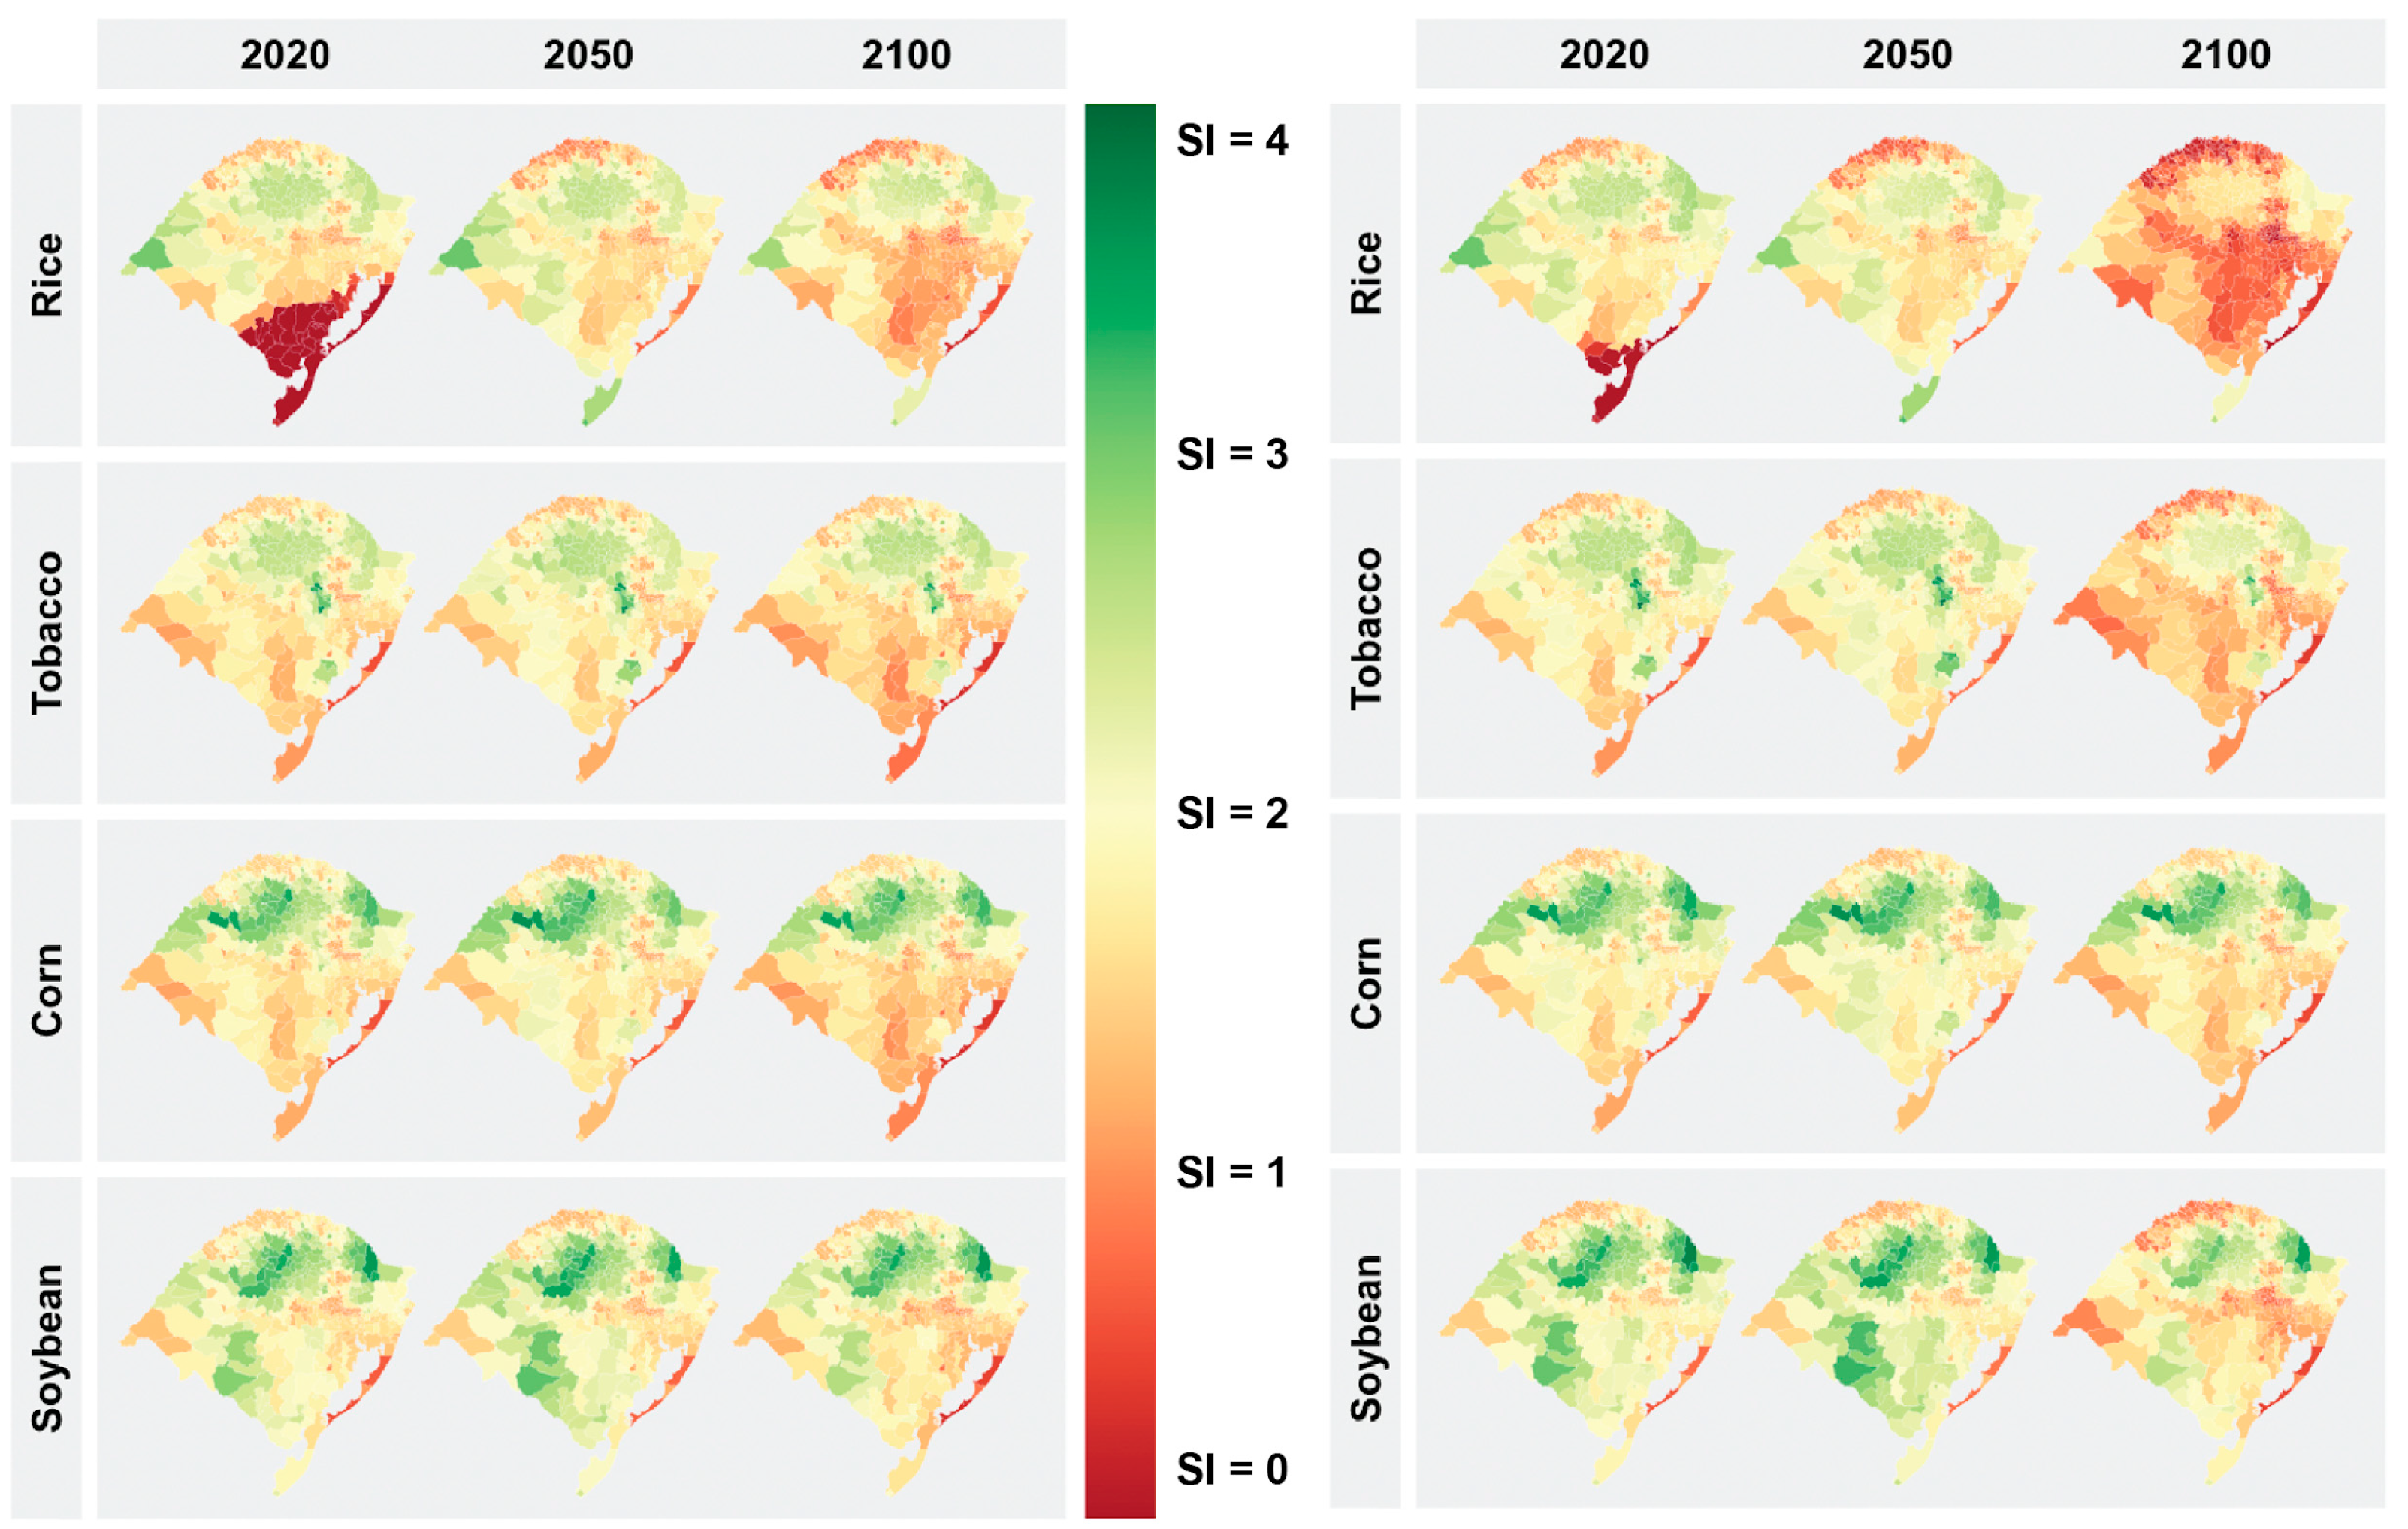
3.1. Agricultural Suitability Patterns and Change
3.1.1. Rice
3.1.2. Tobacco
3.1.3. Corn
3.1.4. Soybean
4. Discussion
4.1. Agricultural Suitability Under a Changing Climate
4.2. Policy Implications
4.2.1. Rice
4.2.2. Tobacco
4.2.3. Corn
4.2.4. Soybean
4.3. Further Implications for Rio Grande do Sul
Author Contributions
Funding
Data Availability Statement
Acknowledgments
Conflicts of Interest
Abbreviations
| RS | Rio Grande do Sul |
| SI | Suitability Index |
References
- Shahzad, A.; Ullah, S.; Dar, A.A.; Sardar, M.F.; Mehmood, T.; Tufail, M.A.; Shakoor, A.; Haris, M. Nexus on climate change: Agriculture and possible solution to cope future climate change stresses. Environ. Sci. Pollut. Res. 2021, 28, 14211–14232. [Google Scholar] [CrossRef] [PubMed]
- Yohannes, H. A review on relationship between climate change and agriculture. J. Earth Sci. Clim. Change 2016, 7, 335. [Google Scholar]
- Martha, G.B.; Cortini, E.; Alves, E. Embrapa: Its Origins and Changes. TAPipedia. Available online: https://tapipedia.org/content/embrapa-its-origins-and-changes (accessed on 13 June 2024).
- Martinelli, L.A.; Naylor, R.; Vitousek, P.M.; Moutinho, P. Agriculture in Brazil: Impacts, costs, and opportunities for a sustainable future. Curr. Opin. Environ. Sustain. 2010, 2, 431–438. [Google Scholar] [CrossRef]
- Intergovernmental Panel on Climate Change (IPCC). Central and South America. In Climate Change 2022—Impacts, Adaptation and Vulnerability: Working Group II Contribution to the Sixth Assessment Report of the Intergovernmental Panel on Climate Change; Cambridge University Press: Cambridge, UK, 2023; pp. 1689–1816. [Google Scholar]
- Martha, G., Jr.; Alves, E.; Contini, E.; Ramos, S. The development of Brazilian agriculture and future challenges. Rev. De Política Agrícola Brasília 2010, 19, 91–104. Available online: http://www.alice.cnptia.embrapa.br/alice/handle/doc/904294 (accessed on 20 June 2024).
- Instituto Brasileiro de Geografia e Estatística (IBGE). Agricultural Production in Rio Grande do Sul|IBGE. Available online: https://www.ibge.gov.br/explica/producao-agropecuaria/rs (accessed on 10 February 2025).
- Formiga, M. Grain and Feed Update, Brazil (BR2024-0038); United States Department of Agriculture Foreign Agricultural Service: Washington, DC, USA, 2024.
- UN OCHA. Brazil: Rio Grande do Sul Flood Emergency: Snapshot #4 As of 07 July 2024|OCHA. Available online: https://www.unocha.org/publications/report/brazil/brazil-rio-grande-do-sul-flood-emergency-snapshot-4-07-july-2024 (accessed on 15 August 2024).
- Giannetti, N. Brazil to Import Rice due to Southern Floods|Latest Market News. Argus Media. Available online: https://www.argusmedia.com/en/news-and-insights/latest-market-news/2567213-brazil-to-import-rice-due-to-southern-floods (accessed on 23 May 2024).
- Colussi, J.; Paulson, N.; Schnitkey, G.; Zulauf, C. Catastrophic Floods in Southern Brazil: Implications for Agricultural Sector. Farmdoc Dly. 2024, 14, 109. Available online: https://farmdocdaily.illinois.edu/2024/06/catastrophic-floods-in-southern-brazil-implications-for-agricultural-sector.html (accessed on 20 May 2024).
- Al Jazeera Staff. ‘It’s Going to Be Worse’: Brazil Braces for More Pain Amid Record Flooding. Al Jazeera. Available online: https://www.aljazeera.com/news/2024/5/4/its-going-to-be-worse-brazil-braces-for-more-pain-amid-record-flooding (accessed on 15 August 2024).
- Costa, M.A.; João, P.L.; Strauss, R.; Haas, V.; Geye, E.; Cador, M.; Hommerding, A.; Azolin, F.; Ferreira, N.; Fick, T.; et al. Rio Grande do Sul Agribusiness Outlook 2023. State Government Rio Grande do Sul. Available online: https://www.agricultura.rs.gov.br/upload/arquivos/202311/28135508-english-ended-file-rag-2023-compressed.pdf (accessed on 15 June 2024).
- Secretary of Agriculture, Livestock, and Rural Development of the state of Rio Grande do Sul (SEAPDR). Summary of Agriculture and Livestock Data in the State of Rio Grande do Sul—Brazil; Rodrigues de Souza, C.B., Translator; Department of Agricultural Policy and Rural Development: Porto Alegre, RS, Brazil, 2022; pp. 1–39.
- João, P.L.; Candor, A.; Hommerding, A.; Geyer, E.; Azolin, F.; Kopschina, L.C.; Cadore, M.; Ferreira, N.; Strauss, R.; Fick, T.; et al. Radiografia da Agropecuária Gaúcha 2024. Departamento de Governança de Sistemas Produtivos. Available online: https://www.agricultura.rs.gov.br/upload/arquivos/202408/26113434-rag-2024-22-08-24-final-capa-atualizada.pdf (accessed on 15 August 2024).
- Rovani, I.L.; Decian, V.S.; Zanin, E.M.; Brandalise, M.; Quadros, F.R.; Hepp, L.U. Socioeconomic Changes and Land Use and Land Cover of the Northern Region of Rio Grande do Sul, Brazil. Floresta E Ambiente 2020, 27, e20180258. [Google Scholar] [CrossRef]
- Pott, L.P.; Amado, T.J.C.; Schwalbert, R.A.; Corassa, G.M.; Ciampitti, I.A. Satellite-based data fusion crop type classification and mapping in Rio Grande do Sul, Brazil. ISPRS J. Photogramm. Remote Sens. 2021, 176, 196–210. [Google Scholar] [CrossRef]
- Berlato, M.A.; Fontana, D.C. El Niño e La Niña: Impactos No Clima, Na Vegetação E Na Agricultura Do Rio Grande Do Sul: Aplicações De Previsões Climáticas Na Agricultura, 1st ed.; Editora da UFRGS: Porto Alegre, RS, Brazil, 2003. [Google Scholar]
- Illinois State Water Survey. Alternative Crop Suitability Maps—Methods. ISWS. Available online: https://www.isws.illinois.edu/data/altcrops/methods.asp (accessed on 25 March 2024).
- Eyring, V.; Bony, S.; Meehl, G.A.; Senior, C.A.; Stevens, B.; Stouffer, R.J.; Taylor, K.E. Overview of the Coupled Model Intercomparison Project Phase (CMIP6) experimental design and organization. Geosci. Model Dev. 2016, 9, 1937–1958. [Google Scholar] [CrossRef]
- Sánchez, B.; Rasmussen, A.; Porter, J.R. Temperatures and the growth and development of maize and rice: A review. Glob. Change Biol. 2013, 20, 408–417. [Google Scholar] [CrossRef]
- Food and Agriculture Organization of the United Nations. Tobacco. Land & Water. 2025. Available online: https://www.fao.org/land-water/databases-and-software/crop-information/tobacco/en/ (accessed on 20 May 2024).
- Food and Agriculture Organization of the United Nations. Soybean. Land & Water. 2025. Available online: https://www.fao.org/land-water/databases-and-software/crop-information/soybean/en/ (accessed on 20 May 2024).
- Bliss, N. LBA-ECO LC-08 Soil, Vegetation, and Land Cover Maps for Brazil and South America; Oak Ridge National Laboratory Distributed Active Archive Center: Oak Ridge, TN, USA, 2013.
- Yu, T.R. Characteristics of soil acidity of paddy soils in relation to Rice Growth. Plant-Soil Interact. Low pH 1991, 45, 107–112. [Google Scholar] [CrossRef]
- Zeng, W.; Zeng, M.; Zhou, H.; Li, H.; Xu, Q.; Li, F. The effects of soil pH on tobacco growth. J. Chem. Pharm. Res. 2014, 6, 452–457. [Google Scholar]
- Mallarino, A.; Pagani, A.; Sawyer, J.E. Corn and Soybean Response to Soil pH Level and Liming. Integrated Crop Management Conference—Iowa State University. Available online: https://www.agronext.iastate.edu/soilfertility/info/Mallarino_LimeOnFarm_ICM-2011.pdf (accessed on 20 May 2024).
- NASA JPL NASA Shuttle Radar Topography Mission Global 1 Arc Second. NASA EOSDIS Land Processes DAAC. Available online: https://www.earthdata.nasa.gov/data/catalog/lpcloud-srtmgl1n-003 (accessed on 3 December 2024).
- Al-Kaisi, M. Consider Permanent Vegetation for Steeply Sloping Soils. Integrated Crop Management. Iowa State University. Available online: https://crops.extension.iastate.edu/encyclopedia/consider-permanent-vegetation-steeply-sloping-soils#:~:text=You%20also%20can%20estimate%20%22by,row%20crops%20should%20be%20avoided (accessed on 20 May 2024).
- IBGE, Diretoria de Pesquisas. Municipal Agricultural Production 2020. Rio Grande do Sul; Instituto Brasileiro de Geografia e Estatística. Available online: https://www.ibge.gov.br/en/statistics/economic/agriculture-forestry-and-fishing/16773-municipal-agricultural-production-temporary-and-permanent-crops.html?edicao=31814 (accessed on 4 October 2024).
- de Avila, L.A.; Martini, L.F.D.; Mezzomo, R.F.; Refatti, J.P.; Campos, R.; Cezimbra, D.M.; Machado, S.L.O.; Massey, J.H.; Carlesso, R.; Marchesan, E. Rice Water Use Efficiency and Yield under Continuous and Intermittent Irrigation. Agron. J. 2015, 107, 442–448. [Google Scholar] [CrossRef]
- Bento, M. Unprecedented Floods in Rio Grande do Sul Threaten Brazil’s Agricultural Output. USDA Foreign Agricultural Service. Available online: https://www.fas.usda.gov/data/brazil-unprecedented-floods-rio-grande-do-sul-threaten-brazils-agricultural-output (accessed on 23 May 2024).
- Food and Agriculture Organization of the United Nations. Crop and Livestock Products. FAOSTAT. Available online: https://www.fao.org/faostat/en/#data/QCL (accessed on 31 May 2024).
- WHO Media Team. Tobacco Use Declines Despite Tobacco Industry Efforts to Jeopardize Progress. World Health Organization (WHO). Available online: https://www.who.int/news/item/16-01-2024-tobacco-use-declines-despite-tobacco-industry-efforts-to-jeopardize-progress (accessed on 23 May 2024).
- WHO Media Team. Tobacco Farmers Switch to Sustainable Crops in Brazil. World Health Organization (WHO). Available online: https://www.who.int/news-room/feature-stories/detail/tobacco-farmers-switch-to-sustainable-crops-in-brazil (accessed on 23 May 2024).
- Oliveira, S.F.; Prado, R.B.; Monteiro, J.M.G. Impactos das mudanças climáticas na produção agrícola e medidas de adaptação sob a percepção de atores e produtores rurais de Nova Friburgo, RJ. Interações (Campo Gd.) 2023, 23, 1179–1201. [Google Scholar] [CrossRef]
- Mattos, F. Cornhusker Economics Nov 1, 2023 Notes from the Brazilian Cornfields. University of Nebraska-Lincoln, Agricultural Economics. Available online: https://digitalcommons.unl.edu/cgi/viewcontent.cgi?article=2181&context=agecon_cornhusker (accessed on 24 May 2024).
- Formiga, M. Grain and Feed Annual. USDA Foreign Agricultural Service. Available online: https://apps.fas.usda.gov/newgainapi/api/Report/DownloadReportByFileName?fileName=Grain%20and%20Feed%20Annual_Brasilia_Brazil_BR2023-0008 (accessed on 22 May 2024).
- Allen, E.; Valdez, C. Brazil’s Corn Industry and the Effect on the Seasonal Pattern of U.S. Corn Exports. USDA Economic Research Service. Available online: https://ers.usda.gov/sites/default/files/_laserfiche/outlooks/35806/59643_aes93.pdf?v=21922 (accessed on 24 May 2024).
- Song, X.-P.; Hansen, M.; Potapov, P.; Adusei, B.; Pickering, J.; Adami, M.; Lima, A.; Zalles, V. Massive Soybean Expansion in South America Since 2000 and Implications for Conservation. Nature Sustainability. Available online: https://www.nature.com/articles/s41893-021-00729-z (accessed on 27 May 2024).
- Cordonnier, M. Rio Grande do Sul Struggles with Aftermath of Historic Flooding. Soybean & Corn Advisor. Available online: https://www.soybeansandcorn.com/articles/9982/ (accessed on 27 May 2024).
- dos Santos, C.V.; de Oliveira, A.F.; de Ferreira Filho, J.B.S. Potential impacts of climate change on agriculture and the economy in different regions of Brazil. Rev. De Econ. E Sociol. Rural. 2021, 60. [Google Scholar] [CrossRef]
- Hayashi, T. Sustainable Agriculture Programs in Brazil—Past Present and Future. USDA Foreign Agricultural Service. Available online: https://apps.fas.usda.gov/newgainapi/api/Report/DownloadReportByFileName?fileName=Sustainable%20Agriculture%20Programs%20in%20Brazil-%20Past%20Present%20and%20Future_Brasilia_Brazil_BR2024-0006.pdf (accessed on 21 May 2024).
- Souza, P.; Assunção, J. Risk Management in Brazilian Agriculture: Instruments, Public Policy, and Perspectives. Climate Policy Initiative. Available online: https://www.climatepolicyinitiative.org/wp-content/uploads/2020/08/Report-%E2%80%93-Risk-Management-in-Brazilian-Agriculture.pdf (accessed on 21 May 2024).
- Cassela, J. RS Has Low Adherence to the Rural Environmental Registry (CAR). Revista Cultivar. Available online: https://revistacultivar.com/index.php/news/rs-presents-low-adherence-to-the-rural-environmental-registry-car (accessed on 15 June 2024).
- Ministério da Agricultura e Pecuária. Zoneamento Agrícola de Risco Climático—Ministério da Agricultura e Pecuária. Governo Federal. Available online: https://www.gov.br/agricultura/pt-br/assuntos/riscos-seguro/programa-nacional-de-zoneamento-agricola-de-risco-climatico/zoneamento-agricola (accessed on 29 May 2024).
- Embrapa. Submission Embrapa Ministry Agriculture SCF. UNFCC. Available online: https://unfccc.int/sites/default/files/resource/Brazil_Embrapa-MinistryAgriculture_SCF_Feb28.pdf (accessed on 29 May 2024).
- Government of the State of Rio Grande do Sul. Rio Grande Do Sul South Brazilian State Presents Itself to The World as a Model of Sustainable Diversified Agriculture. p. 14. Available online: https://www.agricultura.rs.gov.br/upload/arquivos/202211/03170627-rs-model-of-sustainable-diversified-agriculture.pdf (accessed on 15 May 2024).
- Fuentes-Llanillo, R.; Telles, T.S.; Soares Junior, D.; de Melo, T.R.; Friedrich, T.; Kassam, A. Expansion of no-tillage practice in conservation agriculture in Brazil. Soil Tillage Res. 2021, 208, 104877. [Google Scholar] [CrossRef]
- Malins, C. Multiple and Cover Cropping in Brazil, 16–17, 25–27. International Council on Clean Transportation. Available online: https://theicct.org/wp-content/uploads/2022/01/cover-cropping-biofuel-brazil-jan22.pdf (accessed on 22 May 2024).
- Seepaul, R.; Small, I.M.; Devkota, P.; Sintim, H.Y.; Mulvaney, M.J.; George, S.; Leon, R.G.; Paula-Moraes, S.V. Carinata, the Sustainable Crop for a Bio-based Economy: Production Recommendations for the Southeastern United States. SS-AGR-384/AG389: Carinata, the Sustainable Crop for a Bio-based Economy: Production Recommendations for the Southeastern United States. Available online: https://journals.flvc.org/edis/article/view/131861 (accessed on 16 June 2024).
- Cowan, N.; Ferrier, L.; Spears, B.; Drewer, J.; Reay, D.; Skiba, U. CEA Systems: The Means to Achieve Future Food Security and Environmental Sustainability? Front. Sustain. Food Syst. 2022, 6, 891256. [Google Scholar] [CrossRef]
- Stemmler, H.; Meemken, E.-M. Greenhouse farming and employment: Evidence from Ecuador. Food Policy 2023, 117, 102443. [Google Scholar] [CrossRef]
- Food and Agriculture Organization of the United Nations. Pesticide Use (RP). Food and Agriculture Organization of the United Nations. Available online: https://data.apps.fao.org/catalog/dataset/pesticides-use-rp/resource/7e330314-8680-4641-b5da-3fbe3b3a88ad (accessed on 30 May 2024).
- Sharma, A.; Kumar, V.; Shahzad, B.; Tanveer, M.; Sidhu, G.; Handa, N.; Kohli, S.; Yadav, P. Worldwide pesticide usage and its impacts on ecosystem. SN Appl. Sci. 2019, 1, 1446. [Google Scholar] [CrossRef]
- Bondareva, L.; Fedorova, N. Pesticides: Behavior in Agricultural Soil and Plants. Molecules 2021, 26, 5370. [Google Scholar] [CrossRef] [PubMed]
- Baweja, P.; Kumar, S.; Kumar, G. Fertilizers and pesticides: Their impact on soil health and environment. In Soil Health; Giri, B., Varma, A., Eds.; Springer International Publishing: Berlin/Heidelberg, Germany, 2020; pp. 265–285. [Google Scholar] [CrossRef]


| Indicator | Rice | Tobacco | Corn | Soybean |
|---|---|---|---|---|
| Temperature/Thermal Growing Window (°C) | 20–27 | 20–30 | 25–35 | 16–30 |
| Precipitation (mm/year) | ≥1200 | ≥600 | ≥550 | ≥500 |
| Model Subset | Mean | ST.Dev | Median | Min | Max | Model Subset | Mean | ST.Dev | Median | Min | Max | ||||
|---|---|---|---|---|---|---|---|---|---|---|---|---|---|---|---|
| Full dataset | 2.37 | 0.33 | 2.36 | 0.18 | 3.44 | Full dataset | 2.37 | 0.33 | 2.36 | 0.18 | 3.44 | ||||
| SSP 245 | Rice | 2020 | 2.28 | 0.43 | 2.33 | 0.18 | 3.02 | SSP 585 | Rice | 2020 | 2.37 | 0.29 | 2.38 | 0.85 | 3.04 |
| 2050 | 2.41 | 0.30 | 2.39 | 1.44 | 3.44 | 2050 | 2.28 | 0.29 | 2.29 | 1.66 | 3.12 | ||||
| 2100 | 2.22 | 0.30 | 2.18 | 1.44 | 2.89 | 2100 | 1.88 | 0.29 | 1.86 | 1.34 | 2.82 | ||||
| Tobacco | 2020 | 2.40 | 0.27 | 2.38 | 1.62 | 3.32 | Tobacco | 2020 | 2.45 | 0.27 | 2.44 | 1.65 | 3.44 | ||
| 2050 | 2.41 | 0.27 | 2.39 | 1.66 | 3.34 | 2050 | 2.44 | 0.28 | 2.43 | 1.72 | 3.43 | ||||
| 2100 | 2.36 | 0.29 | 2.33 | 1.47 | 3.21 | 2100 | 2.22 | 0.30 | 2.20 | 1.53 | 3.16 | ||||
| Corn | 2020 | 2.43 | 0.29 | 2.38 | 1.63 | 3.25 | Corn | 2020 | 2.48 | 0.28 | 2.46 | 1.65 | 3.27 | ||
| 2050 | 2.44 | 0.29 | 2.41 | 1.67 | 3.32 | 2050 | 2.48 | 0.28 | 2.46 | 1.74 | 3.33 | ||||
| 2100 | 2.40 | 0.32 | 2.35 | 1.47 | 3.24 | 2100 | 2.41 | 0.30 | 2.36 | 1.58 | 3.29 | ||||
| Soybean | 2020 | 2.44 | 0.30 | 2.41 | 1.63 | 3.29 | Soybean | 2020 | 2.49 | 0.30 | 2.47 | 1.65 | 3.38 | ||
| 2050 | 2.44 | 0.31 | 2.42 | 1.71 | 3.22 | 2050 | 2.48 | 0.31 | 2.45 | 1.76 | 3.30 | ||||
| 2100 | 2.40 | 0.32 | 2.35 | 1.47 | 3.31 | 2100 | 2.26 | 0.33 | 2.23 | 1.56 | 3.27 |
| Model Subset | % Low | % Medium | % High | Model Subset | % Low | % Medium | % High | ||||
|---|---|---|---|---|---|---|---|---|---|---|---|
| SSP 245 | Rice | 2020 | 16 | 68 | 16 | SSP 585 | Rice | 2020 | 12 | 71 | 17 |
| 2050 | 20 | 65 | 15 | 2050 | 22 | 69 | 8 | ||||
| 2100 | 32 | 57 | 11 | 2100 | 70 | 30 | 0 | ||||
| Tobacco | 2020 | 7 | 73 | 20 | Tobacco | 2020 | 2 | 76 | 22 | ||
| 2050 | 9 | 71 | 20 | 2050 | 7 | 70 | 23 | ||||
| 2100 | 12 | 71 | 18 | 2100 | 29 | 66 | 5 | ||||
| Corn | 2020 | 7 | 72 | 21 | Corn | 2020 | 1 | 76 | 23 | ||
| 2050 | 6 | 72 | 22 | 2050 | 0 | 77 | 23 | ||||
| 2100 | 11 | 68 | 21 | 2100 | 9 | 70 | 21 | ||||
| Soybean | 2020 | 7 | 71 | 23 | Soybean | 2020 | 1 | 74 | 25 | ||
| 2050 | 7 | 69 | 24 | 2050 | 4 | 69 | 27 | ||||
| 2100 | 11 | 68 | 21 | 2100 | 30 | 57 | 13 |
| Rice | Tobacco | Corn | Soy | |||||||||||||
|---|---|---|---|---|---|---|---|---|---|---|---|---|---|---|---|---|
| SSP245 | ||||||||||||||||
| Mesoregion | 2020 | 2050 | 2100 | Net Change | 2020 | 2050 | 2100 | Net Change | 2020 | 2050 | 2100 | Net Change | 2020 | 2050 | 2100 | Net Change |
| Sudoeste Rio-Grandense | 2.37 | 2.56 | 2.35 | −1.1% | 2.28 | 2.38 | 2.20 | −3.2% | 2.36 | 2.47 | 2.30 | −2.8% | 2.6 | 2.7 | 2.5 | −2.8% |
| Sudeste Rio-Grandense | 1.17 | 2.32 | 2.05 | 74.8% | 2.15 | 2.25 | 2.00 | −7.1% | 2.15 | 2.24 | 2.00 | −7.1% | 2.4 | 2.5 | 2.2 | −6.4% |
| Noroeste Rio-Grandense | 2.54 | 2.48 | 2.42 | −4.7% | 2.58 | 2.57 | 2.57 | −0.1% | 2.71 | 2.71 | 2.72 | 0.1% | 2.7 | 2.7 | 2.7 | −0.1% |
| Nordeste Rio-Grandense | 2.54 | 2.48 | 2.50 | −1.6% | 2.54 | 2.49 | 2.53 | −0.6% | 2.67 | 2.61 | 2.65 | −0.6% | 2.7 | 2.6 | 2.6 | −0.6% |
| Metropolitana De Porto Alegre | 1.85 | 2.20 | 2.02 | 9.0% | 2.22 | 2.24 | 2.11 | −5.0% | 2.19 | 2.21 | 2.08 | −4.8% | 2.2 | 2.2 | 2.1 | −5.0% |
| Centro Oriental Rio-Grandense | 2.24 | 2.25 | 2.04 | −8.8% | 2.44 | 2.49 | 2.35 | −3.6% | 2.33 | 2.38 | 2.25 | −3.5% | 2.4 | 2.4 | 2.3 | −3.7% |
| Centro Ocidental Rio-Grandense | 2.42 | 2.48 | 2.27 | −6.1% | 2.39 | 2.48 | 2.34 | −2.0% | 2.50 | 2.60 | 2.46 | −1.8% | 2.6 | 2.7 | 2.6 | −1.8% |
| SSP585 | ||||||||||||||||
| Mesoregion | 2020 | 2050 | 2100 | Net Change | 2020 | 2050 | 2100 | Net Change | 2020 | 2050 | 2100 | Net Change | 2020 | 2050 | 2100 | Net Change |
| Sudoeste Rio-Grandense | 2.56 | 2.52 | 2.06 | −19.6% | 2.36 | 2.42 | 2.09 | −11.5% | 2.452 | 2.527 | 2.355 | −4.0% | 2.65 | 2.71 | 2.38 | −10.3% |
| Sudeste Rio-Grandense | 1.79 | 2.36 | 1.89 | 5.8% | 2.20 | 2.32 | 2.05 | −6.5% | 2.194 | 2.32 | 2.111 | −3.8% | 2.44 | 2.56 | 2.29 | −5.8% |
| Noroeste Rio-Grandense | 2.52 | 2.38 | 2.02 | −19.9% | 2.57 | 2.57 | 2.38 | −7.3% | 2.716 | 2.723 | 2.721 | 0.2% | 2.68 | 2.68 | 2.49 | −7.0% |
| Nordeste Rio-Grandense | 2.63 | 2.53 | 2.25 | −14.4% | 2.64 | 2.56 | 2.47 | −6.5% | 2.76 | 2.686 | 2.626 | −4.9% | 2.76 | 2.69 | 2.59 | −6.2% |
| Metropolitana De Porto Alegre | 2.31 | 2.23 | 1.79 | −22.3% | 2.33 | 2.33 | 2.06 | −11.3% | 2.295 | 2.297 | 2.141 | −6.7% | 2.32 | 2.32 | 2.05 | −11.4% |
| Centro Oriental Rio-Grandense | 2.33 | 2.25 | 1.73 | −25.6% | 2.54 | 2.58 | 2.24 | −11.9% | 2.433 | 2.471 | 2.306 | −5.2% | 2.49 | 2.52 | 2.19 | −12.1% |
| Centro Ocidental Rio-Grandense | 2.49 | 2.42 | 1.94 | −22.0% | 2.47 | 2.54 | 2.20 | −11.1% | 2.59 | 2.665 | 2.518 | −2.8% | 2.684 | 2.748 | 2.41 | −10.2% |
Disclaimer/Publisher’s Note: The statements, opinions and data contained in all publications are solely those of the individual author(s) and contributor(s) and not of MDPI and/or the editor(s). MDPI and/or the editor(s) disclaim responsibility for any injury to people or property resulting from any ideas, methods, instructions or products referred to in the content. |
© 2025 by the authors. Licensee MDPI, Basel, Switzerland. This article is an open access article distributed under the terms and conditions of the Creative Commons Attribution (CC BY) license (https://creativecommons.org/licenses/by/4.0/).
Share and Cite
Haggerty, E.; Wertlieb, E.R.; Streletskiy, D.A. Climate Change Impacts on Agricultural Suitability in Rio Grande do Sul, Brazil. Environments 2025, 12, 222. https://doi.org/10.3390/environments12070222
Haggerty E, Wertlieb ER, Streletskiy DA. Climate Change Impacts on Agricultural Suitability in Rio Grande do Sul, Brazil. Environments. 2025; 12(7):222. https://doi.org/10.3390/environments12070222
Chicago/Turabian StyleHaggerty, Emma, Ethan R. Wertlieb, and Dmitry A. Streletskiy. 2025. "Climate Change Impacts on Agricultural Suitability in Rio Grande do Sul, Brazil" Environments 12, no. 7: 222. https://doi.org/10.3390/environments12070222
APA StyleHaggerty, E., Wertlieb, E. R., & Streletskiy, D. A. (2025). Climate Change Impacts on Agricultural Suitability in Rio Grande do Sul, Brazil. Environments, 12(7), 222. https://doi.org/10.3390/environments12070222