Article

Coupling Coagulation–Flocculation–Sedimentation with Adsorption on Biosorbent (Corncob) for the Removal of Textile Dyes from Aqueous Solutions

by
Hadj Boumedien Rahmoun
1,*,
Maamar Boumediene
2,
Abderahmane Nekkache Ghenim
1,
Eduardo Ferreira Da Silva
3,* and
João Labrincha
4
1
Eau et Ouvrages dans Leur Environnement (EOLE) Laboratory, Department of Hydraulic, Faculty of Technology, University of Tlemcen, Tlemcen 13000, Algeria
2
Promotion des Ressources Hydriques, Minières et Pédologiques: Législation de l’Environnement et Choix Technologiques Laboratory, Department of Hydraulic, Faculty of Technology, University of Tlemcen, Tlemcen 13000, Algeria
3
GeoBioTec Research Unit, Department of Geosciences, Campus de Santiago, University of Aveiro, 3810-193 Aveiro, Portugal
4
Associate Laboratory CICECO—Aveiro Institute of Materials, Department of Material Engineering and Ceramics, Campus de Santiago, University of Aveiro, 3810-193 Aveiro, Portugal
*
Authors to whom correspondence should be addressed.
Environments 2025, 12(6), 201; https://doi.org/10.3390/environments12060201
Submission received: 20 May 2025 / Revised: 30 May 2025 / Accepted: 4 June 2025 / Published: 13 June 2025

Abstract

This study investigates the combined application of coagulation–flocculation–sedimentation (CFS) and adsorption using corncob (CC) biosorbent for the removal of textile dyes from aqueous solutions. Two synthetic dyes Bemacron Blue RS 01 (BB-RS01), a disperse dye, and Bemacid Marine N-5R (BM-N5R), an acid dye were selected for evaluation. The coagulation–flocculation process utilized aluminum sulfate as the coagulant and Superfloc 8396 as the flocculant, with operational parameters including coagulant concentrations ranging from 50 to 600 mg/L, flocculant concentrations between 30 and 125 mg/L, and pH levels spanning from 2 to 11. The corncob biosorbent was characterized using FTIR, SEM, BET, TGA/DTA, and pHpzc analyses. Adsorption isotherm experiments indicated a more favorable correlation with the Langmuir model (R2 = 0.92–0.96), which supports monolayer adsorption. At pH 8, the CFS process achieved a dye removal efficiency of 95.1% for BB-RS01 and 92.3% for BM-N5R was achieved at pH 6.5. The maximum adsorption capacities of BB-RS01 were determined to be 99.5 mg/g, while BM-N5R was found to be 46.08 mg/g. These results indicate that the integration of CFS with raw corncob adsorption provides a cost-effective and efficient method for the remediation of textile dyes.

1. Introduction

Currently, the increase in environmental pollution has led to extensive study on sustainable wastewater treatment methods. Synthetic dyes resulting from industrial processes provide significant challenges due to their toxic effects and persistence among other contaminants [1]. Dyes are integrated into wastewater from textile industries, which then release detrimental effluents containing a mixture of pollutants, including dyes. The refining process in the textile industry may emit pollutants detrimental to animals and plants, thereby impacting biodiversity [2,3]. The intrinsic durability and limited biodegradability of synthetic dyes produced by industrial methods pose a considerable environmental issue [4]. Global output surpasses 700,000 tonnes per year, with over 100,000 dye variations in circulation [5]. According to Zollinger [6], the textile industry is responsible for releasing up to 50% of these dyes into natural ecosystems.
In addition to harmful heavy metals, industrial effluents are contaminated with various organic compounds such as dyes, solvents, pigments, and surfactants. These substances are chemically stable and have low biodegradability, posing a significant threat to the environment’s flora and fauna. Dyeing and finishing industries must treat wastewater containing high organic loads and persistent dyes to meet environmental regulations before discharge [7,8]. Methods such as coagulation/flocculation [9,10], catalytic ozonation [4], and electrocoagulation [11,12] have proven effective in treating low dye concentrations in textile wastewater. Additional techniques include Electro-Fenton [13,14,15], photo-degradation [16], biodegradation [17,18], adorption [19,20,21], membrane processes [22,23], and advanced oxidation processes (AOPs) [24] are also used for this purpose.
These methods face several significant challenges, including the generation of hazardous sediment, long treatment times, high energy consumption, and costly operations, all of which limit their widespread use [25,26]. However, preliminary treatment may be necessary to effectively remove pigments and enable water reuse at higher concentrations. Despite their high cost, research suggests that combining techniques such as adsorption with nanofiltration [27] or coagulation–flocculation with nanofiltration [28] can enhance efficiency.
The integration of adsorption with coagulation–flocculation serves as an effective approach for sustainable wastewater treatment, emphasizing the importance of resource efficiency and environmental preservation. This comprehensive method can yield synergistic results, improving dye removal efficiency and increasing overall treatment efficacy. By combining these processes, the integration effectively addresses the limitations of each individual technique, offering a more efficient solution for treating textile dye effluents [28]. The coagulation–flocculation–sedimentation (CFS) process is widely used in wastewater treatment due to its economic viability, ease of implementation, and effectiveness, particularly in reducing turbidity and suspended solids [29,30,31]. However, its effectiveness may be limited when it comes to removing particular pigments [32].
Various coagulants, such as aluminum sulfate (alum), ferric chloride, ferric sulfate, polyaluminum chloride (PAC), titanium, and natural coagulants like Moringa oleifera, have been widely reported in the literature for their effectiveness in destabilizing dye particles and enhancing floc formation [9,33,34,35,36].
Enhancing the efficacy of dye removal from wastewater may require the implementation of supplementary treatment methodologies. Among these, adsorption is notable for its simplicity, effectiveness, and widespread application [37,38]. This approach has demonstrated efficiency and cost-effectiveness, especially for dye concentrations under 100 mg/L [39,40].
Research has explored the combination of adsorption with coagulation–flocculation using materials such as activated carbon [31,41], graphene oxide [42], and montmorillonite clay [43]. Activated carbon is particularly known for its exceptional ability to remove dyes from water due to its high adsorption capacity and effectiveness against various pollutants. However, its widespread use is limited by high costs and the difficulties involved in regeneration [44,45]. Due to this fact, numerous studies in recent years have focused on investigating low-cost alternative adsorbents for dye remediation from aqueous solutions. The literature reports on the effectiveness of various agricultural by-products as eco-friendly adsorbents for reducing dye in water [46,47,48,49]. Nevertheless, no previous studies have explored the coupling of coagulation–flocculation with adsorption using waste biomaterials for textile dye removal.
This study aims to evaluate the efficiency of combining the coagulation–flocculation–sedimentation (CFS) method with the adsorption process using corncob (CC), as a low-cost biosorbent, to remove dyes from synthetic aqueous solutions. CC (corncob), an abundant agricultural waste material in Algeria, is rich in lignin and cellulose. From aqueous solutions, this biomaterial has been assessed for its ability to remove anionic, cationic, and azo dyes from aqueous solutions [50,51,52]. In this context, this research investigates the efficiency of using CC as a biosorbent for textile dye removal after the CFS process. The integration of these methodologies seeks to enhance the efficacy of dye removal by leveraging the advantages inherent in both techniques (refer to Scheme 1).

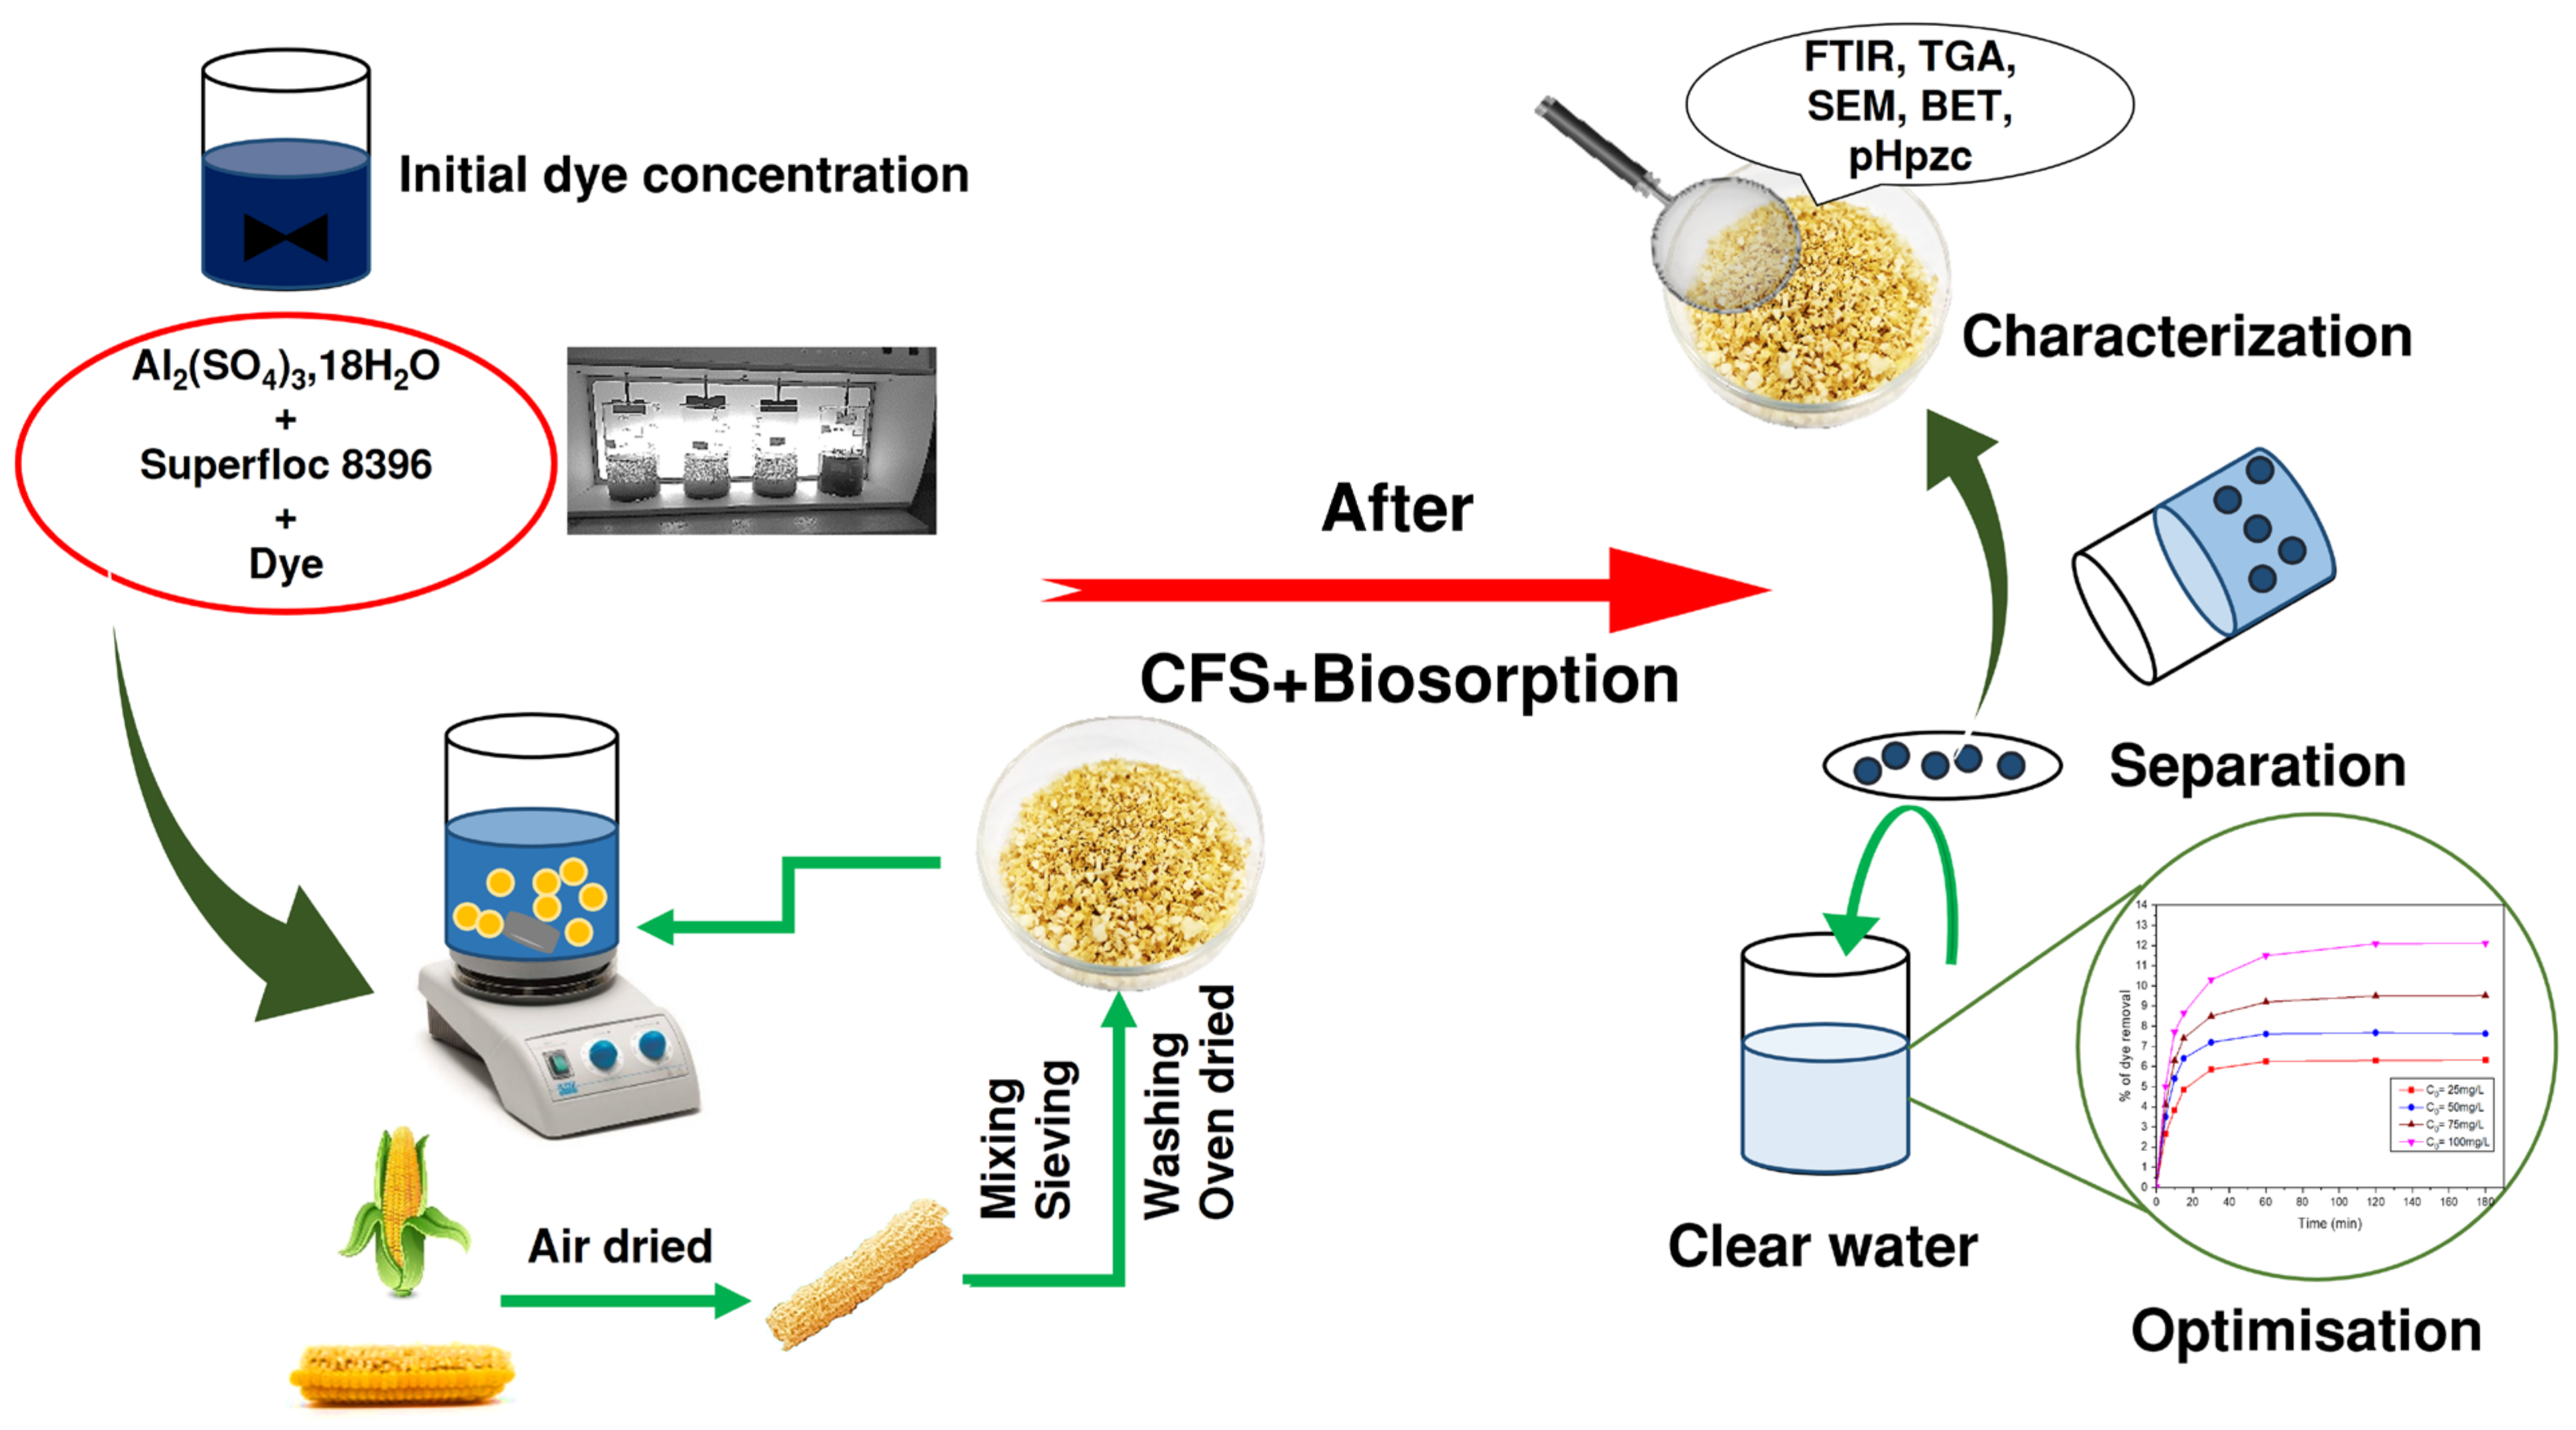
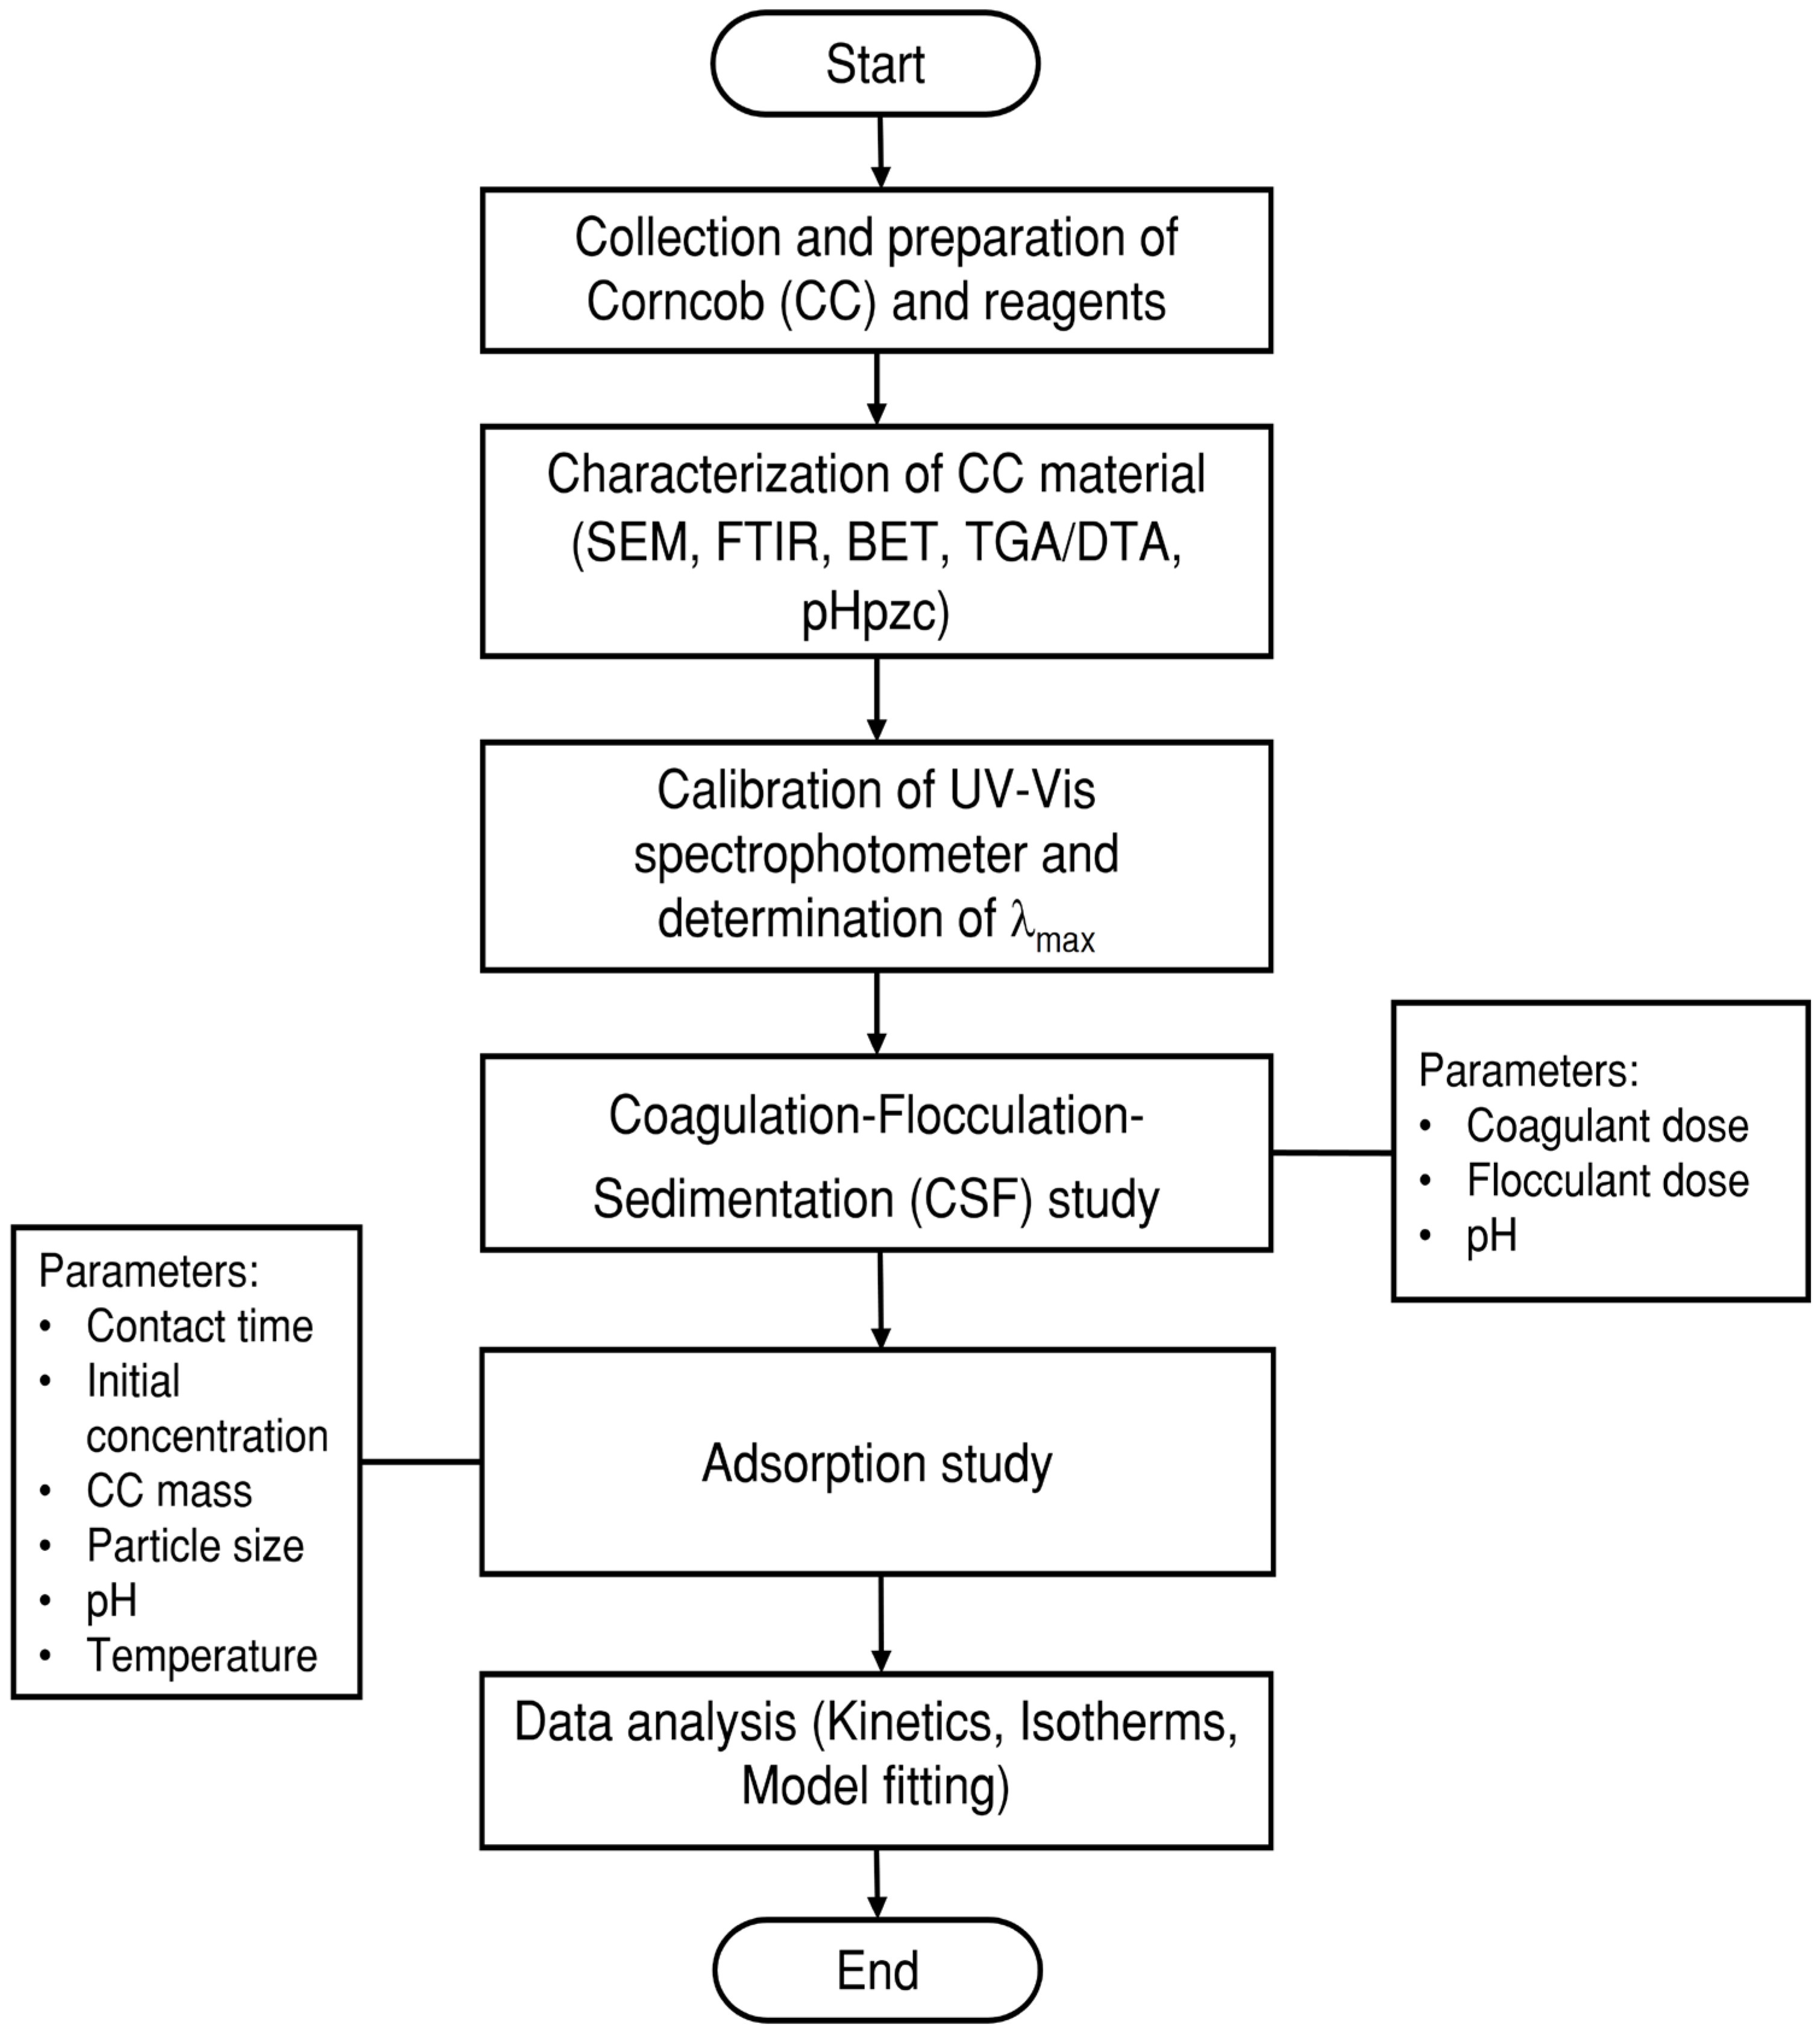
2. Materials and Methods

2.1. Dyes, Coagulants, and Flocculants

In our investigation, two categories of synthetic dyes were used: Bemacron Blue RS 01 (BB-RS01), a disperse dye purchased from Bezema (Montlingen, SG, Switzerland), and Bemacid Marine N-5R (BM-N5R), an acid dye from CHT (Tübingen, BW, Germany). These dyes were supplied by the SOITINE Textile Company of Nedroma based in Tlemcen (Tlemcen, TLM, West of Algeria). Bemacron Blue RS 01 (BB-RS01) is commonly used for dyeing polyester fibers, while Bemacid Marine N-5R (BM-N5R) is used for dyeing polyamide and wool. Their chemical properties (formula and structures) are not available in the bibliography and were not supplied to us by the manufacturers. The dyes were used in one-component aqueous solutions without further purification. For the coagulation–flocculation process, aluminum sulfate (Al2(SO4)3·18H2O), a cationic salt provided by Feralco (Nienburg, NI, Germany), was used as the coagulant. Superfloc 8396, a cationic polyacrylamide flocculant from Kemira (Helsinki, FI, Finland), was employed as the flocculant. Aluminum sulfate was selected for its established coagulation efficiency, cost-effectiveness and being readily available, while Superfloc 8396 was chosen for its ability to aid water clarification processes in various industries.
During the experimental procedures, critical parameters were adjusted such as the concentrations of coagulants and flocculants in addition to the pH level of the solution. These modifications were informed by prior studies, which highlighted their significance in enhancing the decolorization process through coagulation-flocculation [53,54]. The flowchart depicted in Figure 1 provides a detailed outline of our experimental methodology.

2.2. Adsorbent Material

The choice of corncob (CC) as the biosorbent material for this study is based on its cost-effectiveness and widespread availability as an agricultural by-product in Algeria. The corncob material was collected from the outskirts of Tlemcen (Tlemcen, TLM, Western Algeria). The material, which was de-kernelled prior to use, was air-dried for 25 days, at room temperature between 30 and 35 °C. Subsequently, the samples were finely milled using a Moulinex AR110830 (SEB, Shaoxing, China), followed by sieving with an Automatic Sieve Shaker D403 (Controlab, Saint-Ouen, France) to achieve particle sizes within the range of 1.25 to 2 mm. The resulting material was thoroughly washed with distilled water to remove any residual impurities, followed by a drying phase in an oven maintained at 82 ± 5 °C for 24 h. Figure 2 illustrates a graphical abstract of CC during its preparation.
Before being used in adsorption experiments, the corncob adsorbent was characterized using various physical and chemical analytical techniques. These included Fourier Transform Infrared Spectroscopy (FTIR), Scanning Electron Microscopy (SEM), Thermogravimetric and Differential Thermal Analysis (TGA/DTA), Brunauer–Emmett–Teller (BET) surface area analysis, and the evaluation of the point of zero charge pH (pHpzc). FTIR spectroscopy was utilized to identify the functional groups and molecular complexes in the corncob material. This involved combining 2 mg of finely ground corncob with 30 mg of high-purity potassium bromide (KBr) and pelletizing the mixture under 7 bars of pressure. The analysis was then conducted using a Perkin Elmer Spectrum FTIR spectrophotometer (Perkin Elmer Ltd, Beaconsfield, UK) in the 300–4000 cm−1 wavelength range. Moreover, information on the microstructural shape and surface texture of the adsorbent was obtained through high-resolution Scanning Electron Microscopy (SEM) imaging performed using a TESCAN VEGA microscope (TESCAN, Brno, Czech Republic). A sample weighing 15.201 mg was heated from 50 to 700 °C at a rate of 10 °C/min in a nitrogen environment at a rate of 18 mm/min. This was performed to assess the thermal stability and degradation characteristics of the corncob material. The analysis using TGA/DTA was conducted with a PerkinElmer STA 8000 apparatus (PerkinElmer, MA, USA). By utilizing BET analysis through N2 adsorption at 77.3 °K and employing a Micromeritics Gemini 2380 system (Micromeritics Instument Corporation, GA, USA), the specific surface area, pore size, and porosity distribution of the corncob adsorbent were successfully determined. After equilibrating 0.15 g of corncob in 50 mL of a 0.01 M sodium chloride solution, the pH was adjusted from 2 to 12 using 0.1 M sodium hydroxide or hydrochloric acid solutions. The resulting mixtures were stirred for 48 h at a controlled temperature of 25 °C. After assessing the final pH, the point of zero charge (pHpzc) was determined by graphically representing the change in pH (ΔpH) against the initial pH (pHi). This method facilitated identification at the point at which the ΔpH value reaches zero. This characterization offers essential insights into the physicochemical properties of the corncob adsorbent, enhancing our understanding of its adsorption capabilities and characteristics.

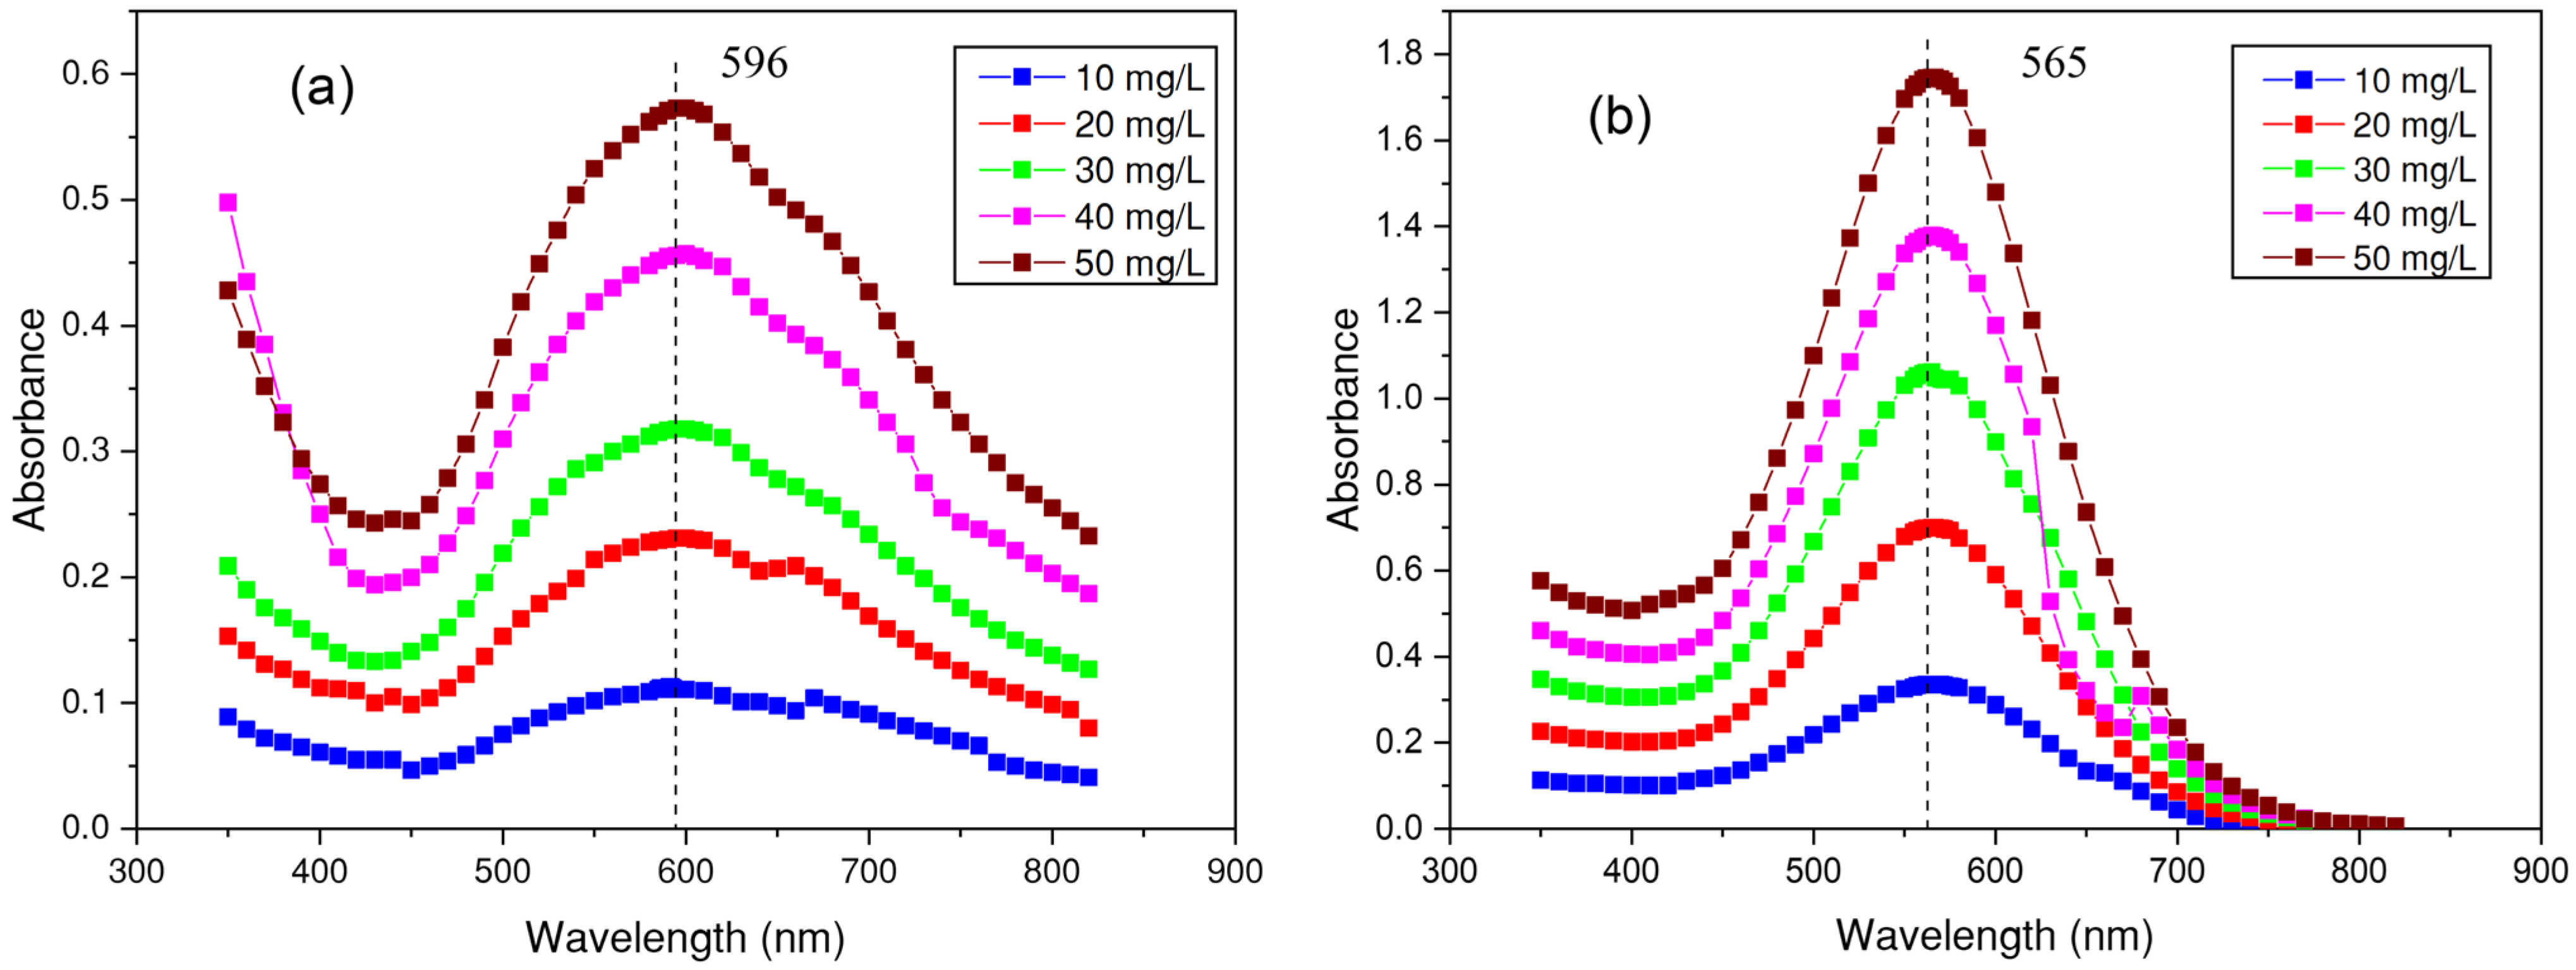
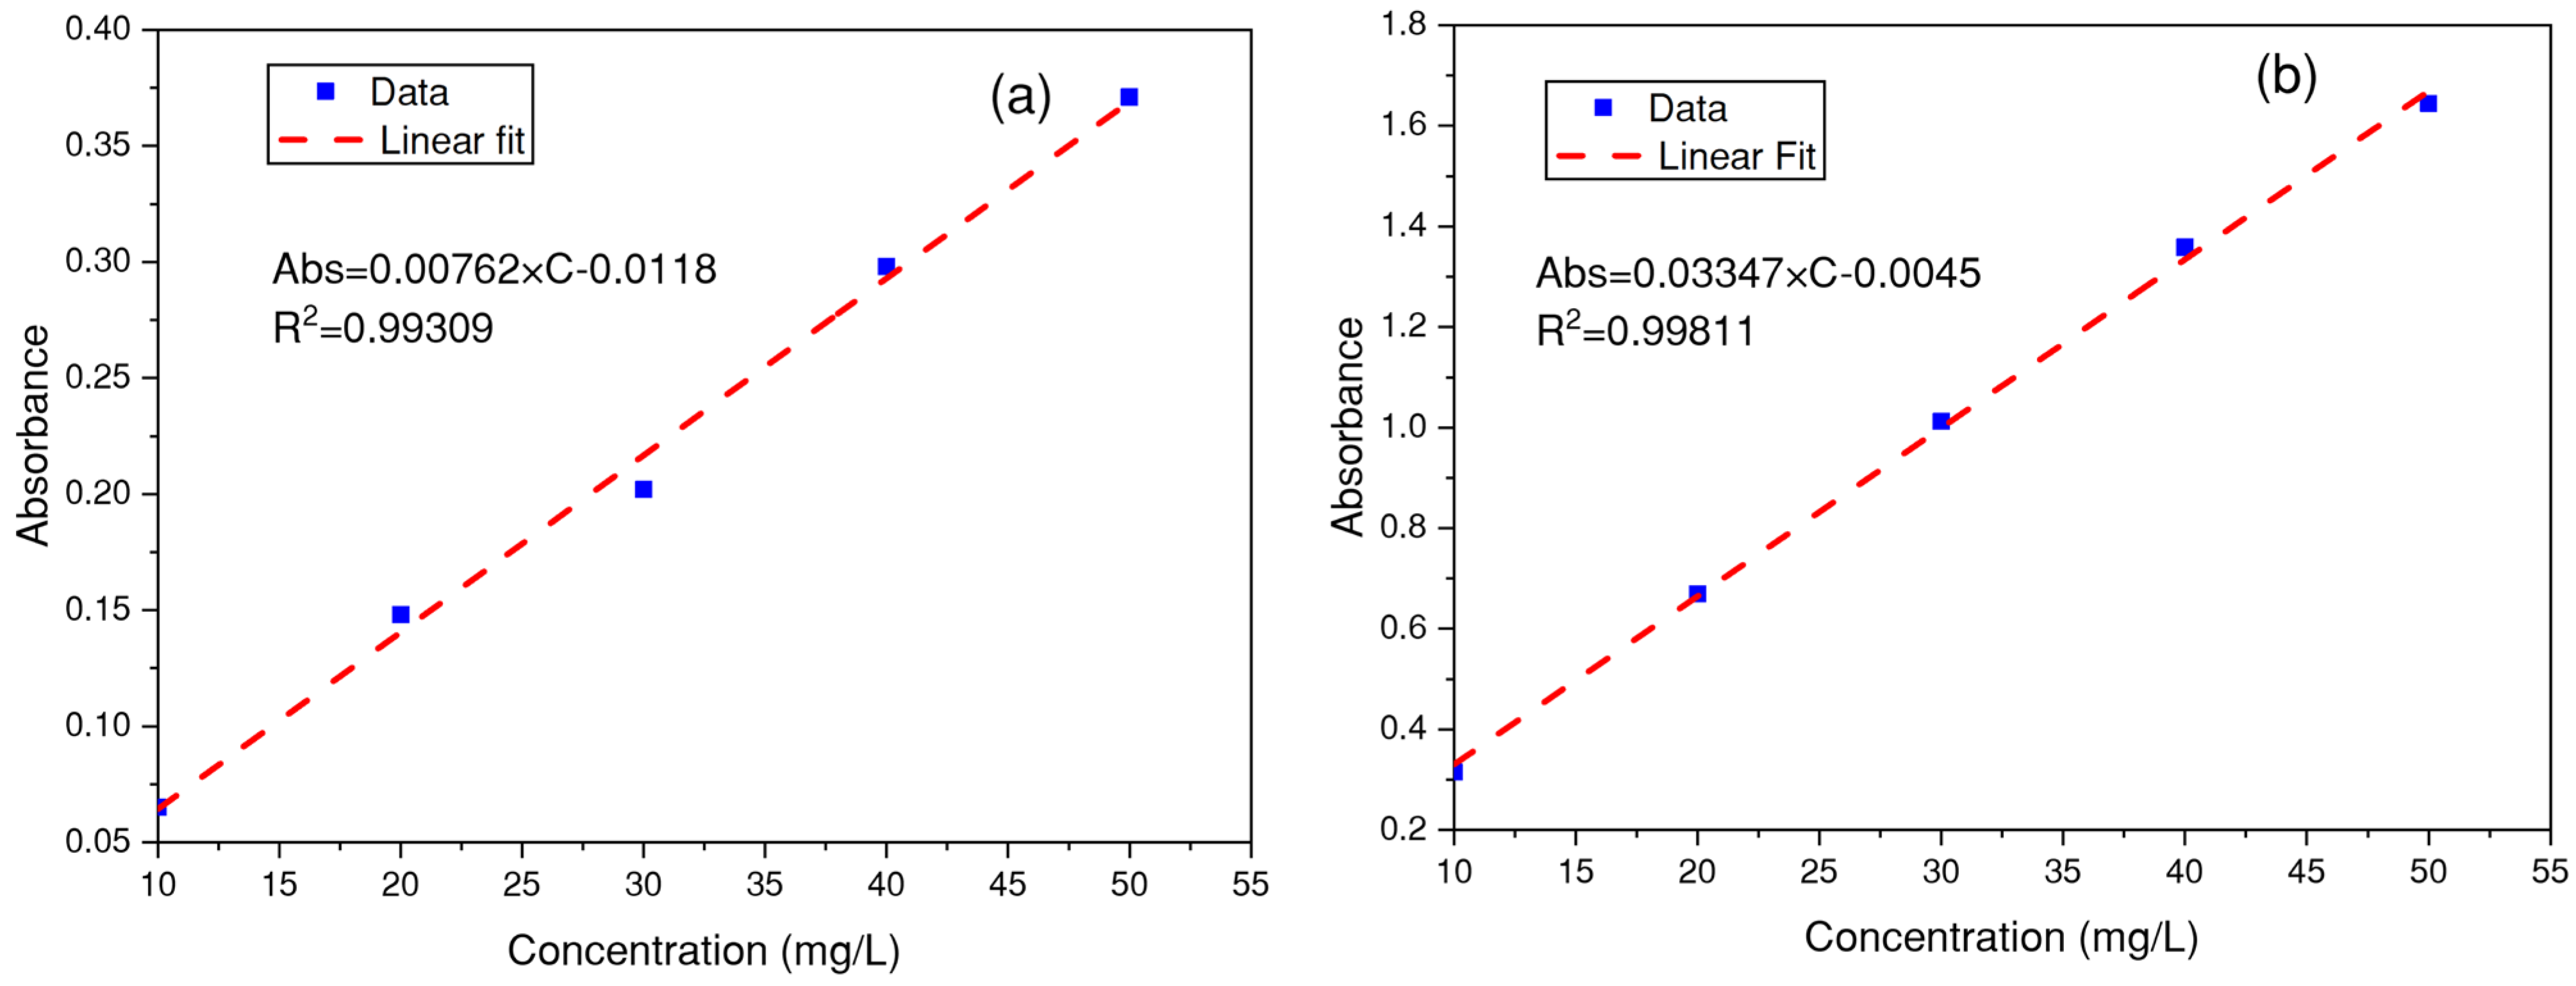
2.3. Determination of the Wavelength and Absorbance of Dyes

The spectral analysis of dye samples was conducted using a Perkin Elmer Lambda 25 UV-visible spectrophotometer (PerkinElmer, MA, USA) that covers a wavelength range from 190 to 1100 nm. After calibration, the instrument was used to determine the maximum wavelength and measure the absorbance of the solution within a carefully selected wavelength range. It is worth noting that all experiments were carried out using distilled water with a conductivity not exceeding 10 µs/cm. The dye concentration in the solution was determined by absorbance measurements based on a calibration curve. To achieve this, a series of concentrations (10 to 50 mg/L) were prepared for both dyes, all of which were derived from a base solution with a dye concentration of 1 g/L. The maximum wavelengths (λmax) for the five concentrations were determined to be 596 nm for BB-RS01 and 565 nm for BM-N5R.

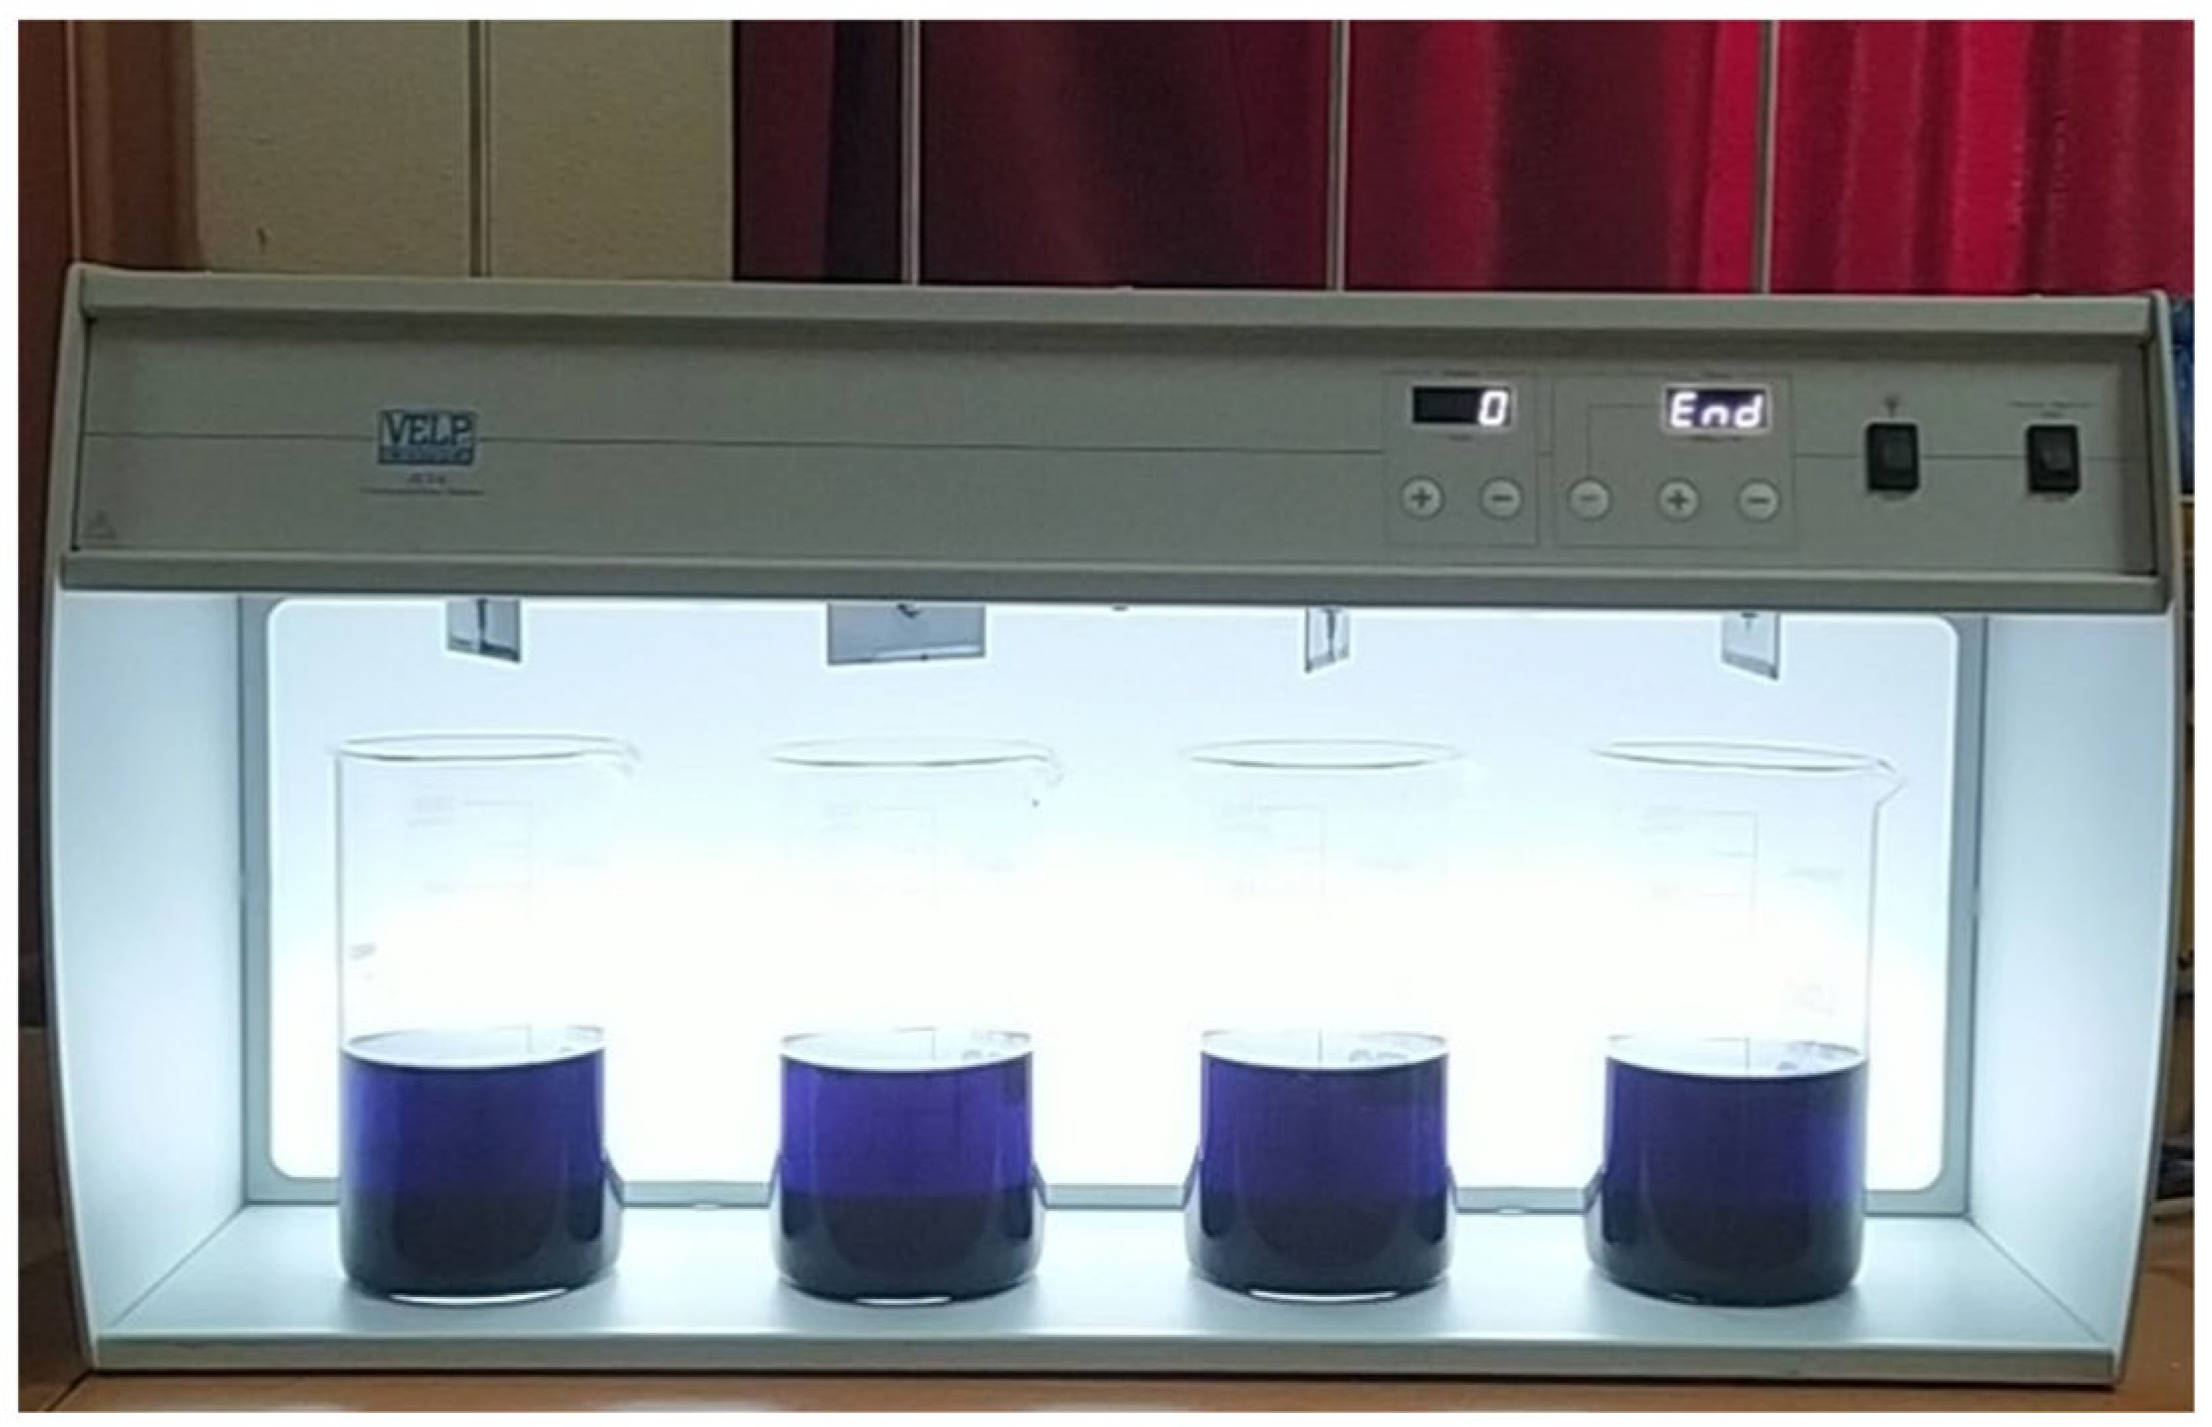
2.4. Coagulation–Flocculation–Sedimentation Process

The coagulation–flocculation sedimentation process was conducted following the Jar-Test procedure using a VELP flocculator, as shown in Figure 3. A 500 mL sample was introduced into a 1 L tall beaker following this procedure. The process involved a four-station flocculation system, with each station having different rotational speeds ranging from 0 to 300 rpm. The device measured and digitally displayed these rotation rates and timings.
During this phase, different concentrations of the coagulant (Al2(SO4)3·18H2O) were added to the prepared sample and agitated for 2 min at a high speed of 200 rpm. The mixtures underwent flocculation, during which different doses of Superfloc 8396 were added and the mixture was stirred at a slower speed (40 rpm) for 15 min. After the flocculation process and 30 min of sedimentation, the flocs were allowed to settle, and the supernatant was extracted for analysis. The different concentrations of coagulant and flocculant were tested in order to investigate their effects on dye coagulation and aggregation into larger flocs. All experiments were conducted under ambient temperature (25 ± 2 °C). The percentage of BB-RS01 and BM-N5R dye removal was calculated using Equation (1) as follows:
%   o f   d y e   r e m o v a l = C 0 C t C 0 × 100
C0 and Ct represent the initial and instantaneous concentrations of dye (mg/L), respectively.
An initial dye concentration of 500 mg/L was chosen to replicate common levels found in textile wastewater. For each experiment, precise doses of aluminum sulfate (Al2(SO4)3·18H2O) and flocculent (Superfloc 8396) were measured using an electronic balance model 620 PRS, with an accuracy of ±2 mg. A multi-parameter CONSORT device was used to measure the pH of the solutions, with an accuracy error of ± 1%. Before utilization, the instrument was calibrated using buffer solutions with pH values of 4 and 10, following the guidelines in the Standard Methods for the Examination of Water and Wastewater AWWA [55]. The pH was adjusted using sodium hydroxide (NaOH: 0.1 N) and hydrochloric acid (HCl: 0.1 N). The aluminum sulfate compound facilitated the removal of dye at the optimal dose determined. Each experiment was conducted twice, and the average results were used for further analysis and calculations.

2.5. Adsorption Processes

To accelerate dye removal and enhance the decolorization of our synthetic solution, we employed a coupled approach involving coagulation–flocculation–sedimentation and adsorption processes.
Batch experiments were conducted using pre-treated synthetic solutions for adsorption (obtained after the coagulation–flocculation–sedimentation method) and corncob as a biosorbent. During these experiments, we varied the contact time from 5 to 480 min to collect kinetic and equilibrium data. In each test, 1 L of dye solution was mixed with 1 g of corncob (with a particle size ranging from 1.25 to 2 mm) in a 1 L beaker. The adsorption process occurred in a thermostatic bath maintained at 25 ± 2 °C, with constant agitation at 400 rpm using a heated magnetic stirrer from VELP. The effects of contact time (0–480 min), initial dye concentration (15–100 mg/L), and pH (2–11) on the adsorption process were investigated. Based on the results of the adsorption experiments, equilibrium isotherms were plotted and the amount of solute adsorbed onto the adsorbent phase was quantified, as presented in Equation (2).
q e = C 0 C e × V W
where qe represents the amount of dye adsorbed measured (mg/g); C0 and Ce represent the initial and equilibrium concentrations of the dyes, respectively (mg/L). V indicates the volume of the solution (L), and W refers to the mass of the adsorbent (g).

3. Results and Discussion

3.1. Corncob Characterization

The characterization of corncob as an adsorbent offers a detailed analysis of its physicochemical properties and adsorption potential. These characteristics are essential for optimizing adsorption processes and improving the effectiveness of corncob in removing dye pollutants from aqueous solutions.

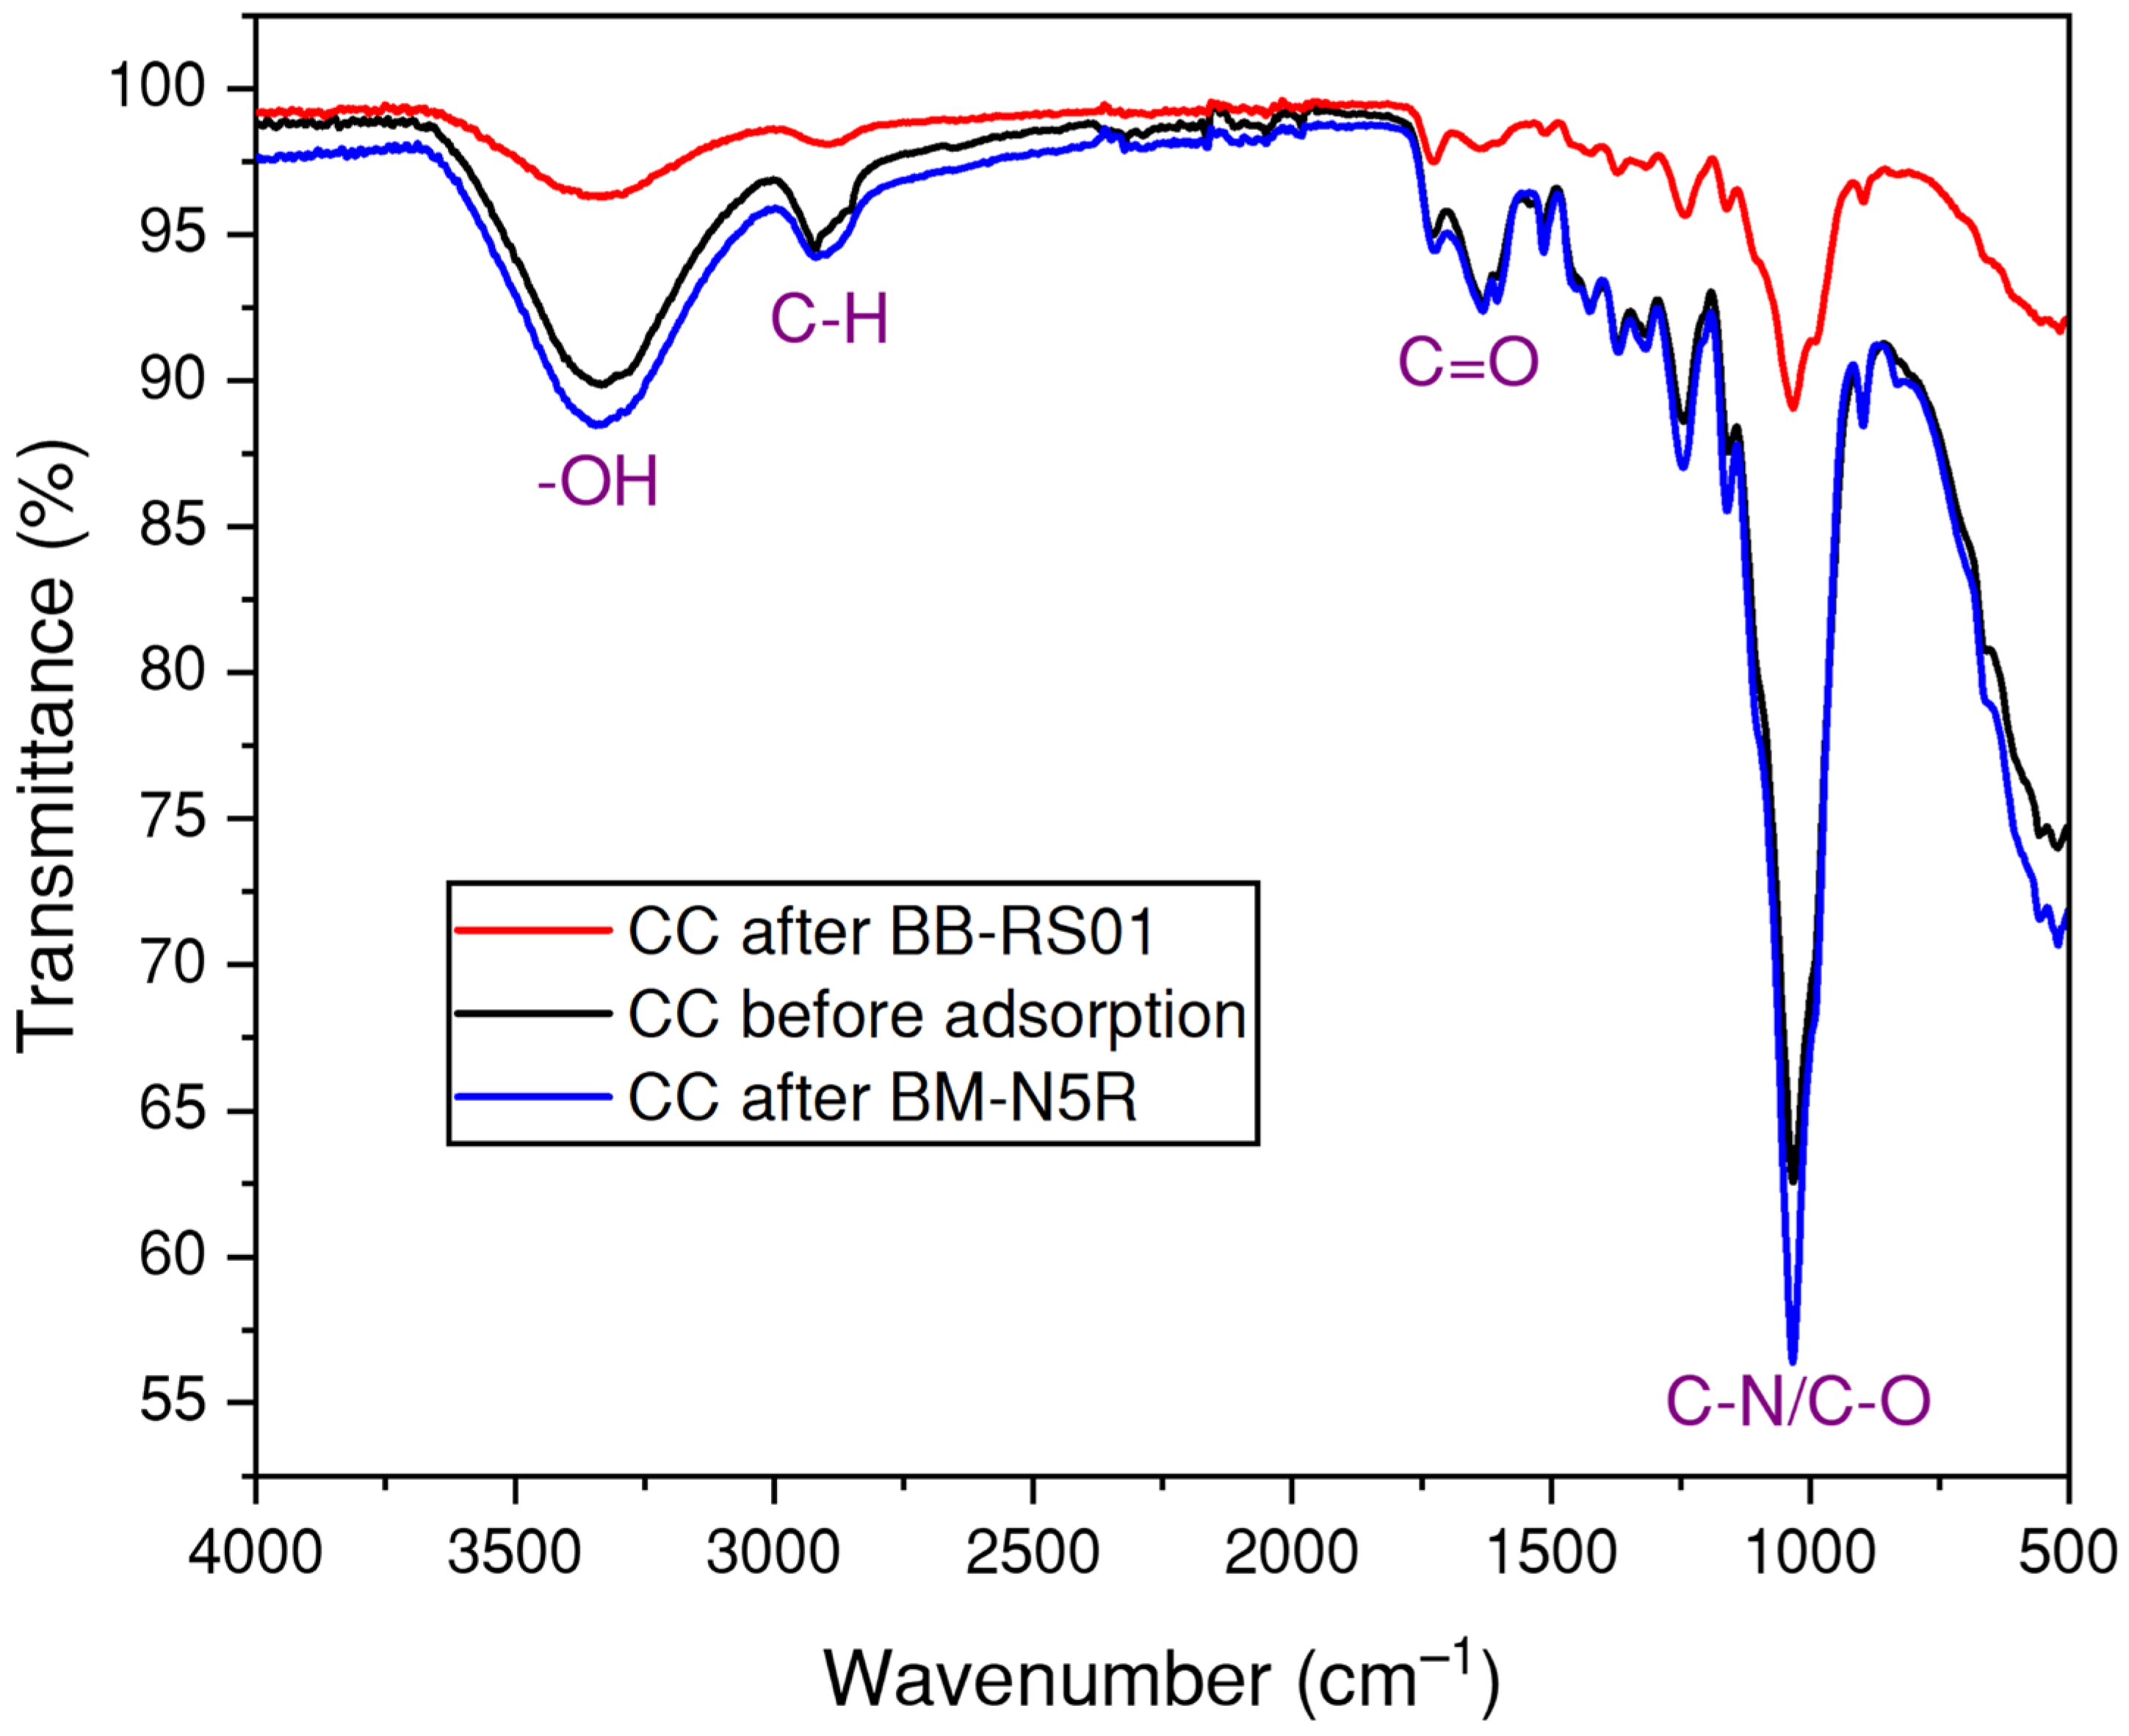
3.1.1. Infrared Spectroscopy Analysis

The results of the infrared spectroscopy analysis conducted on the dried corncob before dye adsorption within the spectral range of 4000–500 cm−1 are presented in Figure 4.
Figure 4 displays the Fourier Transform Infrared (FTIR) spectrum of corncob (CC) before adsorption, indicating various absorption peaks. The significant and pronounced band at 3336 cm−1 is attributed to the stretching vibrations of -OH and -NH groups. Furthermore, the asymmetric and symmetric C–H bands are detected at 2920 cm−1 and 2850 cm−1, respectively. A band related to the ester group in hemicellulose appears around 1633 cm−1, indicating a C=O stretching vibration. Peaks at 1246 cm−1 and 1031 cm−1 are associated with C–N stretching of amino groups and C–O vibrations of carboxylic acids, respectively. These findings align with previous research in the literature [56,57,58,59,60,61,62].

3.1.2. TGA Thermogravimetric/Differential Thermal Analysis (TGA/DTA)

Thermogravimetric analysis (TGA) under a nitrogen atmosphere was used to evaluate the thermal stability of the samples in the temperature range of 50 to 700 °C, as shown in Figure 5. All the samples exhibited multistage degradation. A slight mass loss, attributed to the elimination of adsorbed water, was observed in all samples at approximately 50 to 150 °C. Three separate steps of mass decrease were identified. The early phase, occurring between 60 and 150 °C, was marked by the evaporation of bound water, which constituted around 6% of the bulk. The subsequent phase, ranging from 180 to 450 °C, was characterized by the thermal breakdown of the organic component (cellulose), resulting in an estimated mass loss of 73%. During this phase, the primary gaseous products evolved, including carbon dioxide (CO2), carbon monoxide (CO), methane (CH4), hydrogen (H2), and water vapor (H2O). These gases indicate the breakdown of cellulose’s polysaccharide structure through dehydration, decarboxylation, and depolymerization reactions [63]. The final phase, which occurs between 475 and 675 °C, corresponds to the carbonization process of the residual material, likely due to lignin decomposition, leading to a 17% mass loss. Lignin’s complex aromatic structure decomposes over a broader temperature range, releasing gaseous products such as CO2, CO, CH4, H2, and H2O. These emissions result from the cleavage of methoxyl, methyl, and methylene groups, as well as the breakdown of aromatic rings within the lignin polymer [64,65]. Similar remarks have been reported in previous studies on the adsorption of textile dyes by biomaterials [66,67,68,69,70].

3.1.3. BET Analysis

Figure 6 shows the nitrogen adsorption–desorption isotherms of the corncob. According to the Brunauer–Emmett–Teller (BET) classification, physisorption isotherms are typically divided into six distinct types. The isotherms of the CC predominantly correspond to types II and IV, as defined by the International Union of Pure and Applied Chemistry (IUPAC). This suggests the presence of mesopores (type IV) with a portion of macropores (type II), as shown by the presence of a hysteresis loop [71]. The pore size distribution, obtained from the adsorption route of the isotherm is shown in the inset of Figure 6. The CC sample demonstrates a wide range of pore sizes, ranging from mesopores (with diameters between 17 Å and 3000 Å) to macropores (with diameters exceeding >500 Å). Furthermore, the BET analysis indicates that the sample has a specific surface area of 0.4127 m2/g and an average pore diameter of 134.34 Å confirming its mesoporous nature [72].

3.1.4. pHpzc Corncob Determination

The pH of the point of zero charge (pHpzc) for corncob reveals the nature of its surface charge, indicating whether it has a positive or negative charge. Figure 7 presents the results obtained for this parameter.
The pHpzc was determined using the batch equilibrium method. In this method, 50 mL of 0.01 M NaCl solution was adjusted to different initial pH values ranging from 2 to 12. After that, a known mass of biosorbent was added to the solution. The suspensions were agitated for 24 h at 25 ± 2 °C. The final pH was measured using a calibrated pH meter (model: CONSORT), and the ΔpH values were calculated accordingly. The pHpzc value was obtained from the plot of final pH versus initial pH (Figure 7), where the point of intersection between the curve ΔpH = 0 and the experimental curve indicates the pHpzc.
The point of zero charge (pHpzc) for the corncob-derived adsorbent (CC) was determined to be 7.4. This value closely aligns with the pHpzc of 6.5 reported by Suteu et al. [73] for corncob material. The adsorbent surface becomes negatively charged when the pH values exceed the pHpzc [74]. Conversely, the adsorption behavior is expected to be considerably influenced when pH values drop below the pHpzc, leading to a positive charge on the surface [75]. The pHzpc of an adsorbent is crucial for its application in removing contaminants from solutions. Numerous studies have investigated adsorption phenomena and quantified the pHzpc such as research on the uptake of reactive yellow 84 dye by animal bone meal [76] and the adsorption characteristics of simple aromatic compounds on activated carbon [77].

3.2. Determination of the Wavelength for Each Dye

Figure 8 illustrates absorbance curves as a function of various wavelengths for two studied dyes, BB-RS01 (a) and BM-N5R (b), across five different concentrations ranging from 10 to 50 mg/L.
The maximum wavelengths for the five concentrations were determined to be 596 nm for BB-RS01 and 565 nm for BM-N5R, as shown in Figure 8.
These five solutions were used for daily spectrophotometric calibration. Figure 9 displays the calibration curve for the five concentrations, plotting dye absorbance at the previously determined maximum wavelength for each dye.
Calibration curves were utilized to determine dye concentrations based on the spectrophotometric absorbance in our experiments.

3.3. Coagulation–Flocculation Sedimentation Study

In this study, aqueous dye solutions of BB-RS01 and BM-N5R were prepared at concentrations of 500 mg/L. To assess the influence of coagulant dosage on treatment efficiency, the flocculent concentration was fixed at 50 mg/L across all experimental conditions. This standardization was implemented to maintain consistency and ensure the reliability of the coagulation–flocculation process outcomes. These experiments were conducted at a natural pH of 6 to 8. During the studies, the temperature was consistently maintained at approximately 25 ± 2 °C. Due to the high concentrations of the color solutions, a dilution factor of F = 5 was employed to prepare our experimental samples.

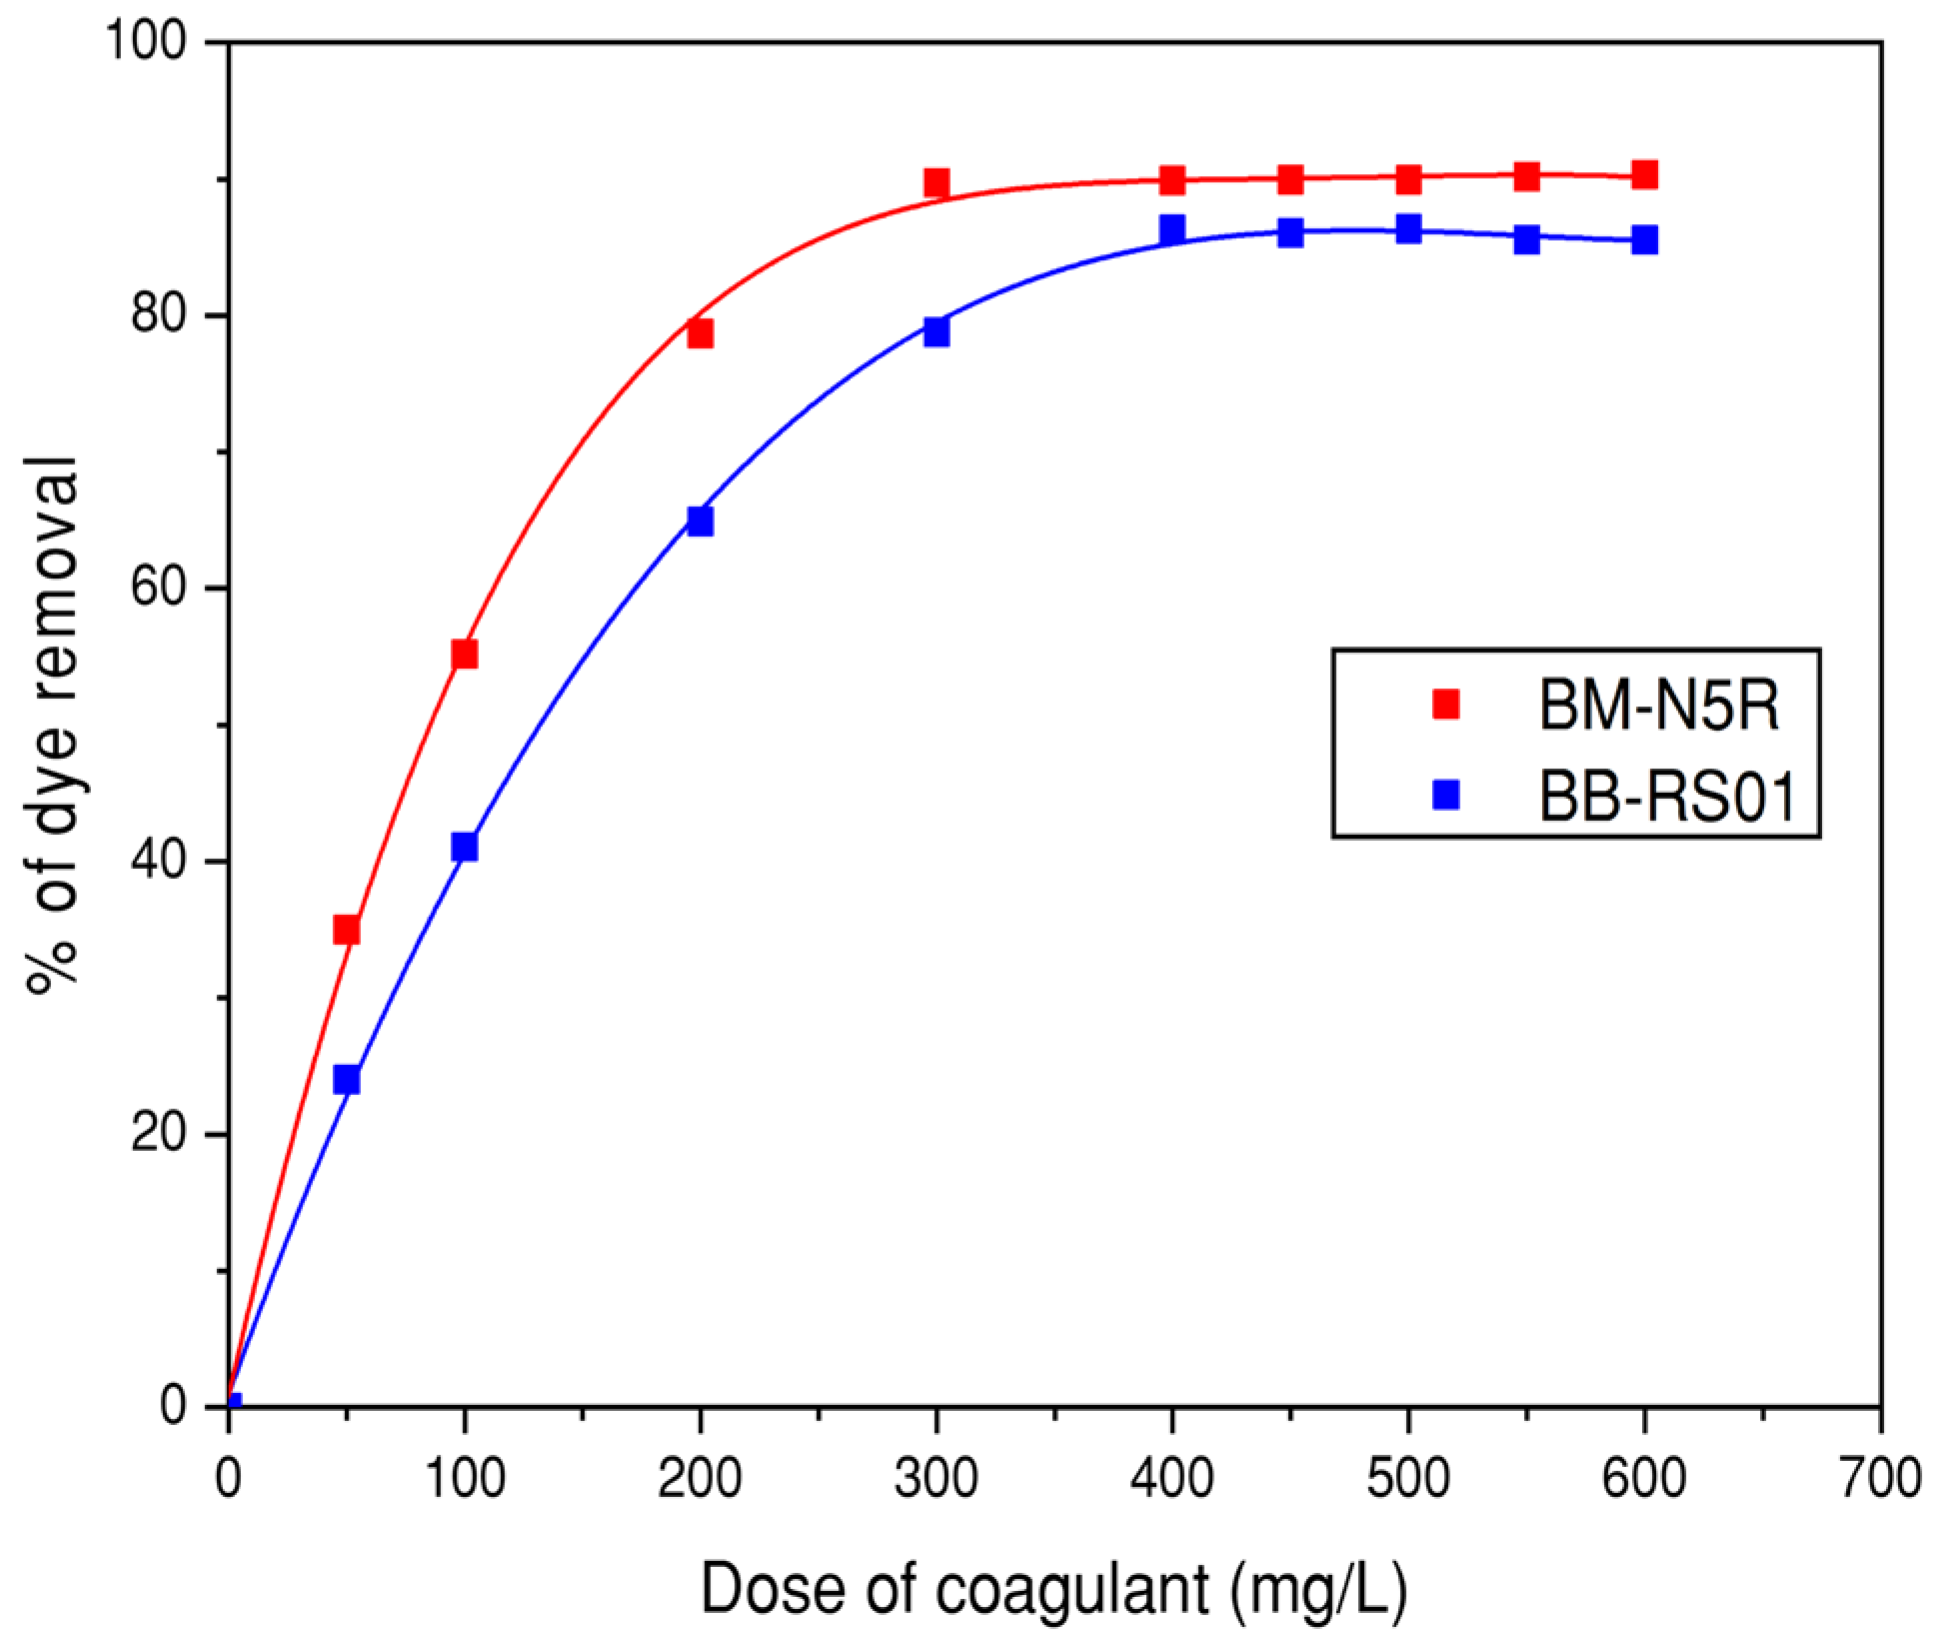
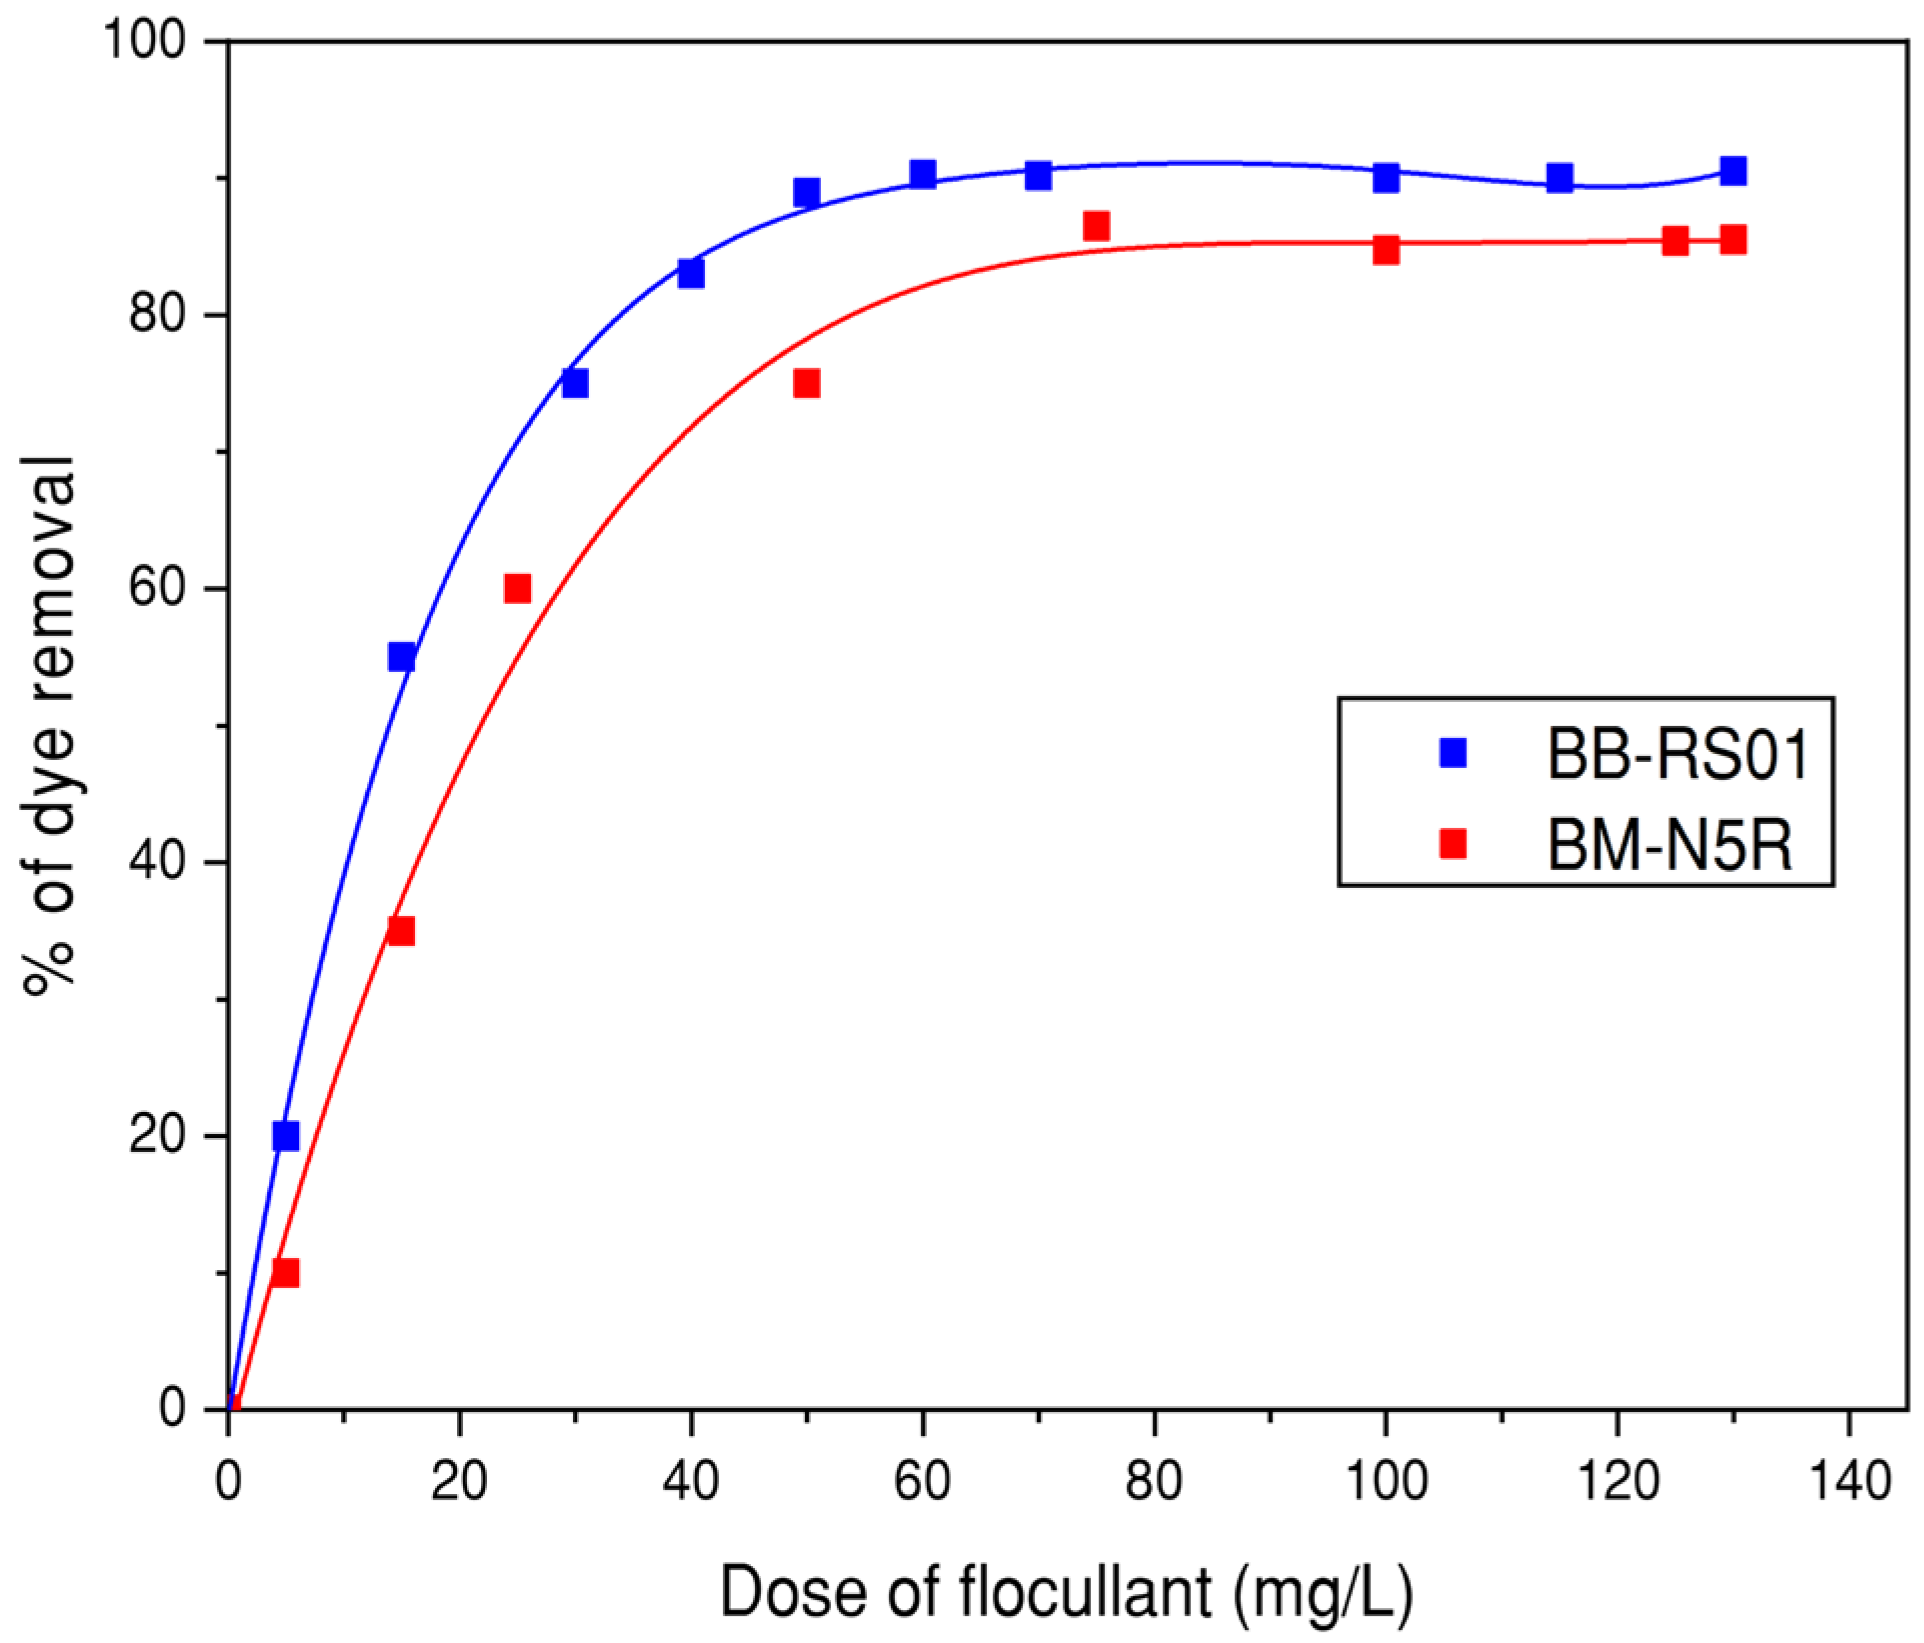
3.3.1. Effect of Coagulant and Flocculent Doses

The effectiveness of the coagulation–flocculation process relies on precise measurements of coagulant and flocculant dosages, considering the initial concentrations of contaminants present. Aluminum sulfate (Al2(SO4)3·18H2O) shows optimal efficacy within the concentration range of 50 to 600 mg/L, facilitating =effective particle destabilization while avoiding excessive or insufficient chemical application. Similarly, the selected flocculant (Superfloc 8396) performs best within the concentration range of 30 to 125 mg/L when applied. These specified ranges encourage the formation of large flocs and enhance settling efficiency, thus supporting efficient water purification across varying initial contaminant concentrations. Figure 10 illustrates the results obtained from different coagulant dosages and their corresponding effects on dye removal rates in the solution.
According to our obtained results (Figure 10), the optimal coagulant dose for BM-N5R was found to be 300 mg/L, resulting in a dye concentration of 48.42 mg/L. For BB-RS01, the optimal dose was 400 mg/L, corresponding to a residual dye concentration of 70 mg/L. The percentage of dye removed increased proportionally with a higher coagulant dose, reaching a peak at the optimal coagulant dose. Conversely, exceeding this optimal coagulant amount resulted in decreased dye removal efficiency. Chemical injection and the quick dispersion of the coagulant induce the agglomeration of dye particles and facilitate their decantation [78].
Figure 11 illustrates the effect of different flocculant dosages (ranging from 30 to 125 mg/L) on dye elimination. It is important to note that the coagulant dosages were maintained as constant at the previously determined optimal values of 300 mg/L for BM-N5R and 400 mg/L for BB-RS01, as demonstrated in Figure 10, throughout the duration of this trial.
Our observation revealed that as the flocculent dose increases, the percentage of dye removal also increases proportionally. The optimal dosages of the flocculent (Superfloc 8396) were determined to be 50 mg/L for BB-RS01 and 75 mg/L for BM-N5R. Specifically, remarkable removal rates of 90.6% for BB-RS01 and 88% for BM-N5R were achieved.

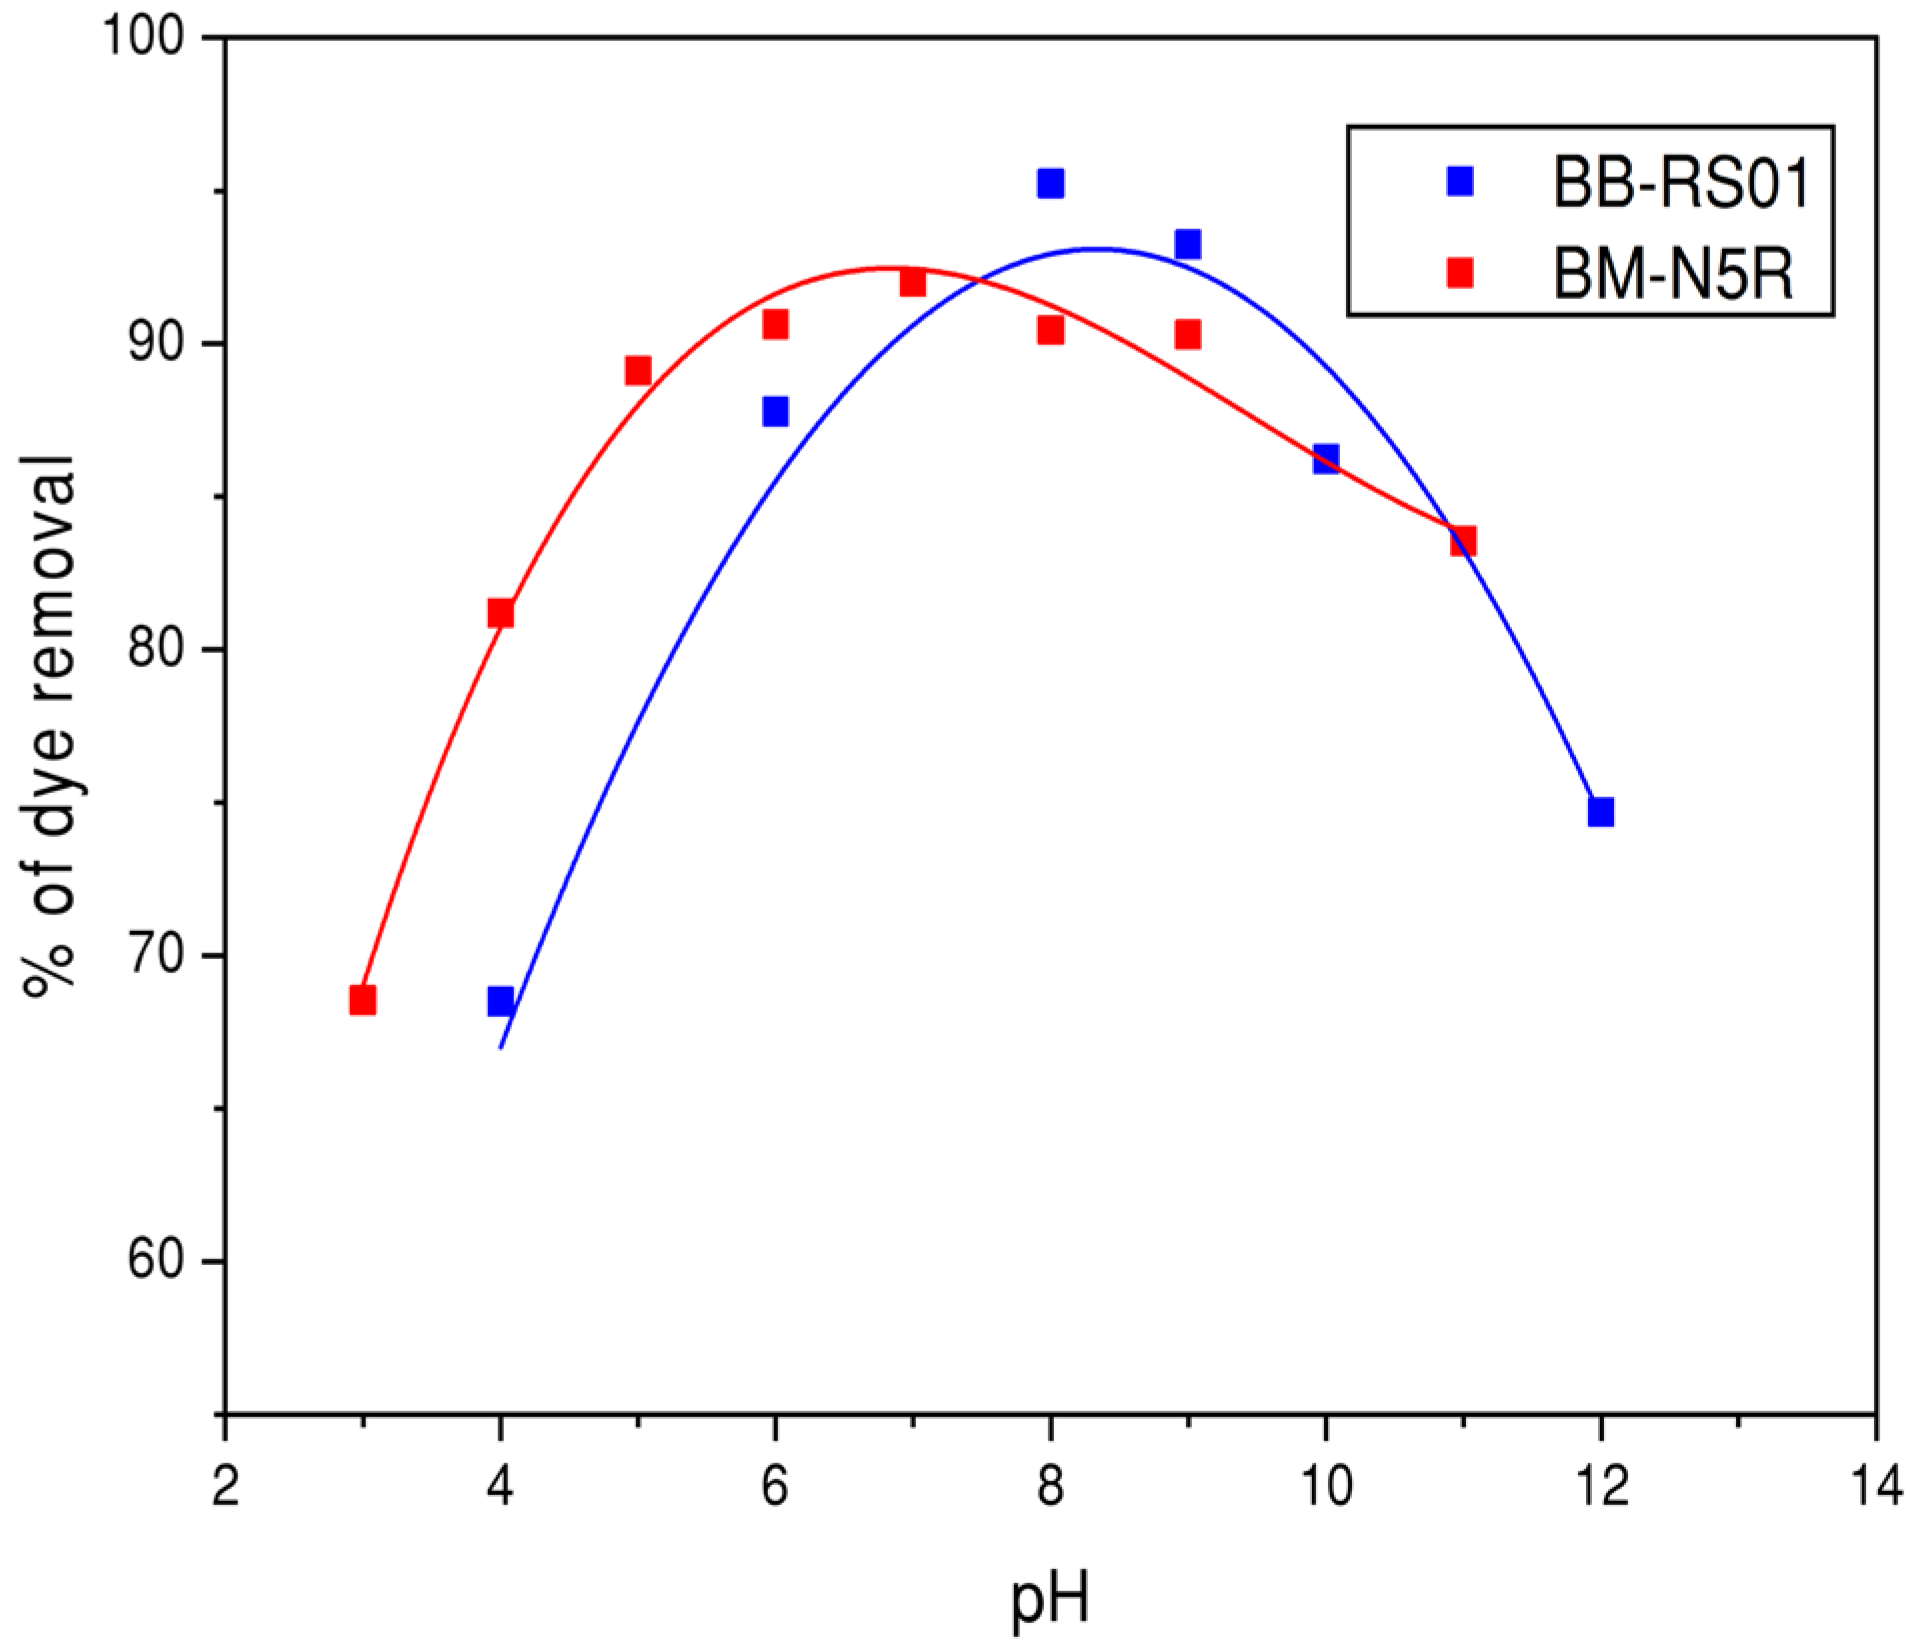
3.3.2. Effect of Solution pH on CFS Efficiency

During the coagulation process, the pH of the solution plays a crucial role [79]. In this study, the effect of solution pH (ranging from 2 to 11) on dye removal was investigated using optimal doses of coagulant and flocculant. The optimal concentrations of coagulant and flocculent determined from previous experiments remained constant during the pH variations. The results are presented in Figure 12.
Our results indicate a significant increase in dye removal efficiency within the pH range of 2 to 12. The removal efficiency of BB-RS01 peaked at pH 8, achieving a 95.1% of dye elimination with a final dye concentration of 25 mg/L. In contrast, BM-N5R showed maximum removal efficiency starting at pH 6 and reaching its peak at pH 6.5 with a removal rate of 92.3% and a final dye concentration of 50 mg/L. These results align with the literature [80], which details that the optimal pH for coagulation–flocculation with aluminum salts is between 5.5 and 7.8.

3.4. Adsorption Kinetics

In the coupling study, the adsorption process followed coagulation, flocculation, and sedimentation. Our kinetic dye adsorption experiments were performed under the following conditions with results previously obtained for the CFS process:
  • The initial pH of the solutions for BM-N5R dye was set at around 6.5 and the initial dye concentration (C0) was 50 mg/L;
  • For the BB-RS01 dye, the initial pH (pHi) of solutions was adjusted to near 8, and the initial dye concentration (C0) was 25 mg/L;
  • In both cases, the m/V ratio was maintained at 1 g/L (CC had a mass of 1 g and the volume of the solution was 1 L). CC with a uniform particle diameter (dp) of 1.25/2 mm was used to ensure consistency. The solution was kept at a constant temperature of 25 ± 2 °C and the agitation speed (N) was held at 400 rpm to facilitate contact between the adsorbate and the adsorbent.

3.4.1. Influence of Initial Dye Concentration and Contact Time

The influence of initial dye concentrations and contact time on dye adsorption kinetics by CC was explored using different initial dye concentrations: 15, 50, 75, and 100 mg/L. Figure 13 shows the sorption kinetics results for the various initial dye concentrations (C0) investigated.
Figure 13 shows a clear trend in the kinetic curves, characterized by a rapid increase in the quantity of dye adsorbed during the initial minutes of contact, followed by an equilibrium phase. Equilibrium was reached in 30 min for BB-RS01 and 60 min for BM-N5R. At this stage, the removal percentage of BB-RS01 by corncob ranged from 18.1% at an initial dye concentration (C0) of 15 mg/L to 30.5% at C0 = 100 mg/L. In contrast, for BM-N5R, the percentage of corncob adsorbed increased from 6.29% at C0 = 25 mg/L to 12.09% at C0 = 100 mg/L. These phenomena can be explained by the number of vacant spaces on the Corncob surface, which facilitate chemical interactions with dye molecules [81]. This phenomenon is also attributed to the higher driving force for mass transfer at elevated concentrations enhancing the interaction between the dye molecules and the active sites of the adsorbent. The decrease in the rate of removal can be attributed to several factors, such as the decreasing availability of vacant sites and the development of repulsive interactions between dye molecules on the solid surface and those in the aqueous phase [82]. Additionally, Sharma et al. [83] report that the increase in dye removal observed in these experiments may be due to the dispersion of multiple molecules to the surface locations of the adsorbent.

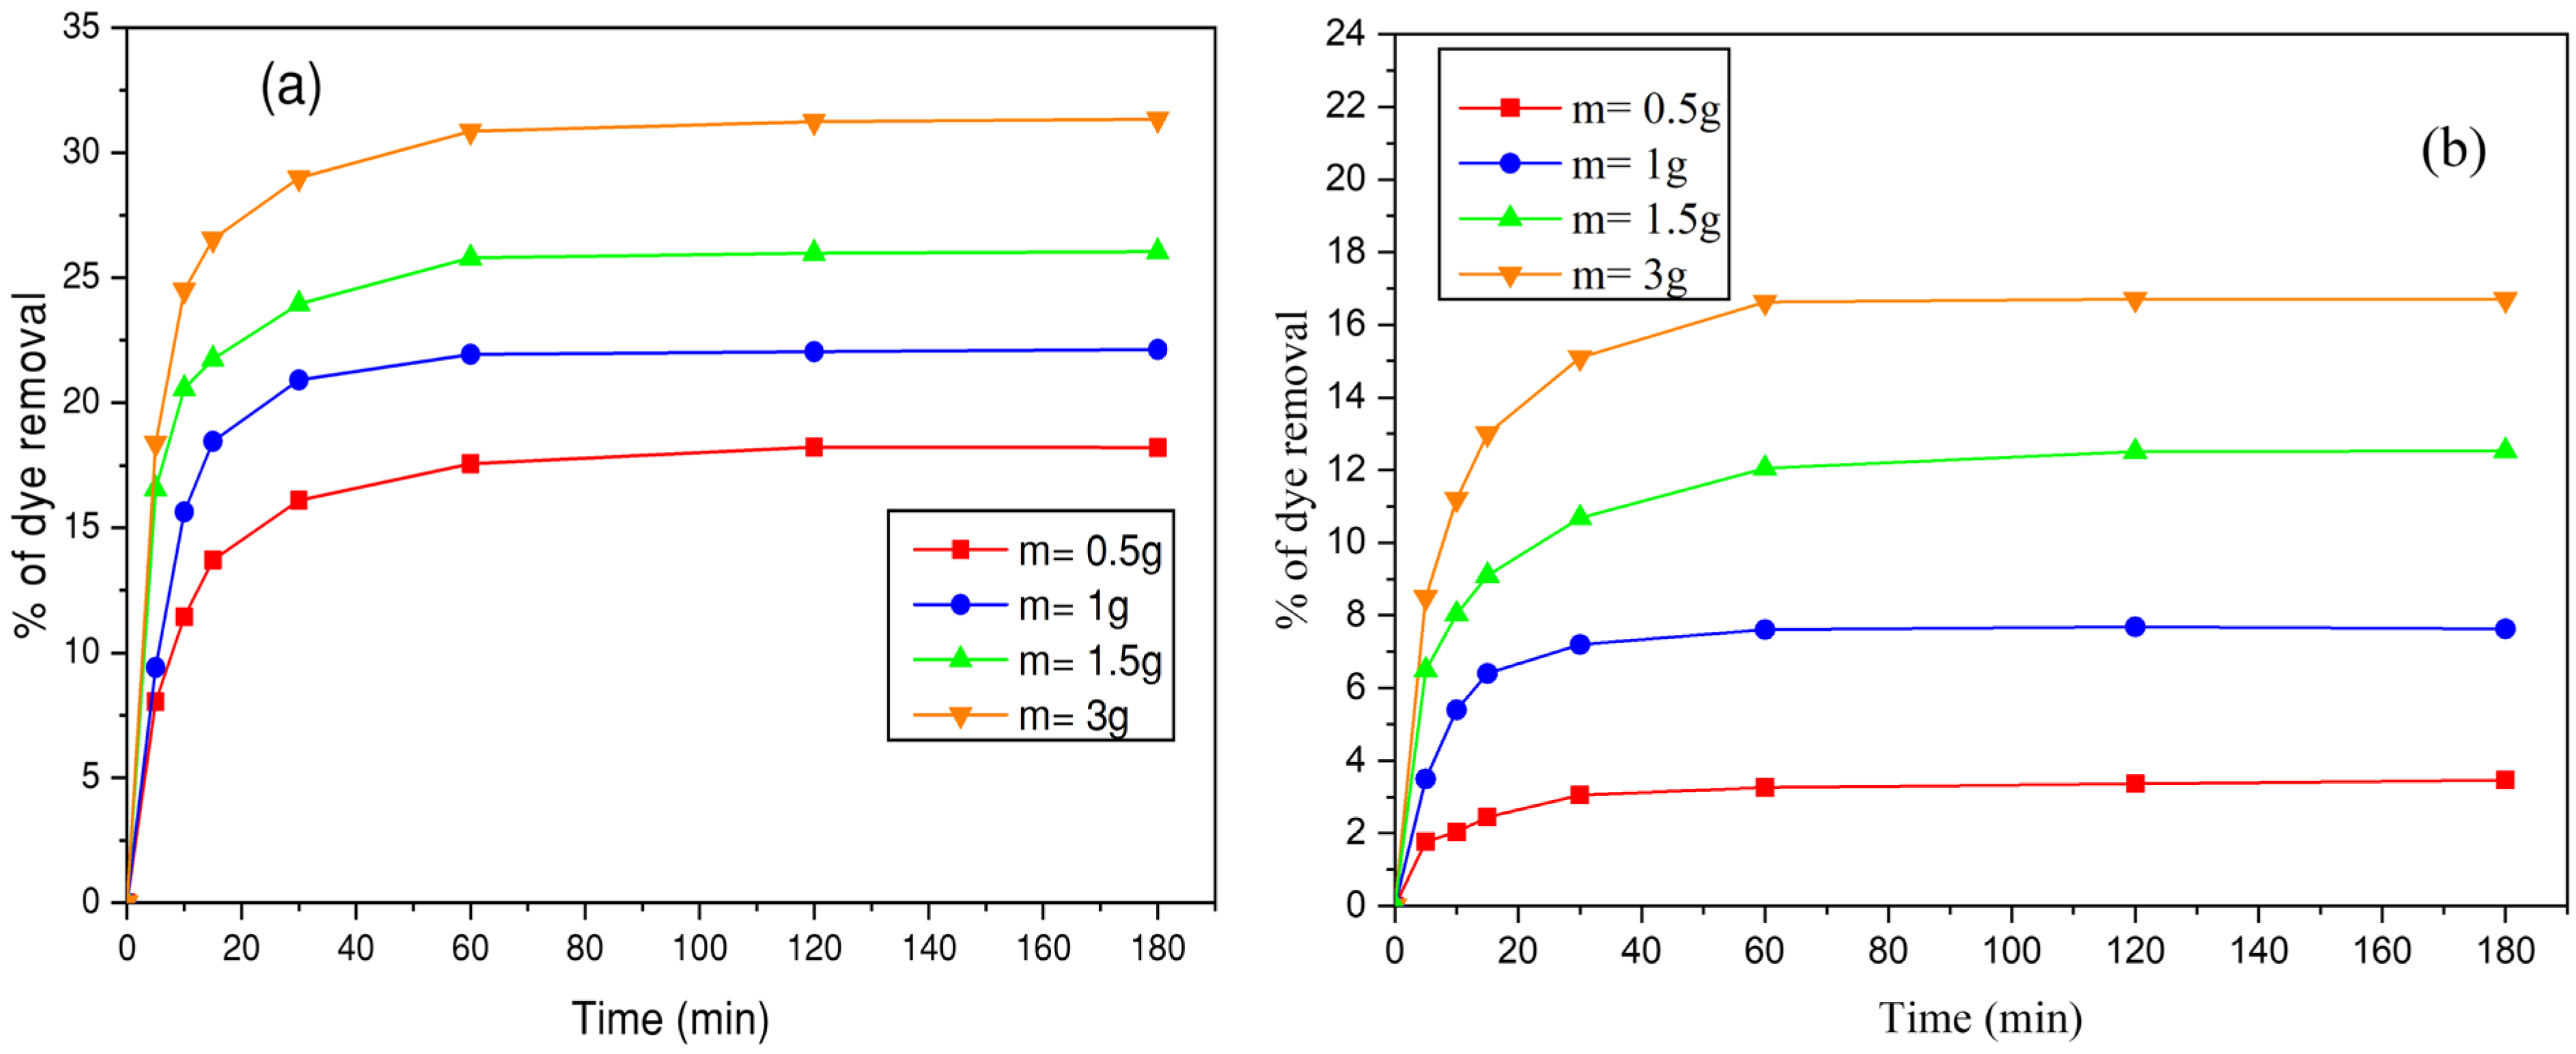
3.4.2. Effect of Biosorbent Mass

To evaluate the effect of adsorbent mass on the kinetics of dye adsorption, different masses (0.5, 1, 1.5, and 3 g) of the biosorbent (CC) were used. The objective was to optimize the quantity of adsorbent required to achieve maximum dye adsorption. The results are shown in Figure 14. The histogram shown in Figure 15 illustrates the effect of increasing biosorbent mass on the removal efficiency of BB-RS01 and BM-N5R dyes.
Figure 14 illustrates that as the mass of the corncob increased, the equilibrium adsorption of both BB-RS01 and BM-N5R also increased. Both dyes typically reach equilibrium in approximately 60 min. An increase in sorbent mass leads to a corresponding rise in the percentage of dye sorbed at equilibrium, ranging from 18.23% to 30.86% for BB-RS01 and from 3.25% to 16.71% for BM-N5R over a mass range of 0.5 to 3.0 g. The observed increase in dye removal efficiency can be attributed to the mass increment of CC. This mass increment correlates with the augmentation of available sorptive sites, leading to an increased assimilation of dye from solutions. Figure 15 demonstrates a progressive improvement in dye removal with a higher biosorbent dosage. The study’s findings demonstrated a consistent trend that is in line with the conclusions of previous biosorption tests [84,85].

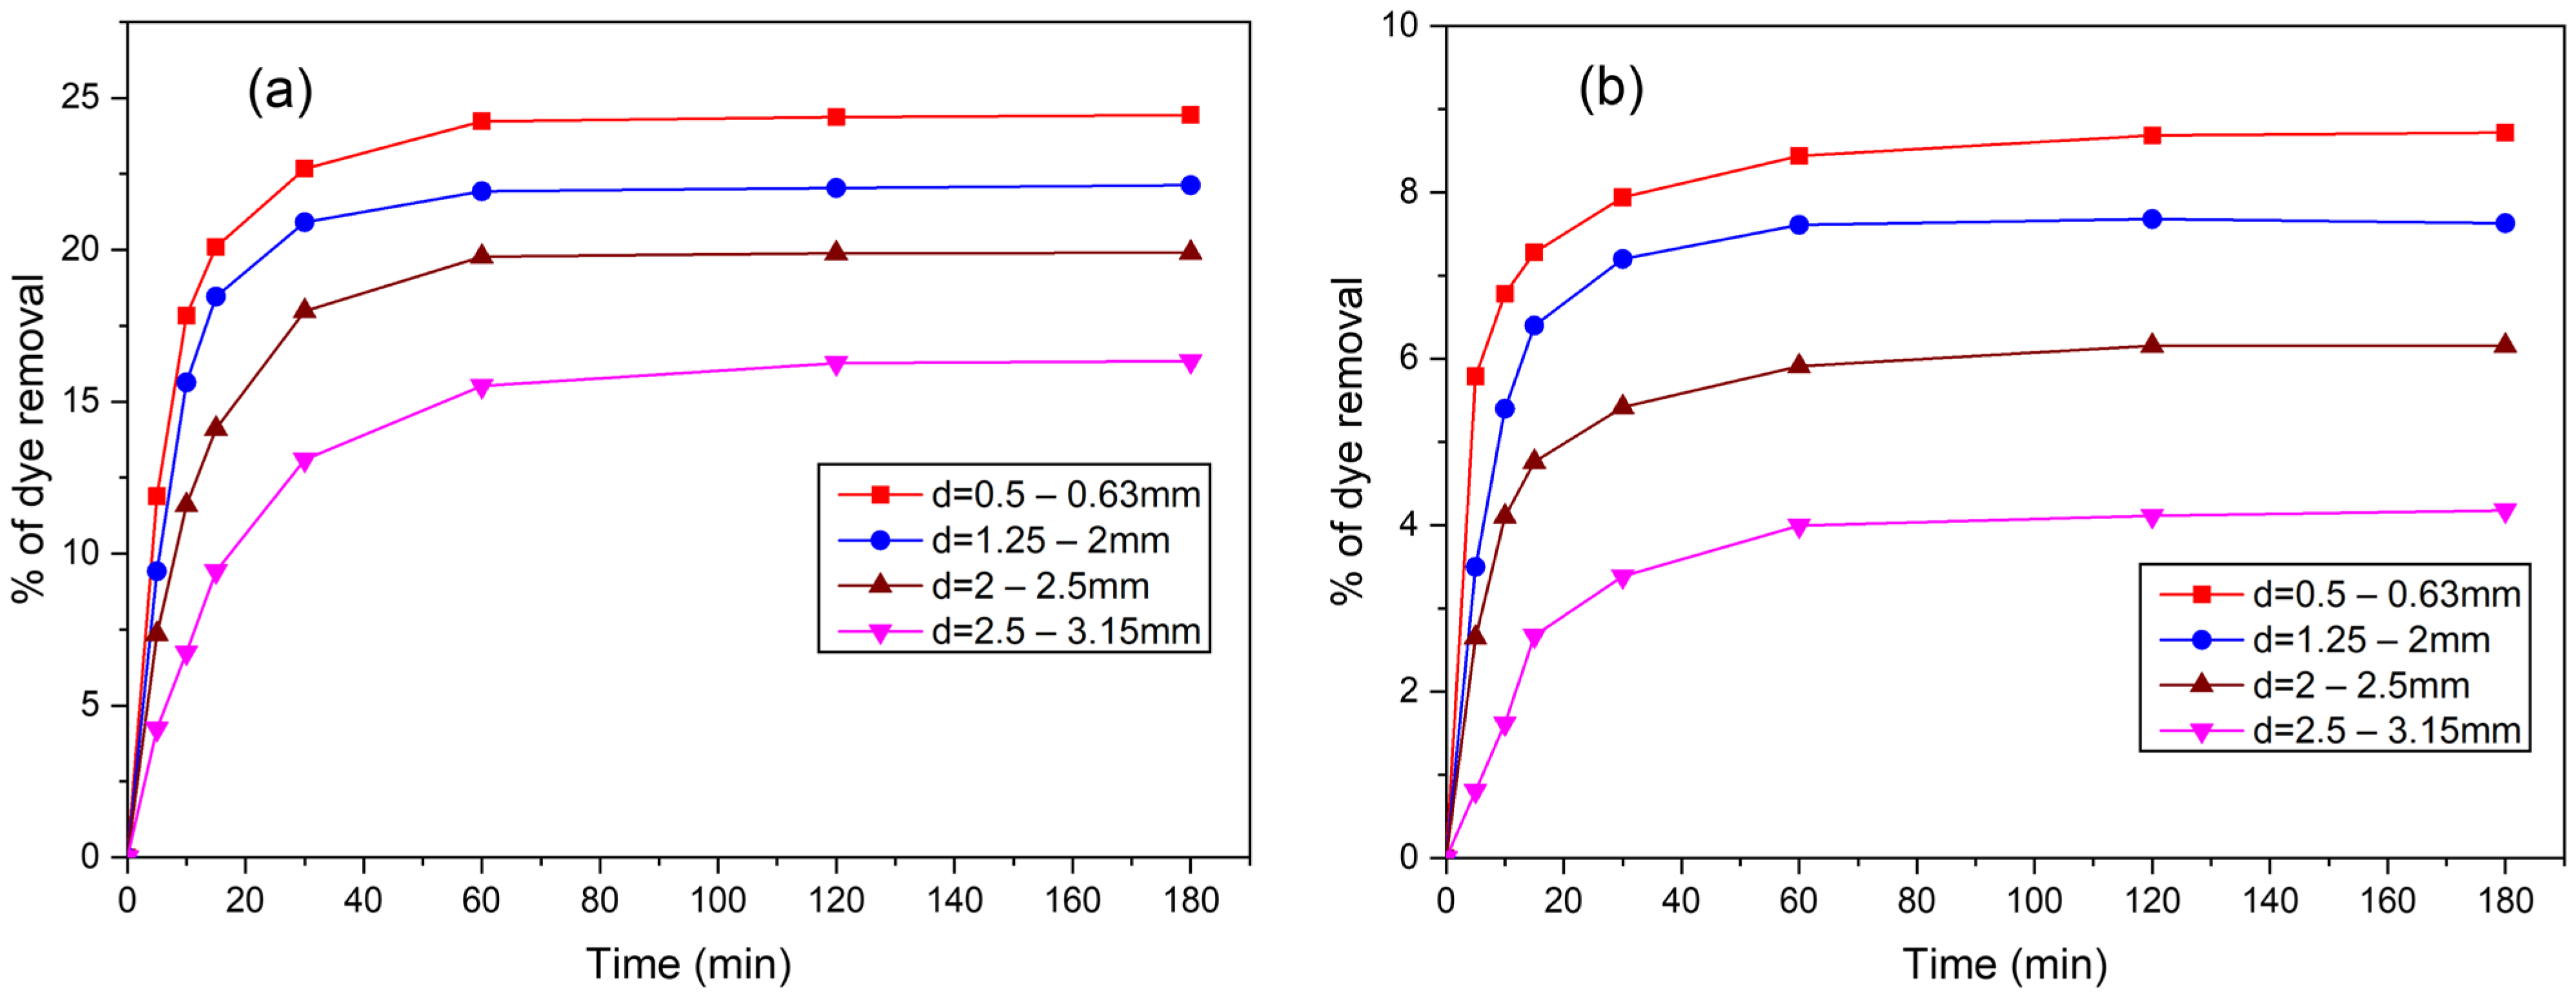
3.4.3. Influence of Adsorbent Particle Size
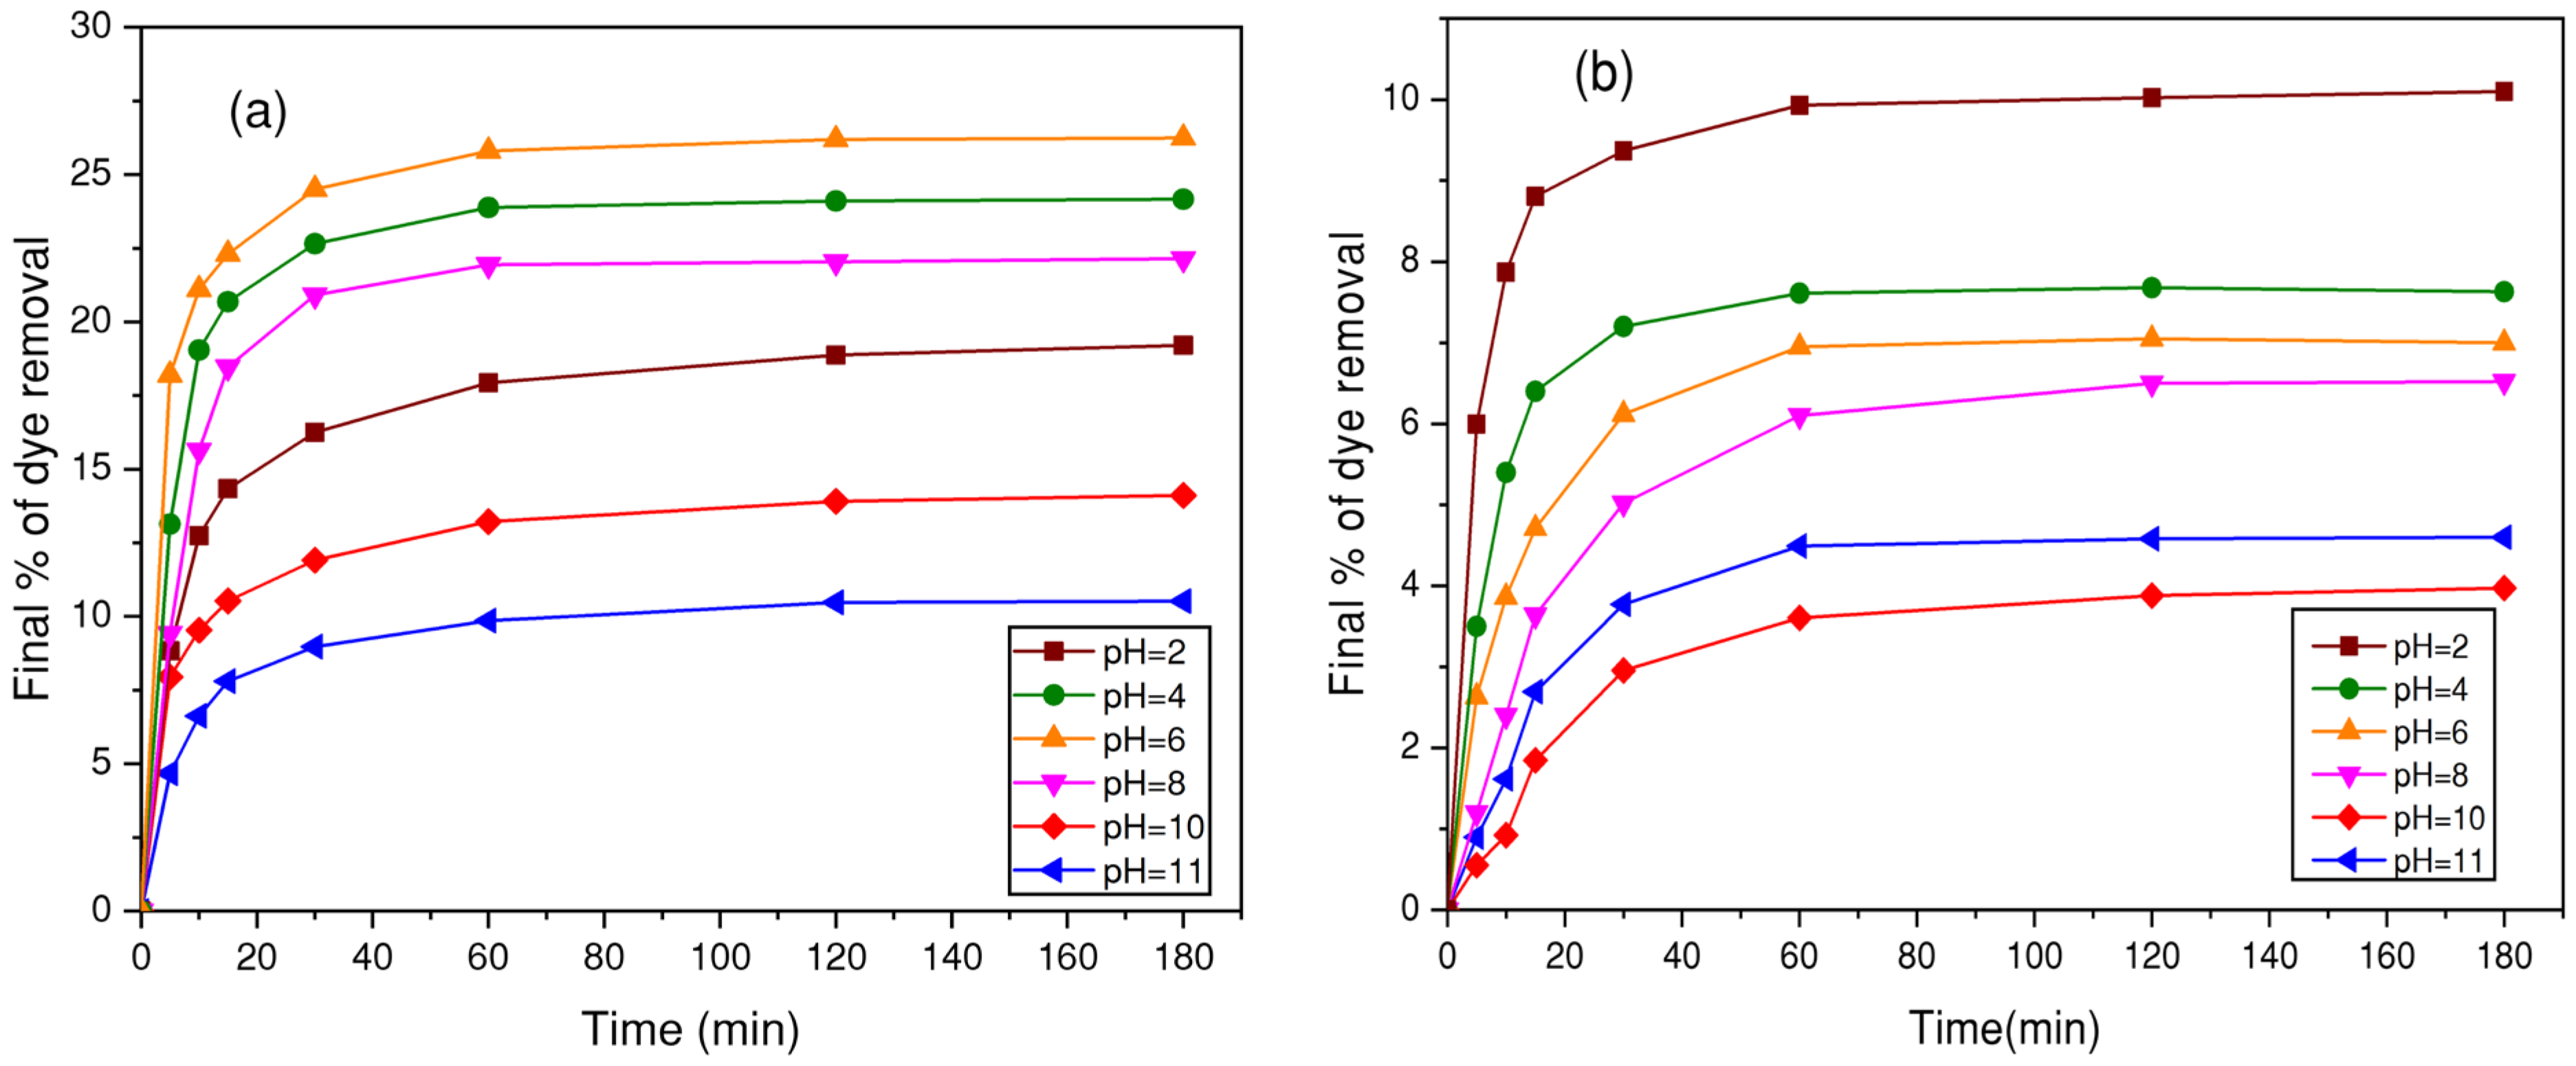
The particle size of the material can affect the adsorption kinetics of BB-RS01 and BM-N5R. The impact of different particle sizes (0.5/0.63 mm, 1.25/2 mm, 2/2.5 mm, and 2.5/3.15 mm) on the adsorption of the two dyes by the waste material was investigated. The results are presented in Figure 16.
Figure 16 demonstrates that reducing the particle size of CC results in an increased percentage of dye removal at equilibrium. This is attributed to the fact that a smaller particle size offers a greater specific surface area for adsorption. The time required to reach equilibrium remained constant at 60 min for both the BB-RS01 and BM-N5R dyes. However, as the particle size of the corncob increases from 0.5/0.63 mm to 2.5/3.15 mm, the equilibrium dye sorption percentage increases from 16.27% to 24.23% for BB-RS01 and from 4.11% to 8.68% for BM-N5R. Ho et al. [86] made similar remarks regarding the sorption of an acid dye (Acid Blue 9) by activated clay. They reported that the amount of dye adsorbed by the clay at equilibrium increases from 110 to 157 mg/g when the particle size of the clay decreases from 75/106 to 0/38 µm.

3.4.4. Effect of pH

The pH level significantly influences adsorption capacity by changing the surface charge of the adsorbent, the electrical charge of the dye, and the extent of ionization [87]. The adsorption of dye by CC was studied at various pH levels of the solution and Figure 16 presents the results of this investigation regarding the kinetics of adsorption at 25 ± 2 °C. The research was conducted to determine the optimal pH for dye fixation. Figure 17 shows that the efficiency of dye removal varies throughout the pH range of 2 to 11.
The recorded dye removal efficiency for BB-RS01 at pH 6 was 26.19%. The results demonstrate that the non-ionic properties of BB-RS01 play a crucial role in its removal process. Zhang et al. [88] made a similar observation in their study on dye adsorption using a synthetic carboxymethyl cellulose-acrylic acid adsorbent. The standard medium fails to promote the absorption of BB-RS01. In contrast, the efficacy of BM-N5R demonstrated variability, measuring 9.93% at pH 2, 7.59% at pH 4, and 3.97% at pH 11. This variation can be elucidated by examining the pHpzc value of CC (pHpzc = 7.4). When the solution pH is below the pHpzc, the adsorption of anionic dyes is enhanced due to the negatively charged surface. The properties of CC affect its engagement with dye molecules in neutral or basic pH conditions for both dyes.
The point of zero charge (pHpzc) offers valuable insights into the active sites of biomass and its adsorption potential.

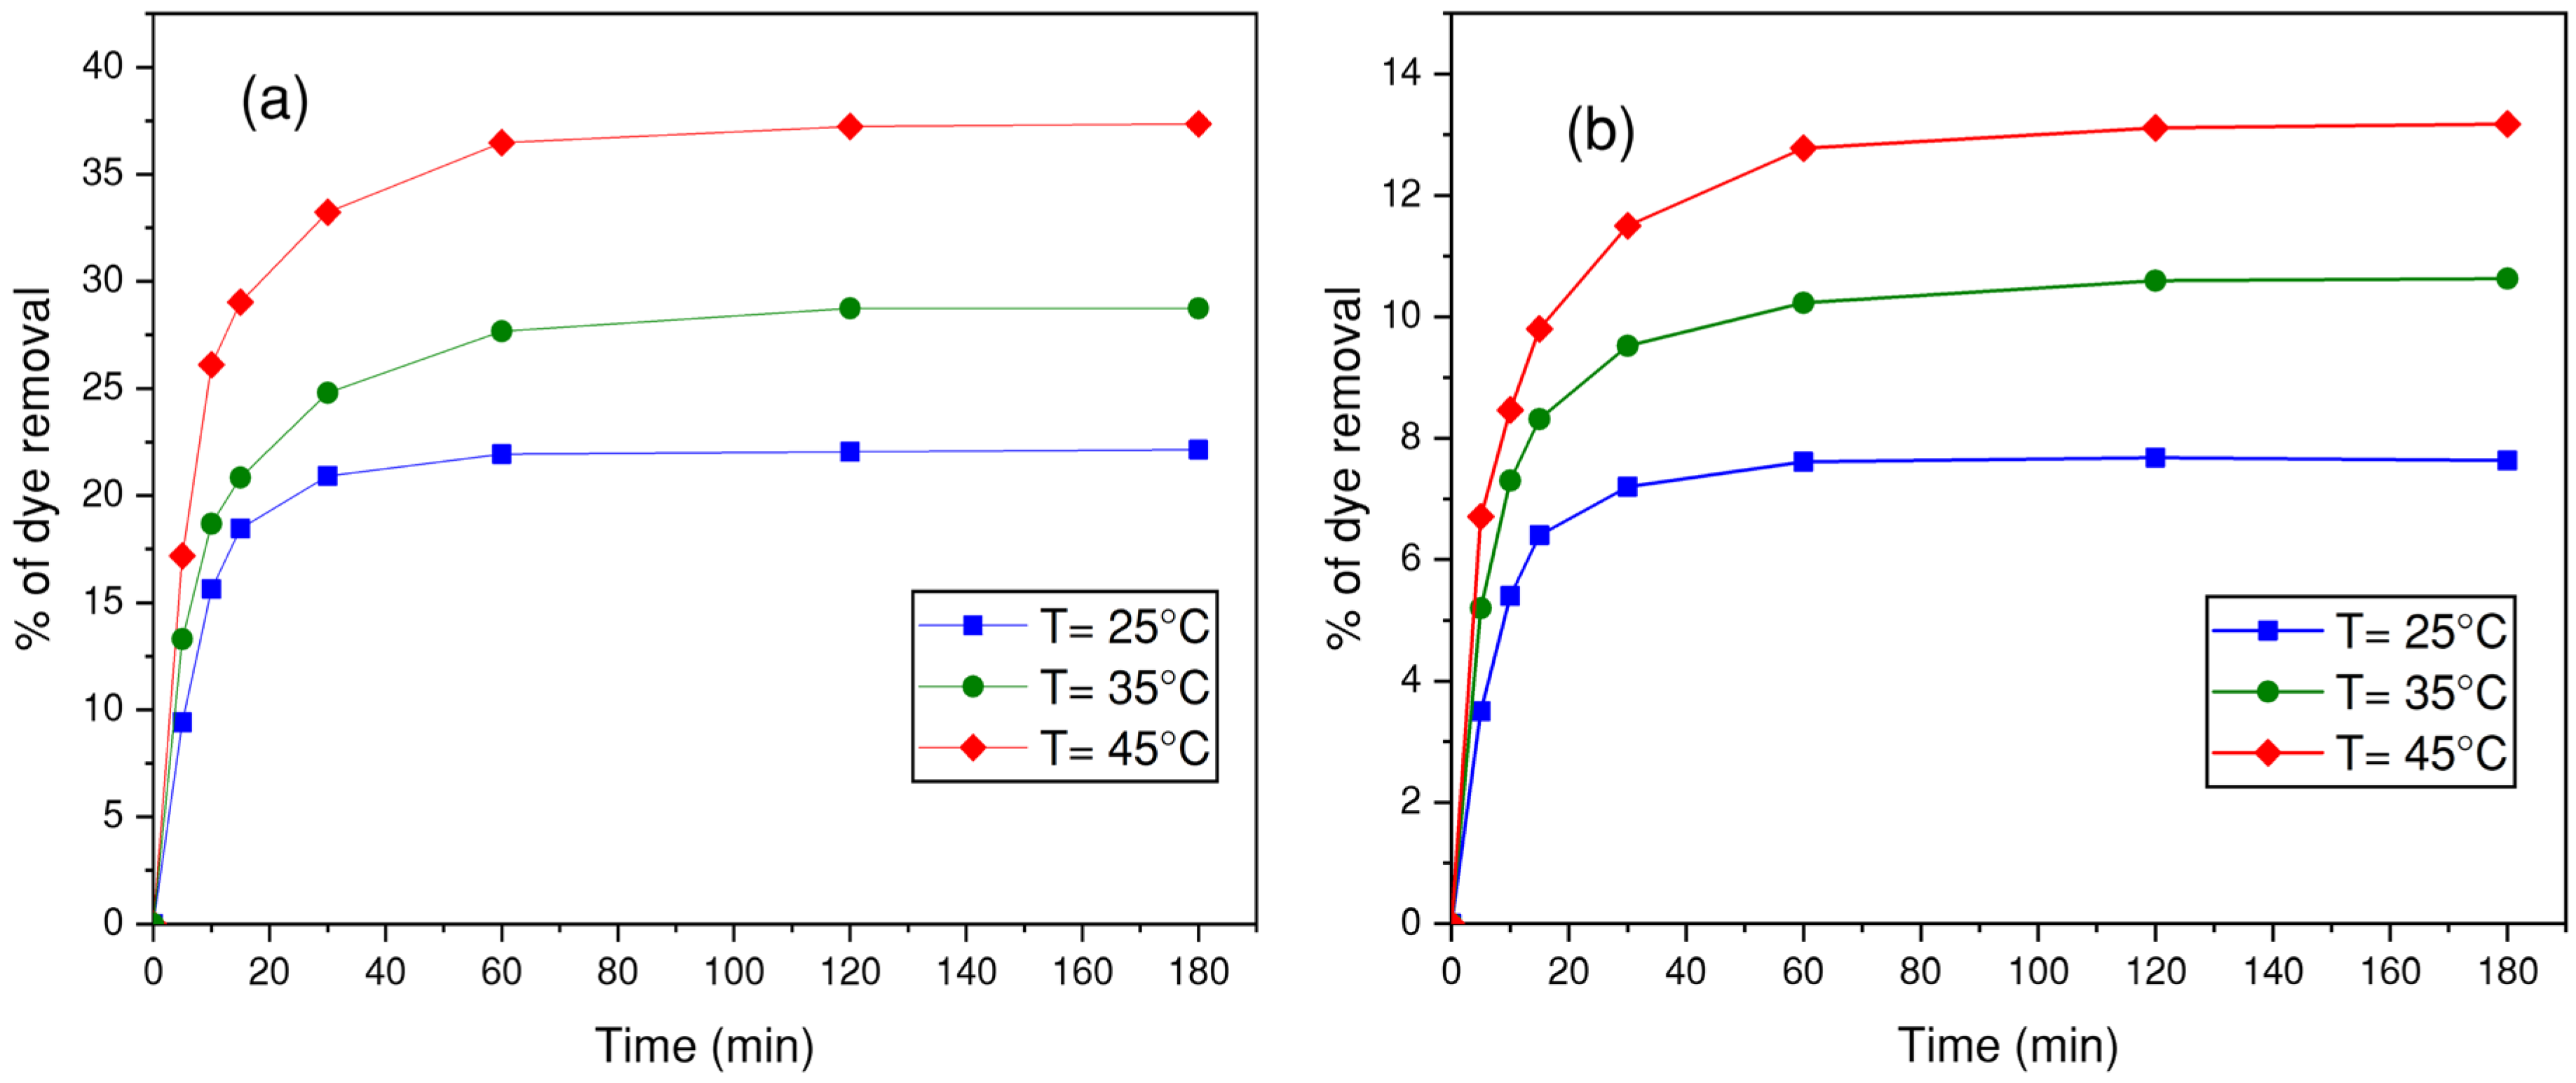
3.4.5. Effect of Temperature

The temperature plays a crucial role in adsorption processes, exerting a significant impact on their efficiency and results. It allows us to analyze the adsorption process and understand how changes in temperature affect the ability of dyes to be adsorbed onto CC. To investigate this, three adsorption experiments were carried out at different solution temperatures (25, 35, and 45 °C), using a fixed pH of 8 for BB-RS01 and pH 6 for BM-N5R. In each test, 1 g of corncob biosorbent (particle size fraction 1.25–2 mm) was added to 1 L of dye solution. The results are presented in Figure 18.
Based on the findings in Figure 18, the adsorption efficiency of the BB-RS01 dye increased from 22.04% to 37.23% when the temperature rose from 25 to 45 °C. Conversely, the adsorption effectiveness of the BM-N5R dye increased from 7.61% to 12.77% when the temperature rose from 25 to 45 °C. This indicates that the process is endothermic [89]. The time required to achieve equilibrium was 60 min for both dyes. The observed phenomenon may be attributed to the reduction in the thickness of the liquid’s resistance to flow as the temperature rises. This leads to acceleration in the pace at which the MB dye molecules spread through the outer layer and penetrate the pores of the substance that adsorbs them. Additionally, higher temperatures increase the movement of molecules that adsorb, making it easier for monolayers to develop on the surface [90]. Furthermore, a rise in temperature may lead to an enlargement of the pore size of the corncob particles [91].

3.5. Equilibrium Adsorption

Equilibrium adsorption, commonly known as adsorption isotherms, of both dyes by CC were carried out under the optimal operating conditions previously determined through kinetic studies, as shown in Table 1.
Figure 19 shows the CC adsorption isotherms (qe vs. Ce) for BB-RS01 and BM-N5R. The classification by Giles et al. [92] for liquid–solid adsorption indicates that these isotherms are of the L type.
The data presented in Figure 19 provides information on the capacity of CC to remove dyes per unit of mass under system conditions. The plot of these adsorption isotherms shows that the maximum adsorption capacities for both dyes by corncob are approximately 68 mg/g for BB-RS01 and 31 mg/g for BM-N5R. These results indicate that BB-RS01 has a greater affinity for CC than BM-N5R.

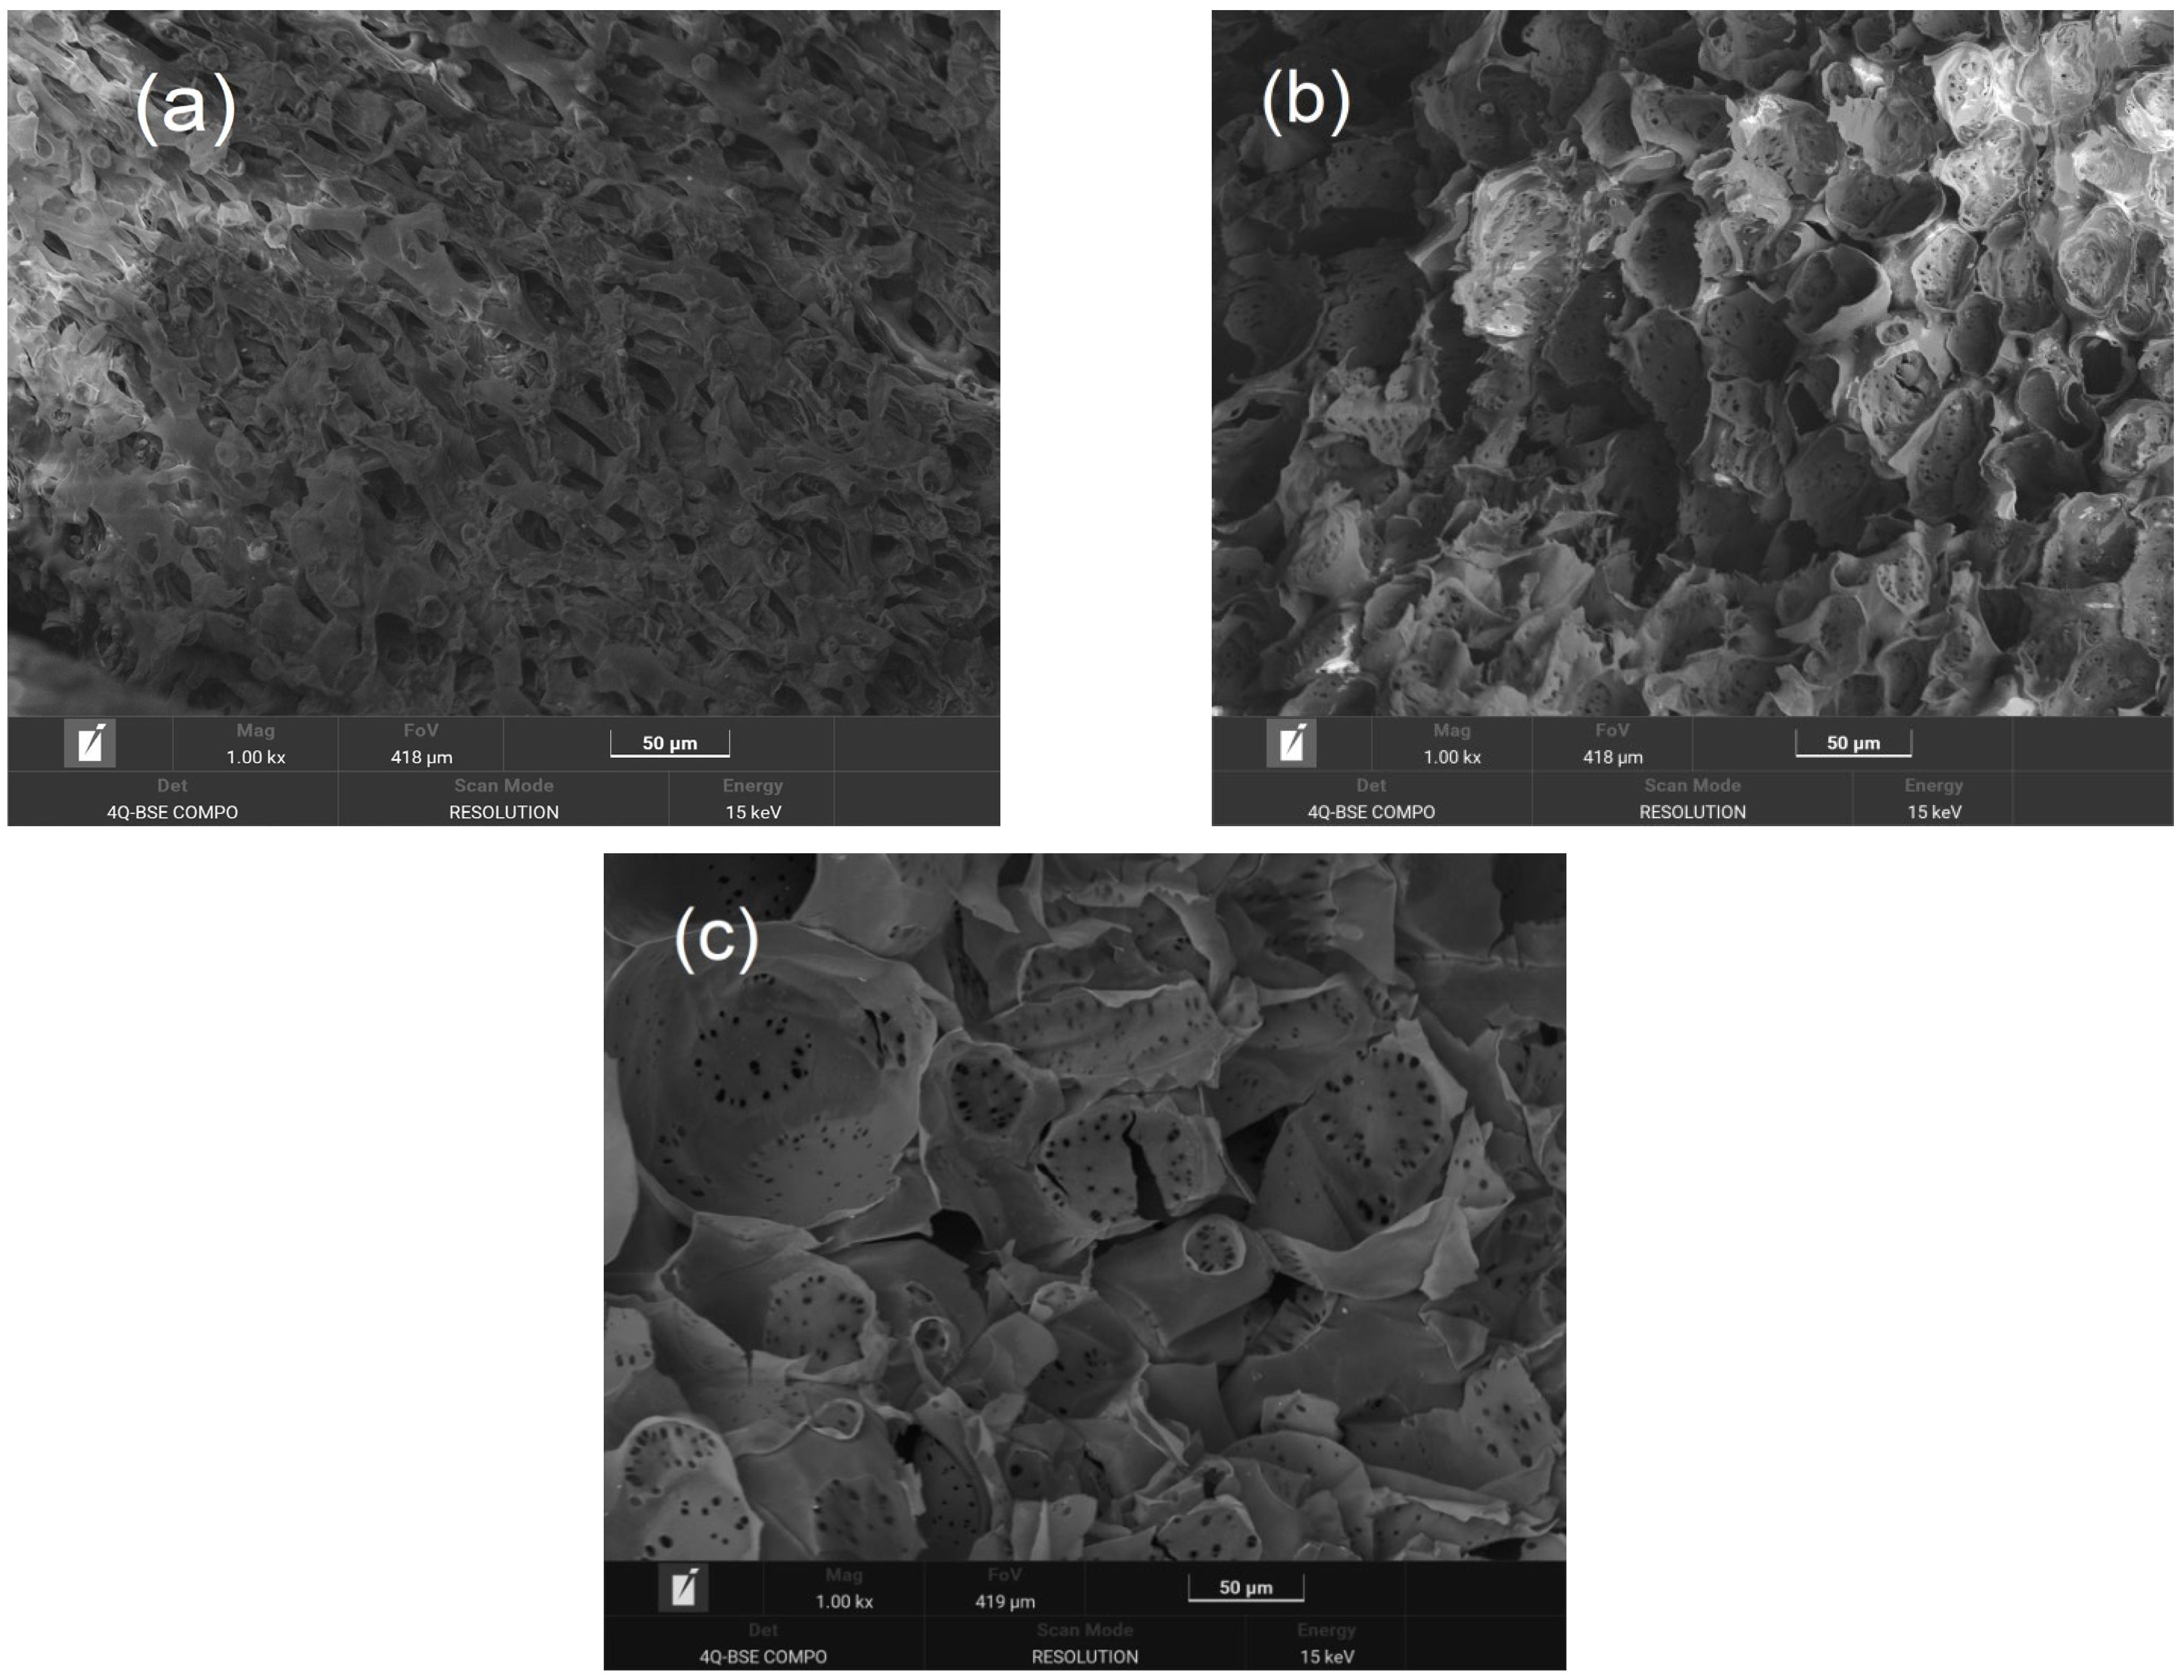
3.6. Scanning Electronic Microscopy (SEM)

Figure 20 illustrates the particle morphologies of the corncobs both before (Figure 20a) and after dye adsorption (Figure 20b,c). Figure 20a provides a clearer view of the surface shape of the initial corncob material. However, Figure 20b,c reveal that the surface of the particles becomes irregular and exhibits rough heterogeneity after the adsorption process.
Figure 20 displays a significant transformation of the original nonporous CC, characterized by an altered surface structure. This alteration signifies the formation of a novel adsorbate and illustrates the material’s enhanced capacity to attract and adhere to other compounds. Our observations align with those reported in the literature, which attribute this phenomenon to partial pore coverage by dye molecules [93], or are based on the number of pores involved in the dye molecules [94].

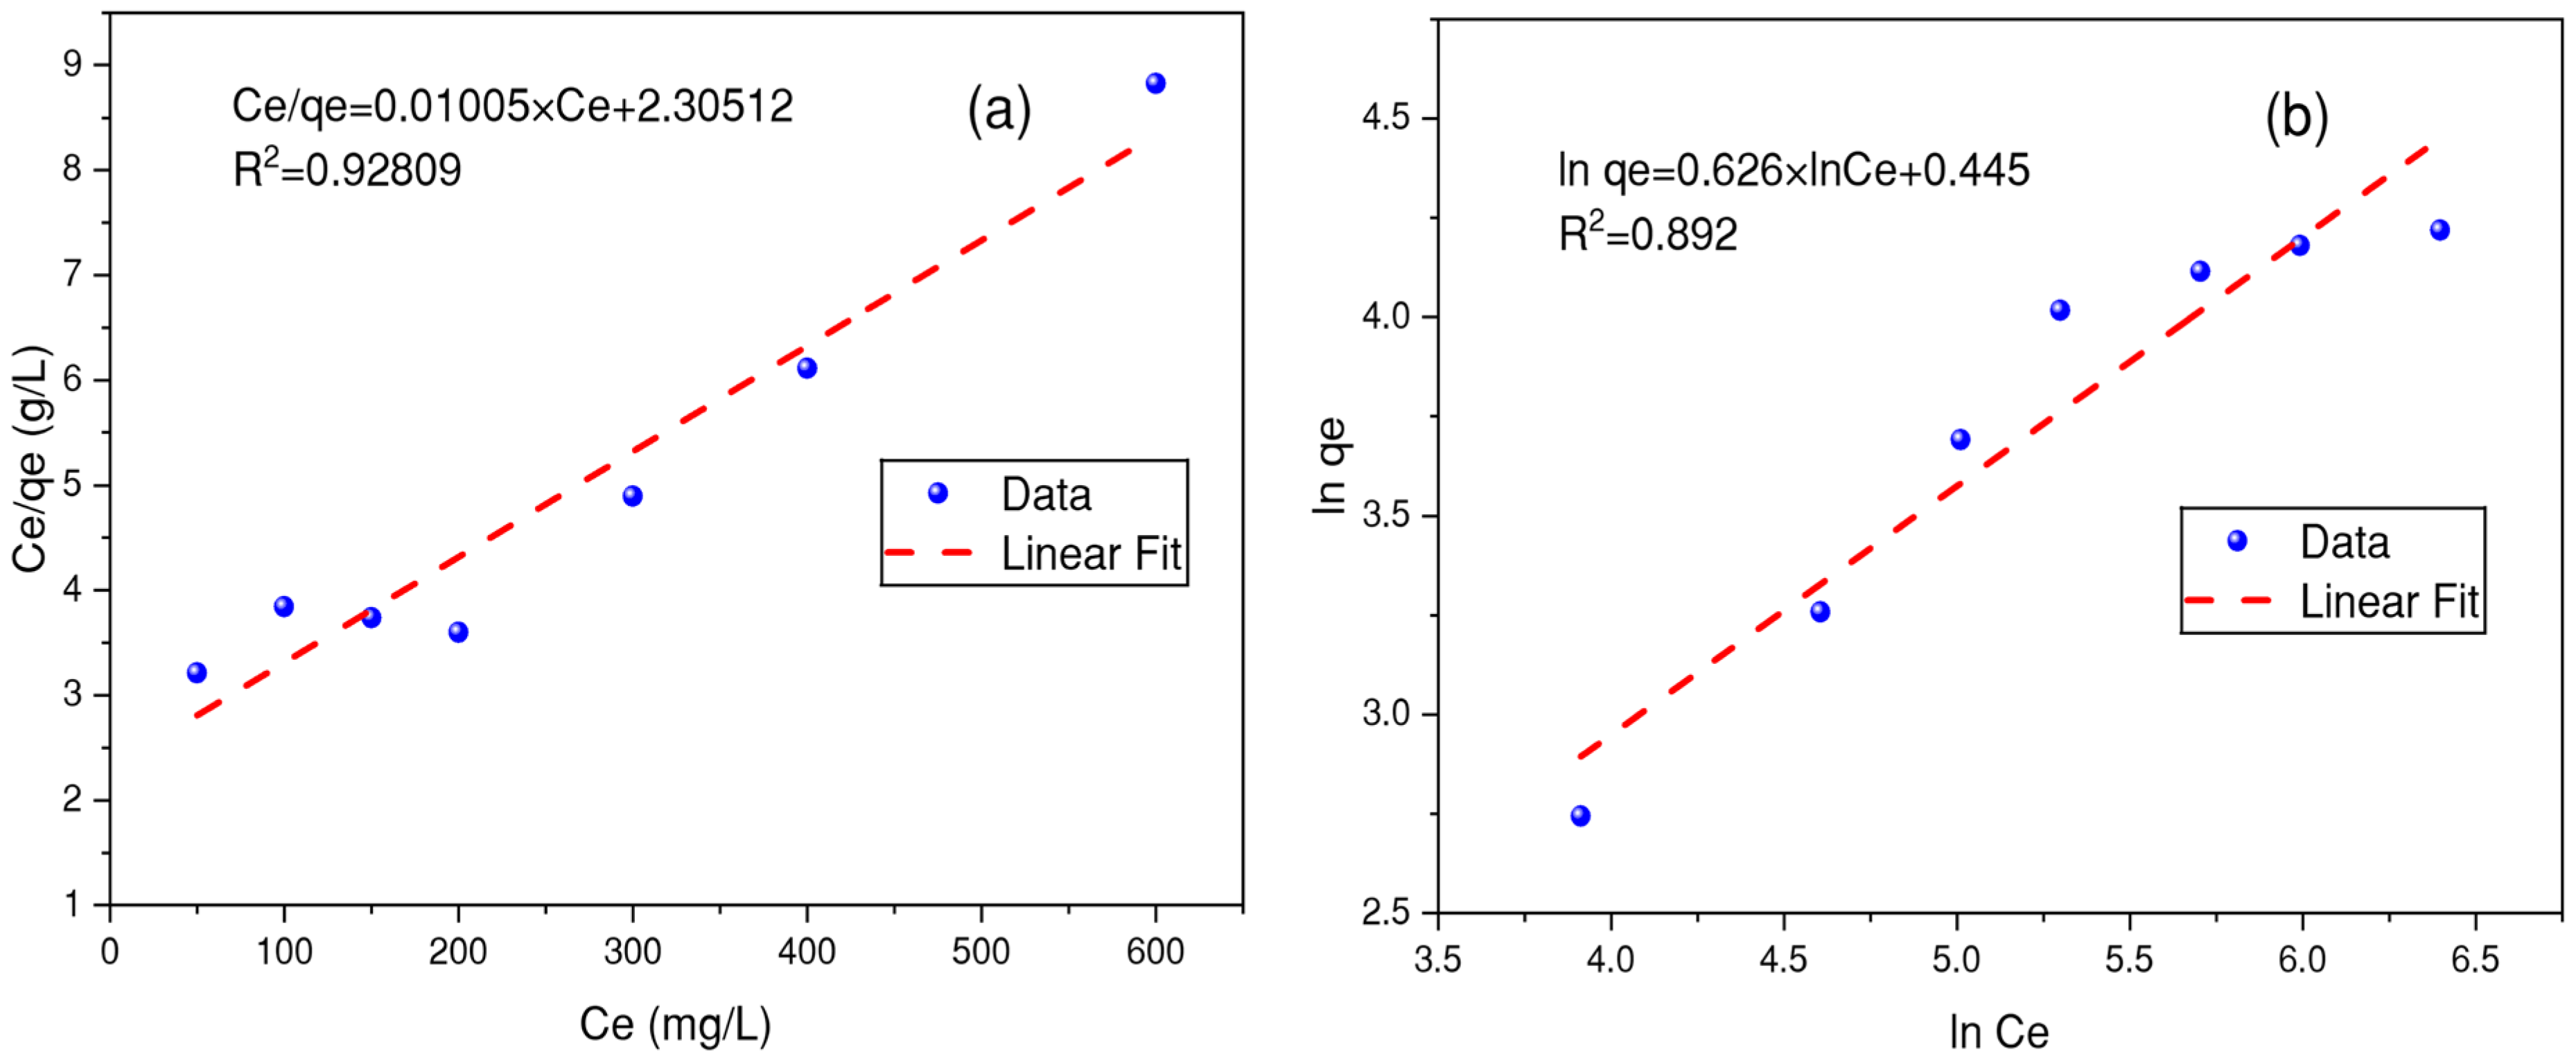
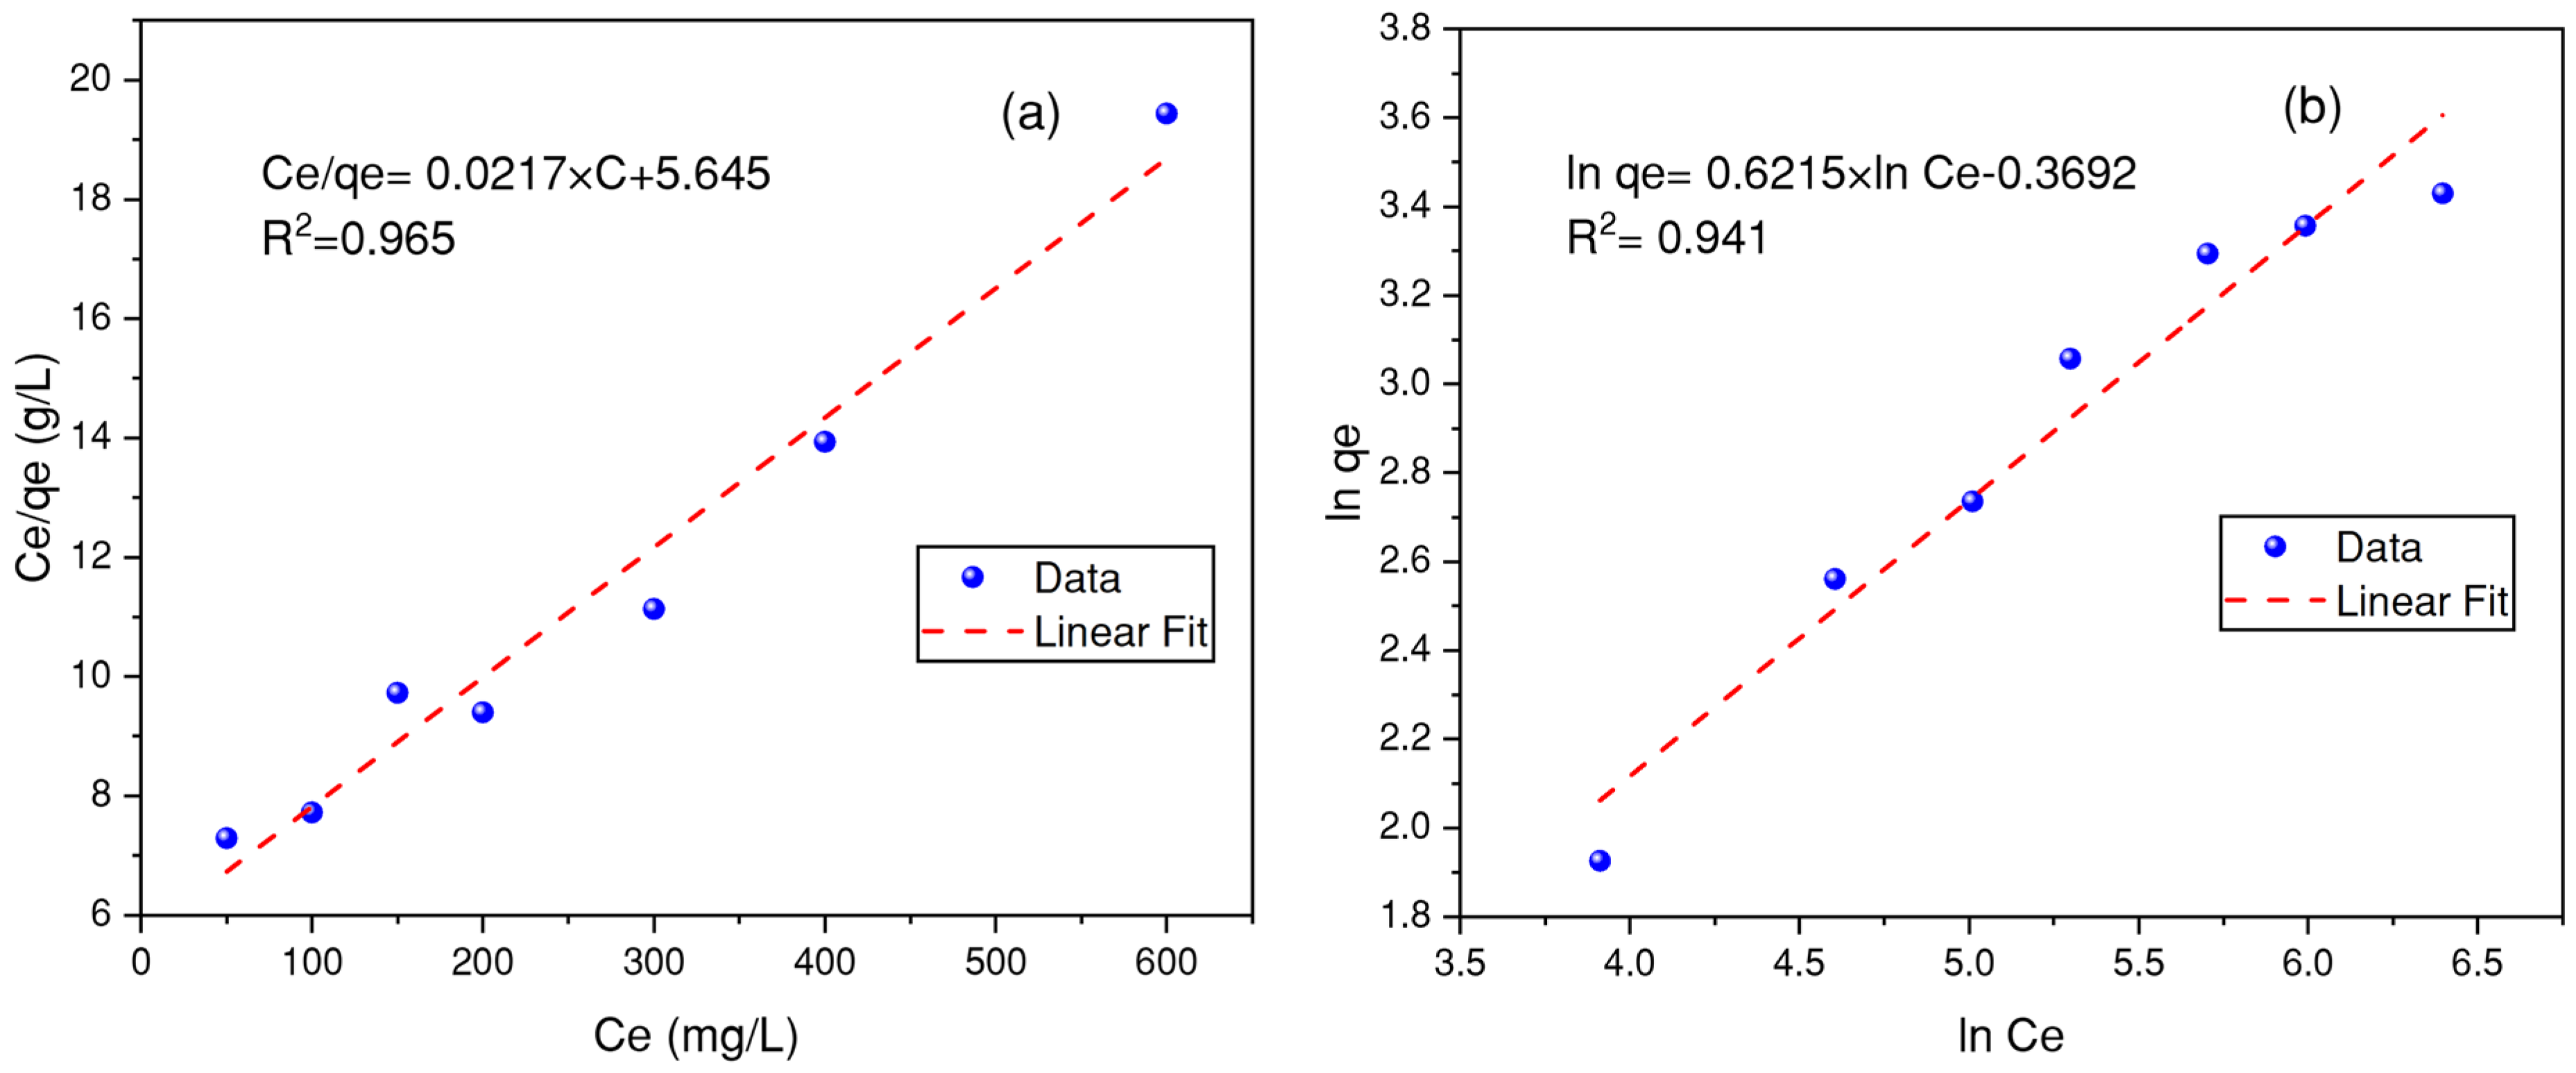
3.7. Modeling of the Adsorption Isotherms

This study examined the design of the adsorption system with the goal of reducing dyes from aqueous solutions by evaluating two isotherm equations: Langmuir [95] and Freundlich [96]. The adsorption experiments for the isotherm study were conducted at a constant temperature of 25 °C, using a particle size fraction of 1.25–2 mm of ground corncob (CC).
Their linearized models are as follows:
Langmuir model:
C e q e = 1 K L · q m + C e q m
Freundlich model:
l n q e = l n K F + n l n C e
where qe represents the amount of dye adsorbed at equilibrium per gram of adsorbent (mg/g), and qm denotes the maximum dye adsorption capacity of the adsorbent material (mg/g). Ce is the equilibrium dye concentration in the solution (mg/L). KL is the equilibrium constant (L/mg) that depends on the conditions applied. The values of KF and n are positive constants that are determined by both the solute-adsorbent interaction characteristics and the ambient temperature. The intercept and slope values of Ce/qe versus Ce linear plots were used to determine the constants qm and KL. However, the values of the constants n and KF can be derived from the slope and the intercept at the origin of the lnqe vs. lnCe plots, respectively. Figure 21 and Figure 22 display the equilibrium data modeling curves for both BB-RS01 and BM-N5R.
The parameter results of each model are given in Table 2.
Based on the information presented in Figure 21 and Figure 22, and taking into account the model parameters listed in Table 2, it appears that the Langmuir model seems to be more suitable for representing the experimental results across the range of tested dye concentration. This is supported by the stronger regression coefficients (0.92 < R2 < 0.96), compared to the Freundlich model (0.89 < R2 < 0.94). The constant “n” falls between 0 and 1 indicating that both physisorption and chemisorption contribute to the adsorption of dyes on the sorbent surface. El-Bendary et al. [97] indicate that the findings of this study confirm the presence of monolayer adsorption on a uniform surface. Furthermore, their study suggests that the formation of a uniform monolayer is a crucial aspect of the adsorption process. The maximum adsorption capacities (qmax) of CC for BB-RS01 and BM-N5R were approximately 99.5 mg/g and 46 mg/g, respectively, under on the experimental conditions.
The infrared spectrum of CC (Figure 4) confirms the presence of cellulose and lignin in its structure. These components have hydroxyl (OH) and carboxyl (COOH) groups in their functional groups, which play a significant role in the adsorption of dyes. Figure 23 and Figure 24 show infrared spectra of corncob after dye adsorption, as well as a schematic illustration of the possible adsorption mechanism of the investigated dyes by CC.
Based on the infrared spectrum presented in Figure 23 after dye adsorption by CC, distinct and intense absorption peaks appeared indicating the adsorption of dye molecules by CC. Subtle shifts were detected in almost all spectral peaks, particularly in the regions corresponding to hydroxyl (-OH) and amino (-NH) groups. Additionally, modifications were observed in the carbonyl (C=O) and ether (C—O) functional groups. The findings indicate that hydroxyl, amino, and carboxyl groups are the primary functional moieties on the surface of corncob (CC), likely playing a significant role in the adsorption processes of BB-RS01 and BM-N5R. These findings align with earlier data regarding the FTIR characterization of lignocellulosic materials [47,98,99].
As shown in Figure 24, both BB-RS01 (Figure 24a) and BM-N5R (Figure 24a) exhibit similar types of interactions: π–π stacking, hydrogen bonding, and electrostatic interactions. However, the spatial orientation, number, and relative strength of these interactions differ between the two dyes. Notably:
-
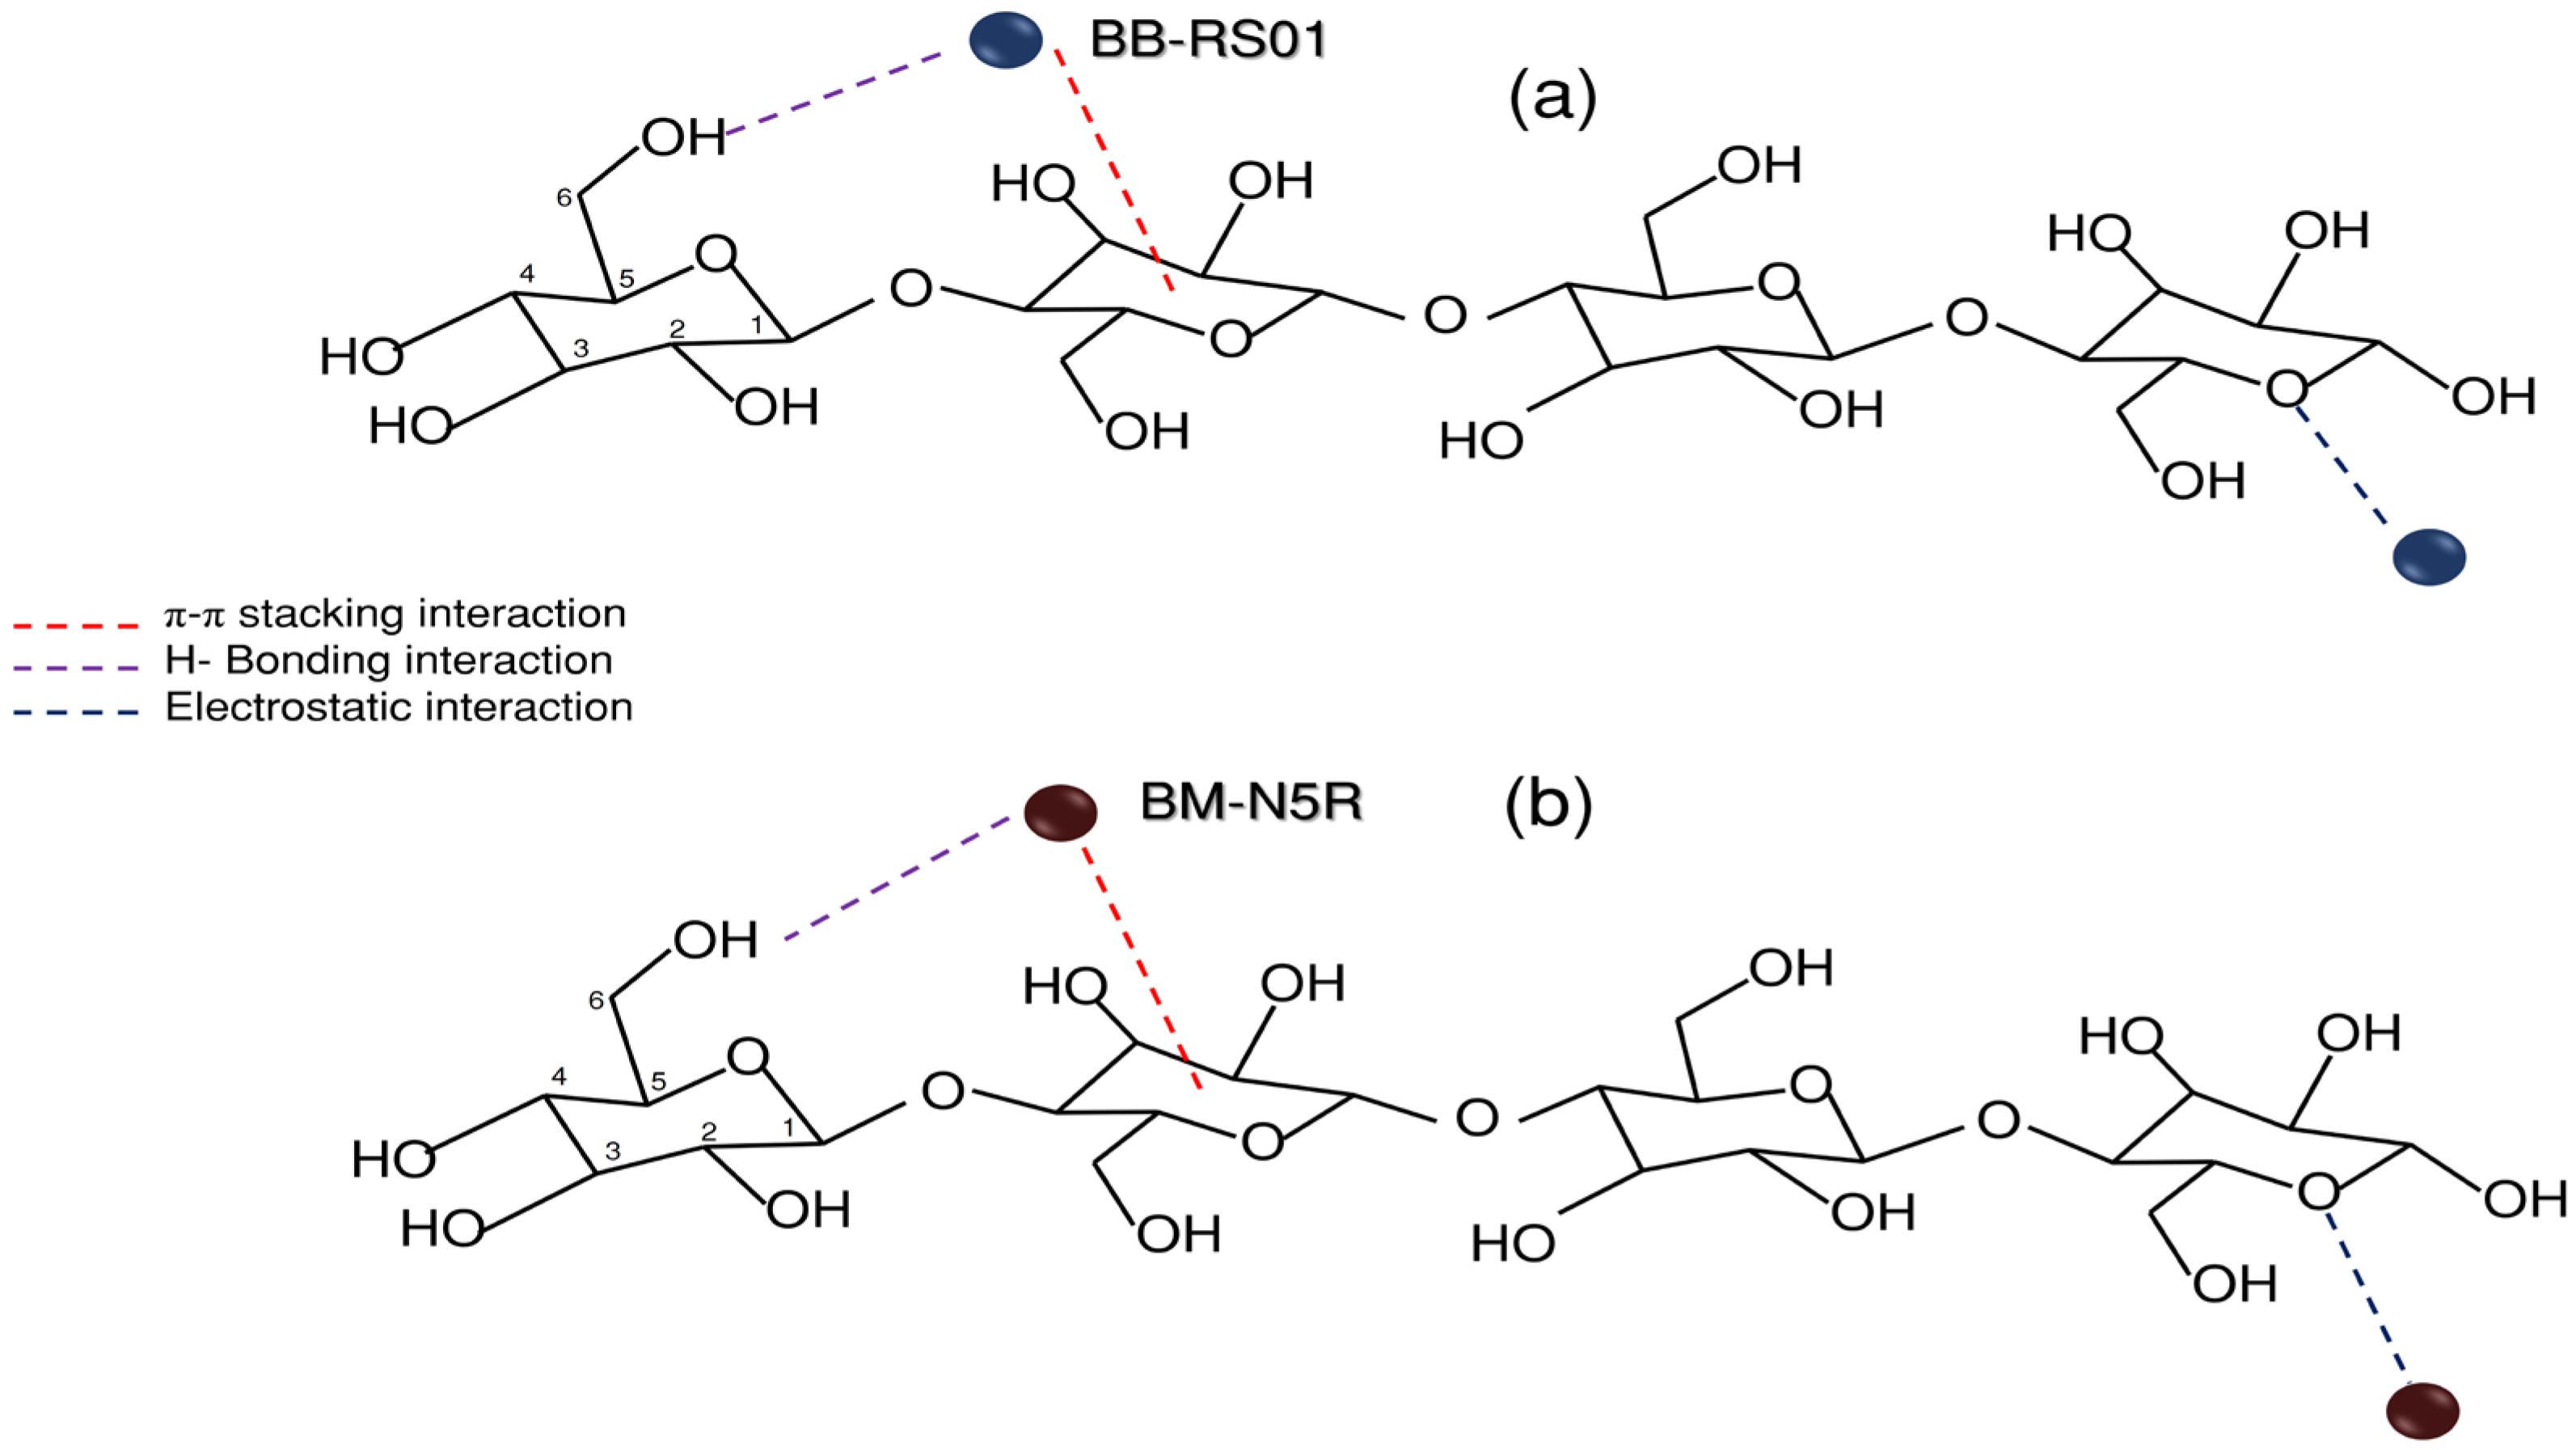
The BB-RS01 molecule shows a more favorable π–π stacking alignment and stronger hydrogen bonding with the biosorbent surface compared to BM-N5R.
-
Differences in molecular size, structure, and functional group distribution between BB-RS01 and BM-N5R influence the accessibility and interaction energy at the active sites of the biosorbent.
Additionally, the electrostatic interactions may vary due to differences in charge distribution and solubility properties of the dyes in solution. These molecular-level differences contribute to a more rapid and efficient adsorption process for BB-RS01, thus explaining the nearly twofold increase in the adsorption rate compared to BM-N5R.
As shown in Table 3, the dye adsorption capacity of CC exceeds that of other agricultural wastes reported in the literature.
Although this research has shown some improvements, the adsorption capabilities discussed here are not as high as those reported for other adsorbents, as shown in Table 3. The differences in dye adsorption efficiency can be attributed to the inherent properties of the adsorbent materials. These properties include the molecular structure, surface area, and the presence of active functional groups. Additionally, the type of dye and the specific experimental conditions used in each study are essential factors in the adsorption process. This highlights the importance of understanding the adsorption processes to improve material design and achieve better efficiency in dye removal.

4. Conclusions

Textile effluents present a major challenge for treatment due to the presence of persistent dyes and toxic organic compounds. This study investigates the use of coagulation-flocculation and corncob (CC) adsorption together to enhance the removal of dyes from textile effluent. The method was tested using synthetic solutions representing disperse and acid dye classes. The pH of the solution and reagent concentrations had a significant influence on the effectiveness of coagulation–flocculation, ensuring successful solid–liquid separation. The optimal dosages of coagulant for Bemacid Marine (BM-N5R) and Bemacron Blue (BB-RS01) were found to be 300 mg/L and 400 mg/L, respectively. The corresponding flocculant concentrations for BM-N5R and BB-RS01 were 75 mg/L and 50 mg/L, respectively. Color removal was greatly influenced by pH, with decolorization rates of 95.1% for BB-RS01 at pH 8 and 92.3% for BM-N5R at pH 6.5. By manipulating pH levels (ranging from 2 to 11), adjusting flocculant quantities between 30 and 125 mg/L, and varying coagulant dosages from 50 to 600 mg/L, the investigation identified the most effective conditions for dye removal. The use of Superfloc 8336 polymer [109] resulted in enhanced flocculation and improved sediment conditioning. However, while aluminum sulfate has been proven effective as a coagulant, its use may result in residual aluminum ions under specific pH conditions. This could require additional purification steps and increased treatment costs. This limitation highlights the need to evaluate environmental impact and suggests the need for further studies to explore alternative coagulants or post-treatment methods to improve process sustainability.
Adsorption experiments demonstrated that factors such as temperature (25–45 °C), pH (2–11), biosorbent dose (0.5–3.15 mm), particle size (0.63–3.15 mm), and initial dye concentration (15–100 mg/L) significantly influenced dye uptake. The study investigated adsorption equilibrium principles, isotherms, and mechanisms, while also evaluating the effectiveness of CC in treating textile wastewater. Corncob demonstrated pH-dependent efficacy in adsorption experiments, with removal efficiencies of 26.19% for BB-RS01 at pH 6 and 7.69% for BM-N5R at pH 4. The adsorption of dye was facilitated by an increase in temperature from 25 to 45 °C, suggesting that the process is endothermic. During the characterization of CC, a mesoporous and irregular morphology was identified. The Langmuir model provides the best fit for the adsorption equilibrium data. The adsorption performance of corncob (CC) as a biosorbent was validated through its maximum adsorption capacities, reaching approximately 99.5 mg/g for Bemacron Blue (BB-RS01) and 46 mg/g for Bemacid Marine (BM-N5R), with BB-RS01 showing superior affinity. Furthermore, the incorporation of adsorption with coagulation–flocculation significantly improved the overall efficiency of dye removal from textile effluent, highlighting the synergistic effects of the combined treatment approach in enhancing pollutant sequestration.
This combined procedure offers a sustainable and cost-effective solution for remediating textile effluent, providing both economic and environmental benefits. The use of corncob (CC), as a low-cost adsorbent derived from agricultural waste, reduces the risk of environmental pollution. It also contributes to the development of the circular economy by offering tangible ecological and economic advantages. This is achieved by integrating biomass from agricultural waste into wastewater treatment processes.
The study demonstrates that CC can achieve dye removal efficiencies. The results are encouraging for manufacturers and of interest to public authorities. These findings can help decision-makers looking for cost-effective biosorbents for dye-contaminated wastewater, especially in regions where corncob waste is abundant. However, further research is necessary to evaluate the performance of corncob in multiple effluent purification cycles and explore the potential for corncob regeneration, through appropriate desorption techniques using alkaline or acidic solutions. This could allow for multiple reuse cycles and reduce overall waste. Understanding the long-term feasibility of corncob (CC) as a biosorbent is crucial to determining its suitability for large-scale industrial applications.

Author Contributions

H.B.R., M.B. and A.N.G.: conceptualization, methodology, formal analysis, investigation, writing—original draft, writing—review and editing. E.F.D.S. and J.L.: formal analysis, investigation, writing—review and editing. All authors have read and agreed to the published version of the manuscript.

Funding

This work was financially supported by the Erasmus + Program (Project: 2020-1-PT01-KA107-077895) and the Algerian Higher Ministry of Education and Scientific Research (PRFU Project, Code: 20001UN01N17A).

Data Availability Statement

The original contributions presented in this study are included in the article. Further inquiries can be directed to the corresponding author.

Acknowledgments

The authors express their sincere gratitude to the Natural and Bioactive Substances Laboratory (University of Tlemcen, Algeria), the Applied Mineralogy and Applied Geochemistry Laboratory (University of Aveiro, Portugal), and the CICECO Laboratory (University of Aveiro, Portugal) for their support in material analysis and characterization.

Conflicts of Interest

The authors declare no conflicts of interest.

References

  1. Lin, J.; Ye, W.; Xie, M.; Seo, D.H.; Luo, J.; Wan, Y.; Van Der Bruggen, B. Environmental impacts and remediation of dye-containing wastewater. Nat. Rev. Earth Environ. 2023, 4, 785–803. [Google Scholar] [CrossRef]
  2. Al-Tohamy, R.; Ali, S.S.; Li, F.; Okasha, K.M.; Mahmoud, Y.A.-G.; Elsamahy, T.; Jiao, H.; Fu, Y.; Sun, J. A critical review on the treatment of dye-containing wastewater: Ecotoxicological and health concerns of textile dyes and possible remediation approaches for environmental safety. Ecotoxicol. Environ. Saf. 2022, 231, 113160. [Google Scholar] [CrossRef] [PubMed]
  3. Khan, W.U.; Ahmed, S.; Dhoble, Y.; Madhav, S. A critical review of hazardous waste generation from textile industries and associated ecological impacts. J. Indian Chem. Soc. 2023, 100, 100829. [Google Scholar] [CrossRef]
  4. Faghihinezhad, M.; Baghdadi, M.; Shahin, M.S.; Torabian, A. Catalytic ozonation of real textile wastewater by magnetic oxidized g-C3N4 modified with Al2O3 nanoparticles as a novel catalyst. Sep. Purif. Technol. 2022, 283, 120208. [Google Scholar] [CrossRef]
  5. Chittal, V.; Gracias, M.; Anu, A.; Saha, P.; Rao, K.B. Biodecolorization and biodegradation of azo dye reactive orange-16 by marine Nocardiopsis sp. Iran. J. Biotechnol. 2019, 17, e1551. [Google Scholar]
  6. Zollinger, H. Color Chemistry: Syntheses, Properties, and Applications of Organic Dyes and Pigments; John Wiley & Sons: Hoboken, NJ, USA, 2003. [Google Scholar]
  7. Arslan, I. Treatability of a simulated disperse dye-bath by ferrous iron coagulation, ozonation, and ferrous iron-catalyzed ozonation. J. Hazard. Mater. 2001, 85, 229–241. [Google Scholar] [CrossRef]
  8. Periyasamy, A.P. Recent Advances in the Remediation of Textile-Dye-Containing Wastewater: Prioritizing Human Health and Sustainable Wastewater Treatment. Sustainability 2024, 16, 495. [Google Scholar] [CrossRef]
  9. Karam, A.; Bakhoum, E.S.; Zaher, K. Coagulation/flocculation process for textile mill effluent treatment: Experimental and numerical perspectives. Int. J. Sustain. Eng. 2021, 14, 983–995. [Google Scholar] [CrossRef]
  10. Zaharia, C.; Musteret, C.-P.; Afrasinei, M.-A. The Use of Coagulation–Flocculation for Industrial Colored Wastewater Treatment—(I) The Application of Hybrid Materials. Appl. Sci. 2024, 14, 2184. [Google Scholar] [CrossRef]
  11. Asfaha, Y.G.; Zewge, F.; Yohannes, T.; Kebede, S. Application of hybrid electrocoagulation and electrooxidation process for treatment of wastewater from the cotton textile industry. Chemosphere 2022, 302, 134706. [Google Scholar] [CrossRef]
  12. Louhichi, B.; Gaied, F.; Mansouri, K.; Jeday, M.R. Treatment of textile industry effluents by Electro-Coagulation and Electro-Fenton processes using solar energy: A comparative study. Chem. Eng. J. 2022, 427, 131735. [Google Scholar] [CrossRef]
  13. Elbatea, A.A.; Nosier, S.A.; Zatout, A.A.; Hassan, I.; Sedahmed, G.H.; Abdel-Aziz, M.H.; El-Naggar, M.A. Removal of reactive red 195 from dyeing wastewater using electro-Fenton process in a cell with oxygen sparged fixed bed electrodes. J. Water Process Eng. 2021, 41, 102042. [Google Scholar] [CrossRef]
  14. Moghadam, F.; Nori Kohbanan, N. Removal of Reactive Blue 19 Dye Using Fenton From Aqueous Solution. Avicenna J. Environ. Health Eng. 2018, 5, 50–55. [Google Scholar] [CrossRef]
  15. Süzen, Y.; Ozmetin, C. Removal of Reactive Black 5 dye using Fenton oxidation from aqueous solutions and optimization of response surface methodology. Desalination Water Treat. 2019, 172, 106–114. [Google Scholar] [CrossRef]
  16. Li, C.-B.; Xiao, F.; Xu, W.; Chu, Y.; Wang, Q.; Jiang, H.; Li, K.; Gao, X.-W. Efficient self-photo-degradation of cationic textile dyes involved triethylamine and degradation pathway. Chemosphere 2021, 266, 129209. [Google Scholar] [CrossRef]
  17. Bisht, V.; Lal, B. Exploration of Performance Kinetics and Mechanism of Action of a Potential Novel Bioflocculant BF-VB2 on Clay and Dye Wastewater Flocculation. Front. Microbiol. 2019, 10, 1288. [Google Scholar] [CrossRef]
  18. Ikram, M.; Zahoor, M.; El-Saber Batiha, G. Biodegradation and decolorization of textile dyes by bacterial strains: A biological approach for wastewater treatment. Z. Phys. Chem. 2021, 235, 1381–1393. [Google Scholar] [CrossRef]
  19. Boumediene, M.; Benaïssa, H.; George, B.; Molina, S.; Merlin, A. Effects of pH and ionic strength on methylene blue removal from synthetic aqueous solutions by sorption onto orange peel and desorption study. J. Mater. Environ. Sci. 2018, 9, 1700–1711. [Google Scholar]
  20. Hammood, Z.A.; Chyad, T.F.; Al-Saedi, R. Adsorption Performance of Dyes Over Zeolite for Textile Wastewater Treatment. Ecol. Chem. Eng. S 2021, 28, 329–337. [Google Scholar] [CrossRef]
  21. Yadav, S.; Asthana, A.; Chakraborty, R.; Jain, B.; Singh, A.K.; Carabineiro, S.A.C.; Susan, M.A.B.H. Cationic Dye Removal Using Novel Magnetic/Activated Charcoal/β-Cyclodextrin/Alginate Polymer Nanocomposite. Nanomaterials 2020, 10, 170. [Google Scholar] [CrossRef]
  22. Marszałek, J.; Żyłła, R. Recovery of water from textile dyeing using membrane filtration processes. Processes 2021, 9, 1833. [Google Scholar] [CrossRef]
  23. Paixão, R.M.; da Silva, L.H.B.R.; Vieira, M.F.; de Amorim, M.T.P.; Bergamasco, R.; Vieira, A.M.S. Enhanced filtration membranes with graphene oxide and tannic acid for textile industry wastewater dye removal. Environ. Technol. 2025, 46, 863–874. [Google Scholar] [CrossRef] [PubMed]
  24. Mirza, N.R.; Huang, R.; Du, E.; Peng, M.; Pan, Z.; Ding, H.; Shan, G.; Ling, L.; Xie, Z. A review of the textile wastewater treatment technologies with special focus on advanced oxidation processes (AOPs), membrane separation and integrated AOP-membrane processes. Desalination Water Treat. 2020, 206, 83–107. [Google Scholar] [CrossRef]
  25. Ahmed, M.; Mavukkandy, M.O.; Giwa, A.; Elektorowicz, M.; Katsou, E.; Khelifi, O.; Naddeo, V.; Hasan, S.W. Recent developments in hazardous pollutants removal from wastewater and water reuse within a circular economy. NPJ Clean. Water 2022, 5, 12. [Google Scholar] [CrossRef]
  26. Silva, J.A. Wastewater Treatment and Reuse for Sustainable Water Resources Management: A Systematic Literature Review. Sustainability 2023, 15, 10940. [Google Scholar] [CrossRef]
  27. Chakraborty, S.; De, S.; Basu, J.K.; DasGupta, S. Treatment of a textile effluent: Application of a combination method involving adsorption and nanofiltration. Desalination 2005, 174, 73–85. [Google Scholar] [CrossRef]
  28. Riera-Torres, M.; Gutiérrez-Bouzán, C.; Crespi, M. Combination of coagulation–flocculation and nanofiltration techniques for dye removal and water reuse in textile effluents. Desalination 2010, 252, 53–59. [Google Scholar] [CrossRef]
  29. Hartal, O.; Madinzi, A.; Rifi, S.K.; Haddaji, C.; Kurniawan, T.A.; Anouzla, A.; Souabi, S. Optimization of coagulation-flocculation process for wastewater treatment from vegetable oil refineries using chitosan as a natural flocculant. Environ. Nanotechnol. Monit. Manag. 2024, 22, 100957. [Google Scholar] [CrossRef]
  30. Jabbar, K.Q.; Barzinjy, A.A.; Hamad, S.M. Iron oxide nanoparticles: Preparation methods, functions, adsorption and coagulation/flocculation in wastewater treatment. Environ. Nanotechnol. Monit. Manag. 2022, 17, 100661. [Google Scholar] [CrossRef]
  31. Puchana-Rosero, M.J.; Lima, E.C.; Mella, B.; Costa, D.d.; Poll, E.; Gutterres, M. A coagulation-flocculation process combined with adsorption using activated carbon obtained from sludge for dye removal from tannery wastewater. J. Chil. Chem. Soc. 2018, 63, 3867–3874. [Google Scholar] [CrossRef]
  32. Ihaddaden, S.; Aberkane, D.; Boukerroui, A.; Robert, D. Removal of methylene blue (basic dye) by coagulation-flocculation with biomaterials (bentonite and Opuntia ficus indica). J. Water Process Eng. 2022, 49, 102952. [Google Scholar] [CrossRef]
  33. Goudjil, S.; Guergazi, S.; Ghernaout, D.; Temim, D.; Masmoudi, T. Brilliant green and methyl violet 2B dyes removal using aluminium sulfate (AS) in single and binary systems. Desalination Water Treat. 2024, 319, 100539. [Google Scholar] [CrossRef]
  34. Hui Tan, Q.; Chung Chong, K.; Chan Chong, W.; Onn Lai, S.; Ling Pang, Y.; Hoong Shuit, S.; Yoong Lee, T. The effect of concentration and pH of poly-aluminum chloride on the treatment of industrial textile wastewater. IOP Conf. Ser. Earth Environ. Sci. 2025, 1467, 012006. [Google Scholar] [CrossRef]
  35. Kuzin, E. Synthesis and Use of Complex Titanium-Containing Coagulant in Water Purification Processes. Inorganics 2025, 13, 9. [Google Scholar] [CrossRef]
  36. Padhiyar, H.; Thanki, A.; Kumar Singh, N.; Pandey, S.; Yadav, M.; Chand Yadav, T. Parametric and kinetic investigations on segregated and mixed textile effluent streams using Moringa oleifera seed powders of different sizes. J. Water Process Eng. 2020, 34, 101159. [Google Scholar] [CrossRef]
  37. Fraiha, O.; Hadoudi, N.; Zaki, N.; Salhi, A.; Amhamdi, H.; Akichouh, E.H.; Mourabit, F.; Ahari, M. Comprehensive review on the adsorption of pharmaceutical products from wastewater by clay materials. Desalination Water Treat. 2024, 317, 100114. [Google Scholar] [CrossRef]
  38. Somashekara, D.; Mulky, L. Sequestration of Contaminants from Wastewater: A Review of Adsorption Processes. ChemBioEng Rev. 2023, 10, 491–509. [Google Scholar] [CrossRef]
  39. Bailey, S.E.; Olin, T.J.; Bricka, R.M.; Adrian, D.D. A review of potentially low-cost sorbents for heavy metals. Water Res. 1999, 33, 2469–2479. [Google Scholar] [CrossRef]
  40. Hmamouchi, S.; Abbad, Y.; El Yacoubi, A.; Boulouiz, A.; Sallek, B.; El Idrissi, B.C. Optimization study of methylene blue dye adsorption on Chamaerops humilis fibers biosorption using a central composite design. Desalination Water Treat. 2024, 320, 100824. [Google Scholar] [CrossRef]
  41. Zahmatkesh, S.; Karimian, M.; Chen, Z.; Ni, B.-J. Combination of coagulation and adsorption technologies for advanced wastewater treatment for potable water reuse: By ANN, NSGA-II, and RSM. J. Environ. Manag. 2024, 349, 119429. [Google Scholar] [CrossRef]
  42. Raj, S.; Singh, H.; Bhattacharya, J. Treatment of textile industry wastewater based on coagulation-flocculation aided sedimentation followed by adsorption: Process studies in an industrial ecology concept. Sci. Total Environ. 2023, 857, 159464. [Google Scholar] [CrossRef] [PubMed]
  43. Nourmoradi, H.; Zabihollahi, S.; Pourzamani, H.R. Removal of a common textile dye, navy blue (NB), from aqueous solutions by combined process of coagulation–flocculation followed by adsorption. Desalination Water Treat. 2016, 57, 5200–5211. [Google Scholar] [CrossRef]
  44. Allen, S.J.; Koumanova, B. Decolourisation of water/wastewater using adsorption. J. Univ. Chem. Technol. Metall. 2005, 40, 175–192. [Google Scholar]
  45. Ho, Y.S.; McKay, G. Sorption of copper (II) from aqueous solution by peat. Water Air Soil Pollut. 2004, 158, 77–97. [Google Scholar] [CrossRef]
  46. Akkari, I.; Graba, Z.; Bezzi, N.; Merzeg, F.A.; Bait, N.; Ferhati, A.; Kaci, M.M. Biosorption of Basic Red 46 using raw cactus fruit peels: Equilibrium, kinetic and thermodynamic studies. Biomass Convers. Biorefin. 2022, 14, 1825–1836. [Google Scholar] [CrossRef]
  47. Boumediene, M.; Benaïssa, H.; George, B.; Molina, S.; Merlin, A. Characterization of two cellulosic waste materials (orange and almond peels) and their use for the removal of methylene blue from aqueous solutions. Maderas Cienc. Tecnol. 2015, 17, 69–84. [Google Scholar] [CrossRef]
  48. Hajialigol, S.; Masoum, S. Optimization of biosorption potential of nano biomass derived from walnut shell for the removal of Malachite Green from liquids solution: Experimental design approaches. J. Mol. Liq. 2019, 286, 110904. [Google Scholar] [CrossRef]
  49. Munagapati, V.S.; Wen, H.-Y.; Wen, J.-C.; Gutha, Y.; Tian, Z.; Reddy, G.M.; Garcia, J.R. Anionic congo red dye removal from aqueous medium using Turkey tail (Trametes versicolor) fungal biomass: Adsorption kinetics, isotherms, thermodynamics, reusability, and characterization. J. Dispers. Sci. Technol. 2021, 42, 1785–1798. [Google Scholar] [CrossRef]
  50. Berber-Villamar, N.K.; Netzahuatl-Muñoz, A.R.; Morales-Barrera, L.; Chávez-Camarillo, G.M.; Flores-Ortiz, C.M.; Cristiani-Urbina, E. Corncob as an effective, eco-friendly, and economic biosorbent for removing the azo dye Direct Yellow 27 from aqueous solutions. PLoS ONE 2018, 13, e0196428. [Google Scholar] [CrossRef]
  51. Hussain Gardazi, S.M.; Ashfaq Butt, T.; Rashid, N.; Pervez, A.; Mahmood, Q.; Maroof Shah, M.; Bilal, M. Effective adsorption of cationic dye from aqueous solution using low-cost corncob in batch and column studies. Desalination Water Treat. 2016, 57, 28981–28998. [Google Scholar] [CrossRef]
  52. Salih, S.J.; Kareem, A.S.A.; Anwer, S.S. Adsorption of anionic dyes from textile wastewater utilizing raw corncob. Heliyon 2022, 8, e10092. [Google Scholar] [CrossRef] [PubMed]
  53. Lefebvre, E. Coagulation des Substances Humiques Aquatiques par le fer Ferrique en Milieu Aqueux: Effet de la Préoxydation. Ph.D. Thesis, Université de Poitiers, Poitiers, France, 1990. [Google Scholar]
  54. Semmens, M.J.; Field, T.K. Coagulation: Experiences in organics removal. J.-Am. Water Work. Assoc. 1980, 72, 476–483. [Google Scholar] [CrossRef]
  55. American Water Works Association. AWWA Manual M32-Distribution Network Analysis for Water Utilities; AWWA: Denver, CO, USA, 1989. [Google Scholar]
  56. Bouchelkia, N.; Benazouz, K.; Mameri, A.; Belkhiri, L.; Hamri, N.; Belkacemi, H.; Zoukel, A.; Amrane, A.; Aoulmi, F.; Mouni, L. Study and Characterization of H3PO4 Activated Carbons Prepared from Jujube Stones for the Treatment of Industrial Textile Effluents. Processes 2023, 11, 2694. [Google Scholar] [CrossRef]
  57. Akkari, I.; Graba, Z.; Bezzi, N.; Kaci, M.M.; Merzeg, F.A.; Bait, N.; Ferhati, A.; Dotto, G.L.; Benguerba, Y. Effective removal of cationic dye on activated carbon made from cactus fruit peels: A combined experimental and theoretical study. Environ. Sci. Pollut. Res. 2023, 30, 3027–3044. [Google Scholar] [CrossRef]
  58. Daoud, M.; Benturki, O.; Girods, P.; Donnot, A.; Fontana, S. Adsorption ability of activated carbons from Phoenix dactylifera rachis and Ziziphus jujube stones for the removal of commercial dye and the treatment of dyestuff wastewater. Microchem. J. 2019, 148, 493–502. [Google Scholar] [CrossRef]
  59. Li, X.; Tang, Y.; Cao, X.; Lu, D.; Luo, F.; Shao, W. Preparation and evaluation of orange peel cellulose adsorbents for effective removal of cadmium, zinc, cobalt and nickel. Colloids Surf. A Physicochem. Eng. Asp. 2008, 317, 512–521. [Google Scholar] [CrossRef]
  60. Mahadevan, H.; Nimina, P.V.M.; Krishnan, K.A. An environmental green approach for the effective removal of malachite green from estuarine waters using Pistacia vera L. shell-based active carbon. Sustain. Water Resour. Manag. 2022, 8, 38. [Google Scholar] [CrossRef]
  61. Xiao, Z.; Yuan, M.; Yang, B.; Liu, Z.; Huang, J.; Sun, D. Plant-mediated synthesis of highly active iron nanoparticles for Cr (VI) removal: Investigation of the leading biomolecules. Chemosphere 2016, 150, 357–364. [Google Scholar] [CrossRef]
  62. Yu, L.; Luo, Y.-M. The adsorption mechanism of anionic and cationic dyes by Jerusalem artichoke stalk-based mesoporous activated carbon. J. Environ. Chem. Eng. 2014, 2, 220–229. [Google Scholar] [CrossRef]
  63. Apaydın Varol, E.; Mutlu, Ü. TGA-FTIR Analysis of Biomass Samples Based on the Thermal Decomposition Behavior of Hemicellulose, Cellulose, and Lignin. Energies 2023, 16, 3674. [Google Scholar] [CrossRef]
  64. El-Sayed, S.A.; Khass, T.M.; Mostafa, M.E. Thermal degradation behaviour and chemical kinetic characteristics of biomass pyrolysis using TG/DTG/DTA techniques. Biomass Conv. Bioref. 2024, 14, 17779–17803. [Google Scholar] [CrossRef]
  65. Yan, Q.; Li, J.; Zhang, J.; Cai, Z. Thermal Decomposition of Kraft Lignin under Gas Atmospheres of Argon, Hydrogen, and Carbon Dioxide. Polymers 2018, 10, 729. [Google Scholar] [CrossRef] [PubMed]
  66. Arica, T.A.; Balci, F.M.; Balci, S.; Arica, M.Y. Highly Porous Poly(o-Phenylenediamine) Loaded Magnetic Carboxymethyl Cellulose Hybrid Beads for Removal of Two Model Textile Dyes. Fibers Polym. 2022, 23, 2838–2854. [Google Scholar] [CrossRef]
  67. Chen, G.; Hung, Y.-T. Electrochemical wastewater treatment processes. In Advanced Physicochemical Treatment Technologies; Humana Press: Totowa, NJ, USA, 2007; pp. 57–106. [Google Scholar]
  68. Nguyen, K.M.V.; Phan, A.V.N.; Dang, N.T.; Tran, T.Q.; Duong, H.K.; Nguyen, H.N.; Nguyen, M.V. Efficiently improving the adsorption capacity of the Rhodamine B dye in a SO3 H-functionalized chromium-based metal–organic framework. Mater. Adv. 2023, 4, 2636–2647. [Google Scholar] [CrossRef]
  69. Soares, S.; Camino, G.; Levchik, S. Comparative study of the thermal decomposition of pure cellulose and pulp paper. Polym. Degrad. Stab. 1995, 49, 275–283. [Google Scholar] [CrossRef]
  70. Suárez-García, F.; Martínez-Alonso, A.; Tascón, J.M.D. A comparative study of the thermal decomposition of apple pulp in the absence and presence of phosphoric acid. Polym. Degrad. Stab. 2002, 75, 375–383. [Google Scholar] [CrossRef]
  71. Xu, W.; Liu, B.; Wang, Y.; Xiao, G.; Chen, X.; Xu, W.; Lu, Y. A facile strategy for one-step hydrothermal preparation of porous hydroxyapatite microspheres with core–shell structure. J. Mater. Res. Technol. 2022, 17, 320–328. [Google Scholar] [CrossRef]
  72. Sonwane, C.G.; Bhatia, S.K. Characterization of Pore Size Distributions of Mesoporous Materials from Adsorption Isotherms. J. Phys. Chem. B 2000, 104, 9099–9110. [Google Scholar] [CrossRef]
  73. Suteu, D.; Malutan, T.; Bilba, D. Agricultural waste corn cob as a sorbent for removing reactive dye orange 16: Equilibrium and kinetic study. Cellul. Chem. Technol. 2011, 45, 413. [Google Scholar]
  74. Esmaili, Z.; Barikbin, B.; Shams, M.; Alidadi, H.; Al-Musawi, T.J.; Bonyadi, Z. Biosorption of metronidazole using Spirulina platensis microalgae: Process modeling, kinetic, thermodynamic, and isotherm studies. Appl. Water Sci. 2023, 13, 63. [Google Scholar] [CrossRef]
  75. Mengistu, A.; Abewaa, M.; Adino, E.; Gizachew, E.; Abdu, J. The application of Rumex abyssinicus based activated carbon for Brilliant Blue Reactive dye adsorption from aqueous solution. BMC Chem. 2023, 17, 82. [Google Scholar] [CrossRef] [PubMed]
  76. El Haddad, M.; Mamouni, R.; Slimani, R.; Saffaj, N.; Ridaoui, M.; ElAntri, S.; Lazar, S. Adsorptive removal of Reactive Yellow 84 dye from aqueous solutions onto animal bone meal. J. Mater. Environ. Sci. 2012, 3, 1019–1026. [Google Scholar]
  77. Villacañas, F.; Pereira, M.F.R.; Órfão, J.J.M.; Figueiredo, J.L. Adsorption of simple aromatic compounds on activated carbons. J. Colloid Interface Sci. 2006, 293, 128–136. [Google Scholar] [CrossRef]
  78. Degrémont, S.A. Mémento Technique de L’eau; Le tome 1, 2; Degrémont Suez: Paris, France, 2005. [Google Scholar]
  79. Beltrán-Heredia, J.; Sánchez-Martín, J.; Delgado-Regalado, A.; Jurado-Bustos, C. Removal of Alizarin Violet 3R (anthraquinonic dye) from aqueous solutions by natural coagulants. J. Hazard. Mater. 2009, 170, 43–50. [Google Scholar] [CrossRef]
  80. Desjardins, R. Le Traitement des Eaux, 2nd ed.; Ecole Polytechnique: Palaiseau, France, 1990. [Google Scholar]
  81. Li, Y.; Wang, S.; Shen, Z.; Li, X.; Zhou, Q.; Sun, Y.; Wang, T.; Liu, Y.; Gao, Q. Gradient Adsorption of Methylene Blue and Crystal Violet onto Compound Microporous Silica from Aqueous Medium. ACS Omega 2020, 5, 28382–28392. [Google Scholar] [CrossRef]
  82. El-Habacha, M.; Dabagh, A.; Lagdali, S.; Miyah, Y.; Mahmoudy, G.; Sinan, F.; Chiban, M.; Iaich, S.; Zerbet, M. An efficient and adsorption of methylene blue dye on a natural clay surface: Modeling and equilibrium studies. Environ. Sci. Pollut. Res. 2024, 31, 62065–62079. Available online: https://link.springer.com/10.1007/s11356-023-27413-3 (accessed on 15 July 2024). [CrossRef]
  83. Sharma, G.; Naushad, M.; Kumar, A.; Rana, S.; Sharma, S.; Bhatnagar, A.; Stadler, F.J.; Ghfar, A.A.; Khan, M.R. Efficient removal of coomassie brilliant blue R-250 dye using starch/poly(alginic acid-cl-acrylamide) nanohydrogel. Process Saf. Environ. Prot. 2017, 109, 301–310. [Google Scholar] [CrossRef]
  84. Man Mohan, K.; Kiran Kumar, V.; Gajalakshmi, S. Biosorption of AB-193 Dye Using Rice Straw Biomass and Post-Biosorption Application of Treated Wastewater in Olla-Pot Coupled Microbial Fuel Cells (OPMFCs). Waste Biomass Valoriz. 2023, 14, 1539–1549. [Google Scholar] [CrossRef]
  85. Ofomaja, A.; Ho, Y. Equilibrium sorption of anionic dye from aqueous solution by palm kernel fibre as sorbent. Dyes Pigments 2007, 74, 60–66. [Google Scholar] [CrossRef]
  86. Ho, Y.-S.; Chiang, C.-C.; Hsu, Y.-C. Sorption kinetics for dye removal from aqueous solution using activated clay. Sep. Sci. Technol. 2001, 36, 2473–2488. [Google Scholar] [CrossRef]
  87. Asghar, A.; Abdul Raman, A.A.; Wan Daud, W.M.A. Advanced oxidation processes for in-situ production of hydrogen peroxide/hydroxyl radical for textile wastewater treatment: A review. J. Clean. Prod. 2015, 87, 826–838. [Google Scholar] [CrossRef]
  88. Zhang, G.; Yi, L.; Deng, H.; Sun, P. Dyes adsorption using a synthetic carboxymethyl cellulose-acrylic acid adsorbent. J. Environ. Sci. 2014, 26, 1203–1211. [Google Scholar] [CrossRef] [PubMed]
  89. Miyah, Y.; Lahrichi, A.; Idrissi, M.; Khalil, A.; Zerrouq, F. Adsorption of methylene blue dye from aqueous solutions onto walnut shells powder: Equilibrium and kinetic studies. Surf. Interfaces 2018, 11, 74–81. [Google Scholar] [CrossRef]
  90. Güzel, F.; Sayğılı, H.; Akkaya Sayğılı, G.; Koyuncu, F. New low-cost nanoporous carbonaceous adsorbent developed from carob (Ceratonia siliqua) processing industry waste for the adsorption of anionic textile dye: Characterization, equilibrium and kinetic modeling. J. Mol. Liq. 2015, 206, 244–255. [Google Scholar] [CrossRef]
  91. Salh, D.M.; Aziz, B.K.; Kaufhold, S. High Adsorption Efficiency of Topkhana Natural Clay for Methylene Blue from Medical Laboratory Wastewater: A Linear and Nonlinear Regression. Silicon 2020, 12, 87–99. [Google Scholar] [CrossRef]
  92. Giles, C.H.; MacEwan, T.H.; Nakhwa, S.N.; Smith, D. 786. Studies in adsorption. Part XI. A system of classification of solution adsorption isotherms, and its use in diagnosis of adsorption mechanisms and in measurement of specific surface areas of solids. J. Chem. Soc. (Resumed) 1960, 3973–3993. [Google Scholar] [CrossRef]
  93. Annadurai, G.; Juang, R.-S.; Lee, D.-J. Use of cellulose-based wastes for adsorption of dyes from aqueous solutions. J. Hazard. Mater. 2002, 92, 263–274. [Google Scholar] [CrossRef]
  94. Arami, M.; Limaee, N.Y.; Mahmoodi, N.M.; Tabrizi, N.S. Removal of dyes from colored textile wastewater by orange peel adsorbent: Equilibrium and kinetic studies. J. Colloid Interface Sci. 2005, 288, 371–376. [Google Scholar] [CrossRef]
  95. Langmuir, I. The adsorption of gases on plane surfaces of glass, mica and platinum. J. Am. Chem. Soc. 1918, 40, 1361–1403. [Google Scholar] [CrossRef]
  96. Freundlich, H. Adsorption in solids. Z. Phys. Chem. 1906, 57, 385–470. [Google Scholar]
  97. El-Bendary, N.; El-Etriby, H.K.; Mahanna, H. High-performance removal of iron from aqueous solution using modified activated carbon prepared from corn cobs and luffa sponge. Desalination Water Treat. 2021, 213, 348–357. [Google Scholar] [CrossRef]
  98. Derrick, M.R.; Stulik, D.; Landry, J.M. Infrared Spectroscopy in Conservation Science; Getty Publications: Los Angeles, CA, USA, 2000. [Google Scholar]
  99. Yuen, C.W.M.; Ku, S.K.A.; Choi, P.S.R.; Kan, C.W.; Tsang, S.Y. Determining Functional Groups of Commercially Available Ink-Jet Printing Reactive Dyes Using Infrared Spectroscopy. Res. J. Text. Appar. 2005, 9, 26–38. [Google Scholar] [CrossRef]
  100. Ait Ahsaine, H.; Zbair, M.; Anfar, Z.; Naciri, Y.; El Haouti, R.; El Alem, N.; Ezahri, M. Cationic dyes adsorption onto high surface area ‘almond shell’ activated carbon: Kinetics, equilibrium isotherms and surface statistical modeling. Mater. Today Chem. 2018, 8, 121–132. [Google Scholar] [CrossRef]
  101. Inyinbor, A.A.; Adekola, F.A.; Olatunji, G.A. Kinetics, isotherms and thermodynamic modeling of liquid phase adsorption of Rhodamine B dye onto Raphia hookerie fruit epicarp. Water Resour. Ind. 2016, 15, 14–27. [Google Scholar] [CrossRef]
  102. Taifi, A.; Alkadir, O.K.A.; Oda, A.A.; Aljeboree, A.M.; Al Bayaa, A.L.; Alkaim, A.F.; Abed, S.A. Biosorption by Environmental, Natural and Acid-Activated Orange Peels as Low-Cost Aadsorbent: Optimization of Disperse Blue 183 as a Model. IOP Conf. Ser. Earth Environ. Sci. 2022, 1029, 012009. [Google Scholar] [CrossRef]
  103. Guiza, S.; Ghiloufi, K.; Bagane, F.M. Utilization of waste Tunisian palm tree date as low-cost adsorbent for the removal of dyes from textile wastewater. Mediterr. J. Chem. 2014, 3, 1044–1052. [Google Scholar]
  104. Belaid, K.D.; Kacha, S. Study of the kinetics and thermodynamics of the adsorption of a basic dye on sawdust. J. Water Sci. 2011, 24, 131–144. [Google Scholar]
  105. Akperov, E.O.; Akperov, O.H. The wastage of the cotton stalks (Gossypium hirsutum L.) as low-cost adsorbent for removal of the Basic Green 5 dye from aqueous solutions. Appl. Water Sci. 2019, 9, 183. [Google Scholar] [CrossRef]
  106. Boumchita, S.; Lahrichi, A.; Benjelloun, Y.; Lairini, S.; Nenov, V.; Zerrouq, F. Removal of cationic dye from aqueous solution by a food waste: Potato peel. J. Mater. Environ. Sci. 2016, 7, 73–84. [Google Scholar]
  107. Senthil Kumar, P.; Abhinaya, R.V.; Gayathri Lashmi, K.; Arthi, V.; Pavithra, R.; Sathyaselvabala, V.; Dinesh Kirupha, S.; Sivanesan, S. Adsorption of methylene blue dye from aqueous solution by agricultural waste: Equilibrium, thermodynamics, kinetics, mechanism and process design. Colloid J. 2011, 73, 651–661. [Google Scholar] [CrossRef]
  108. Singh, S.; Parveen, N.; Gupta, H. Adsorptive decontamination of rhodamine-B from water using banana peel powder: A biosorbent. Environ. Technol. Innov. 2018, 12, 189–195. [Google Scholar] [CrossRef]
  109. Hocine, H.; Debab, A.; Benettayeb, A.; Al-Farraj, S.; Alkahtane, A.A.; Olivier, J.; Sillanpaa, M. Effectiveness of Opuntia ficus indica (cactus) fruit juice for sludge conditioning. Environ. Monit. Assess. 2023, 195, 1124. [Google Scholar] [CrossRef]
Scheme 1. A schematic diagram of the coagulation–flocculation–sedimentation process combining with the biosorption study.
Environments 12 00201 sch001
Figure 1. The flowchart of experimental methodology.
Environments 12 00201 g001
Figure 2. Graphical abstract of CCs’ collection and preparation. (a) Corncobs in a plantation, (b) corncob fruit after threshing and collection, (c) corncobs after air drying and grain separation, (d) corncobs after crushing and sieving, (e) corncobs during washing, (f) corncobs after preparation.
Environments 12 00201 g002
Figure 3. Jar test setup.
Environments 12 00201 g003
Figure 4. Infrared spectra of corncob (before contact with dyes) in the spectral region of 4000–500 cm−1.
Environments 12 00201 g004
Figure 5. TGA and DTA curves for corncob (CC).
Environments 12 00201 g005
Figure 6. N2 adsorption–desorption isotherms and pore size distribution analysis at 77.3 °K.
Environments 12 00201 g006
Figure 7. pHpzc determination curve for corncob.
Environments 12 00201 g007
Figure 8. Absorbance = f (λmax) curves for various dye concentrations (a) BB-RS01; (b) BM-N5R.
Environments 12 00201 g008
Figure 9. Calibration curve C = f (Absorbance) (a): BB-RS01; (b): BM-N5R.
Environments 12 00201 g009
Figure 10. Influence of coagulant dose on dye removal percentage at a constant dye concentration.
Environments 12 00201 g010
Figure 11. Removal efficiency of dyes at constant concentrations with varying Superfloc doses.
Environments 12 00201 g011
Figure 12. Influence of solution pH on dye elimination by coagulation–flocculation and sedimentation.
Environments 12 00201 g012
Figure 13. Adsorption kinetics of dyes by corncob: Effect of initial dye concentration (a) BB-RS01, (b) BM-N5R.
Environments 12 00201 g013
Figure 14. Adsorption kinetics of dyes by corncob: Effect of corncob mass (a) BB-RS01, (b) BM-N5R.
Environments 12 00201 g014
Figure 15. Histogram showing the effect of biosorbent mass on the removal efficiency of BB-RS01 and BM-N5R dyes.
Environments 12 00201 g015
Figure 16. Adsorption kinetics of dyes by corncob: Effect of particle size (a) BB-RS01, (b) BM-N5R.
Environments 12 00201 g016
Figure 17. Adsorption kinetics of dyes by Corncob: Effect of the solution pH (a) BB-RS01, (b) BM-N5R.
Environments 12 00201 g017
Figure 18. Adsorption kinetics of dyes by corncob: Effect of temperature of the solution (a) BB-RS01, (b) BM-N5R.
Environments 12 00201 g018
Figure 19. Isotherms of dye adsorption on corncob at 25 ± 2 °C (a) BB-RS01 and (b) BM-N5R.
Environments 12 00201 g019
Figure 20. SEM analysis of CC samples: before (a) and after adsorption of (b) BB-RS01 and (c) BM-N5R.
Environments 12 00201 g020
Figure 21. Equilibrium data modeling for BB-RS01 adsorption by corncob (a) Langmuir model and (b) Freundlich model.
Environments 12 00201 g021
Figure 22. Equilibrium data modeling for BM-N5R adsorption by corncob (CC) (a) Langmuir model and (b) Freundlich model.
Environments 12 00201 g022
Figure 23. Infrared spectra of corncob after dyes adsorption.
Environments 12 00201 g023
Figure 24. Schematic representation of the possible adsorption mechanism of the dyes by CC (a) CC-BB-RS01 (b) CC-BM-N5R.
Environments 12 00201 g024
Table 1. Optimal conditions for dye removal by adsorption on CC.
ParametersOptimal Conditions
BB-RS01BM-N5R
Agitation (rpm)400400
pH of solution64
Temperature (°C)4545
Adsorbant size (mm)0.5/0.630.5/0.63
Adsorbant mass (g)33
Agitation time (h)88
Table 2. Langmuir and Freundlich isotherm parameters for dye adsorption by CC.
IsothermsParametersBB-RS01BM-N5R
Langmuirqmax (mg/g)99.546.08
KL (L/mg)0.00440.0038
R20.92800.9650
FreundlichKF1.56030.6913
n0.6260.6215
R20.89200.9410
Table 3. Comparison of the maximum adsorption capacities (qmax) of dyes onto various agricultural waste adsorbents.
AdsorbentDyeqmax (mg/g)References
Almond shellMethylene Blue (MB)833.33[100]
Raphia HookerieRhodamine-B666.67[101]
Almond shellCrystal Violet (CV)625[100]
Orange peelMethylene blue218[47]
Banana peelCongo Red164.6[49]
Acid-activated carbon orange peelDisperse Blue 183149.344[102]
CorncobBemacron Blue-RS01(BB-RS01)99.5In this study
Cactus fruit peelBasic Red 4682.58[46]
Palm tree dateCongo red73.53[103]
Wood sawdustNeutral Red C.I.5004064.06[104]
Banana peelReactive Black 549.2[49]
CorncobBemacid Marine-N5R(BM-N5R)46.08In this study
Cotton stalksBasic Green 542.37[105]
Potato peelMethylene blue32.70[106]
CorncobReactive dye orange 1626.11[73]
Walnut shellMalachite Green11.76[48]
CorncobMethyl Orange7.50[52]
Cashew nutshellMethylene blue5.311[107]
Banana peel powderRhodamine-B3.88[108]
Disclaimer/Publisher’s Note: The statements, opinions and data contained in all publications are solely those of the individual author(s) and contributor(s) and not of MDPI and/or the editor(s). MDPI and/or the editor(s) disclaim responsibility for any injury to people or property resulting from any ideas, methods, instructions or products referred to in the content.

