Article

Habitat Suitability of the Common Leopard (Panthera pardus) in Azad Jammu and Kashmir, Pakistan: A Dual-Model Approach Using MaxEnt and Random Forest

1
State Key Laboratory of Remote Sensing and Digital Earth, Aerospace Information Research Institute, Chinese Academy of Sciences, Beijing 100094, China
2
University of Chinese Academy of Sciences, Beijing 100049, China
3
WWF-Pakistan, Ferozepur Road, P.O. Box 5180, Lahore 54600, Pakistan
*
Authors to whom correspondence should be addressed.
Environments 2025, 12(6), 203; https://doi.org/10.3390/environments12060203
Submission received: 19 May 2025 / Revised: 10 June 2025 / Accepted: 12 June 2025 / Published: 14 June 2025

Abstract

The common leopard (Panthera pardus) in Azad Jammu and Kashmir (AJ and K), Pakistan, is increasingly threatened by habitat fragmentation and climate change. This study employs a dual-model approach, integrating Maximum Entropy (MaxEnt) and Random Forest algorithms with multi-source remote sensing data to evaluate leopard habitat suitability. Our analysis identifies land cover (LC), fractional vegetation cover (FVC), elevation, temperature seasonality (bio4), and distance to roads (Dist_road) as the most influential habitat predictors. Leopards exhibit a strong preference for mixed forests at elevations between 1000 and 3000 m, with a suitability index of 0.83. The study identifies several unsuitable conditions including: road proximity (<0.08 km), low elevation zones (<1000 m), areas with high temperature seasonality (bio4 > 8 °C), and non-forested land cover types. MaxEnt demonstrated superior habitat prediction accuracy over Random Forest (AUC = 0.912 vs. 0.827). The results highlight a distinct north-to-south suitability gradient, with optimal habitats concentrated in the northern districts (Muzaffarabad, Hattian, Neelum, Bagh, Haveli, Poonch, Sudhnutti) and declining suitability in human-dominated southern areas. Based on these findings, this study underscores the urgency of targeted conservation efforts in the northern districts of AJ and K, where optimal leopard habitats are identified. The findings emphasize the need for habitat connectivity and protection measures to mitigate the impacts of habitat fragmentation and climate change. Future conservation strategies should prioritize the preservation of mixed forests and the establishment of buffer zones around roads to ensure the long-term survival of the common leopard in this region.

1. Introduction

Adequate habitats support wildlife populations, offering vital resources such as food, shelter, and breeding grounds [1]. Based on these habitat criteria, stable or vulnerable populations of wild animals are formed [2,3]. However, human-induced activities—including deforestation, habitat fragmentation, poaching, and land-use modifications—have significantly degraded the natural habitats of the common leopard, as well as its prey base [4,5,6,7]. Moreover, large-bodied species with slow reproductive rates, such as the common leopard, are particularly vulnerable to the adverse consequences of climate change [8,9]. Rising temperatures and shifting ecological conditions may reduce suitable habitats, alter forest boundaries, and diminish prey availability [10,11]. As habitats shrink and become more fragmented, prey populations may decline, which can further influence the spatial distribution of the common leopard by reducing the availability of food resources [12]. Such ecological disruptions could exacerbate food shortages, potentially intensifying conflicts between leopards and humans [13].
Conflicts between humans and large carnivores have become increasingly prevalent across various regions [14], posing significant challenges for communities coexisting with these predators [15]. Prolonged negative interactions can escalate tensions among conservation stakeholders, potentially undermining public support for wildlife protection initiatives [16]. Ecological studies by Lynam et al. (2009), Miller et al. (2015), and Patterson et al. (2004) reveal that large felids (Panthera sp.)—particularly tigers (Panthera tigris), leopards (Panthera pardus), and lions (Panthera leo)—are involved in human-wildlife conflicts at rates exceeding their relative abundance [17,18,19]. Notably, a total of 312 attacks claiming 433 head of stock by lions were examined [19,20].
The common leopard (P. pardus) is a highly adaptable yet threatened felid with the broadest geographic range among large cats, spanning Africa (estimated population: 250,000–750,000) and Asia (estimated population: 12,000–14,000), though precise numbers remain uncertain due to their wide distribution and elusive nature [21,22]. In Pakistan, this species inhabits fragmented landscapes, including the highlands of Balochistan and Sindh, as well as the montane forests of Punjab, Khyber Pakhtunkhwa (KP), and Azad Jammu and Kashmir (AJ and K) [23]. Notably, AJ and K’s rugged terrain serves as a critical stronghold for the species, though habitat fragmentation poses increasing threats to its long-term survival [5]. Globally, the common leopard is classified as Vulnerable on the IUCN Red List [24]; but its status in Pakistan is more severe, being considered Critically Endangered nationally due to habitat degradation and fragmentation, prey depletion, retaliatory killings, overexploitation, and poaching for illegal wildlife trade; in Pakistan, the population density is estimated at 6–9 individuals per 135.32 km2 [23,25].
Species Distribution Models (SDMs) are critical tools for assessing habitat suitability under changing environmental conditions [26]. These models correlate species occurrence data with ecological variables to predict potential habitats using statistical and machine-learning algorithms [27,28]. Common SDM approaches include Maximum Entropy (MaxEnt), Generalized Linear Models (GLMs), Random Forests (RFs), GARP, and BIOCLIM [29]. While MaxEnt is particularly effective for rare species like the common leopard due to its ability to handle small sample sizes and complex environmental relationships [30,31,32], RF offers distinct advantages for habitat modelling in heterogeneous landscapes like AJ and K. The RF algorithm, an ensemble machine learning method, excels at handling high-dimensional datasets by constructing multiple decision trees and aggregating their predictions [33]. This method is especially effective at identifying nonlinear connections between environmental factors and automatically determining their significance [34], which makes it ideal for examining the intricate interactions among terrain, vegetation, and human-related elements that influence species distribution [35]. Environmental factors affect leopard distribution in various ways across different regions. Previous studies have analyzed habitat suitability in specific areas using anthropogenic factors and the MaxEnt model [36]. For instance, researchers have utilized MaxEnt to evaluate potential leopard habitats by considering elevation, road density, settlement density, and land cover [31,37]. Furthermore, some studies have investigated the influence of forest type, prey availability, terrain ruggedness, and human activity on leopard presence [6,38,39,40]. For accurate habitat predictions, it is crucial to select environmental variables based on regional conditions [26]. However, limited research systematically analyses how different factors shape leopard distribution. Therefore, further studies are needed to monitor leopard potential habitat and evaluate the environmental drivers affecting their survival and movement patterns.
This study employs an integrated modelling approach combining Maximum Entropy (MaxEnt) and Random Forest (RF) methods with multi-source remote sensing data and verified leopard presence records across Azad Jammu and Kashmir (AJ and K) to assess habitat suitability. The research addresses four primary objectives: (1) to model the spatial distribution of the common leopard (P. pardus) throughout AJ and K’s diverse landscapes; (2) to identify key habitat factors driving leopard distribution patterns and quantify their relative ecological importance; (3) to evaluate the predictive performance of both MaxEnt and RF approaches in identifying suitable leopard habitats; and (4) to delineate and map priority conservation areas supporting viable leopard populations in the region. These findings will provide wildlife managers and policymakers with critical tools for proactive conservation planning and habitat protection strategies for the common leopard.

2. Materials and Methods
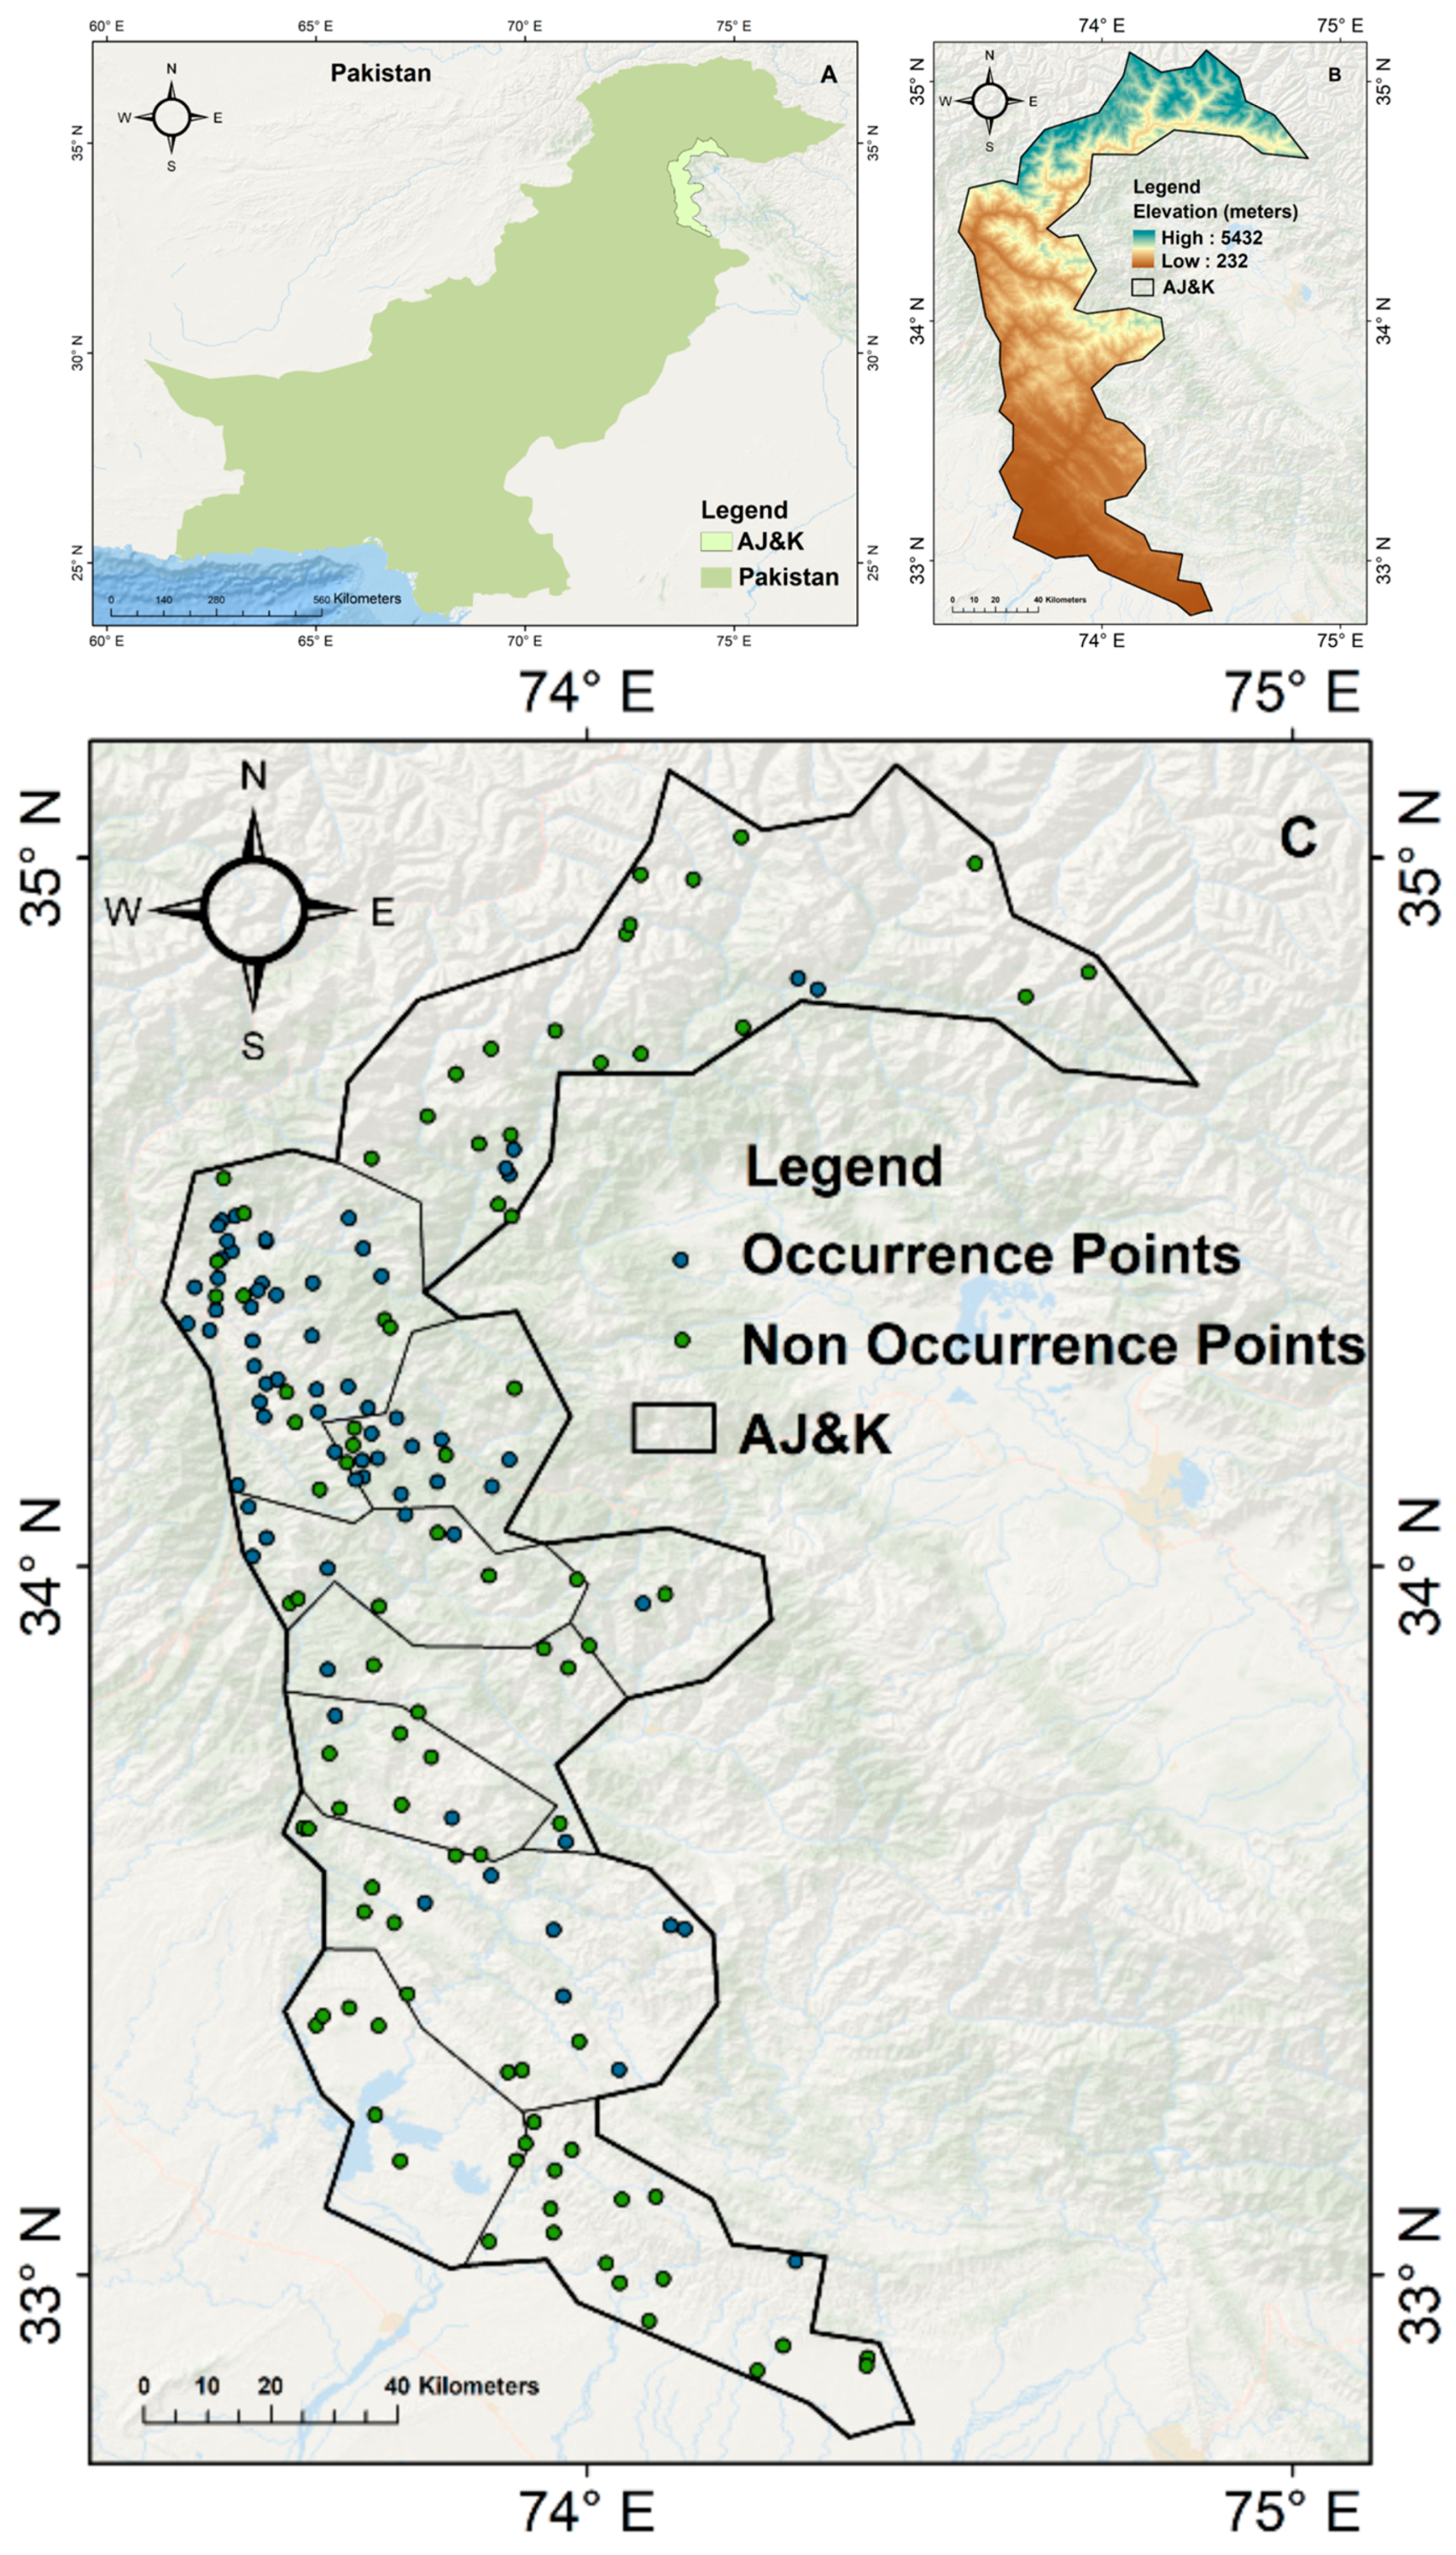
2.1. Study Area

Azad Jammu and Kashmir (AJ and K), located in the northern part of Pakistan (32–36° N, 73–75° E), encompasses a rugged, mountainous landscape spanning approximately 13,297 km2 [41]. The region is part of the broader Himalayan biodiversity hotspot, having 71 species of mammals and is characterized by dramatic elevation gradients (232–5432 m above sea level; Figure 1B), fostering diverse ecosystems ranging from subtropical broadleaf forests to alpine meadows [42,43]. Administratively divided into ten districts (Figure 1A), AJK exhibits distinct geographic zones: the relatively flat southern districts (Bhimber, Mirpur, Kotli) contrast sharply with the rugged northern districts (Poonch, Bagh, Muzaffarabad, Haveli, Hattian, Sudhnoti, Neelum) dominated by high mountain peaks [44]. Climatic conditions range from dry subtropical in the south (summer temperatures reaching 45 °C) to moist temperate in the north (winter averages of 4–7 °C), with annual precipitation varying between 1000 and 2000 mm [45]. The Jhelum, Neelum, and Poonch river systems sustain agriculture on terraced slopes [46], while 20 protected areas—comprising 8 National Parks, 1 Wildlife Sanctuary, and 11 Game Reserves [47]—strive to conserve biodiversity amid growing environmental pressures.

2.2. Data Collection

Presence data for the common leopard (Panthera pardus) were systematically compiled across Azad Jammu and Kashmir (AJ and K) from 2018 to 2023 using an integrative, incident-driven and participatory approach. Rather than implementing predefined transect surveys, data collection was generated by reports of leopard-related incidents—primarily livestock depredation (goats, sheep, cattle) and retaliatory killings—gathered through local informants, field officers, and official records from the AJ and K Wildlife Department. Each incident report was cross-verified through multiple sources, including interviews with local herders, community elders, wildlife officials, and media reports to ensure data reliability. Only reports confirmed by at least two independent sources were retained. Field teams then visited these locations to conduct focused observations. At each site, the precise location of leopard occurrence was recorded using a handheld GPS device (GARMIN GPS MAP 72H) with ±7 m spatial accuracy. Indirect field signs including scat, pugmarks, scratch marks, and territorial markings were identified using established field protocols and illustrated guides during our field visit when conducted focused observations [48,49]. Observations were validated through consultation with local wildlife experts and community knowledge to reduce the risk of misidentification. Structured interviews were conducted with eyewitnesses and livestock owners to collect supplementary data on depredation events, retaliation, and historical sightings. Media reports, including local newspapers and online platforms, were reviewed to extract additional location-specific information and verify reported events [50]. This multi-year, cross-seasonal dataset resulted in the identification of 70 distinct, geo-referenced leopard presence points across diverse landscapes of AJ and K. This approach, though opportunistic, aligns with best practices for large carnivore surveys in resource-constrained, human-dominated landscapes, and provides a sufficiently accurate dataset for habitat suitability modelling [51,52].
Climatic variables included 19 bioclimatic parameters (Bio1–Bio19), sourced from WorldClim 2.1 (https://www.worldclim.org, accessed on 27 March 2024) at 1 km resolution. These variables were derived from long-term monthly temperature and precipitation records. Additionally, specific humidity data were obtained from the Famine Early Warning Systems Network (FEWS NET) Land Data Assimilation System (FLDAS) dataset, accessed via Google Earth Engine (29 March 2024) at an 11,132 km resolution.
Vegetation and land cover data were sourced from MODIS products. Fractional Vegetation Coverage (FVC) was calculated using the Normalized Difference Vegetation Index (NDVI) from the MOD13A2.061 product (1 km resolution, Google Earth Engine, accessed on 9 April 2024). The land cover classification was derived from the MCD12Q1.061 dataset (500 m resolution, Google Earth Engine, accessed on 25 March 2024).
Topographic variables, including elevation (Digital Elevation Model, DEM), were obtained from the GDEM V2 and V3 datasets (Geospatial Data Cloud: https://www.gscloud.cn, accessed on 23 March 2024), which provide higher accuracy than previous versions. Using ArcGIS spatial analyst tools, we processed the DEM to generate slope and aspect layers.
Anthropogenic factors, including distance to roads and population density data were sourced from The Humanitarian Data Exchange (https://data.humdata.org, accessed on 9 April 2025) at 1 km resolution. Hydrological factor, distance to rivers was extracted from the HYDROSHEDS database (https://www.hydrosheds.org, accessed on 25 March 2025) at an original resolution of 500 m and subsequently resampled to 1 km.
All datasets were standardized to a 1 km resolution to align with the bioclimatic variables, ensuring uniformity in spatial scale for model accuracy.

2.3. Data Analysis

The analytical framework for this study (Figure 2), involved a comprehensive approach to identifying key habitat predictors for the common leopard. We initiated the process by meticulously selecting ecologically relevant environmental variables from diverse data sources. These selections were further supplemented by field observations conducted within the leopard’s known distribution range. All spatial datasets were standardized using a Python-based geo-processing script in ArcGIS 10.8 to ensure uniformity and comparability, aligning coordinate systems and spatial resolutions. Environmental variables were obtained or resampled to a 1 km2 resolution through nearest-neighbor interpolation, maintaining consistency across datasets. A Pearson correlation analysis was then conducted to identify the most significant habitat predictors for common leopard distribution, eliminating redundant variables while retaining 28 ecologically meaningful factors. Habitat suitability modelling was subsequently performed using two robust algorithms: Maximum Entropy (MaxEnt) and Random Forest (RF). The performance of these models was rigorously evaluated through Receiver Operating Characteristic (ROC) curves and the Area under the Curve (AUC) metric. Following the modelling process, a classification was executed to delineate suitable habitat areas. Finally, a variable contribution analysis was conducted to determine each environmental factor’s relative importance in shaping the leopard’s distribution patterns across the study landscape.

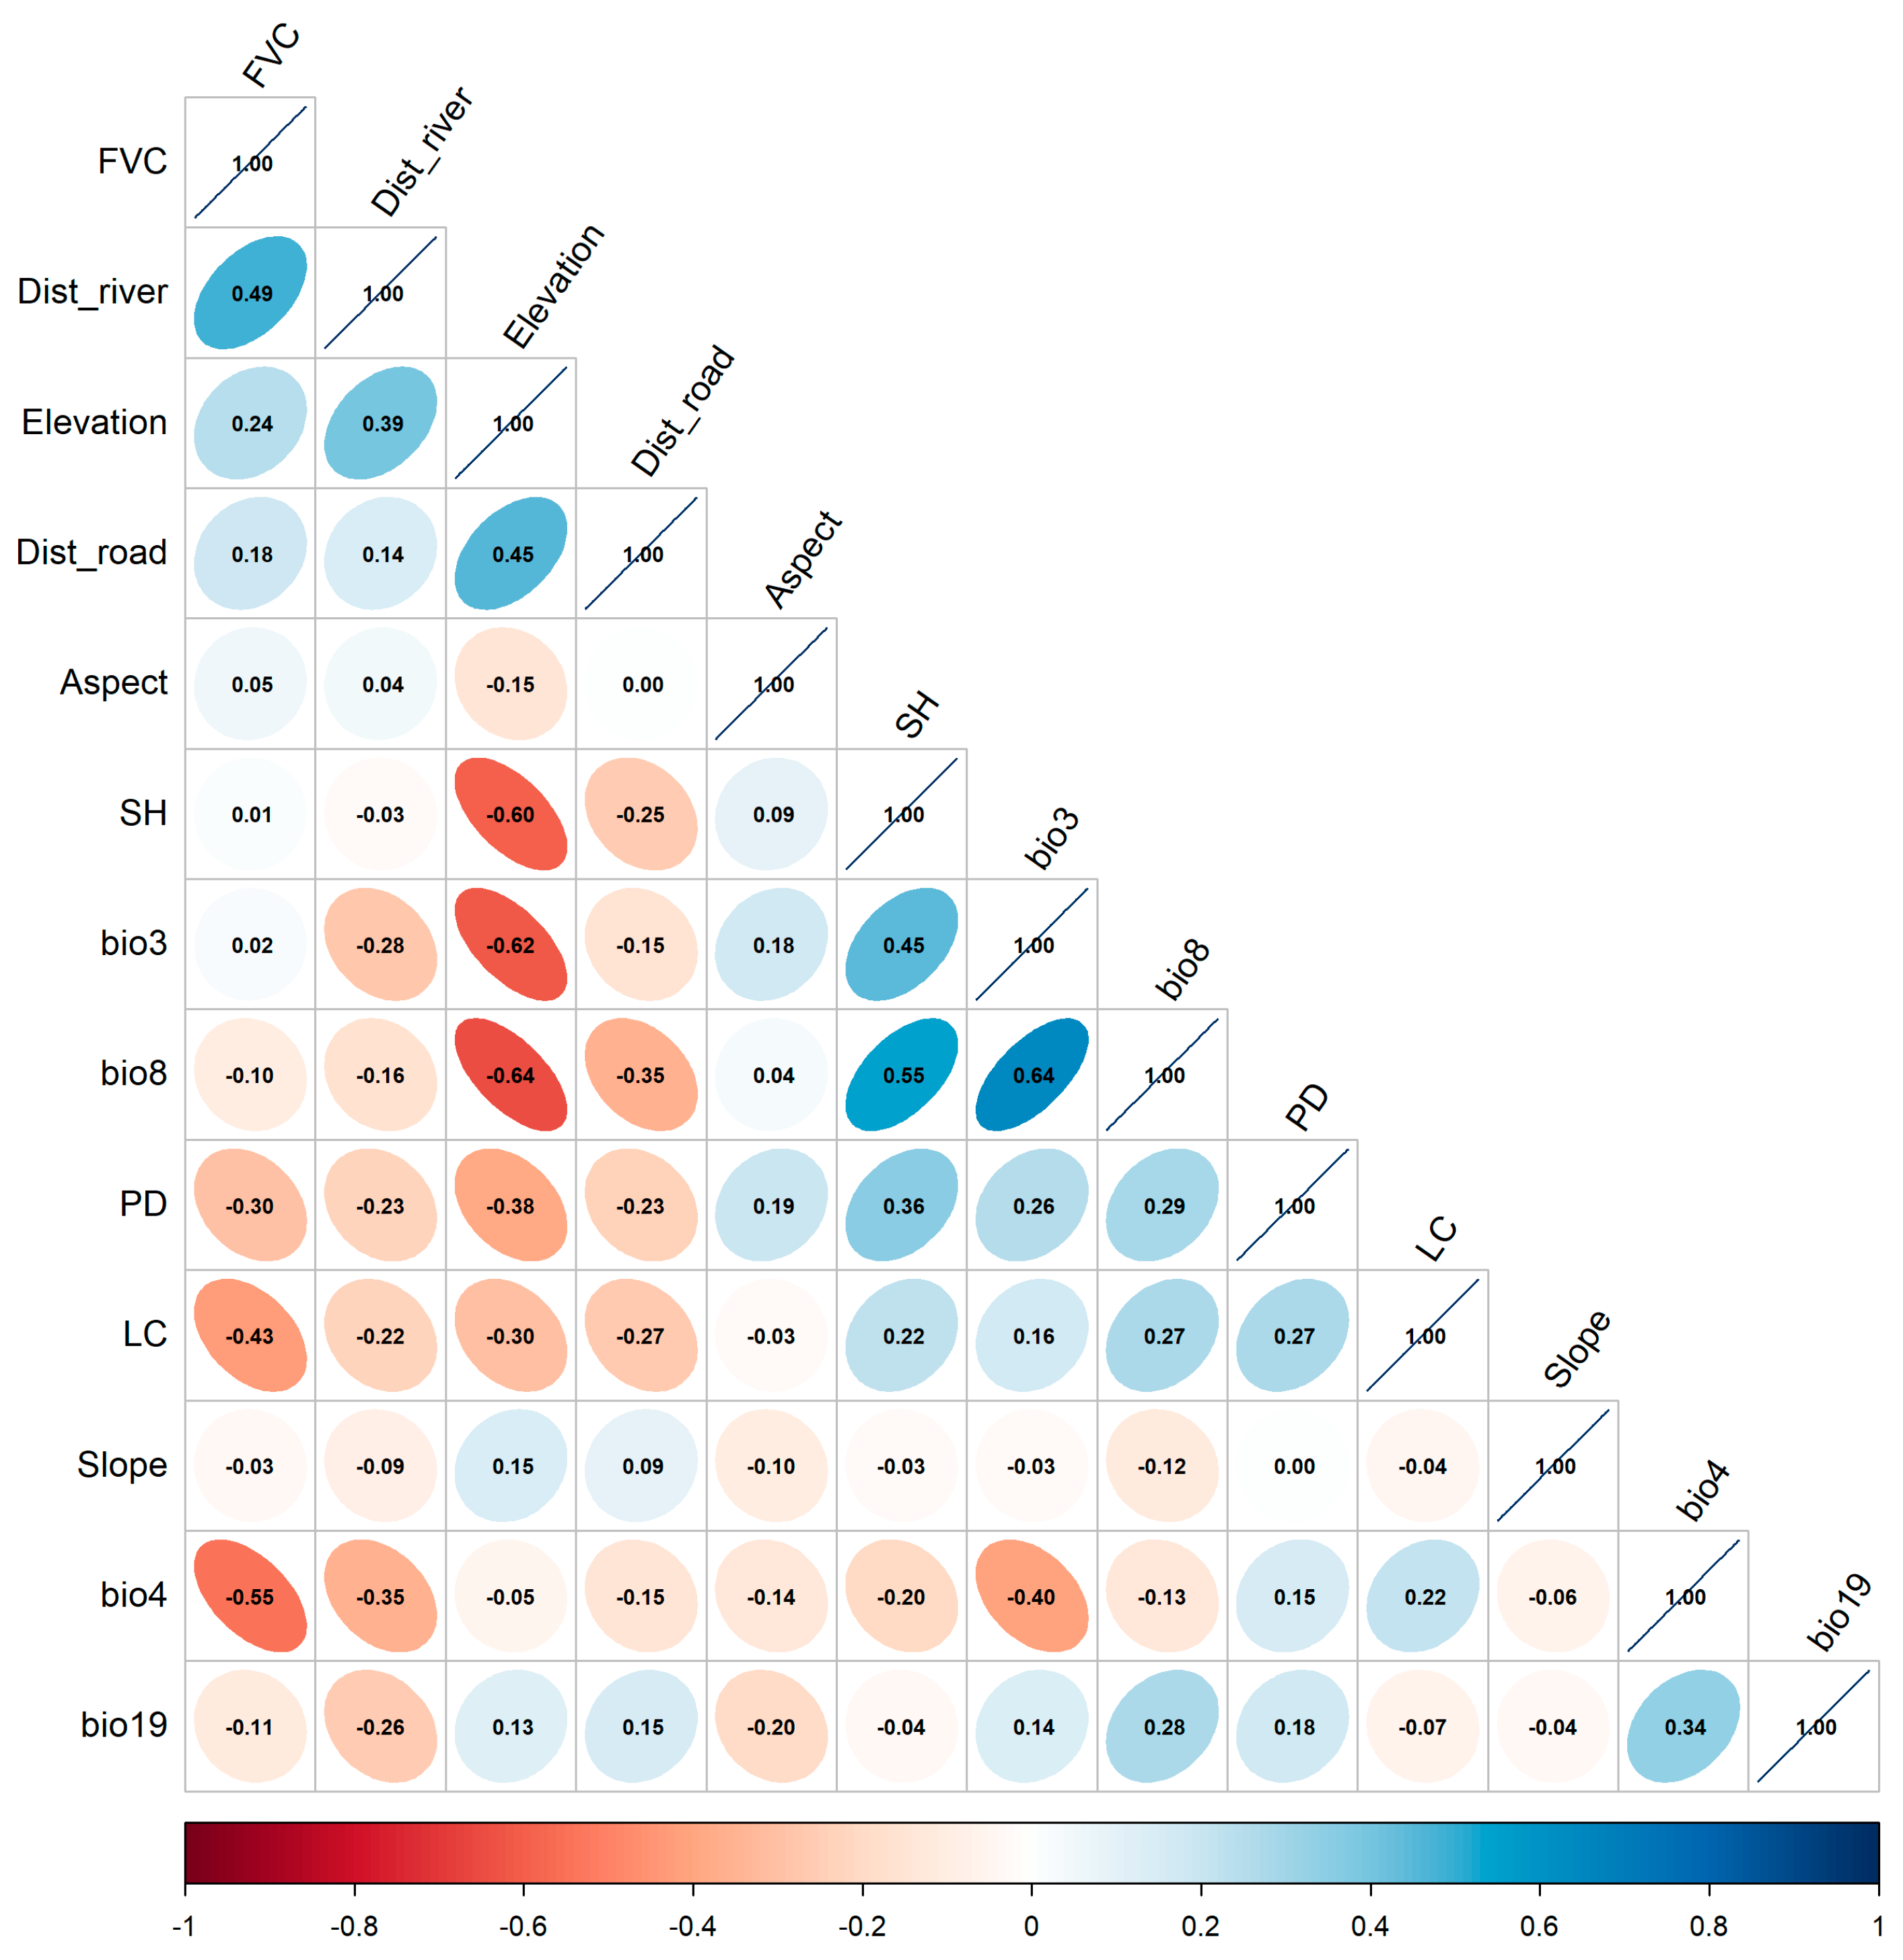
2.4. Screening of Environmental Factors

To mitigate multicollinearity effects that could compromise model performance [53], we conducted comprehensive correlation diagnostics using R’s corrplot package, generating a full correlation matrix of all candidate environmental variables. Applying a conservative threshold (|r| < 0.7) based on Pearson’s correlation coefficient [54], we systematically excluded intercorrelated predictors while preserving ecologically meaningful covariates. Among the 28 factors (Table 1), 13 factors were selected for Analysis: climatic variables (Bio3, Bio4, Bio8, Bio19, specific humidity [SH]); vegetation metrics (Fractional Vegetation Cover [FVC]); topographic features (Elevation, Slope, Aspect); land cover (LC); and anthropogenic factors (Distance to Roads [Dist_road], Distance to Rivers [Dist_river], Population Density [PD]).

2.5. Approach to Delineating Potential Leopard Habitats

2.5.1. MaxEnt Approach

This powerful machine-learning approach utilizes presence-only occurrence records and environmental covariates to optimize probabilistic habitat suitability maps through maximum entropy [53]. The MaxEnt algorithm, based on information theory, estimates probability distributions by maximizing entropy (uncertainty), subject to environmental constraints [30]. This approach yields the most probable distribution given available data while avoiding unsupported assumptions. The mathematical formulation follows [55]:
P w ( y | x ) = 1 Z w ( x ) e x p ( i = 1 n w i f i ( x , y ) )
Z w ( x ) = y e x p ( i = 1 n w i f i ( x , y ) )
where x represents environmental predictors, y indicates leopard occurrence locations, f i ( x , y ) are feature functions, w i are feature weights, n represents the number of datasets, and P w ( y | x ) estimates the occurrence probability of leopard. We implemented a bootstrapping procedure with 50 iterations to ensure model robustness, randomly partitioning data into training (70%) and testing (30%) subsets while maintaining spatial stratification. All model parameters remained at default settings unless otherwise specified. We evaluated predictive performance through receiver operating characteristic (ROC) analysis, calculating the Area under the curve (AUC) as a threshold-independent accuracy metric. Permutation tests assessed variable importance, with relative contributions expressed as percentage influences on model entropy.
The MaxEnt framework proved particularly suitable for our study due to its capacity to model complex species-environment relationships, effectiveness with limited occurrence records, the ability to incorporate diverse environmental covariates, and production of continuous, interpretable probability surfaces. It demonstrated reliability in ecological applications [27]. This methodology enabled a comprehensive habitat suitability assessment while accounting for potential spatial autocorrelation and sampling bias inherent in presence-only data. The MaxEnt software (version 3.4.1) is available at the American Museum of Natural History’s biodiversity informatics portal [https://biodiversityinformatics.amnh.org/open_source/maxent/] (accessed on 27 December 2024).

2.5.2. Random Forest (RF) Approach

This approach addresses limitations of single decision trees by introducing two key randomization techniques during model training: (1) bootstrap sampling of observations (bootstrapping) and (2) random feature subspace selection (feature bagging). The resulting model diversity effectively mitigates overfitting while capturing complex ecological relationships [34].
Our implementation specifically utilized 500 constituent decision trees (n_estimators = 500) with balanced class weighting to account for potential uneven class distributions in the occurrence data. This configuration optimizes model sensitivity to minority classes, a critical consideration in ecological datasets where presence points are often limited compared to background samples [35]. The ensemble prediction combines outputs from all individual trees through majority voting for classification tasks or averaging for probabilistic outputs, mathematically represented as [56]:
y ^ = 1 T t = 1 T h t ( x )
where y ^ is final predicted probability, T is the total number of trees, h t ( x ) is the prediction of the t-th tree.

3. Results

3.1. Habitat Suitability by the MaxEnt Approach

The analysis of habitat suitability for the common leopard (P. pardus) in Azad Jammu and Kashmir (AJ and K), Pakistan, using both Maximum Entropy (MaxEnt) and Random Forest (RF) modelling approaches, has yielded insightful results. The final maps (Figure 3) illustrate the spatial distribution of suitable habitats across the study area, categorized into three classes: less suitable, moderately suitable, and most suitable [27,57,58].
The MaxEnt model, known for its robustness with presence-only data, identified areas with varying degrees of habitat suitability. According to the model, 54% of the study area was classified as less suitable, 32% as moderately suitable, and 14% as most suitable—demonstrating a more refined distinction in habitat classes compared to RF. The model output (Figure 3A) reveals a clear north-to-south gradient in suitability, with the highest concentration of suitable habitat in the mountainous northern districts of Muzaffarabad, Hattian, Neelum, Bagh, Haveli, and Poonch. These regions are characterized by rugged terrain, dense forests, and minimal human disturbance, making them ideal for leopard persistence. Conversely, the southern parts of AJ and K, where human settlements and agricultural lands dominate, were predominantly classified as less suitable. This spatial overlap between low suitability zones and human activity highlights potential hotspots for human-leopard conflict, as leopards may venture into these areas due to habitat fragmentation or prey scarcity. Habitat fragmentation can lead to isolated patches of suitable habitat, forcing leopards to move through less suitable areas, including those near human settlements, in search of prey or mates. Additionally, prey species may also be forced into these less suitable areas due to habitat loss, attracting leopards to follow. While the overall occurrence probability of leopards in these areas is low, the need for movement between patches can increase the likelihood of encounters with humans.

3.2. Habitat Suitability by the RF Approach

The Random Forest (RF) model, while effective in handling complex variable interactions, produced a slightly less precise suitability map (Figure 3B). It classified 53% of the area as less suitable, 30% as moderately suitable, and 17% as most suitable, showing a broader distribution of highly suitable zones—a possible indication of overfitting. Unlike the MaxEnt model, the RF map shows a more subtle patch structure rather than a distinct north-to-south gradient, with the most suitable habitats scattered across Muzaffarabad, Hattian, Bagh, Haveli, Poonch, Sudhnutti, and Kotli. However, MaxEnt’s results were more ecologically coherent, particularly in aligning with known leopard preferences for undisturbed forested areas. The RF model’s inclusion of marginally suitable zones in the central highlands (e.g., Sudhnutti and Kotli) suggests higher fragmentation, which could increase encounter rates between leopards and humans. This reinforces the need for targeted conflict mitigation in transitional zones between suitable habitats and human-dominated landscapes.

3.3. Algorithm Performance Comparison

Receiver Operating Characteristic (ROC) curve analysis revealed distinct predictive capabilities between the two modelling approaches (Figure 4). MaxEnt demonstrated superior performance (AUC = 0.912), indicating excellent habitat discrimination, while Random Forest showed good predictive ability (AUC = 0.827). The notable 0.085 difference in AUC values suggests MaxEnt’s presence-only modelling framework better captures the ecological relationships governing leopard distribution in our study area. RF’s slightly lower performance, while still reliable, likely reflects its different handling of environmental variables and greater sensitivity to parameter optimization. These results emphasize how algorithm selection significantly influences habitat suitability predictions for wide-ranging carnivores, with MaxEnt proving particularly effective for this conservation application.

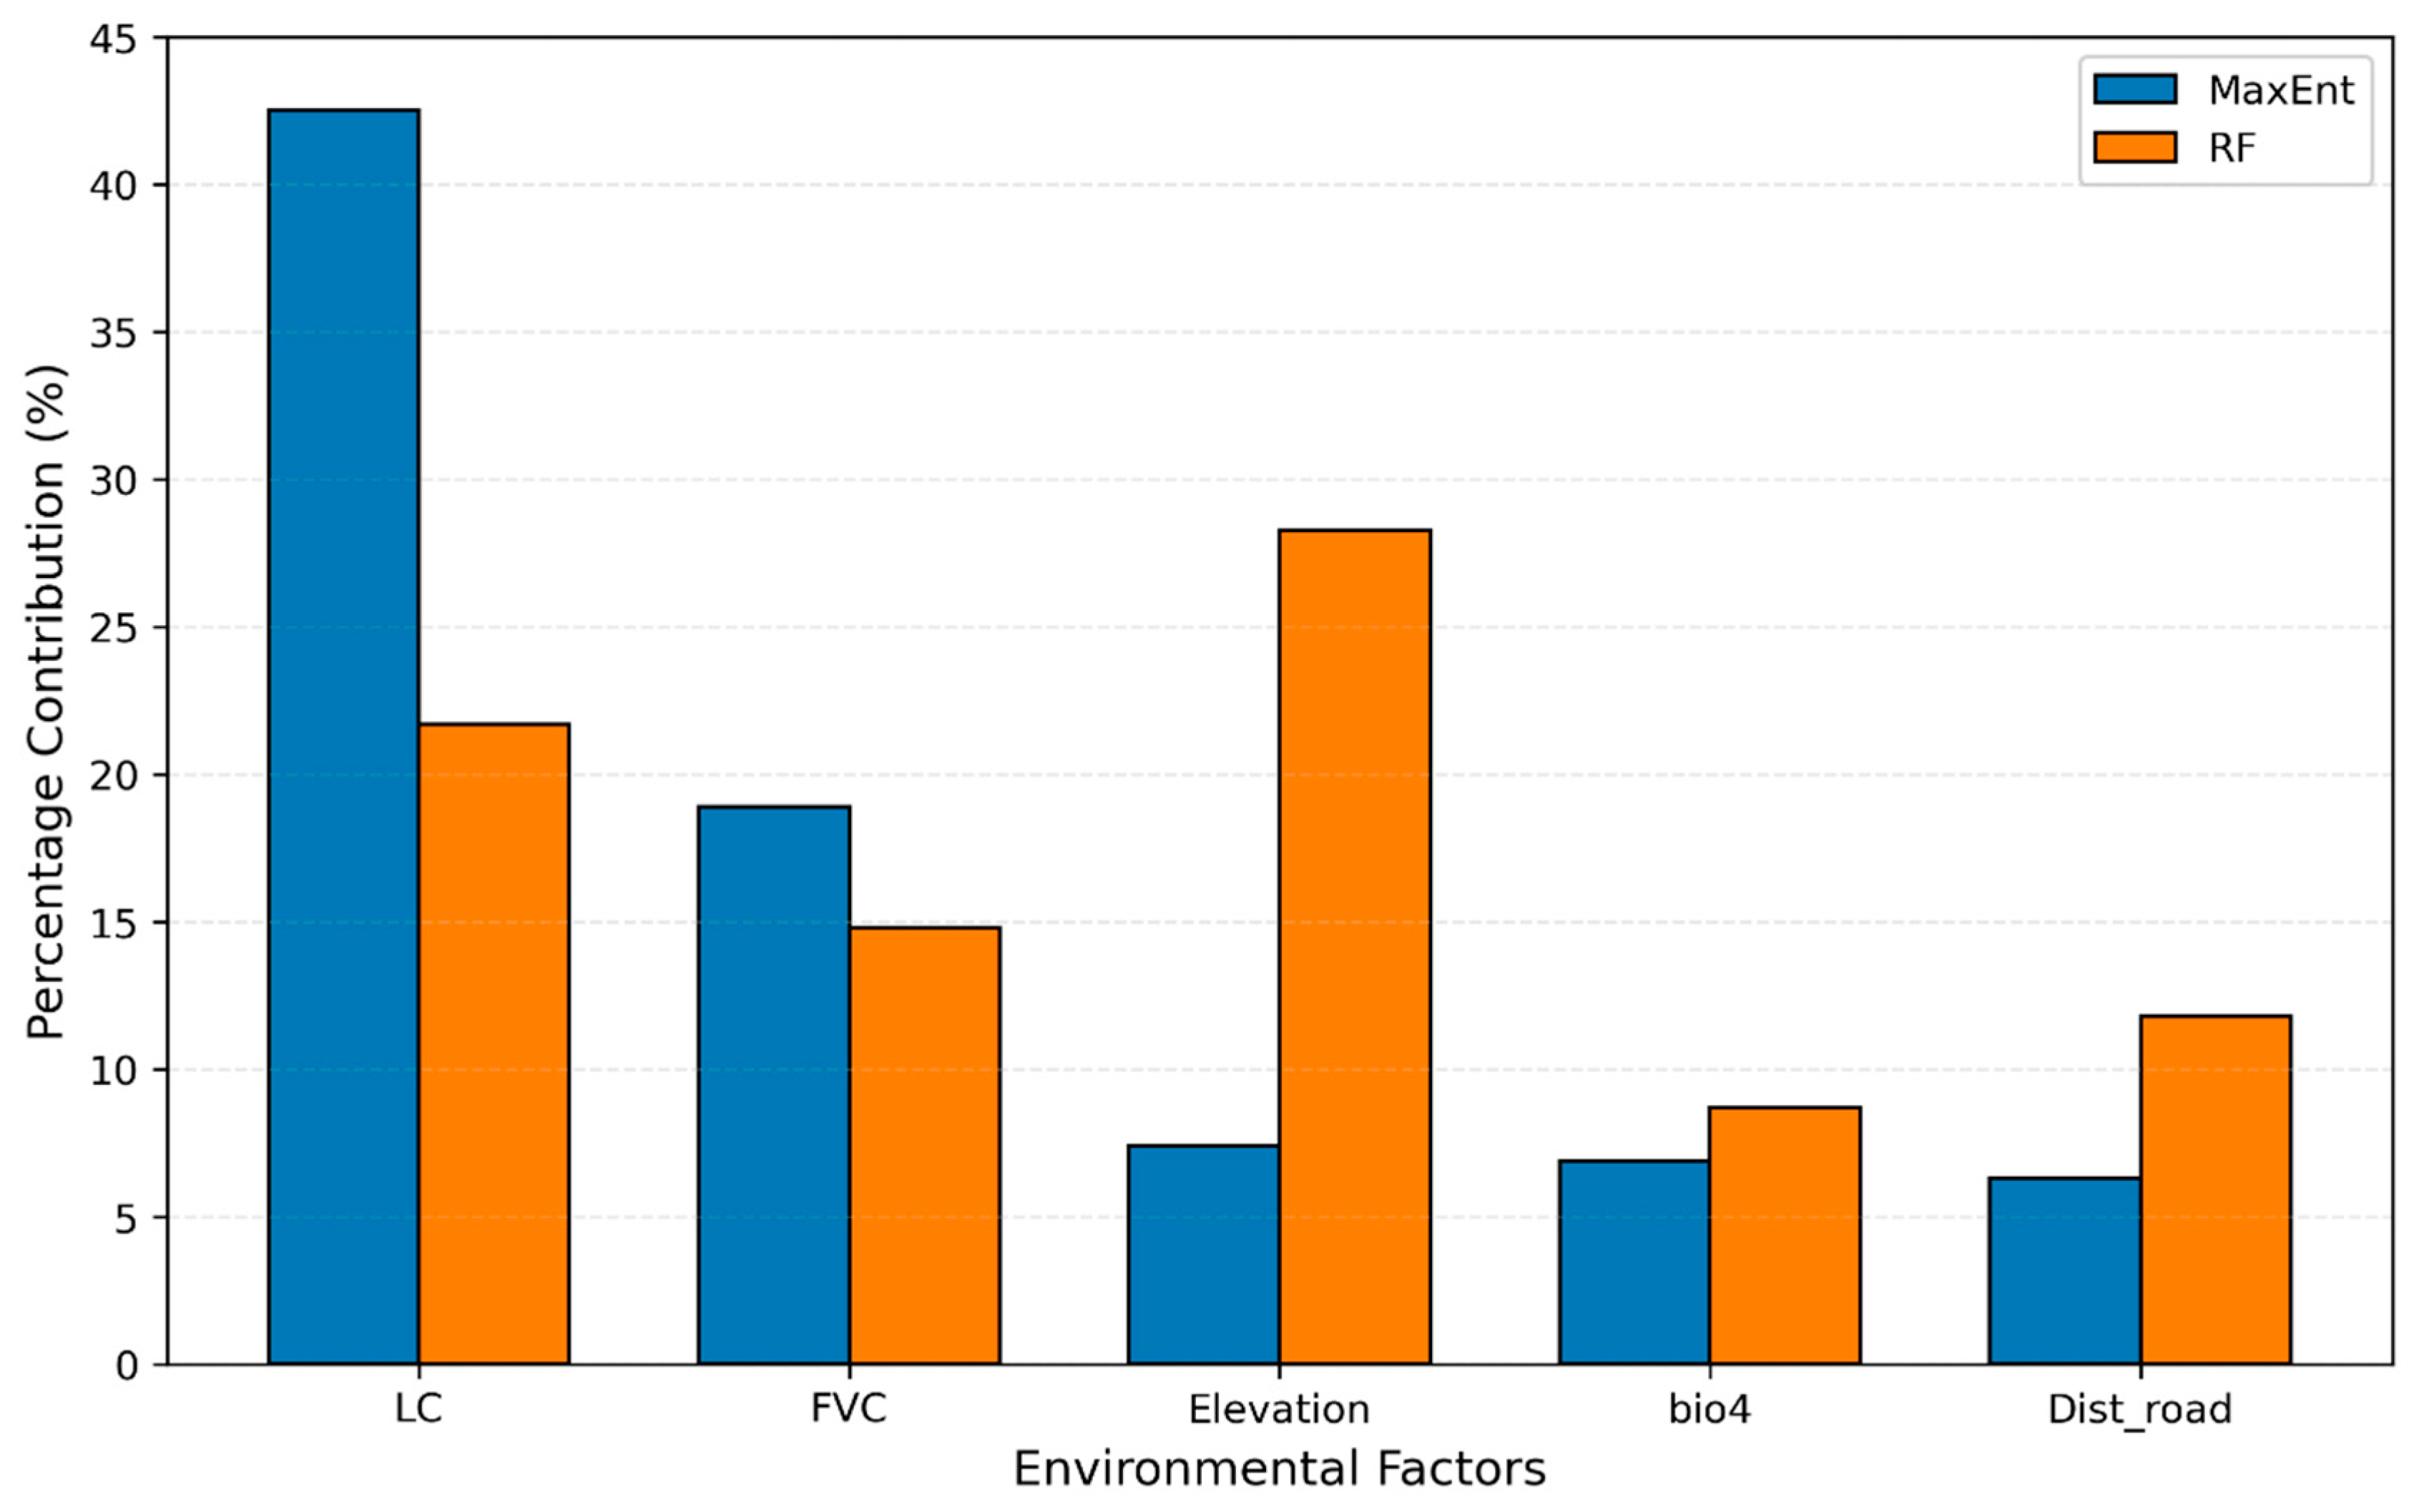
3.4. Relative Contribution and Influence of Habitat Predictors

To minimize multicollinearity effects, our final analysis retained only predictor variables exhibiting Pearson’s correlation coefficients <0.7 (Figure 5). The analysis identified five key variables with the strongest influence on leopard occurrence in AJ and K across both modelling approaches: Land Cover (LC), Fractional Vegetation Cover (FVC), Elevation, Temperature Seasonality (bio4), and Distance to Roads (Dist_road) (Figure 6). While these factors demonstrated consistent predictive importance in both models, their relative contributions varied significantly between methods. In the Maxent model, LC showed the highest contribution (42.5%), followed by FVC (18.9%), Elevation (7.4%), bio4 (6.95%), and Dist_road (6.3%). The Random Forest model produced a different weighting pattern, with Elevation emerging as the most influential factor (28.3%), followed by LC (21.7%), Dist_road (11.8%), FVC (14.8%), and bio4 (8.7%). These differential weightings between modelling approaches are visually presented in Figure 6.
According to the MaxEnt, the leopard shows maximum habitat suitability in densely vegetated areas (FVC > 0.7), particularly forests, thickets, and shrublands that provide optimal cover and hunting opportunities. Elevation analysis revealed peak suitability in mid-altitude ranges (1000–3000 m), with the most favorable conditions occurring at approximately 2000 m elevation, corresponding to temperate forest ecosystems and rugged terrain features. Temperature seasonality (bio4) significantly influenced habitat selection, with optimal conditions occurring in areas with moderate seasonal variation (bio4 7–8 °C). These zones likely support stable prey populations and consistent resource availability, typical of deciduous forests and savanna-woodland ecotones. Notably, habitat suitability decreased substantially in areas with either low seasonality (bio4 < 7 °C), such as equatorial rainforests, or high seasonality (bio4 > 8 °C) characterized by extreme temperature fluctuations. The analysis revealed a pronounced negative relationship between road proximity and habitat suitability. Leopards exhibited significantly lower suitability scores near roads, with optimal conditions only occurring beyond 0.08 km from roadways. This pattern suggests strong avoidance behavior, likely driven by multiple disturbance factors, including noise pollution, vehicular traffic, and increased human activity. The most dramatic improvement in habitat quality occurred within the 0.04–0.08 km buffer zone, indicating a critical threshold distance for minimizing anthropogenic impacts.
The land cover assessment revealed four key habitat types supporting leopard persistence in the study area. Mixed forests emerged as the most suitable habitat (suitability index = 0.83), characterized by a balanced deciduous-evergreen composition (40–60% each) and dense canopy cover (>60% at >2 m height). This was followed by cropland-natural vegetation mosaics (0.71), where small-scale cultivation (40–60%) coexists with natural woody and herbaceous vegetation. Woody savannas (30–60% tree cover at >2 m) showed moderate suitability (0.67), while savannas (10–30% tree cover) represented marginal habitat (0.39). The descending suitability gradient from mixed forests to savannas underscores the leopard’s dependence on structurally complex vegetation that provides adequate cover and hunting opportunities (Table 2).

4. Discussion

Our study provides critical insights into the habitat suitability and conservation needs of the critically endangered common leopard (P. pardus) in Azad Jammu and Kashmir (AJ and K), Pakistan. The integrated modelling approach combining Maximum Entropy (MaxEnt) and Random Forest (RF) algorithms revealed several key findings with important implications for leopard conservation in this Himalayan region.
The habitat suitability models consistently identified land cover (LC), fractional vegetation cover (FVC), elevation, temperature seasonality (bio4), and distance to roads as the most influential factors determining leopard distribution. The strong preference for mixed forests (suitability index = 0.83) with dense canopy cover (>60%) confirms the species’ reliance on structurally complex vegetation for hunting and refuge [32]. Interestingly, the moderate suitability of cropland-vegetation mosaics (0.71) demonstrates leopards’ behavioral plasticity in utilizing human-modified landscapes, a phenomenon also observed in other Asian populations [59,60]. The elevation analysis revealed optimal habitat conditions between 1000 and 3000 m, consistent with leopard distribution patterns throughout northern Pakistan [31,61]. This mid-altitude zone likely provides an optimal balance of prey availability, thermal cover, and reduced human disturbance. Temperature seasonality (bio4 = 7–8 °C) emerged as another critical factor, potentially influencing habitat quality through its effects on prey populations and vegetation phenology [62]. The pronounced avoidance of areas near roads (<0.08 km) underscores the significant impact of anthropogenic disturbance on leopard habitat selection [63], creating potential ecological traps in fragmented landscapes [64].
Our findings highlight four critical interventions for leopard conservation in Azad Jammu and Kashmir. First, core habitats in the northern districts (Muzaffarabad, Hattian) require enhanced protection through increased patrolling, anti-poaching measures, and community-based monitoring, as these areas exhibit the highest habitat suitability and are vital for population persistence [5]. Similar strategies have proven effective for other large felids, such as tigers (Panthera tigris) in Nepal, where protected areas with community engagement have significantly reduced poaching and habitat encroachment [65]. Second, restoring habitat connectivity in the fragmented southern landscapes, particularly in the central highlands, is essential to maintain ecological corridors and mitigate genetic isolation [66]. This aligns with studies on snow leopards (Panthera uncia) in the Himalayas, where habitat corridors have been prioritized to counteract fragmentation caused by human activities [67]. Third, targeted conflict mitigation strategies—including community-led early warning systems, livestock insurance programs, and predator-proof corrals—should be prioritized in transitional zones to reduce human-leopard encounters, an approach proven to decrease retaliatory killings by up to 63% in similar regions [68,69]. Comparable measures have successfully reduced human-lion (Panthera leo) conflicts in Africa, where compensation programs and community involvement have lowered predation rates and improved coexistence [70]. Finally, habitat suitability maps must inform land-use policies to prevent further fragmentation, with strict regulations on infrastructure development near critical habitats [71,72] and enforced buffer zones along high-risk roads, which are known to increase leopard mortality by 40% when constructed within 1 km of core habitats [73]. Together, these measures provide a comprehensive framework for balancing ecological preservation and sustainable development in AJ and K.
While our integrated modelling framework advances leopard conservation planning in AJ and K, we recognize several opportunities for refinement. First, our analysis used current climatic conditions without accounting for projected climate change impacts, which may alter temperature seasonality (bio4) and shift elevation habitat suitability in the Himalayas. Second, combining MaxEnt’s presence-only data with Random Forest’s generated pseudo-absences could be enhanced through systematic camera-trap monitoring and ground-validated absence records. Third, the absence of prey density data represents a critical knowledge gap for understanding habitat carrying capacity. Additionally, we acknowledge that forest cover alone is unlikely to be the best proxy for good habitat, as understory and ground cover are also essential for stalking predators such as leopards to hunt successfully. Future studies should integrate CMIP6 climate projections with prey monitoring to assess long-term habitat viability under changing environmental conditions. We recommend incorporating detailed vegetation structure data to better capture the complexities of leopard habitat requirements. Despite these limitations, our models provide a robust baseline for identifying priority habitats and could play a key role in developing climate-adaptive management strategies to mitigate future impacts on leopards in this vulnerable Himalayan ecosystem.

5. Conclusions

This work advances leopard conservation in AJ and K, Pakistan, through a comprehensive habitat suitability assessment using complementary MaxEnt and RF frameworks. The results demonstrate that land cover, fractional vegetation cover, elevation, temperature seasonality, and distance to roads are the most influential factors shaping leopard distribution. Leopards in this region prefer mixed forests at elevations between 1000 and 3000 m, as evidenced by a suitability index of 0.83. Conversely, areas with road proximity less than 0.08 km, low elevation zones below 1000 m, high temperature seasonality (bio4 > 8 °C), and non-forested land cover types are identified as unsuitable for leopards.
The MaxEnt model demonstrated superior habitat prediction accuracy compared to the Random Forest model, with an AUC score of 0.912 versus 0.827. The analysis reveals a distinct north-to-south gradient in habitat suitability, with optimal habitats concentrated in the northern districts of Muzaffarabad, Hattian, Neelum, Bagh, Haveli, Poonch, and Sudhnutti. In contrast, the southern areas, which are more human-dominated, exhibit declining suitability for leopards. These findings underscore the urgent need for targeted conservation strategies, particularly in the northern high-suitability zones, to mitigate the escalating threats of habitat fragmentation and climate change. Future conservation strategies should focus on preserving mixed forests and establishing buffer zones around roads to ensure the long-term survival of the common leopard in this region. By addressing these critical factors, we can contribute to the sustainable conservation of this species and its habitat.

Author Contributions

Z.D.: Writing–review and editing, Writing–original draft, Visualization, Methodology, Validation, Formal analysis, Data curation. W.H.: Writing–review and editing, Supervision, Funding acquisition. R.A.: Writing–review and editing, Methodology, Validation, Conceptualization, Formal analysis. Z.K.: Writing–review and editing, Visualization. All authors have read and agreed to the published version of the manuscript.

Funding

This work was supported by National Natural Science Foundation of China (42471369), The Project of Northern Agriculture and Livestock Husbandry Technical Innovation Center, Chinese Academy of Agricultural Sciences (BFGJ2022002), and Fengyun Application Pioneering Project (FY-APP-2022.0306).

Data Availability Statement

The authors do not have permission to share data.

Conflicts of Interest

The authors declare no conflicts of interest.

References

  1. Sheehy, J.; Taylor, C.M.; McCann, K.S.; Norris, D.R. Optimal Conservation Planning for Migratory Animals: Integrating Demographic Information across Seasons. Conserv. Lett. 2010, 3, 192–202. [Google Scholar] [CrossRef]
  2. Aryal, A.; Raubenheimer, D.; Sathyakumar, S.; Poudel, B.S.; Ji, W.; Kunwar, K.J.; Kok, J.; Kohshima, S.; Brunton, D. Conservation strategy for brown bear and its habitat in Nepal. Diversity 2012, 4, 301–317. [Google Scholar] [CrossRef]
  3. Andreychev, A.V.; Zhalilov, A.B.; Kuznetsov, V.A. The state of local steepe woodchuck (Marmota bobak) populations in the Republic of Mordovia. Zool. Zhurnal 2015, 94, 723–730. [Google Scholar] [CrossRef]
  4. Awan, M.N.; Yaqub, A.; Kamran, M. Survey of Human-Leopard (Panthera pardus) Conflict in Ayubia National Park, Pakistan. J. Bioresour. Manag. 2020, 7, 39–46. [Google Scholar] [CrossRef]
  5. Kabir, M.; Ghoddousi, A.; Awan, M.S.; Awan, M.N. Assessment of Human–Leopard Conflict in Machiara National Park, Azad Jammu and Kashmir, Pakistan. Eur. J. Wildl. Res. 2014, 60, 291–296. [Google Scholar] [CrossRef]
  6. Carter, N.; Jasny, M.; Gurung, B.; Liu, J. Impacts of People and Tigers on Leopard Spatiotemporal Activity Patterns in a Global Biodiversity Hotspot. Glob. Ecol. Conserv. 2015, 3, 149–162. [Google Scholar] [CrossRef]
  7. Muleta Gurmessa, M.; Badasa Moisa, M.; Jira Tesso, G.; Geleta Erena, M. Impacts of Land Use Land Cover Change on Leopard (Panthera pardus) Habitat Suitability and Its Effects on Human Wildlife Conflict in Hirkiso Forest, Sibu Sire District, Western Ethiopia. All Earth 2024, 36, 1–24. [Google Scholar] [CrossRef]
  8. Lovari, S.; Ventimiglia, M.; Minder, I. Food Habits of Two Leopard Species, Competition, Climate Change and Upper Treeline: A Way to the Decrease of an Endangered Species? Ethol. Ecol. Evol. 2013, 25, 305–318. [Google Scholar] [CrossRef]
  9. Zahoor, B.; Liu, X.; Ahmad, B.; Kumar, L.; Songer, M. Impact of Climate Change on Asiatic Black Bear (Ursus thibetanus) and Its Autumn Diet in the Northern Highlands of Pakistan. Glob. Change Biol. 2021, 27, 4294–4306. [Google Scholar] [CrossRef]
  10. Li, J.; Xue, Y.; Hacker, C.E.; Zhang, Y.; Li, Y.; Cong, W.; Jin, L.; Li, G.; Wu, B.; Li, D.; et al. Projected Impacts of Climate Change on Snow Leopard Habitat in Qinghai Province, China. Ecol. Evol. 2021, 11, 17202–17218. [Google Scholar] [CrossRef]
  11. Li, J.; McCarthy, T.M.; Wang, H.; Weckworth, B.V.; Schaller, G.B.; Mishra, C.; Lu, Z.; Beissinger, S.R. Climate Refugia of Snow Leopards in High Asia. Biol. Conserv. 2016, 203, 188–196. [Google Scholar] [CrossRef]
  12. Poudel, S.; Twining, J.P.; Stedman, R.C.; Ghimire, S.K.; Fuller, A.K. Ecological and Anthropogenic Drivers of Leopard (Panthera pardus fusca) Attack Occurrence on Humans in Nepal. People Nat. 2023, 5, 1977–1988. [Google Scholar] [CrossRef]
  13. Naha, D.; Dash, S.K.; Chettri, A.; Chaudhary, P.; Sonker, G.; Heurich, M.; Rawat, G.S.; Sathyakumar, S. Landscape Predictors of Human–Leopard Conflicts within Multi-Use Areas of the Himalayan Region. Sci. Rep. 2020, 10, 11129. [Google Scholar] [CrossRef] [PubMed]
  14. Nyhus, P.J. Human–Wildlife Conflict and Coexistence. Annu. Rev. Environ. Resour. 2016, 41, 143–171. [Google Scholar] [CrossRef]
  15. Treves, A.; Karanth, K.U. Human-Carnivore Conflict and Perspectives on Carnivore Management Worldwide. Conserv. Biol. 2003, 17, 1491–1499. [Google Scholar] [CrossRef]
  16. Redpath, S.M.; Young, J.; Evely, A.; Adams, W.M.; Sutherland, W.J.; Whitehouse, A.; Amar, A.; Lambert, R.A.; Linnell, J.D.C.; Watt, A.; et al. Understanding and Managing Conservation Conflicts. Trends Ecol. Evol. 2013, 28, 100–109. [Google Scholar] [CrossRef] [PubMed]
  17. Lynam, A.J.; Rabinowitz, A.; Myint, T.; Maung, M.; Latt, K.T.; Po, S.H.T. Estimating Abundance with Sparse Data: Tigers in Northern Myanmar. Popul. Ecol. 2009, 51, 115–121. [Google Scholar] [CrossRef]
  18. Miller, J.R.B.; Jhala, Y.V.; Jena, J.; Schmitz, O.J. Landscape-scale Accessibility of Livestock to Tigers: Implications of Spatial Grain for Modeling Predation Risk to Mitigate Human–Carnivore Conflict. Ecol. Evol. 2015, 5, 1354–1367. [Google Scholar] [CrossRef]
  19. Patterson, B.D.; Kasiki, S.M.; Selempo, E.; Kays, R.W. Livestock Predation by Lions (Panthera leo) and Other Carnivores on Ranches Neighboring Tsavo National ParkS, Kenya. Biol. Conserv. 2004, 119, 507–516. [Google Scholar] [CrossRef]
  20. Miller, J.R.B. Mapping Attack Hotspots to Mitigate Human–Carnivore Conflict: Approaches and Applications of Spatial Predation Risk Modeling. Biodivers. Conserv. 2015, 24, 2887–2911. [Google Scholar] [CrossRef]
  21. Ebrahimi, A.; Farashi, A.; Rashki, A. Habitat Suitability of Persian Leopard (Panthera pardus saxicolor) in Iran in Future. Environ. Earth Sci. 2017, 76, 697. [Google Scholar] [CrossRef]
  22. Rostro-García, S.; Kamler, J.F.; Ash, E.; Clements, G.R.; Gibson, L.; Lynam, A.J.; McEwing, R.; Naing, H.; Paglia, S. Endangered Leopards: Range Collapse of the Indochinese Leopard (Panthera pardus delacouri) in Southeast Asia. Biol. Conserv. 2016, 201, 293–300. [Google Scholar] [CrossRef]
  23. Kabir, M.; Awan, M.S.; Anwar, M. Distribution Range and Population Status of Common Leopard (Panthera pardus) in and Around Machiara National Park, Azad Jammu and Kashmir. Int. J. Conserv. Sci. 2013, 4, 107. [Google Scholar]
  24. Stein, A.B.; Athreya, V.; Gerngross, P.; Balme, G.; Henschel, P.; Karanth, U.; Miquelle, D.; Rostro-Garcia, S.; Kamler, J.F.; Laguardia, A.; et al. The IUCN Red List of Threatened Species; E.T15954A163991139; International Union for Conservation of Nature (IUCN): Gland, Switzerland, 2020. [Google Scholar]
  25. Sheikh, M.K.; Molur, S. Status and Red List of Pakistan’s Mammals Based on the Pakistan Mammal Conservation Assessment & Management; Plan 312; IUCN Pakistan: Islamabad, Pakistan, 2004. [Google Scholar]
  26. Di Sora, N.; Mannu, R.; Rossini, L.; Contarini, M.; Gallego, D.; Speranza, S. Using Species Distribution Models (SDMs) to Estimate the Suitability of European Mediterranean Non-Native Area for the Establishment of Toumeyella parvicornis (Hemiptera: Coccidae). Insects 2023, 14, 46. [Google Scholar] [CrossRef]
  27. Ahmed, R.; Huang, W.; Dong, Y.; Guo, J.; Dildar, Z.; Rahman, Z.U.; Zhang, Y.; Zhang, X.; Du, B.; Yue, F. Assessment of Habitat Suitability for Oedaleus decorus asiaticus Using MaxEnt and Frequency Ratio Model in Xilingol League, China. Remote Sens. 2025, 17, 846. [Google Scholar] [CrossRef]
  28. Elith, J.; Leathwick, J.R. Species Distribution Models: Ecological Explanation and Prediction Across Space and Time. Annu. Rev. Ecol. Evol. Syst. 2009, 40, 677–697. [Google Scholar] [CrossRef]
  29. Elith, J.; Graham, C.P.H.; Anderson, R.; Dudík, M.; Ferrier, S.; Guisan, A.; Hijmans, R.J.; Huettmann, F.; Leathwick, J.R.; Lehmann, A.; et al. Novel Methods Improve Prediction of Species’ Distributions from Occurrence Data. Ecography 2006, 29, 129–151. [Google Scholar] [CrossRef]
  30. Phillips, S.J.; Dudík, M. Modeling of Species Distributions with Maxent: New Extensions and a Comprehensive Evaluation. Ecography 2008, 31, 161–175. [Google Scholar] [CrossRef]
  31. Akrim, F.; Kellner, K.F.; Mahmood, T.; Waseem, M.; Zangi, I.; Qasim, S.; Aslam, A.; Hashmi, S.A.; Shoukat, H.B.; Raqeeb, M.; et al. Habitat Suitability of Common Leopard in Northern Pakistan. Ecosphere 2025, 16, e70218. [Google Scholar] [CrossRef]
  32. Baral, K.; Adhikari, B.; Bhandari, S.; Kunwar, R.M.; Sharma, H.P.; Aryal, A.; Ji, W. Impact of Climate Change on Distribution of Common Leopard (Panthera pardus) and Its Implication on Conservation and Conflict in Nepal. Heliyon 2023, 9, e12807. [Google Scholar] [CrossRef]
  33. Breiman, L. Random Forests. Mach. Learn. 2001, 45, 5–32. [Google Scholar] [CrossRef]
  34. Cutler, D.R.; Edwards, T.C.; Beard, K.H.; Cutler, A.; Hess, K.T.; Gibson, J.; Lawler, J.J. Random Forests for Classification in Ecology. Ecology 2007, 88, 2783–2792. [Google Scholar] [CrossRef]
  35. Evans, J.S.; Murphy, M.A.; Holden, Z.A.; Cushman, S.A. Modeling Species Distribution and Change Using Random Forest. In Predictive Species and Habitat Modeling in Landscape Ecology; Drew, C.A., Wiersma, Y.F., Huettmann, F., Eds.; Springer: New York, NY, USA, 2011; pp. 139–159. ISBN 978-1-4419-7389-4. [Google Scholar]
  36. Swanepoel, L.H.; Lindsey, P.; Somers, M.J.; Van Hoven, W.; Dalerum, F. Extent and Fragmentation of Suitable Leopard Habitat in South Africa. Anim. Conserv. 2013, 16, 41–50. [Google Scholar] [CrossRef]
  37. Maharjan, B.; Shahnawaz, D.; Thapa, T.B.; Man Shrestha, P. Geo-Spatial Analysis of Habitat Suitability for Common Leopard (Panthera pardus linnaeus, 1758) in Shivapuri Nagarjun National Park, Nepal. Environ. Ecol. Res. 2017, 5, 117–128. [Google Scholar] [CrossRef]
  38. Balme, G.A.; Slotow, R.; Hunter, L.T.B. Edge Effects and the Impact of Non-protected Areas in Carnivore Conservation: Leopards in the Phinda–Mkhuze Complex, South Africa. Anim. Conserv. 2010, 13, 315–323. [Google Scholar] [CrossRef]
  39. Jacobson, A.P.; Gerngross, P.; Lemeris, J.R., Jr.; Schoonover, R.F.; Anco, C.; Breitenmoser-Würsten, C.; Durant, S.M.; Farhadinia, M.S.; Henschel, P.; Kamler, J.F.; et al. Leopard (Panthera pardus) Status, Distribution, and the Research Efforts across Its Range. PeerJ 2016, 4, e1974. [Google Scholar] [CrossRef]
  40. Marker, L.L.; Dickman, A.J. Factors Affecting Leopard (Panthera pardus) Spatial Ecology, with Particular Reference to Namibian Farmlands. S. Afr. J. Wildl. Res. 24-Mon. Delayed Open Access 2005, 35, 105–115. [Google Scholar]
  41. Ishtiaq, M.; Sardar, T.; Hussain, I.; Maqbool, M.; Mazhar, M.W.; Parveen, A.; Ajaib, M.; Bhatti, K.H.; Hussain, T.; Gul, A.; et al. Traditional Ethnobotanical Knowledge of Important Local Plants in Sudhnoti, Azad Kashmir, Pakistan. Sci. Rep. 2024, 14, 22165. [Google Scholar] [CrossRef] [PubMed]
  42. Iqbal, M.F.; Khan, I.A. Spatiotemporal Land Use Land Cover Change Analysis and Erosion Risk Mapping of Azad Jammu and Kashmir, Pakistan. Egypt. J. Remote Sens. Space Sci. 2014, 17, 209–229. [Google Scholar] [CrossRef]
  43. Shaheen, H.; Aziz, S.; Nasar, S.; Waheed, M.; Manzoor, M.; Siddiqui, M.H.; Alamri, S.; Haq, S.M.; Bussmann, R.W. Distribution Patterns of Alpine Flora for Long-Term Monitoring of Global Change along a Wide Elevational Gradient in the Western Himalayas. Glob. Ecol. Conserv. 2023, 48, e02702. [Google Scholar] [CrossRef]
  44. Azad Jammu and Kashmir at a Glance; Planning & Development Department of AJK Government: Islamabad, Pakistan, 2017.
  45. Abdullah, A.; Abbasi, M.S.; Ali, A.; Saeed, M.W.; Sayed, M.; Qazi, A.G. Residential Solid Waste Generation and Classification Study of Ten Headquarter Cities of Azad Jammu & Kashmir, Pakistan. J. Mater. Cycles Waste Manag. 2021, 23, 2065–2075. [Google Scholar] [CrossRef]
  46. Hassan, I.; Javed, M.A.; Asif, M.; Luqman, M.; Rashid, S.; Ahmad, A.; Akhtar, S.; Hussain, B. Weighted Overlay Based Land Suitability Analysis of Agriculture Land in Azad Jammu and Kashmir Using Gis and Ahp. Pak. J. Agric. Sci. 2020, 57, 1509–1519. [Google Scholar]
  47. Khan, Z.M. Protected Areas of Pakistan: Wildlife of Some Selected National Parks: A review. Can. J. Pure Appl. Sci. 2023, 17, 5621–5636. [Google Scholar]
  48. Wilson, G.J.; Delahay, R.J. A Review of Methods to Estimate the Abundance of Terrestrial Carnivores Using Field Signs and Observation. Wildl. Res. 2001, 28, 151. [Google Scholar] [CrossRef]
  49. Arandjelovic, M.; Head, J.; Rabanal, L.I.; Schubert, G.; Mettke, E.; Boesch, C.; Robbins, M.M.; Vigilant, L. Non-Invasive Genetic Monitoring of Wild Central Chimpanzees. PLoS ONE 2011, 6, e14761. [Google Scholar] [CrossRef] [PubMed]
  50. Danielsen, F.; Burgess, N.D.; Balmford, A. Monitoring Matters: Examining the Potential of Locally-Based Approaches. Biodivers. Conserv. 2005, 14, 2507–2542. [Google Scholar] [CrossRef]
  51. Karanth, K.K.; Nichols, J.D.; Karanth, K.U.; Hines, J.E.; Christensen, N.L. The Shrinking Ark: Patterns of Large Mammal Extinctions in India. Proc. R. Soc. B 2010, 277, 1971–1979. [Google Scholar] [CrossRef]
  52. Baskaran, N.; Boominathan, D. Road Kill of Animals by Highway Traffic in the Tropical Forests of Mudumalai Tiger Reserve, Southern India. J. Threat. Taxa 2010, 2, 753–759. [Google Scholar] [CrossRef]
  53. Phillips, S.J.; Anderson, R.P.; Schapire, R.E. Maximum Entropy Modeling of Species Geographic Distributions. Ecol. Model. 2006, 190, 231–259. [Google Scholar] [CrossRef]
  54. Bujang, M.A.; Baharum, N. A Simplified Guide to Determination of Sample Size Requirements for Estimating the Value of Intraclass Correlation Coefficient: A Review. Arch. Orofac. Sci. 2017, 12, 1–11. [Google Scholar]
  55. Zhang, X.; Huang, W.; Ye, H.; Lu, L. Study on the Identification of Habitat Suitability Areas for the Dominant Locust Species Dasyhippus Barbipes in Inner Mongolia. Remote Sens. 2023, 15, 1718. [Google Scholar] [CrossRef]
  56. Ahmed, N.; Firoze, A.; Rahman, R.M. Machine Learning for Predicting Landslide Risk of Rohingya Refugee Camp Infrastructure. J. Inf. Telecommun. 2020, 4, 175–198. [Google Scholar] [CrossRef]
  57. As’ary, M.; Setiawan, Y.; Rinaldi, D. Analysis of Changes in Habitat Suitability of the Javan Leopard (Panthera pardus melas, Cuvier 1809) on Java Island, 2000–2020. Diversity 2023, 15, 529. [Google Scholar] [CrossRef]
  58. Kabir, M.; Hameed, S.; Ali, H.; Bosso, L.; Din, J.U.; Bischof, R.; Redpath, S.; Nawaz, M.A. Habitat Suitability and Movement Corridors of Grey Wolf (Canis lupus) in Northern Pakistan. PLoS ONE 2017, 12, e0187027. [Google Scholar] [CrossRef]
  59. Kittle, A.M.; Watson, A.C.; Kumara, P.H.S.C.; Sandanayake, S.D.K.C.; Sanjeewani, H.K.N.; Fernando, T.S.P. Notes on the Diet and Habitat Selection of the Sri Lankan Leopard Panthera Pardus Kotiya (Mammalia: Felidae) in the Central Highlands of Sri Lanka. J. Threat. Taxa 2014, 6, 6214–6221. [Google Scholar] [CrossRef]
  60. Odden, M.; Athreya, V.; Rattan, S.; Linnell, J.D.C. Adaptable Neighbours: Movement Patterns of GPS-Collared Leopards in Human Dominated Landscapes in India. PLoS ONE 2014, 9, e112044. [Google Scholar] [CrossRef] [PubMed]
  61. Zahoor, B.; Songer, M.; Liu, X.; Huang, Q.; Dai, Y. Identifying Stable and Overlapping Habitats for a Predator (Common Leopard) and Prey Species (Himalayan Grey Goral & Himalayan Grey Langur) in Northern Pakistan. Glob. Ecol. Conserv. 2023, 43, e02418. [Google Scholar] [CrossRef]
  62. Yang, Y.; Gao, W.; Han, Y.; Zhou, T. Predicting the Impact of Climate Change on the Distribution of North China Leopards (Panthera pardus japonensis) in Gansu Province Using MaxEnt Modeling. Biology 2025, 14, 126. [Google Scholar] [CrossRef]
  63. Ngoprasert, D.; Lynam, A.J.; Gale, G.A. Human Disturbance Affects Habitat Use and Behaviour of Asiatic Leopard Panthera Pardus in Kaeng Krachan National Park, Thailand. Oryx 2007, 41, 343–351. [Google Scholar] [CrossRef]
  64. Battin, J. When Good Animals Love Bad Habitats: Ecological Traps and the Conservation of Animal Populations. Conserv. Biol. 2004, 18, 1482–1491. [Google Scholar] [CrossRef]
  65. Karki, J.B.; Jnawali, S.R.; Gurung, G.; Pandey, M.B.; Upadhyay, G.P. Tiger Conservation Initiatives in Nepal. Initiat. 1970, 4, 56–68. [Google Scholar] [CrossRef]
  66. Hilty, J.; Worboys, G.L.; Keeley, A.; Woodley, S.; Lausche, B.J.; Locke, H.; Carr, M.; Pulsford, I.; Pittock, J.; White, J.W.; et al. Guidelines for Conserving Connectivity Through Ecological Networks and Corridors; Groves, C., Ed.; IUCN, International Union for Conservation of Nature: Gland, Switzerland, 2020; ISBN 978-2-8317-2052-4. [Google Scholar]
  67. Cong, W.; Li, J.; Zhang, Y.; Huang, T.; Gao, S.; Yu, J.; Zhang, Y.; Li, D. Snow Leopard Habitat Vulnerability Assessment under Climate Change and Connectivity Corridor in Xinjiang Uygur Autonomous Region, China. Sci. Rep. 2025, 15, 14583. [Google Scholar] [CrossRef]
  68. Dickman, A.; Marchini, S.; Manfredo, M. The Human Dimension in Addressing Conflict with Large Carnivores. In Key Topics in Conservation Biology 2; Macdonald, D.W., Willis, K.J., Eds.; Wiley: Hoboken, NJ, USA, 2013; pp. 110–126. ISBN 978-0-470-65876-5. [Google Scholar]
  69. Goodrich, J.M.; Seryodkin, I.; Miquelle, D.G.; Bereznuk, S.L. Conflicts between Amur (Siberian) Tigers and Humans in the Russian Far East. Biol. Conserv. 2011, 144, 584–592. [Google Scholar] [CrossRef]
  70. Bauer, H.; De Iongh, H.; Sogbohossou, E. Assessment and Mitigation of Human-Lion Conflict in West and Central Africa. Mammalia 2010, 74, 363–367. [Google Scholar] [CrossRef]
  71. Chapron, G.; Kaczensky, P.; Linnell, J.D.C.; Von Arx, M.; Huber, D.; Andrén, H.; López-Bao, J.V.; Adamec, M.; Álvares, F.; Anders, O.; et al. Recovery of Large Carnivores in Europe’s Modern Human-Dominated Landscapes. Science 2014, 346, 1517–1519. [Google Scholar] [CrossRef]
  72. Treves, A.; Wallace, R.B.; White, S. Participatory Planning of Interventions to Mitigate Human–Wildlife Conflicts. Conserv. Biol. 2009, 23, 1577–1587. [Google Scholar] [CrossRef]
  73. Ibisch, P.L.; Hoffmann, M.T.; Kreft, S.; Pe’er, G.; Kati, V.; Biber-Freudenberger, L.; DellaSala, D.A.; Vale, M.M.; Hobson, P.R.; Selva, N. A Global Map of Roadless Areas and Their Conservation Status. Science 2016, 354, 1423–1427. [Google Scholar] [CrossRef]
Figure 1. (A) Location of the study area; (B) Elevation of the study area; (C) Leopard points in the study area.
Environments 12 00203 g001
Figure 2. Analysis process. The first blue box integrates field survey data with environmental variables, serving as the foundational input for our analysis. The second box encompasses the modeling procedure, including accuracy assessment and final output generation. Blue arrows between components visually depict the sequential workflow and analytical progression.
Environments 12 00203 g002
Figure 3. (A) Habitat suitability of the common leopard (Panthera pardus) by MaxEnt; (B) Habitat suitability of the common leopard (Panthera pardus) by RF approach.
Environments 12 00203 g003
Figure 4. Performance Comparison of MaxEnt and RF Approaches.
Environments 12 00203 g004
Figure 5. Correlation Matrix of Environmental Factors Affecting Leopard Habitat Suitability in the AJ and K. A value of −1 indicates a perfect negative correlation, 1 indicates a perfect positive correlation, and 0 indicates no correlation.
Environments 12 00203 g005
Figure 6. Contribution of Environmental factors across MaxEnt and RF Approaches.
Environments 12 00203 g006
Table 1. Environmental factors. Altogether, there are 28 factors.
Variable and DescriptionAbbreviationUnitData Source
Mean Annual TemperatureBio1°CWorldclim
Mean Diurnal Range (i.e., mean of monthly (max. temp.–min. temp.))Bio2°CWorldclim
Mean Annual Temperature Range (i.e., bio2/bio7×100)Bio3°CWorldclim
Temperature SeasonalityBio4°CWorldclim
Max. Temperature of Warmest MonthBio5°CWorldclim
Min Temperature of Coldest MonthBio6°CWorldclim
Annual Temperature Range (i.e., bio5–bio6)Bio7°CWorldclim
Mean Temperature of Wettest QuarterBio8°CWorldclim
Mean Temperature of Driest QuarterBio9°CWorldclim
Mean Temperature of Warmest QuarterBio10°CWorldclim
Mean Temperature of Coldest QuarterBio11°CWorldclim
Annual PrecipitationBio12mmWorldclim
Precipitation Level in Wettest MonthBio13mmWorldclim
Precipitation Level in Driest MonthBio14mmWorldclim
Precipitation Seasonality (i.e., coefficient of variation)Bio15%Worldclim
Precipitation Level in Wettest QuarterBio16mmWorldclim
Precipitation Level in Driest QuarterBio17mmWorldclim
Precipitation Level in Warmest QuarterBio18mmWorldclim
Precipitation Level Coldest QuarterBio19mmWorldclim
Specific humiditySHg/kgFLDAS
Fractional Vegetation CoverageFVC%MOD13A2
Land coverLCcategoricalMCD12Q1.061
ElevationElevationmGDEM V2/3
SlopeSlope°Calculation in ArcGIS
AspectAspect°Calculation in ArcGIS
Distance to roadDist_roadKmThe Humanitarian Data Exchange
Population DensityPDkmThe Humanitarian Data Exchange
Distance to the riverDist_ivermHYDROSHEDS
Table 2. Habitat suitability assessment based on land cover (LC).
Environmental VariableCategorySuitability Score
LCMixed forests0.83
LCcropland-natural vegetation mosaics0.71
LCWoody savannas0.67
LCsavannas0.39
Disclaimer/Publisher’s Note: The statements, opinions and data contained in all publications are solely those of the individual author(s) and contributor(s) and not of MDPI and/or the editor(s). MDPI and/or the editor(s) disclaim responsibility for any injury to people or property resulting from any ideas, methods, instructions or products referred to in the content.

